Pipelines vibration analysis and control based on clamps’ locations optimization of multi-pump system
Xin LI, Weiho LI, Jin SHI, Qing LI, Shoping WANG
a School of Mechanical and Materials Engineering, North China University of Technology, Beijing 100144, China
b School of Automation Science and Electric Engineering, Beihang University, Beijing 100191, China
KEYWORDS Clamp;CPSO;Impedance;Multi-pump;Pipeline;TMM;Vibration
Abstract The violent vibration of hydraulic pipelines in aircraft may cause faults or even an accident, especially for the large aircraft with the multi-pump system because of different vibration sources and complex pipelines system. Aiming to the vibration analysis and control of the multipump system,this paper proposed the clamps’locations optimization to minimize the system impedance at vibration frequencies. Firstly, the models of the flexible clamp and other components in multi-pump system were established,based on which,the system impedance was calculated by using Transfer Matrix Method (TMM); Secondly, the objective function is defined as weighted sum of system impedance at frequencies of different vibration sources. Then, the clamps’ locations were altered to change the system impedance. Moreover, The Chaotic Swarm Particle Optimization(CPSO) algorithm was applied to obtain the optimal clamps’ locations and the minimum value of objective function which decreased by 36.4%compared to the value of original clamps’locations;Finally,the experiments from vibration and pressure test with original and optimized clamps’locations verified the effectiveness of the system impedance calculation and clamps’locations optimization method.
1. Introduction
Excessive vibration of hydraulic pipeline is of concern for flight safety, and it can develop into a far severer problem due to the high-pressure fluctuation and pipelines vibration in the hydraulic system.The oil in hydraulic pipelines has characteristics of high pressure and flow fluctuation due to the inconsecutive output from the pumps,so the severe vibration in pipeline system may cause fault or even flight accident when the frequencies of fluid fluctuation match the natural frequencies of the fluid-filled pipelines.In the large aircraft,the oil from multi-pump converges to drive the loads,which brings extra danger because of the different vibration sources and complex pipelines system.Gao et al.presented a review of vibration analysis and control technologies of hydraulic pipeline system in aircraft, which analyzed the vibration reasons and compared the passive and active vibration control technologies. The key problem of excessive vibration is Fluid -Structure Interaction (FSI) in hydraulic pipelines system, so our paper tried to analyze the FSI of hydraulic pipelines system,and prompted the control method to reduce the vibration of the multi-pump parallel hydraulic system in large aircraft.
According to the modeling and calculating FSI,Wilkinsonproposed a 14-Equation model which added the influence of the twisting and bending stress waves in fluid-filled pipe. Tijsseling and Vaugrantesummarized the development of FSI modeling and analyzed the characteristic of L-piece and Tpiece pipes. Jiao et al.took in account of viscous friction in modeling, and obtained more accurate results. Zhang et al.presented that a model suitable for a wide Reynolds number range is promoted by comparing and analyzing various kinds of friction coupling models based on the 14-Equation model of FSI vibration of aero hydraulic pipe, and the error of the analysis results of the FSI vibration frequency is smaller than 5% compared with the experimental results. Qu et al.proposed a bidirectional fluid-solid coupling analysis method to investigate dynamic characteristics of the pipeline under different support stiffness conditions and the results obtained a significant access to the structural design of the pipeline under basic vibration.
The Method of Characteristic (MOC),Finite Element Method (FEM)and Transfer Matrix Method (TMM)are three approaches to solve the Partial Differential Equations(PDE) of FSI. MOC can give the accurate results for the simple pipes in the time domain; FEM can analyze the complex pipelines in 3D space; TMM has the advantage of calculating the chain structure of pipeline systems in the frequency domain. Multi-pump parallel system in large aircraft has a long-distance pipeline and different vibration frequencies,and the models of system components should be combined as a whole, so TMM is suitable to solve the system model.In our paper, the 14-Equation model of FSI was adopted to illustrate the fluid-filled pipe vibration of multi-pump system,and by using TMM, the system impedance that is the ratio of the fluid pressure to flow rate in frequency was obtained,which is the basis of vibration analysis.
As regard to the pipeline vibration control, the active control and passive control are two common methods.The principle of active control method is that the new fluctuating fluid is produced to counteract the original fluid pulsation by detecting the waveform of the fluid fluctuation in the pipe. Many of scholarsobtained effective vibration attenuation by using the active control method. However, it is difficult to implement in aircraft due to its extra detecting equipment and limited inner space of aircraft. In contrast, the theory of passive control method is by means of changing the properties of pipeline system itself, so there is no additional power in the system. To be specific, the layout of pipelines and their fixed form are altered to make the natural frequencies away from the those of the vibration sources. Kwong and Edgeused the genetic algorithm to optimize the clamps’ locations on the pipe, and the results showed its effectiveness for damping the vibration. However, the model of clamp was considered as the rigid support and ignored its characteristic absorbing the pipe vibration.Ouyang et al.proposed that the resonance frequency of the pipe was influenced with the friction, curvature and the length between two supports by using modal analysis,but the optimization of the pipeline system was neglected.Li et al.presented an optimum layout of clamps’locations in aircraft to reduce the vibration of pipelines which were only in part of the one-pump system. Wu et al.analyzed the wave propagation of fluid-filled L-Shape pipe in plane, and presented that periodic support was a suitable method to reduce the level of pipe vibration in a given frequency window.According to the multi-pump system, active control method is not suitable due to the different vibration sources,moreover,the clamps’ model was considered as a rigid point, which lead to the inaccuracy vibration mode in traditional research. In our paper, the clamps on the pipe were modeled as cantilever beams and their locations were optimized to change the system impedance away from the vibration frequencies.
According to the optimization algorithm, Particle Swarm Optimization(PSO)algorithmhas been used widely in many aspects. However, the original method might trap into the local optimum. Subsequently, the methods of inertia weight algorithm,No-hope/Re-hope methodand spatial neighborhood methodhave been developed. Figueiredoproposed a practical and efficient Many-Objective PSO algorithm for solving many-objective problems, which used a set of reference points dynamically determined according to the search process, allowing the algorithm to converge to the Pareto front. Gerist and Maherishowed that the search space is reduced by elimination of some low damage variables using micro search (MS) operator embedded in the PSO algorithm.In this paper,the Chaotic Swarm Particle Optimization(CPSO) was tried to find the best locations of the clamps.
Aiming to the multi-pump system and its vibration problem due to FSI, the whole model of the system should be established, and the system impedance can reflect its characteristics in frequency domain,which is affected by the layout of pipelines and clamps’ locations. If the frequencies of the impedance peaks overlap the frequencies of vibration sources, a violent fluid fluctuation would happen. In this paper, our objective is to calculate the system impedance in frequency domain and minimize the amplitude of system impedance at the frequencies of vibration sources by using clamps’ locations optimization.Section 2 describes the models of the components in the multi-pump system. The global transfer matrix of the hydraulic system can be acquired based on the models. Section 3 illustrates how the system impedance is calculated by the TMM. Section 4 shows the objective function which is based on the frequencies of vibration sources and the optimization process of clamps’locations by using CPSO.Section 5 shows experiments of system vibration and pressure fluctuation to verify the effectiveness of the optimization of clamps’locations.
2. Modeling of multi-pump parallel system
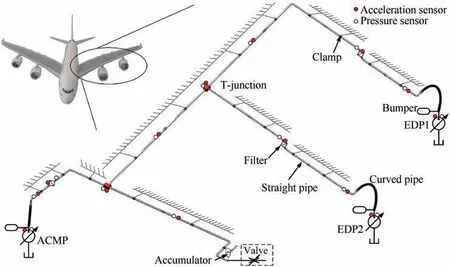
Fig. 1 A configuration of hydraulic pipeline system in aircraft.
Fig. 1 shows a configuration of multi-pump parallel system,which includes pumps, bumpers, straight pipes, miter bends,curved pipes, filters, clamps, accumulators, T-junctions,valve, acceleration sensors, pressure sensors and so on.Two of the pumps driven by the aircraft engines are named as EDP (Engine Driven pump) 1and EDP2. The other pump is driven by the AC motor, and named as ACMP (AC motor pump).
As we can see from Fig. 1, three pumps work at the same time in some conditions, thus named as multi-pump system.The hydraulic oil from three pumps converge to two Tjunctions and flow to the loads. The curved pipes are placed on the engines,and the straight pipes are fixed on the airframe by the clamps.The pumps are vibration sources,and the vibration would transfer to the whole pipelines system.The acceleration sensors can detect the vibration of pipe,and the pressure sensors can collect the oil pressure fluctuation. What’s more,the pipe vibration and pressure fluctuation influence each other. If the vibration occurred in the fluid-filled pipes, the whole aircraft would be affected. Applying to the multipump system of large aircraft,the system impedance represents the whole system character of FSI in frequency domain.Therefore, the models of the system components should be established and make up the models of the whole system by using TMM, subsequently, the system impedance can be calculated in frequency domain.The models of straight pipe,bumper,filter,miter bend,curved pipe and clamp should firstly be established as follows.
2.1. Model of straight pipe
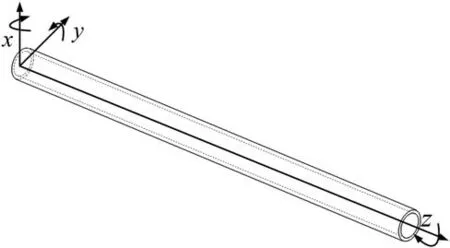
Fig. 2 Straight pipe and its coordinate system.

Fig. 2 shows a straight pipe and the associated coordinate system.
Fluid-structure interaction(FSI)is the main factor in modeling of pipe, and it includes Poisson coupling, junction coupling and friction coupling. We consider the pipe as a beam bearing axial force, bending force, shear force and twisting force. The 14-Equactionsof FSI are:
PDEs of axial force and motion:

where q is the flow velocity, P is the pressure of fluid, vis the vibration velocity of pipe, F is the internal force of pipe, ζ means the function of friction and kinematic viscosity of fluid,x(y )z mean the coordinate directions,ω is the angular velocity of pipe,M is the moment of pipe,Ameans the sectional area of pipe, Ameans the sectional area of fluid, Imeans the moment of inertia cross-section of pipe, Imeans the moment of inertia cross-section of fluid, J means the moment of polar inertia cross-section of pipe, R means the external radius of pipe, D means the inner diameter of pipe, e means the wall thickness of pipe, ε means the passion ratio of pipe, E means the elastic modulus of pipe, G means the shear modulus of pipe, K means the bulk modulus of fluid, ρmeans the fluid density, and ρmeans the pipe density.
Eq. (5) is a simplified matrix form by using the Laplace transformation of Eqs. (1)-(4).
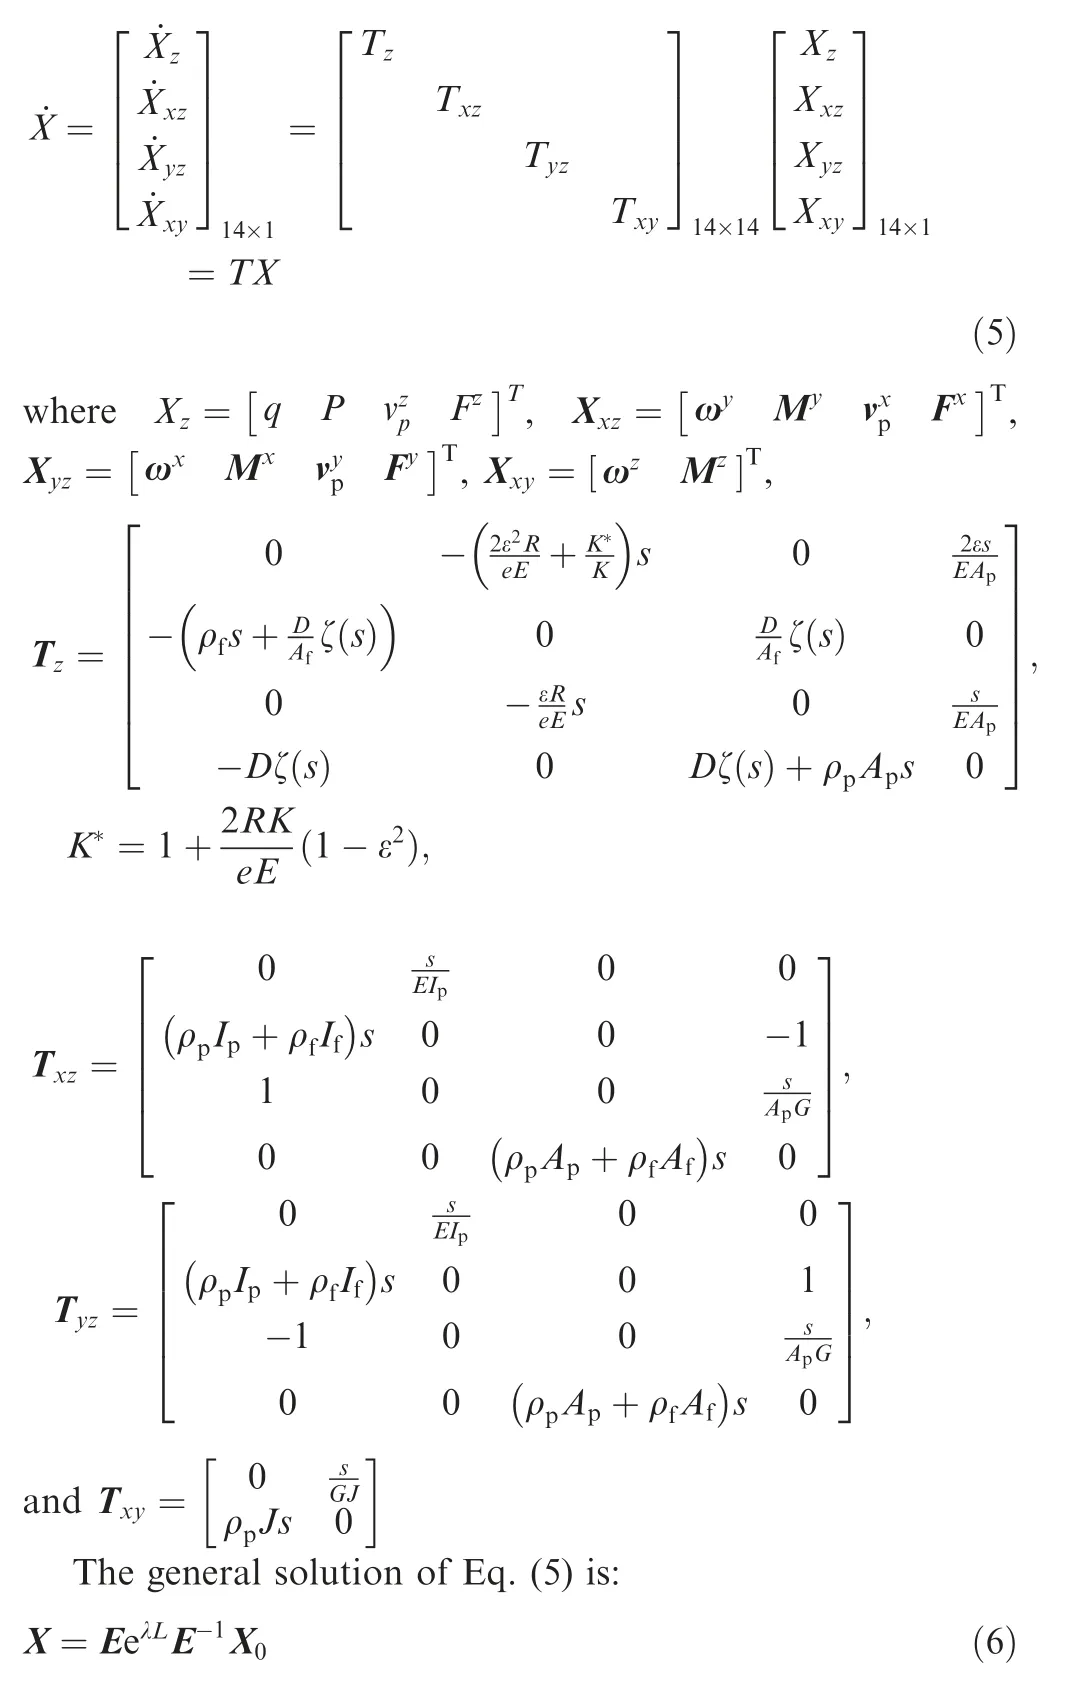
where Xis the initial condition for Eq. (5), λ means the eigenvalue of T, L is the length of pipe, and E is the matrix of eigenvector of λ.
For the system impedance,the impedance at the location of the valve is usually set as the initial value, which can illustrate the variation of the load, so the global transfer matrix can be calculated from the throttle valve to the outlet of pumps. Eq.(7) is obtained from the inverse transformation of Eq. (6),where Gis the transfer matrix of a straight pipe.

2.2. Model of bumper
Bumper is installed at the outlet of the pump, as shown in Fig. 3, in order to absorb flow fluctuation from the pump due to its capacitance effect.
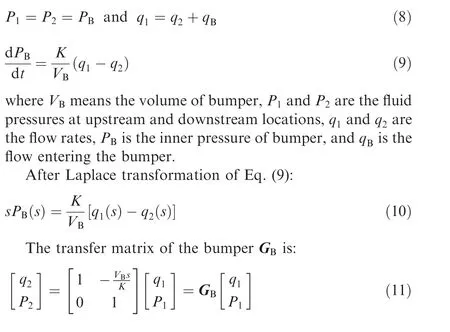
The bumper and pipes combine in parallel, so the model can be modeled as:
2.3. Model of filter
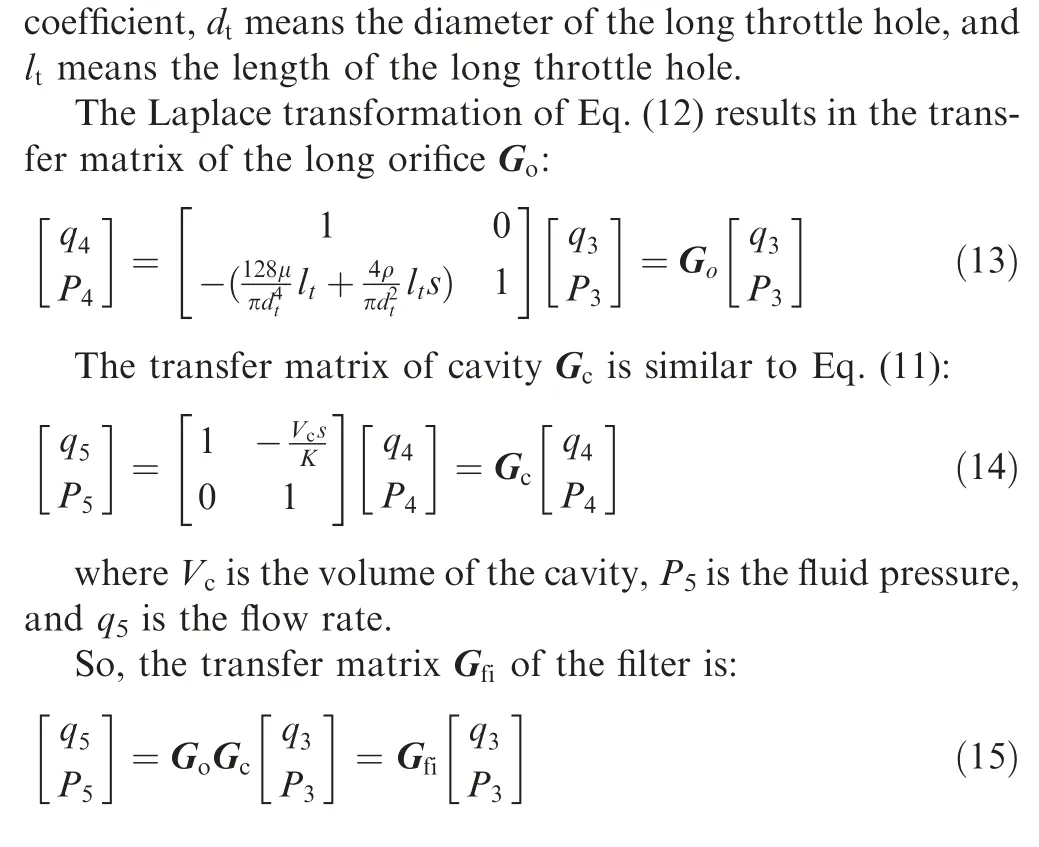
The filter separates the impurities from oil,and it is considered as a connection of a long orifice and a cavity,as shown in Fig. 4.
The long orifice has characteristics of inductance and impedance, so the model is:

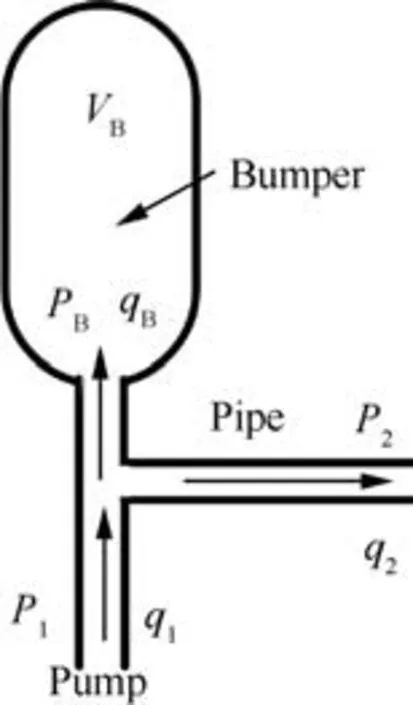
Fig. 3 Sketch of bumper.

Fig. 4 Sketch of filter.
2.4. Model of miter bend
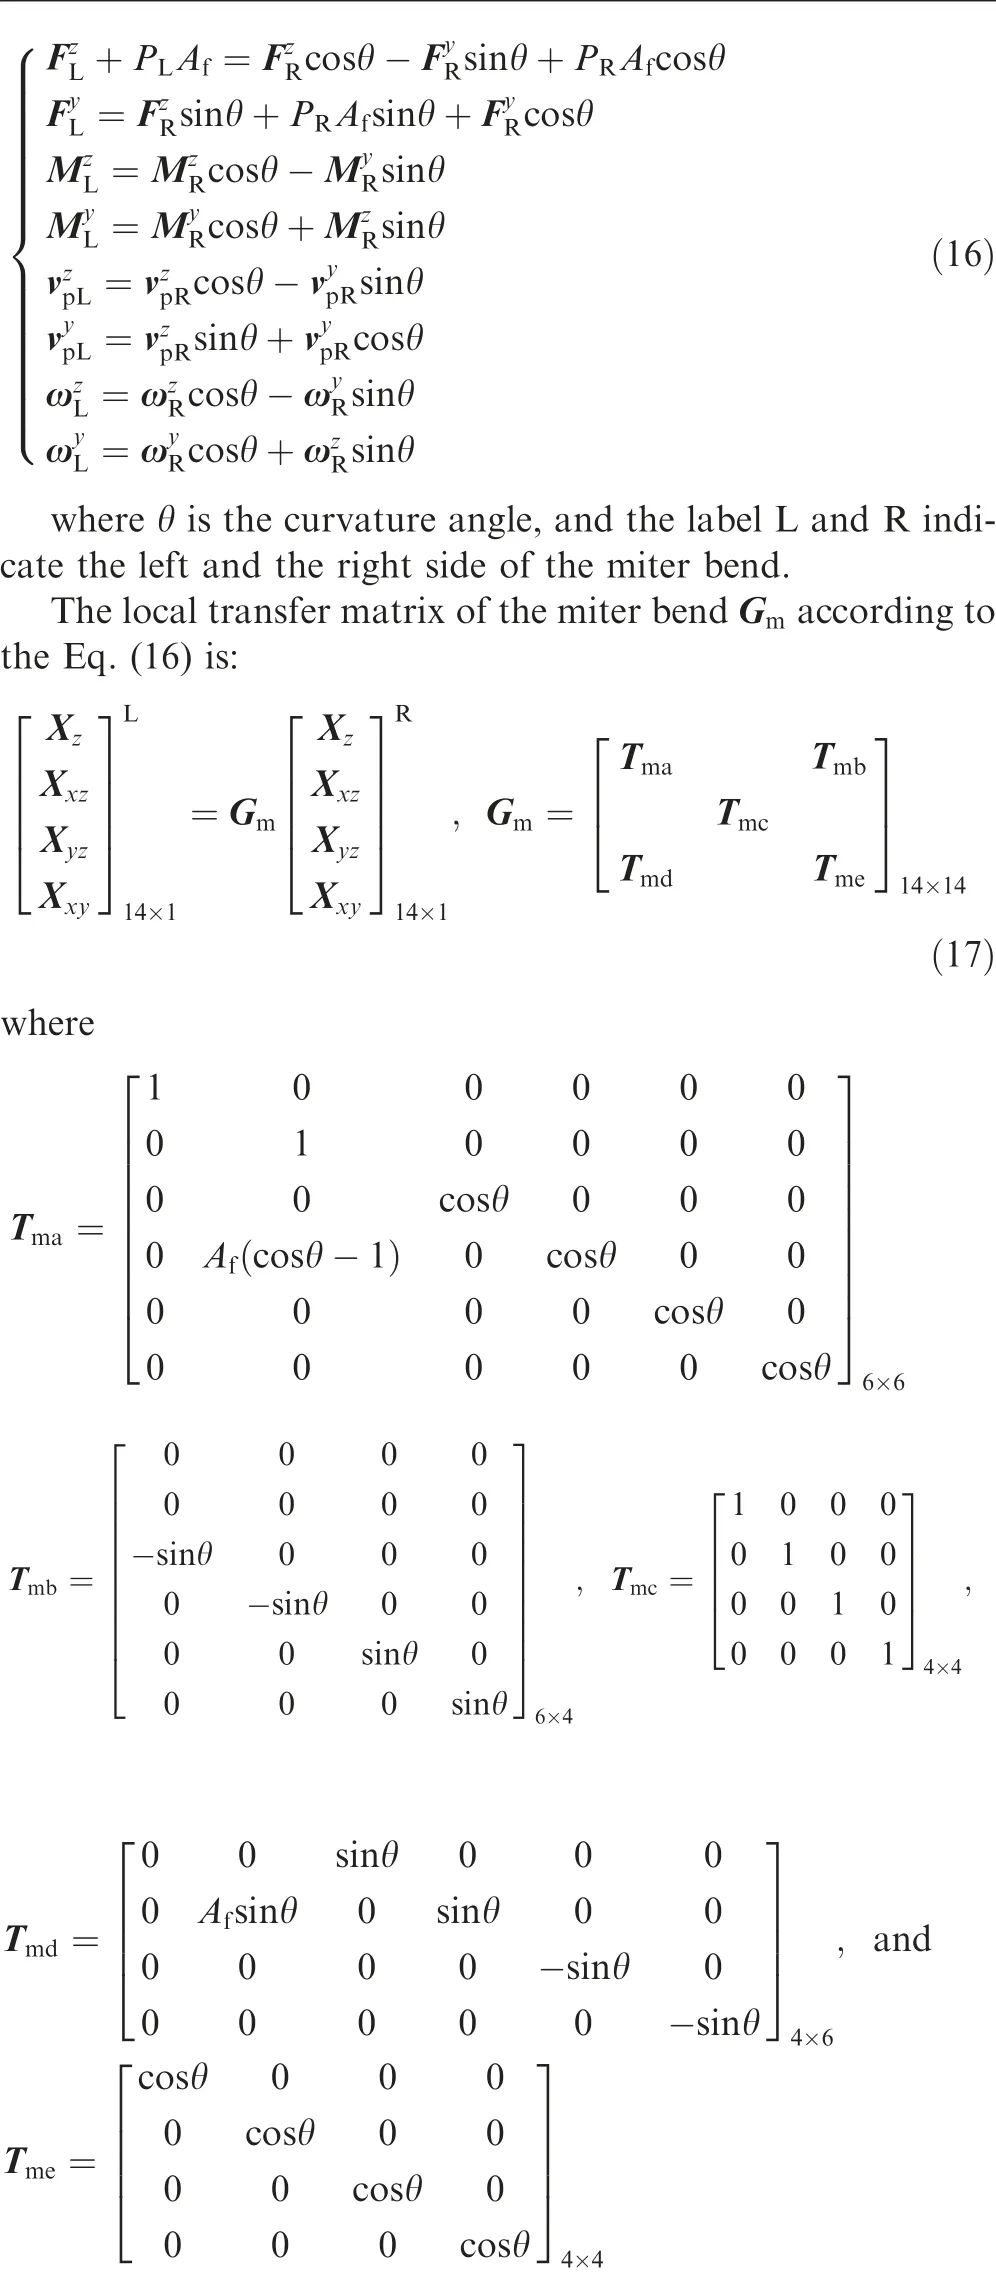
The miter bends exist due to the alteration of the pipe route.The characteristic of miter bend is that the ratio of bending radius to the diameter of pipe is in the range of 1-2, in contrast,if the ratio is greater than 2,we call it curved pipe,which is shown in Section 2.5.The local transfer matrix provides the relation between the two sides of the miter bend. Fig.5 shows the miter bend and its coordinate system, based on which, the balance equations are obtained:
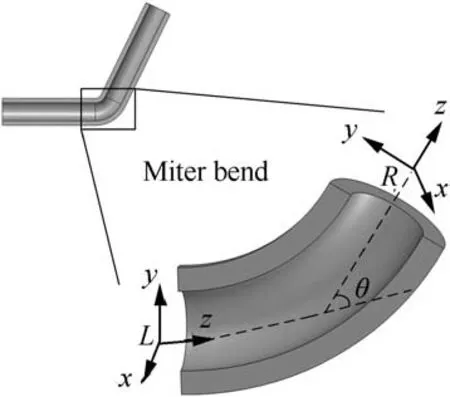
Fig. 5 Sketch of miter bend and its coordinate axis.
2.5. Model of curved pipe
The curved pipe out of EDP has a long distance and flexible character,which is placed on the engine.There exist two same curved pipes out of EDP1 and EDP2. The curved pipe can be simplified as a series combination of multiple straight pipes and miter bends due to the its original complex FSI model.In this paper, the curved pipe is divided into four equal segments which consist of three miter bends and four straight pipes, and the sketch below shows high similarity between the curved pipe and simplified pipe according to Fig. 6.
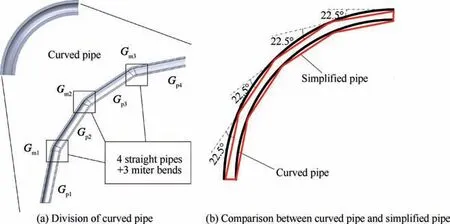
Fig. 6 Sketch of curved pipe.

2.6. Model of clamp
The purpose of clamp is to fix pipe and in doing so it also serves to isolate vibration. Actually, the tight force between clamp and pipe shows a nonlinearity because there exists vibration in fluid-filled pipe and uncertain preload. In this paper, all the clamps have the same size and mode, furthermore, we considered that the clamps were locked on the pipe,and it can be simplified as a massless cantilever beam which affects the vibration of the pipe. Fig. 7 shows configuration and simplified model of the clamp.
Fig. 7(a) illustrates the relation and force between the pipe and clamp, furthermore, the clamp is approximate to a cantilever beam in y- and z-direction, because one side of the clamp is fixed on the frame,and the other side may have a displacement when there exist the axial and radial force between the pipe and clamp,so we named it the flexible clamp.Fig.7(b)shows the transformation of clamp in z-direction.
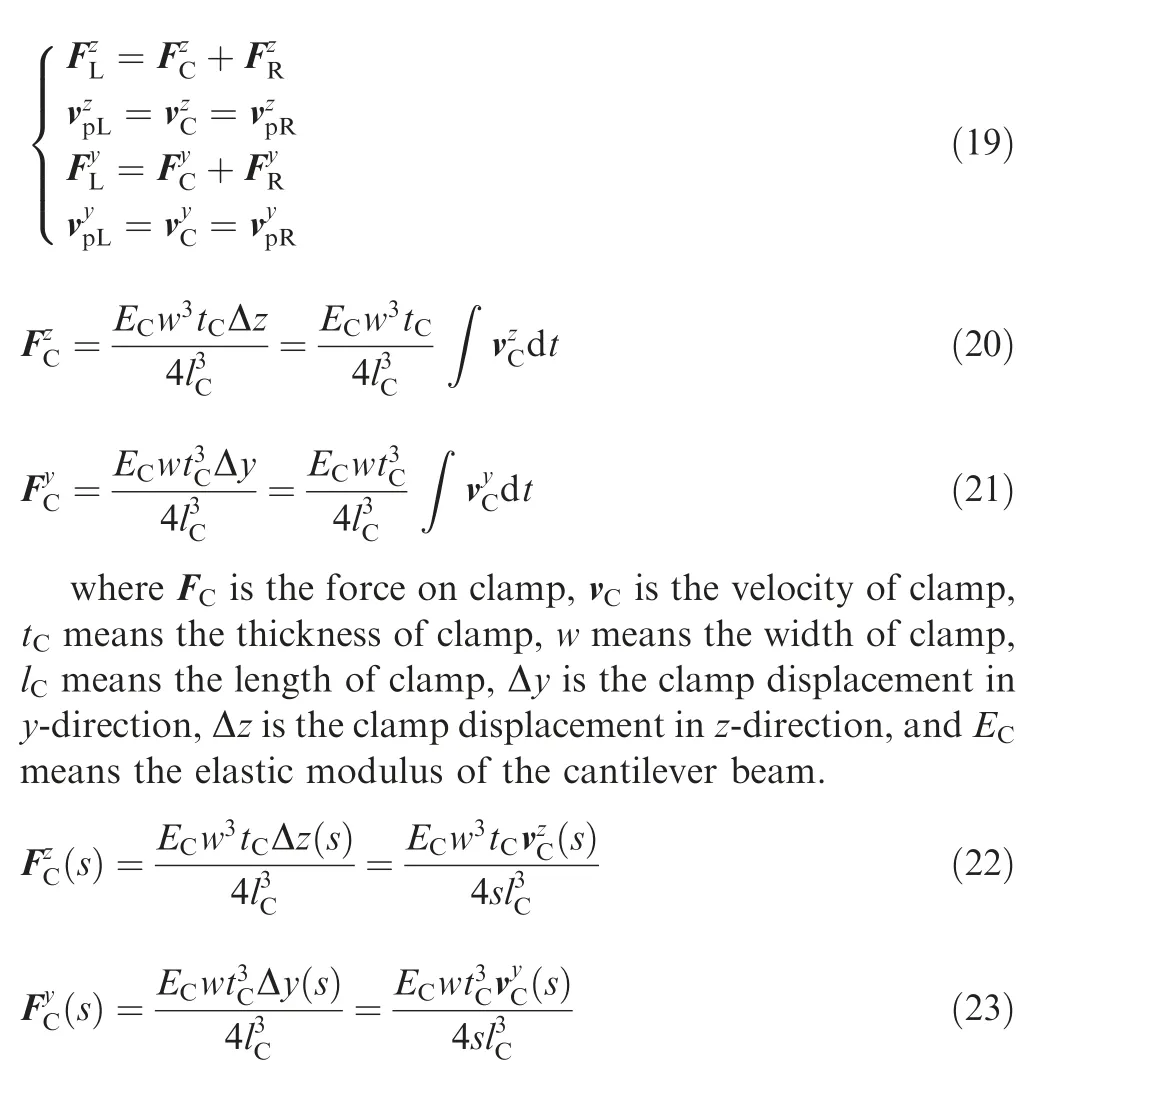
According to Fig. 7, the force and moment equations between pipe and clamp are as follows:
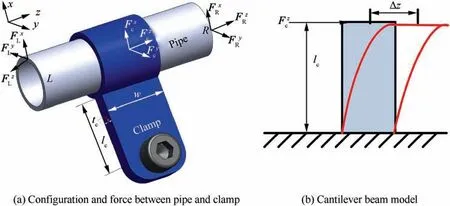
Fig. 7 Configuration and simplified model of clamp.
Eqs.(22)and(23)show the Laplace transformation of Eqs.(20) and. (21), then, the relation of the force and velocity on the clamp in y- and z-direction can be obtained.
The local transfer matrix of the straight pipe which is divided according to the clamp can be derived according to the Eqs. (19)-(23).
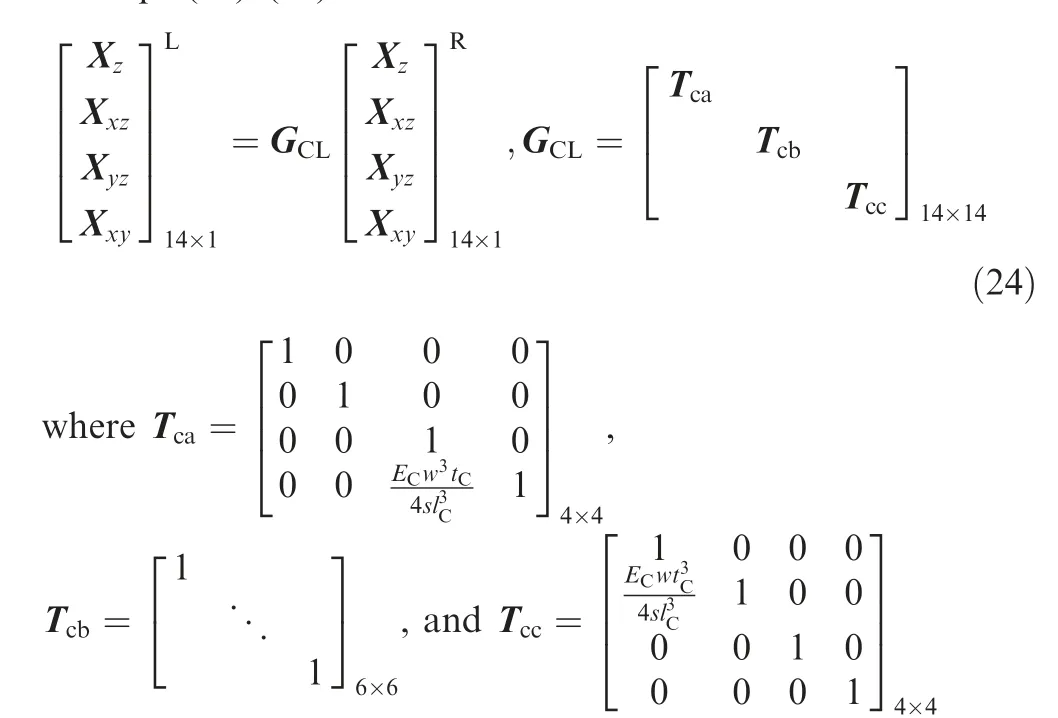
From the above, the models of system components were established and changed into transfer matrix, which were the basis of calculating the system impedance.
3. Calculation of impedance in multi-pump system
3.1. System transfer matrix and impedance
The entire mode of transfer matrices describing the pipelines and the other components in multi-pump system is shown in Fig. 8.
In the work by Kwong and Edge,the clamps were considered as rigid supports, so the transfer matrix of the entire system was separated by clamps. In our research, the clamps are not considered as rigid supports but cantilever beams, so the transfer matrices of clamps are connected to the pipelines. The system is divided into 5 parts according to the two T-junctions because there are three parallel pumps.Additionally, the transfer matrices of bumper and filter show only the parameters variation of fluid. Then, the forces,velocities and moments of the pipes are considered as same values on both sides of the components. Thus, the Eqs. (11)and (15) can be transformed to 14 × 14 matrices, which can multiply with the transfer matrices of pipes.

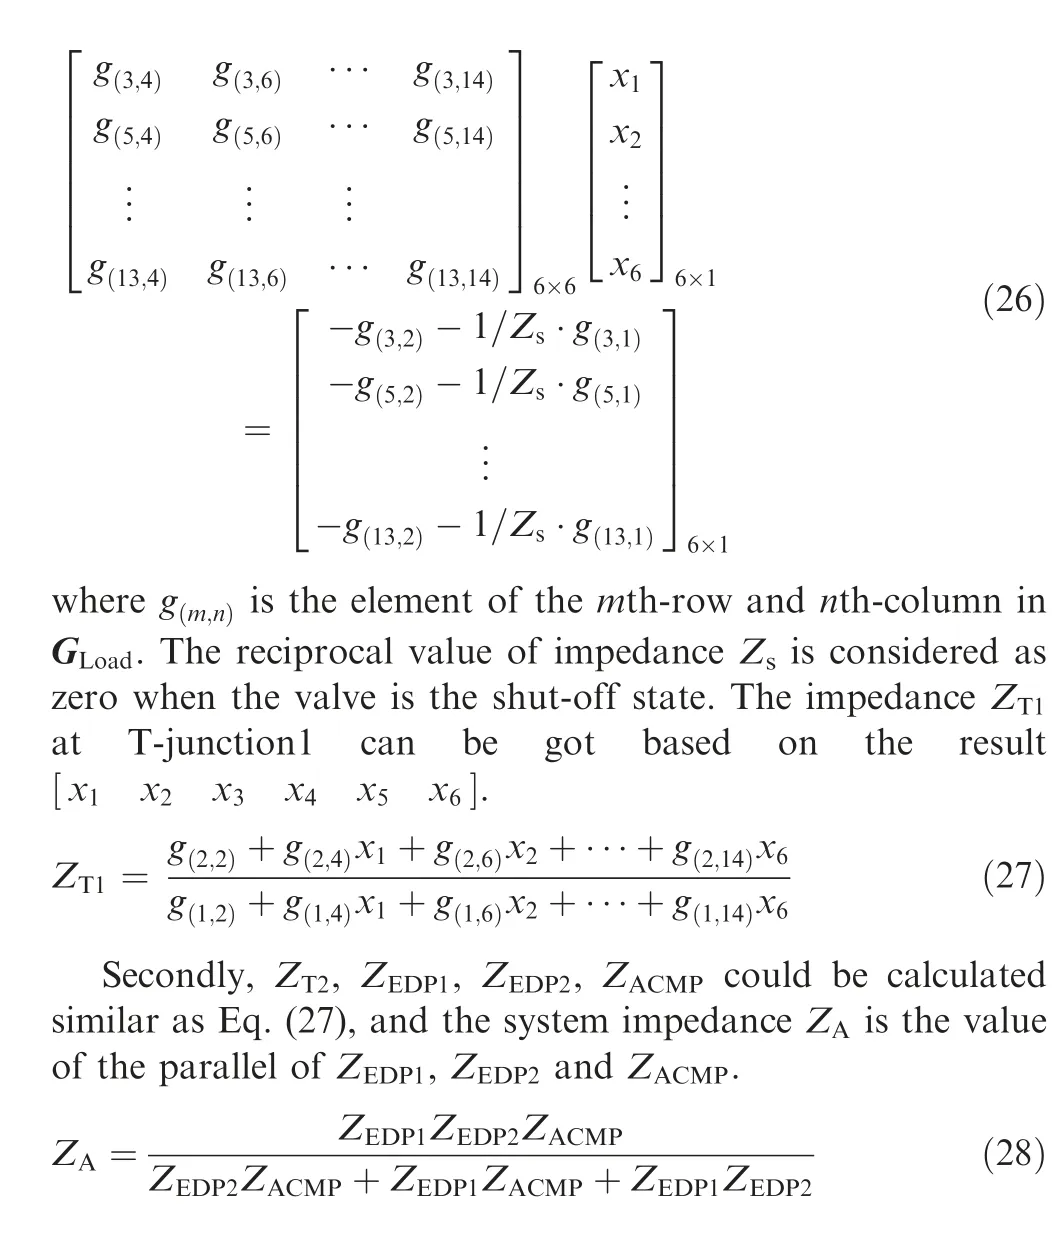
The relationship of the 5 parts is shown as Fig. 9 based on the Eq.(25).Where Zis the impedance value of the load,ZZare the impedance values at the locations of the Tjunction1 and T-junction2, Zis the impedance value at the location of the bumper of EDP1, Zis impedance value at the location of the bumper of EDP2, Zis the impedance value at the location of the bumper of ACMP,and Z, Z, Zare the impedance values at the locations of three pumps.
Firstly, the transfer matrices Gfrom the load to Tjunction1 is calculated as follows. The impedance at the valve is considered as infinity when the valve is close to shut off,which is also our calculation and simulation state. Meantime,the translational velocities [v,v,v] and angular velocities[ω,ω,ω]of pipe at T-junction1 are considered as zero when the T-junction1 was fixed on the frame, then
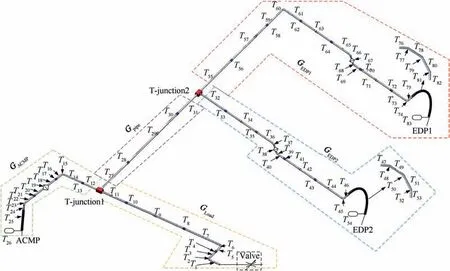
Fig. 8 Transfer matrices of system components.

Fig. 9 System relationship of 5 parts.
3.2. Simulation of system impedance in frequency domain
The original clamps’ locations in the system are shown as Fig. 10, where the clamps’ locations are determined based on the experience.
Table 1 shows the length values of clamps’ locations from Lto L. Table 2 shows the parameters of the pipes and the other components in the system.After substituting parameters from Tables 1 and 2 into the transfer matrix Eq. (25) and calculation, the impedance in frequency domain is shown in Fig. 11. Additionally, the system impedance situation that the clamps were considered as fixed supports (rigid clamps)was also calculated, which is shown as the imaginary lines in Fig. 11.
As can be seen from Fig. 11, the main peaks of system impedance as the flexible clamp are lower than the peaks of rigid clamp.The maximum value of the system impedance with rigid clamp is 2.95×10dB,in contrast,the maximum value of the system impedance with flexible clamp is 2.72×10dB,which reduces by 7.8%. The reason is that flexible clamps can absorb part of vibration of pipelines, which makes pressure fluctuations decrease due to FSI, ultimately reduce the amplitude of impedance.
The inherent frequencies of system with flexible clamp declines more than the inherent frequencies of system with rigid clamp, and the frequency of the maximum impedance value of the system reduces from 386 Hz to 173 Hz.The system impedances at 173 Hz, 564 Hz, 920 Hz and 1189 Hz have the peak values, which means that violent vibration may happen when these frequencies coincide with frequencies of the vibration source.This paper tried to minimize the impedances at the frequencies of vibration source by using the clamps’ locations optimization.
4. Clamps’ locations optimization based on the characteristic impedance and CPSO
4.1. Objective function based on the characteristic impedance
The cruising flight of large aircraft takes up a lot of time in the all-flight cycle, and the vibration frequencies of cruising flight should be focused, so the system impedance of vibration frequencies in cruising flight is named as characteristics impedance. The optimization goal is to minimize the characteristics impedance.The frequencies of vibration sources depend on the rotational speeds of three pumps. The piston pumps in our system have 9 pistons, so the basic frequencies of pumps are shown as Table 3.
In addition, there exist the higher harmonic frequencies of vibration sources, and the experiment results of pressure signals from the outlets of EDP and ACMP in time domain and frequency domain are shown as Fig. 12.
According to Fig. 12, the main amplitude focuses on the former three frequencies. The weighted ratio of former three frequencies of vibration sources can be obtained, based on which, the objective function in frequency domain is obtained as Eq. (29):

4.2. Clamps’ locations optimization based on the CPSO
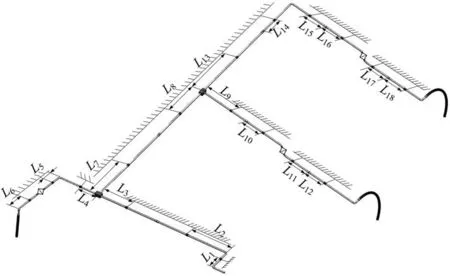
Fig. 10 Clamps’ locations in the system.
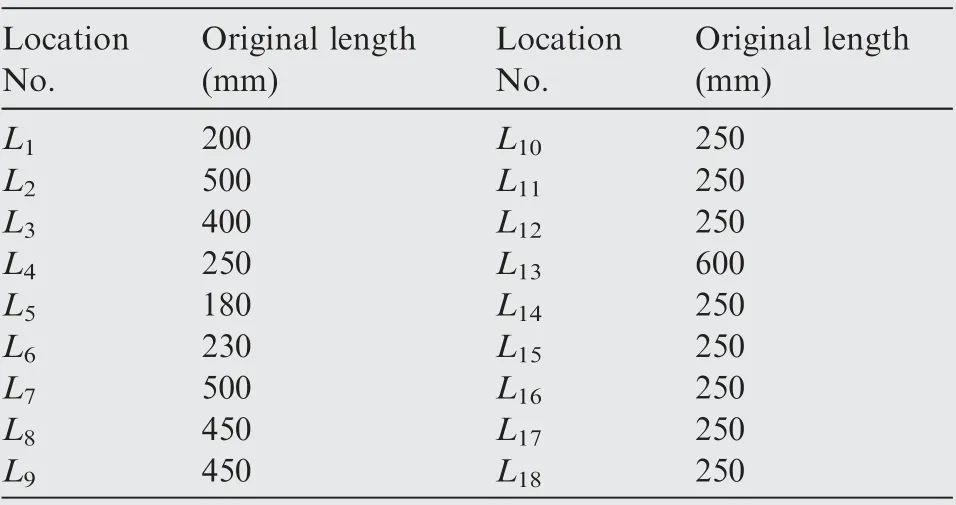
Table 1 Original clamps’ locations.
The minimum value of Zshould be achieved based on Eq.(29). If the length L of each pipe is changed based on the clamps’ locations alteration in Eq. (7), the transfer matrices value of each straight pipe would also be modified,resulting in different system impedances. The minimum value of Zcould be obtained by optimizing clamps’ locations. The relation between clamps’ locations and system impedance is shown as Fig. 13.
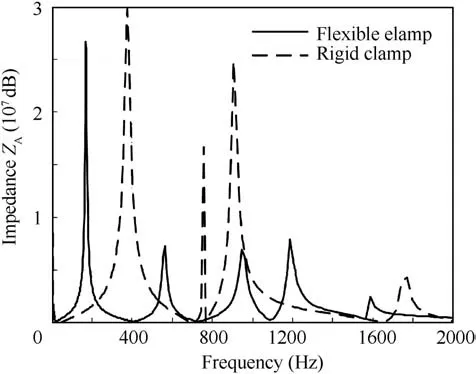
Fig. 11 System impedance in frequency domain based on different clamp modes.

Table 2 Parameters of components in system.

Table 3 Rotational speeds and frequencies of pumps in cruising flight.

To solve the problem of trapping in the local optimums of the traditional PSO,the Chaotic Particle Swarm Optimization(CPSO)was tried to help these inertia particles escape the local optimums.The logistic equation can provide the chaotic sequence.
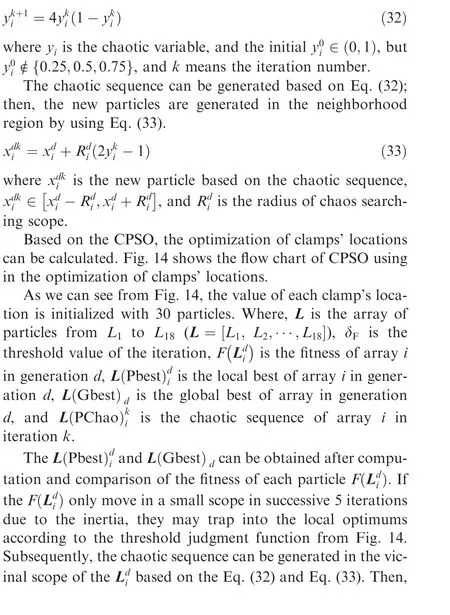
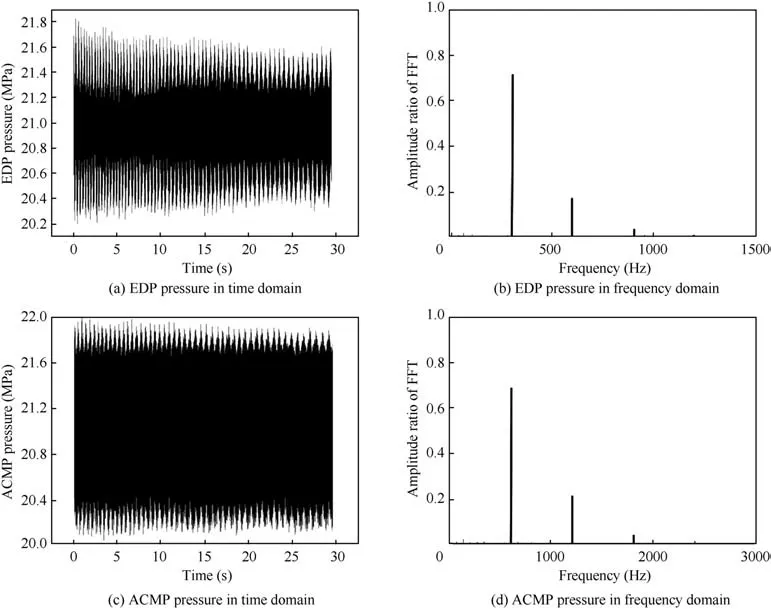
Fig. 12 Pressure signal of pumps outlet.
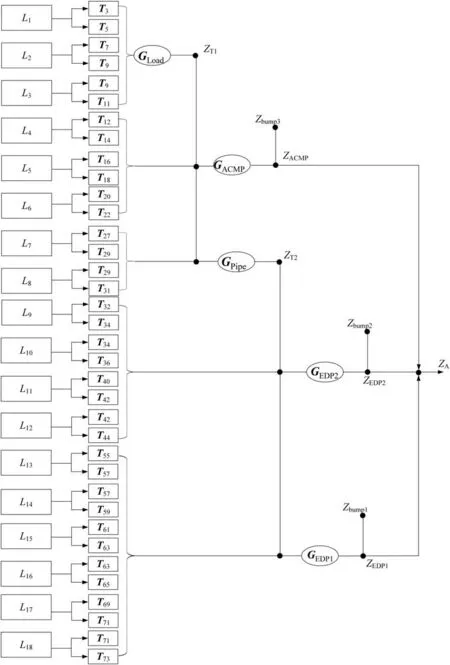
Fig. 13 Relationship between clamps’ locations and system impedance.

The optimized values of 18 clamps’locations were obtained as shown in Table 4 by using CPSO. Fig. 15 presents the system impedance with original and optimized clamps’ locations,and Fig. 16 illustrates the value optimization course of objective function Z.
As we can see from Fig.15,the response frequencies of system impedance under optimization are lower than the original ones, and the value of objective function reduces from 1.3633×10dB to 0.867×10dB by using CPSO with 117 iterations,which decreases by 36.4%compared to the original system according to Fig. 16.
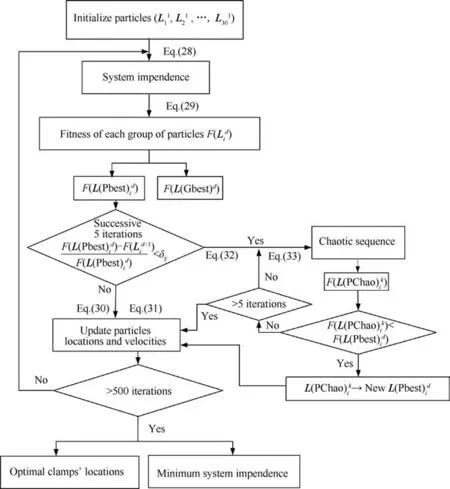
Fig. 14 Flow chart of CPSO.
It can be concluded that the minimum value of objective function Zand the optimum clamps’locations were obtained by using CPSO. Moreover, the vibration of system would decrease if the clamps were adjusted as the optimal locations,which needs more experiments verification.

Table 4 Variation of clamps’ locations.
5. Experiment verification based on the clamps’ locations optimization
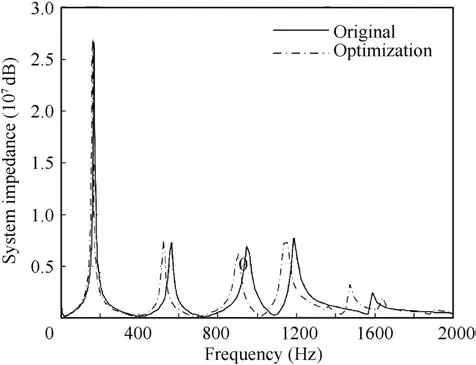
Fig. 15 Comparison of system impedance with two conditions.
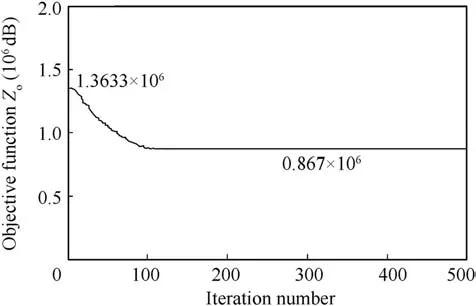
Fig. 16 Value variation of objective function with CPSO.
The experiment was carried on the multi-pump hydraulic system. The test stand was set up similar as a large aircraft hydraulic pipelines system. There are three pumps (EDP1,EDP2 and ACMP),which are driven by the motors on the test stand to simulate the actual situation in aircraft.
As we can see from Figs.17 and 18,The test stand of multipump parallel system consists of EDP1,EDP2,ACMP,pipelines, filters, T-junctions, clamps and loads. The parameters were set the same as simulation conditions: System pressure:21 MPa; Rotational speed of EPD1: 2000 r/min, Rotational speed of EPD2: 2000 r/min, Rotational speed of ACMP:4000 r/min; Working time: 30 s. The acceleration sensors(SAE-D0005Q, 50 g) and the pressure sensors (CY-YD-205,0-30 MPa) were installed on the locations as shown in Fig. 1. In this paper, the sensors of locations on the pipe(straight pipe behind the curved pipe, EDP1), filter (EDP1)and T-junction2 were adopted,which locations were illustrated as pentacles in Fig.17.The vibration and pressure signals were collected by signal acquisition system, so the results with different clamps’locations can be compared according to the test data.
As we can see from Fig. 19, the vibration signals from the pipe, filter and T-junction2 were collected from the acceleration sensors,and the vibration amplitude attenuates gradually along the pipelines, however, the vibration signal on Tjunction2 is a bit larger than the signal on the filter, because the oil from two pipes converge together, which bring more vibration to the T-junction2. According to the variation effect of the clamps’ locations, the radial acceleration signals were adopted on the pipe, and the acceleration signal amplitude is-17-15 g with the original clamps’ locations, in contrast, the acceleration signal amplitude is-10-8 g after the clamps’locations optimization,which reduces by 43.75%.On the filter,the acceleration signal amplitude is -3-5 g with the original clamps’ locations, in contrast, the acceleration signal amplitude is -2.5-3 g after the clamps’ locations optimization,which reduces by 31.25%.On the T-junction2,the acceleration signal amplitude is-6-5 g with the original clamps’locations,in contrast, the acceleration signal amplitude is -3-3 g after the clamps’ location optimization, which reduces by 45.45%.Based on the test results,it can be concluded that the vibration amplitude at the same point reduced by using the clamps’locations optimization.

Fig. 17 Test stand of multi-pump parallel system (★:locations of sensors).

Fig. 18 Three locations of the test stand.

Fig. 19 Vibration with different locations of original and optimization.

Fig. 20 Pressure with different locations of original and optimization.
What’s more, the vibration can affect the oil pressure fluctuation due to FSI. As we can see from Fig. 20, the oil pressures from pipe, filter and T-junction2 were collected from the pressure sensors, and the pressure amplitude attenuates gradually along the oil flow,but the pressure fluctuation in the pipe is a bit larger than the value in EDP because the curved pipe out of EDP has a flexible characteristic and promote some vibration. According to the variation effect of the clamps’locations, the pressure fluctuation in the pipe is 20.1-22 MPa with the original clamps’ locations, in contrast, the pressure fluctuation is 20.2-21.7 MPa after the clamps’ locations optimization, which reduces by 21.05%. In the filter, the pressure fluctuation is 20.5-21.2 MPa with the original clamps’ locations, in contrast, the pressure fluctuation is 20.7-21.1 MPa after the clamps’ locations optimization, which reduces by 42.86%.In the T-junction2,the pressure attenuated more than that of filter. The pressure fluctuation is 19.9-20.6 MPa with the original clamps’ locations, in contrast, the pressure fluctuation is 20.1-20.5 MPa after the clamps’location optimization,which reduces by 42.86%. Based on the test results, the pressure fluctuation amplitude at the same point reduces by using the clamps’ locations optimization, additionally, the pressure fluctuation amplitude in filter and T-junction2 reduces larger than the value in the pipe.
According to the experiments, the resulted values support the effectiveness of the optimization of the clamps’ locations.It can be concluded that the system impedance could be altered by using clamps’ locations optimization, which avoided the vibration frequencies, so the pipe vibration and pressure fluctuation of multi-pump system can reduce with optimization of the clamps’ locations. Additionally, this method may promote the safety and reliability of the large aircraft.
6. Conclusions
(1) The FSI 14-Equation was applied to illustrate the multipump hydraulic pipelines system in large aircraft, and the system impedance was obtained by using the TMM, which was considered as the key value affecting the system vibration in this paper. Meanwhile, the system impedance in frequency domain with flexible clamps had lower maximum value and inherent frequencies compared to the value of rigid clamps.
(2) The characteristic impedance was calculated based on the cruising flight and its vibration frequencies,additionally,the objective function was set with the characteristic impedance of different vibration frequencies and its proportion. The objective function was minimized by using CPSO and adjusting the clamps’ locations, which reduced by 36.4%. Consequently, the optimal clamps’locations were obtained.
(3) The vibration and pressure fluctuation values collected from sensors of locations on the pipe, filter and Tjunction reduced by using the optimization of clamps’locations, which proved the effectiveness of system impedance calculation and clamps’ locations optimization method.
The authors declare that they have no known competing financial interests or personal relationships that could have appeared to influence the work reported in this paper.
This study was supported by the National Natural Science Foundation of China (No. 51775004).
 Chinese Journal of Aeronautics2022年6期
- Chinese Journal of Aeronautics的其它文章
- Experimental investigation of a gliding discharge plasma jet igniter
- Evolution of turbulent boundary layer over a three-dimensional bump
- Conceptual design and preliminary experiment of icing risk management and protection system
- Direct thrust control for multivariable turbofan engine based on affine linear parameter-varying approach
- Characteristics of reattached boundary layer in shock wave and turbulent boundary layer interaction
- Structurally coupled characteristics of rotor blade using new rigid-flexible dynamic model based on geometrically exact formulation
