Evolution of turbulent boundary layer over a three-dimensional bump
Jun LIU, Dniele FISCALETTI, Hucheng YUAN
a College of Energy and Power Engineering, Nanjing University of Aeronautics and Astronautics, Nanjing 210016, China
b School of Civil, Aerospace and Mechanical Engineering, University of Bristol, Bristol BS8 1TR, UK
KEYWORDS Bump;Divertless inlet;Particle Image Velocimetry(PIV);Turbulent boundary layer;Turbulent/Non-Turbulent Interface (TNTI)
Abstract A bump is typically used in the inlet system of an aircraft engine to compress the incoming airflow and to reduce boundary layer thickness developed over fuselage. In this work, the turbulent flow over a three-dimensional bump is experimentally studied.The bump model is mounted in a closed return wind tunnel operated at the nominal velocity 10 m/s,corresponding to a friction Reynolds number of 2300.The flow field upstream the bump,along the bump centerline and at two different spanwise planes is measured with Particle Image Velocimetry (PIV). It is observed that a favorable pressure gradient develops until the suction peak of the bump, and that the average turbulence intensity within boundary layer is attenuated due to this favorable pressure gradient. The boundary layer thickness identified by examining profiles of streamwise velocity decreases significantly along the bump. The wall-normal position of the Turbulent/Non-Turbulent Interface(TNTI) identified with the vorticity criterion is also observed to decrease along the bump. When studying the behavior of the boundary layer thickness at different spanwise positions,we found that it tends to be larger in planes away from the centreline, which suggests that the bump diverts the flow.
1. Introduction
With the aim of enhancing the performance of the propulsion system of an aircraft, several strategies of flow control of the inlet conditions have been proposed over the last few decades.These include boundary layer bleedand blowingto reduce the loss of momentum typical of an untreated boundary layer, and the use of vortex generatorsaimed at increasing the turbulent mixing to delay boundary layer separation.Among these, the investigation of the flow over a threedimensional bump has received a great deal of interest since the pioneer work by Simon et al. in the 1950s.In their work,it was reported that,over a range of Mach number from 1.5 to 2.0, a three-dimensional bump inlet offers better performance than a two-dimensional ramp inlet.To draw these conclusions,the authors examined performance parameters such as totalpressure recovery, total-pressure distortion and drag. Moreover, an inlet from a three-dimensional bump can not only compress the inflow but also reduce the boundary layer thickness,which attenuates the loss of momentum associated with a boundary layer.
Previous research on the optimization of bump inlet could be classified into two categories based on their main goals,which are the design method and the analysis of the flow field.The research of bump surface design methods is firstly discussed briefly.The surface of the bump was modelled through the tracing of the flow streamline on the basis of the cone flow field as described by Seddon and Goldsmith.Hamstra et al.explained in detail how to model the shape of a bump surface based on a conical flow field. Recently, Yu et al.proposed a pressure controllable bump concept based on the inverse Method of Characteristics(MOC)algorithm.The pressure distribution along the centerline and the end station of the bump were prescribed, together with the known values at the leading edge of bump. In this way, the surface pressure distribution over the bump can be obtained through an interpolation. Therefore, the bump surface can be designed according to the design pressure distribution. Later, this bump was integrated into a hypersonic inward turning inlet through an inverse MOC algorithm.In addition to this, Cheng et al.presented an efficient multi-objective optimization algorithm to improve the aerodynamics performance of bump inlet.Compared to the algorithms based on computational fluid dynamics used previously, the algorithm proposed by Cheng et al.has higher efficiency.
The characterization of the flow field over the bump has been performed both numerically and experimentally over the last few decades.Kim and Songhave done comprehensive numerical simulations over both ramp and bump inlets.The results indicated that bump inlet can control the shock/boundary layer interaction effectively and provide a higher total pressure recovery in the aerodynamic interface plane over ramp inlet. These improvements were achieved through the diversion of the boundary layer from a spanwise pressure gradient.The external and internal flow features and performance characteristics of an integrated bump inlet were evaluated in both subsonic and supersonic regimes through numerical simulations.The results indicated that effective boundary layer diversion can be achieved under both subsonic and supersonic conditions. Tillotson et al.conducted an experimental study of a Mach number 3 bump geometry.Qualitative visualizations of the flow field and quantitative measurements including static pressure,mean velocity and turbulent stress were conducted in the tests.The surface streakline indicated that a significant diversion of the flow in the spanwise direction was on the basis of a thickness reduction over the bump. Static pressure measurements showed the existence of a favorable pressure gradient in both streamwise and spanwise directions. Furthermore, velocity measurements from laser Doppler velocimetry revealed that the boundary layer thickness becomes thinner along the bump centerline,and that the turbulence intensity decreases when compared with that of the incoming boundary layer. The flow over a bump in supersonic or even hypersonic regimes has been investigated extensively in the recent past,and we have developed the significant knowledge of this flow.However,the inlet flow conditions of a landing aircraft are in a subsonic regime, and the boundary layer development over a three-dimensional bump in subsonic regime has so far received only scarce attention.In the present work, the flow over a three-dimensional bump in a subsonic flow regime at different flow velocities is experimentally investigated with planar Particle Image Velocimetry (PIV).
The geometry of bump surface used in the present study is that developed by Li and Liang,who investigated basic flow features of the bump integrated within the fuselage in supersonic regime. The purpose of this study is to experimentally characterize the turbulence of the boundary layer over this same bump in subsonic regime.Firstly,the experimental setup and methods of analysis are described in detail. Then, the development of the turbulent boundary layer over the bump is illustrated, including mean and Root Mean Square (RMS)velocity profiles of both the streamwise and the wall-normal velocity components, and an estimate of the pressure coefficient. Finally, the effects of the bump on the evolution of the turbulent/non-turbulent interface and of the turbulent boundary layer thickness are discussed.
2. Experimental apparatus and methods
Measurements of turbulent boundary layer over the bump were carried out in the low turbulence closed return wind tunnel at University of Bristol. This tunnel can provide a flow speed of up to 100 m/s, with a turbulence intensity lower than 0.09%.It has an octagonal test section of 0.8 m width and 0.6 m height. We introduce here a system of coordinates x,y,z that refers respectively to the streamwise, wall-normal, and spanwise directions.
Both the flat plate and the bump were manufactured from acrylic cubes by a computer numerical control machine. As shown in Fig.1(a),the bump was mounted in the middle of test section of the low turbulence wind tunnel at University of Bristol.The bump is symmetric about its middle plane(z=0 mm).The measurements were conducted at three planes,at different spanwise positions, i.e. z = 0 mm, z = 10 mm, and z = 20 mm. The total length of flat plate was 0.7 m and the bump model was placed 0.4 m downstream the leading edge of flat plate,which is similar to the flow condition of practical aerospace applications. A stripe of zigzag tape was located in proximity of the leading edge of the flat plate, in order to locally induce the transition from laminar to turbulent of the flow regime of the boundary layer. The dimensions of the bump model are shown in Fig. 1 (b).
The inflow parameters presented in this paper are shown in Table 1, with a free-stream velocity of U= 10.74 m/s. The boundary layer thickness at the leading edge of the bump was of δ = 86.2 mm. An estimate of the friction velocity u= 0.40 m/s was determined from the composite velocity fit by Chauhan et al., from which a Reynolds number Re= 2300 could be calculated.
The flow was seeded with tracer particles of 1 μm in diameter that were generated from the mixture of polyethylene glycol 80 and water in a ratio of 1:4. Two-dimensional planes along the streamwise and wall-normal directions, i.e. along the axes x and y, were illuminated with a laser sheet of 1 mm thickness provided by a Litron 200 mJ Nd:YAG laser,with wavelength of 532 nm and a pulse repetition rate of 15 Hz. The time interval between two consecutive laser pulses within a snapshot was 80 μs according to the inflow velocity,and the corresponding streamwise pixel displacement in the free-stream is of approximately 13 pixel.

Fig. 1 Bump model and its dimensions.

Table 1 Inflow parameters.
A total number of 3650 image pairs for each measurement were captured by two CCD cameras placed side by side with a total resolution of 2984 pixel×2072 pixel.The calibration factor is of 15.3 pixel/mm, corresponding to a field of view 190.0 mm×132.0 mm,which is equivalent to 4.8 h×3.3 h,where h is the maximum height of the bump.The velocity fields used to study the turbulent boundary layer development over the bump were acquired and post-processed by the Dynamic Studio software by Dantec Dynamics, using a cross-correlation algorithm with an iterative approach, where the size of the final interrogation window was set to 16 pixel × 16 pixel (1.0 mm × 1.0 mm), and a window overlapping of 50%.
3. Experimental results
3.1. Inflow conditions
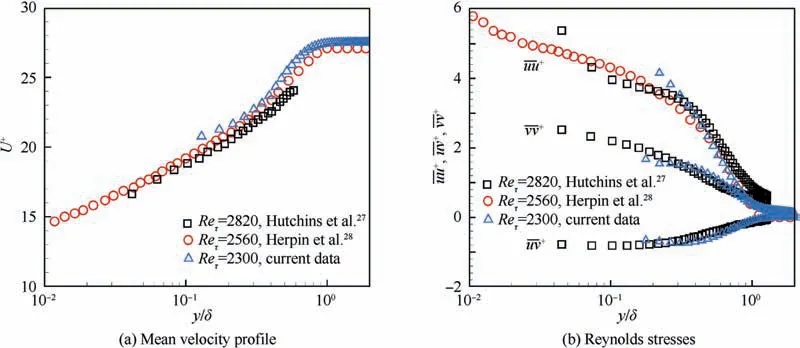
Fig. 2 Turbulence statistics over bump at z = 0 mm streamwise-wall-normal plane.
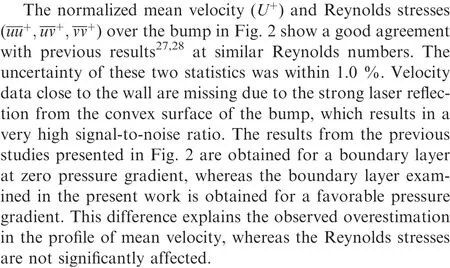
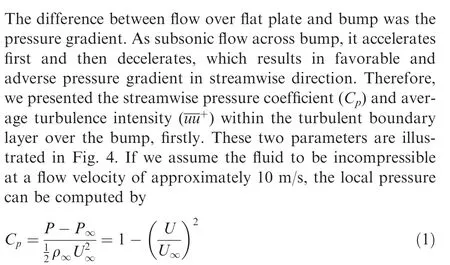
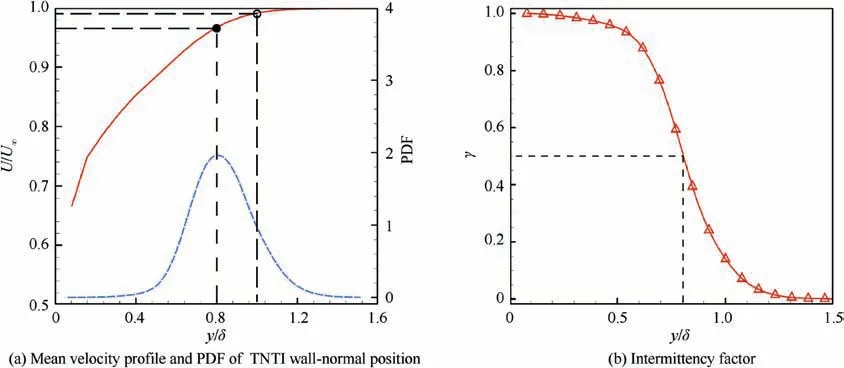
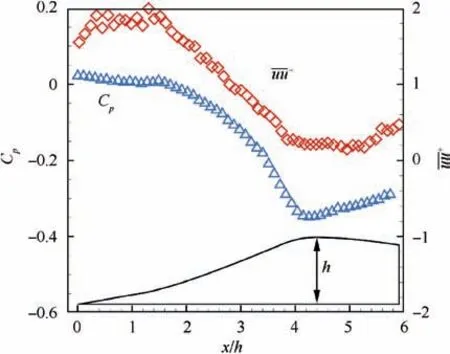
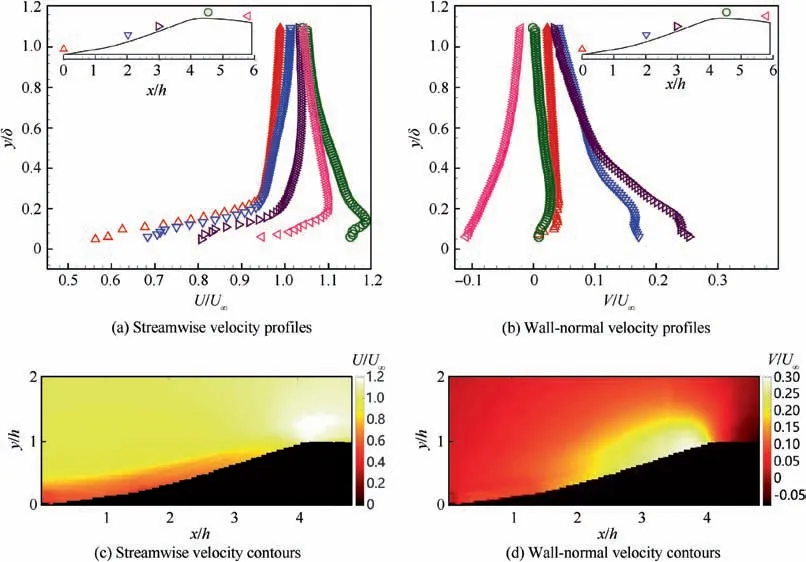
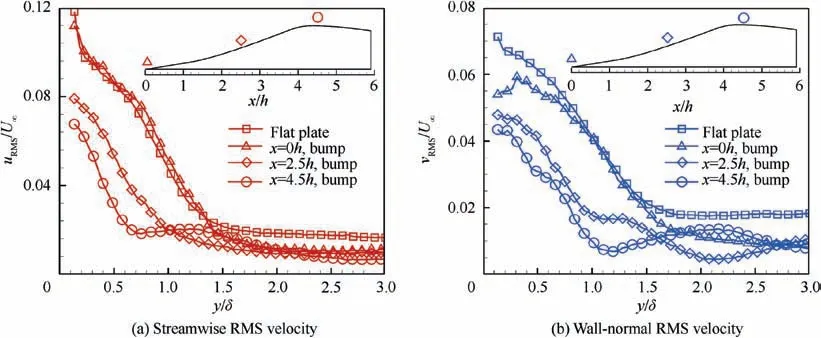
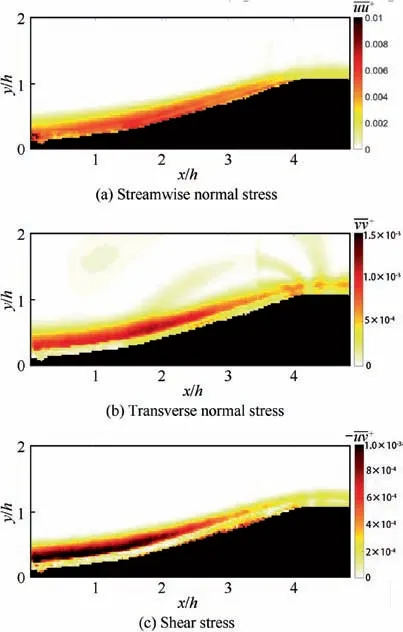
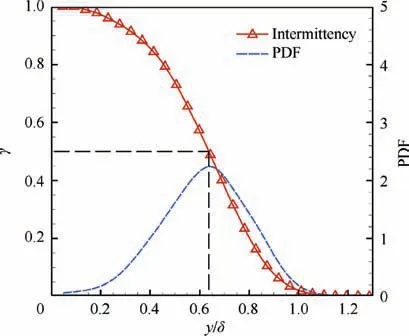
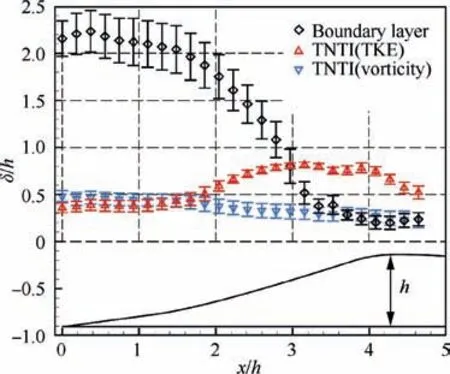
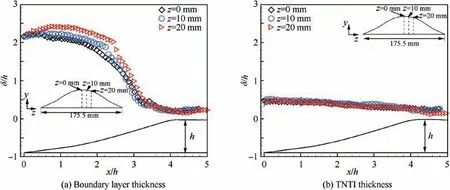
Firstly, we examined the turbulent boundary layer statistics in the flat plate upstream the bump. Different criteria have been proposed in the literature to detect the interface between the turbulent region and the non-turbulent portion of the domain,the so-called Turbulent/Non-Turbulent Interface (TNTI).These include criteria based on scalar concentration, turbulent kinetic energyand vorticity magnitude.It has been shown that the identification of the TNTI based on the turbulent kinetic energy criterion can be used in the detection of the TNTI in turbulent boundary layers with zero pressure gradient.This metric takes streamwise and wall-normal fluctuations into account, and distinguishes between the turbulent regions,i.e.those where the non-dimensional kinetic energy(k)is larger than a threshold value(k), from the non-turbulent regions, where the kinetic energy is nearly zero. An identification criterion based on turbulent kinetic energy is also more robust to measurement noise than one based on the vorticity criterion. This is because vorticity involves velocity gradients while turbulent kinetic energy involves velocity RMS, and the former physical quantity is more sensitive to measurement noise than the latter one.Therefore,this identification criterion was used to determine the TNTI of the turbulent boundary layer upstream the bump, which is also a zero pressure gradient one. Regions where k>kare considered as ‘‘turbulent”,whereas regions characterized by k where P is the local average static pressure,and Pand ρare the free-stream static pressure and density, respectively. The flow is firstly accelerated within the converging part of the bump and then decelerated over the diverging part. The suction peak which separates these two parts occurs at around 4.5h downstream of the leading edge of the bump. The mean turbulence intensity within the turbulent boundary layer was almost constant at the beginning of the bump, where the streamwise pressure gradient is nearly zero, and then it is attenuated by the favorable pressure gradient until the suction peak. Fig. 3 Turbulent boundary layer statistics upstream bump. Fig. 4 Pressure coefficient and turbulence intensity within turbulent boundary layer along bump centerline. The distribution of pressure gradient and turbulent intensity in streamwise direction were illustrated previously, which will help us to understand the evolution of flow statistics over the bump.The streamwise and wall-normal velocity profiles at five different stations along the bump centerline and velocity contours are shown in Fig. 5. Schematics of the bump model showing the stations where the corresponding velocity profiles are calculated are presented in the inserts of each figure. The streamwise velocity profiles exhibit a faster growing rate with the wall-normal distance when moving along the streamwise direction, and the boundary layer thickness reduces along the bump centerline which is caused by the favorable pressure gradient (Fig. 4). During the first two stations, the streamwise velocity profiles are similar with each other due to the pressure gradient at the beginning of bump being relatively mild. As this favorable pressure gradient increases, the streamwise velocity profiles increase their growing rates with the wallnormal location, y. Moreover, the flow in the outer region of the boundary layer accelerates when moving along the bump.This occurs because pressure energy is converted into kinetic energy. The lowest boundary layer thickness is achieved at x = 4.5h, which is the so-called suction peak of the pressure gradient. The maximum velocity at this station is 1.2U, and the free-stream velocity is 1.06Udue to the contraction in the test section that can be attributed to the bump. Downstream the suction peak, the boundary layer thickness builds up along the bump surface and the maximum velocity decreases to 1.1Uat x = 5.8h. As shown in Fig. 5(b), the wall-normal velocity within the boundary layer region increases from nearly 0 at the leading edge of the bump to 0.25Uat x = 3.0h, and then returns to 0 at suction peak,which reflects the curvature of the bump. Based on the mean velocity fields shown previously, the fluctuation velocities can be calculated after subtracting the local mean velocity from the instantaneous velocity. From velocity fluctuations,RMS velocity was calculated,along both the streamwise (u) and the wall-normal (v) directions.The evolution of streamwise and wall-normal turbulence intensity profiles over the flat plate and three different positions over the bump are illustrated in Fig. 6. It is worth noting that RMS velocity and turbulent intensity represent the same physical quantities, and they can be used interchangeably. As the first measurement point of current data is at y>0.1δ,the near wall peak is not accessible.The turbulence intensity from the flat plate collapses on top of the turbulence intensity at the leading edge of the bump. The observed difference for the wall-normal velocity component at y<δ is due to the intense reflections from the bump surface which causes high levels of noise near the wall. From Fig. 6 (b), it can be observed that due to this increased background intensity, vnear the wall are smaller than those away from the wall at the beginning of the bump. Along with the bump, turbulence intensity is reduced further at x=2.5h and x=4.5h,which is in line with the results from Fig. 4. The convergence of the bump attenuates the turbulence intensity not only close to the wall,but also away from the wall. The streamwise turbulence intensity for flat plate are 1.7% and 1.8% respectively, but at x = 4.5h,these two quantities are both reduced to less than 1.0%. Contour plots of the Reynolds shear stresses over the centerline of the bump are shown in Fig. 7. This figure supplements the selected profiles of Fig.6 and provides a global view of the centerline flow field. As shown in Fig. 7, the transverse normal stress and shear stress near the wall were attenuated due to the strong laser reflection from the convex surface of the bump. Fig. 5 Mean velocity profiles and contours. Fig. 6 Streamwise and wall-normal RMS velocity profiles over flat plate and along bump. A criterion based on the turbulent kinetic energy was used to identify the TNTI of the turbulent boundary layer over the flat plate. However, this criterion is expected to be less accurate when applied to the identification of the TNTI of the boundary layer over the bump. This is because the wall-normal velocity increases significantly over the bump, and so does the turbulence intensity of the wall-normal velocity component. Therefore, using a criterion based on the threshold of the turbulent kinetic energy tends to overestimate the thickness of the TNTI, especially where the turbulence intensity of the wall-normal velocity component is maximum, i.e. at x = 3.0h. As shown in Fig. 8(a), solid line grows outward along the bump, which represents the interface between the turbulent and the non-turbulent regions. Considering this issue,we also used a criterion based on the out-of-plane vorticity(ω>ω)to identify the TNTI over the bump,as shown in Fig. 8(b). The threshold value (ω) is set as 0.1 s, which is suggested by Anand et al.Instantaneous plots of streamwise velocity and vorticity are shown in Fig. 9. The solid lines represent the detected TNTI over the bump according to the vorticity criterion. The intermittency of the turbulence region and the PDF of the TNTI of the turbulent boundary layer over the bump are shown in Fig.10.When comparing these with the results from flat plate,the wall-normal location with the largest probability of identifying the TNTI moves from 0.80δ to 0.64δ. This decrease in the TNTI wall-normal position can be explained as the consequence of the flow acceleration when moving over the bump, which stretches the fluid elements and attenuates both the vorticity and the turbulence intensity. As a result,the wall-normal extent of the turbulent region becomes smaller. Both the thickness of boundary layer over the bump and TNTI detected by kinetic energy and vorticity criteria are shown in Fig. 11. The boundary layer thickness is detected according to 99% of the local maximum velocity. These three variables are almost constant over the range x = 0 ~1.8h.Then, the boundary layer thickness drops significantly from about 2.1h to 0.2h at x = 4.0h. After the suction peak, the boundary layer starts to grow mildly.The upper triangle shows the thickness of the TNTI detected with the criterion based on Turbulent Kinetic Energy(TKE),which has a good agreement with the results from the vorticity criterion over the range x=0 ~1.8h. After that, the ramp wall starts to become steeper,which increases the wall-normal turbulence intensity. This leads to overestimating the thickness of the TNTI when a criterion based on turbulent kinetic energy is adopted. The behavior of the TNTI has a decrease from 0.5h to 0.2h, and the extent of the TNTI collapses on top of the boundary layer thickness from x = 3.7h to the end of bump. The error bars show the standard deviation of these statistics. Fig.7 Reynolds shear stresses contours at centerline over bump. Fig. 8 Contours plots of mean turbulent kinetic energy and mean vorticity, and their TNTIs. Fig. 9 Instantaneous snapshots showing contour map of streamwise velocity and vorticity, and their TNTIs. To study the three-dimensional effects of the bump, the characteristics of the turbulent boundary layer are examined in different x-y planes away from the centerline, therefore at different spanwise locations. The boundary layer thickness at three different x-y planes is presented in Fig.12(a).In this figure, the boundary layer thickness along the bump at the centerline plane (z = 0 mm), and at two offset planes, 10 mm and 20 mm,is shown.The diamond symbols mark the boundary layer at the centerline,while circles and triangles represent respectively the boundary layer thickness at z=10 mm and at z = 20 mm offset from the centerline plane. These values of the boundary layer thickness collapse with each other at the leading edge of the bump. Then, on average, values at the two different offset positions become larger than those at the centerline plane.At z=20 mm,this trend is more evident than that at z=10 mm.The increment of the boundary layer thickness at different offset planes could be attributed to the geometry of the bump that tends to divert the flow from centerline onto both sides. This three-dimensional flow feature is consistent with the streakline pattern along the bump from Tillotson et al. Fig.10 Intermittency of turbulent flow and PDF of wall-normal positions of TNTI over bump. Then, downstream the location x = 3.0h, most of the low momentum flow has been diverted to both sides of the bump,so the boundary layer thickness at these three planes collapses with each other again. In the meantime, the TNTI along the bump is nearly insensitive to the spanwise location, and its wall-normal extent is reduced gradually from 0.5h to 0.2h. Fig. 11 Boundary layer thickness and TNTI detected with different methods. Fig. 12 Thickness of boundary layer and TNTI at three different spanwise locations. The evolution of the turbulent boundary layer over a threedimensional bump was investigated in this paper using PIV.The statistics of the turbulent boundary layers and evolution of boundary layer thickness and TNTI in the streamwise and spanwise directions were presented. (1) The boundary layer upstream the bump over the flat plate was fully developed and the statistics including mean velocity and shear stresses along the bump surface agreed well with previous results at similar Reynolds number. (2) Turbulent boundary layer thickness decreased significantly from 2.1h to 0.2h along the bump,which indicates that the bump is effective in boundary layer diversion at centerline. Due to favorable pressure gradient over the bump, the wall-normal extent of the TNTI showed a mild decrease from 0.5h to 0.2h. (3) Comparing the thickness of the turbulent boundary layer at three different spanwise positions evidenced that the boundary layer thickness at z = 10 mm and at z=20 mm are larger than that at centerline,which suggests that the bump is effective in the diversion of the boundary layer at spanwise position. However, the thickness of TNTI identified by the vorticity criterion is nearly insensitive to the spanwise position. The authors declare that they have no known competing financial interests or personal relationships that could have appeared to influence the work reported in this paper. The authors gratefully acknowledge China Scholarship Council for providing the financial support and the National Natural Science Foundation of China (No. 11772155).3.2. Turbulent statistics over bump
3.3. TNTI and boundary layer thickness


4. Conclusions
 Chinese Journal of Aeronautics2022年6期
- Chinese Journal of Aeronautics的其它文章
- Experimental investigation of a gliding discharge plasma jet igniter
- Conceptual design and preliminary experiment of icing risk management and protection system
- Direct thrust control for multivariable turbofan engine based on affine linear parameter-varying approach
- Characteristics of reattached boundary layer in shock wave and turbulent boundary layer interaction
- Structurally coupled characteristics of rotor blade using new rigid-flexible dynamic model based on geometrically exact formulation
- Shape preserving topology optimization for structural radar cross section control
