Conceptual design and preliminary experiment of icing risk management and protection system
Qiang WU, Haojun XU, Binbin PEI, Yang WEI
School of Aeronautics Engineering, Air Force Engineering University, Xi’an 710038, China
KEYWORDS Flight risk;Flight simulator;Icing;Quantitative assessment;Visualization
Abstract Icing is one of the main external environmental factors that causes aircraft to lose control. The flight safety assurance system under icing condition is particularly important. However,most of the systems do not consider the coupling characteristics of aerodynamics and flight dynamics of icing aircraft. This will affect the accuracy of the calculation results. Besides, the icing risk management system helps the pilot to realize the possible dangers in advance and perform correct maneuvers,based on quantitative assessment and visualization methods of flight risk.The envelope protection system realizes flight safety guarantee based on the real-time boundary protection method of key flight parameters. Finally, based on distributed simulation technology, a flight simulator was used as a platform to integrate the icing risk management system and envelope protection system to realize man-in-the-loop simulation. Two fictional but historically motivated icing scenarios are designed to test the system, and the results demonstrate that the icing risk management and protection system would be useful for aviation safety and can also be used for pilot training and reproducing flight accidents to find the causes.
1. Introduction
Although the research on the icing problem began in the 1920s,due to the lack of a comprehensive and clear understanding of basic scientific issues related to aircraft icing, the existing icing protection methods cannot completely eliminate icing hazards, and flight accidents caused by icing occur occasionally. According to Boeing’s statistics, aircraft icing is one of the three major causes of serious flight loss of control accidents. According to the statistics of the Federal Aviation Administration of the United States,there were 388 flight accidents caused by icing during the decade from 1990 to 2000.With the increase in flight density, there were 380 icingrelated accidents during the five years from 2003 to 2008.There have been many flight accidents caused by icing in China in recent years, for example, the Baotou air crash in 2004 caused 55 deaths. Therefore, it is of urgent practical significance to systematically carry out research on the flight safety of aircraft during icing encounters.
At present,research on icing issues has gradually developed from a single perspective to systematization. More representative examples are the Smart Icing System (SIS) developed by Professor Bragg’s team,the Icing Contamination Envelope Protection (ICEPro) system of NASA Glenn Research Center,and the Icing Tolerant Flight Control System (ITFCS)developed by Professor Caliskan’s team.The SIS project researched aircraft safety under icing encounters from multiple aspects such as the flight dynamics model,autopilot,aircraft icing model,icing characterization routine,envelope protection system,and human factors,compared with the traditional icing protection system,which only relied on the pilot or flight control system to activate the icing protection system based on the current icing conditions. An icing management system was added to the SIS to provide a more complete safety assurance ability. The ICEPro was designed to recognize the occurrence of icing and the degradation of aircraft performance and flight quality caused by icing in real time,and provide the pilot with flight safety boundary instructions, thereby ensuring that the aircraft always operates within a safe boundary.The ITFCS had the functions of detecting icing and monitoring the severity of icing, providing corresponding manipulation suggestions to the pilot, and reconfiguration of the control rate.The above three systems were of great positive significance for flight safety and pilot training in icing conditions. However, the mechanism of aircraft dynamic instability and safety protection were not investigated in depth since they did not consider the complex flow mechanism of the aircraft under icing conditions and the coupling of aerodynamics and flight mechanics. Those systems lacked the risk warning function before entering the icing area and in the icing area,which is realized based on flight risk quantitative assessment and visualization methods, respectively. The team of Professor Cao from Beihang University conducted systematic research on numerical simulation and analysis of dynamic characteristics under icing conditions.However, they did not further study flight safety assessment and assurance methods.Through the quantitative assessment and visualization of flight risk, the pilot can be aware of the possible dangers and carry out accurate maneuvers to ensure flight safety.
In this paper, the Icing Risk Management and Protection System (IRMAPS) is composed of the icing risk management system and the envelope protection system.The icing risk management system is designed based on the quantitative assessment and visualization method of flight risk under icing conditions to guide the pilots to carry out safe maneuvers.The envelope protection system is designed based on the region of attraction theory and dynamic inversion control theory to ensure aircraft flight safety in ice-containing flights.
To further strengthen the practical application of the above theoretical methods in engineering and realize man-in-the-loop simulation,a flight simulator is used as a platform to integrate and test the icing risk management system and envelope protection system, based on distributed simulation technology.
Test and demonstration of the IRMAPS are accomplished using two icing scenarios: an aircraft landing with wing icing and a roll-upset event during aileron icing.In the first scenario,the angle of stall attack occurs when the IRMAPS is not turned on, due to the fact that the pilot does not realize the wing icing and continues to use the pitch-up maneuver during landing with wing icing, and the aircraft finally lands successfully when the IRMAPS is turned on. In the second scenario,roll upset occurs when aileron icing leads to flow separation near the ailerons causing an uncommanded rolling moment.These scenarios are fictional but based on historical factors that have led to icing events.
2. IRMAPS development
The creation process of the IRMAPS is shown in Fig. 1. The first step is the creation of an icing aircraft model based on a conventional aircraft model through aerodynamic characteristics analysis under icing conditions. A conventional aircraft model consists of the six-degree-of-freedom equation of the aircraft body, engine model, aerodynamic model, engine model, pilot model, fly-by-wire system model, mass, size, and initial conditions. The element of the icing aircraft model discussed is the coupling calculation of the aerodynamics and flight dynamics model, which is different from the conventional aircraft model. Based on the icing aircraft model, the second step is creating a flight safety assurance system. A quantitative assessment and visualization method of flight risk under icing conditions is proposed and verified to make the pilot aware of the possible dangers in advance and carry out safe maneuvers. A flight safety protection method based on reconstruction design of ice-containing flight control law and calculation of the flight envelope is proposed and verified to realize real-time boundary protection of flight parameters.The third step is to design a flight simulator used as a platform to integrate and test the icing risk management system and envelope protection system.
2.1. Complex aerodynamic characteristics
The structure of the stall separation flow field after the icing of the aircraft is complicated, which is dominated by the separation and reattachment effects, and is dominated by the unsteady motion process and interaction of the vortex. The related numerical simulation research puts forward higher requirements for the accuracy and reliability of the turbulence simulation method. Based on NASA’s open-source computational fluid dynamics software CFL3D and the Improved Delayed Detached Eddy Simulation (IDDES) method, which is obtained by combining the Delayed Detached Eddy Simulation (DDES) method and wall-modelling in Large Eddy Simulation (LES),a calculation analysis program suitable for numerical simulation of complex unsteady flow after icing was developed.The IDDES method is based on the k-ω Shear Stress Transport (SST) turbulence model, and the main improvements compared to the DDES method include redefining the sub-grid scale by introducing wall distance and grid spacing parameters, and constructing the Reynolds-Averaged Navier-Stokes/Large Eddy Simulation (RANS/LES) hybrid length scale based on wall-modelling in LES. The Jameson finite volume method was used to spatially discretize the governing equations, the Roe-Flux Difference Splitting (Roe-FDS) scheme was used for the spatial discretization of the non-viscous term, the third-order Monotone Upstreamcentred Schemes for Conservation Law (MUSCL) scheme was used for the flux of the mesh interface to improve the spatial resolution, and the second-order centre scheme was used for the spatial discretization of the viscous term. The implicit Lower-Upper Symmetric Gauss-Seidel (LU-SGS) doubletime step method was used for time-marching and to solve the Navier-Stokes (N-S) equation. This method introduces the pseudo-time derivative term into the classic implicit LU-SGS format,and uses the sub-iteration technique in the pseudo-time direction to make the time discrete accuracy reach the second order. The physical time step can be selected according to the actual physical problem,and is not limited by the stability conditions, bringing convenience to the calculation. At the same time,the virtual time sub-iteration process is carried out in the icing state in real time,so it can be introduced to local time steps,implicit residual smoothing,and multigrid technology to accelerate the convergence and improve the calculation efficiency.It has been verified that this method can accurately reflect the starting region of the separation flow,characterize the instability of the shear layer on the leading edge of the wing,and obtain a fine turbulent structure in the wake field. On this basis, numerical simulation studies of complex unsteady flows after icing can be carried out.Supported by this method,this paper mainly studies the complex flow mechanism after icing from two levels:airfoil and whole aircraft.

Fig. 1 Flowchart of creation of IRMAPS.
2.1.1. Flow field structure of a typical airfoil under icing conditions
Based on the calculation analysis program described above, a numerical simulation of the separation flow induced by the angular ice near the leading edge of the GLC305 icing airfoil stall point was carried out.The development process and laws of the unsteady stall separation flow after the airfoil icing are systematically analyzed. Fig. 2 shows the characteristic distribution of the flow field at different Angles of Attack (AOAs)α (where u/U is the ratio of the flow velocity at each point to the free flow velocity).The simulation results show that,under the dual impact of the pressure gradient and geometric shape change, the shear layer instability position moves away from the wall with an increasing AOA, releasing more abundant vortex structure, which causes the reattachment region to move back continuously. The vortex structure interacts with the trailing edge wake vortex, forming a larger-scale vortex in the wake area. The ‘‘fluctuation” phenomenon of the shedding vortex leads to the change of reattachment position and the generation of unsteady aerodynamic force. Kelvin-Helmholtz instability dominates the instability process of the shear layer, and the quasi-two-dimensional vortex produced by the instability rapidly produces rolling and deformation phenomena, forming a vortex structure with strong threedimensional characteristics downstream. As the AOA increases,the small-scale vortex structure released by the shear layer in the instability and wake regions is more abundant,and the interaction with the trailing edge vortex is more complicated, indicating that the intensity of turbulence is increasing.However, the scale distribution and spatial structure of vortices at different AOAs are generally similar.
2.1.2. Aerodynamic characteristics under icing conditions
The background aircraft wing and flat tail icing configuration,and the aerodynamic force and moment characteristics of the whole aircraft are calculated and analyzed under different AOAs and sideslip angles.By comparing with the wind tunnel test data,the ability of the numerical method to characterize the aerodynamic characteristics, especially the stall characteristics of the whole aircraft after icing is verified.Under the condition of no side slip,the calculated macro aerodynamic force and moment are in good agreement with the test results,and can reflect the change trend of the aerodynamic characteristics of the whole aircraft after stalling.Fig.3 shows the comparison data(including lift coefficient C,pitching moment coefficient Cand sideslip force coefficient Crespectively)of the simulation and wind tunnel test of the aerodynamic characteristics of the whole aircraft when sideslip angle β=6°.Through a large number of numerical simulations, it is concluded that as the sideslip angle increases,the resistance of the whole aircraft rises and the longitudinal static stability decreases, but the lift characteristics are unchanged. Under over-stall conditions, the side force, yaw moment and roll moment values are reduced in an approximately linear form.At large sideslip angles,the changes in aerodynamic forces and moments are consistent with the intermediate sideslip angles, and the nonlinear characteristics of lateral aerodynamic forces are more significant.
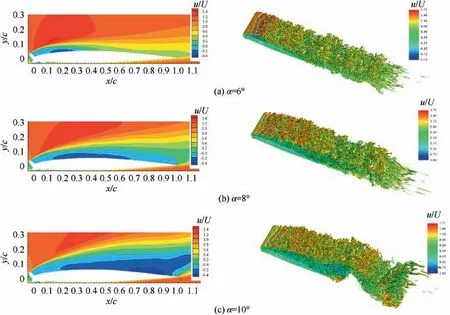
Fig. 2 Time-averaged and transient flow field distribution at different AOAs.

Fig. 3 Comparison between calculation results and wind tunnel test value when β = 6°.
In general,wing icing causes the slope of the whole aircraft lift line and the longitudinal static stability to be reduced to varying degrees,especially seriously affecting the aerodynamic characteristics near the aircraft’s stall point,which leads to the general advance of the stall AOA. The maximum lift coefficient is greatly reduced, and the nonlinear characteristics of the operation stability-related aerodynamic force and moment are apparent. After the stall, the lift characteristics of the whole aircraft are highly unstable, the bowing moment increases rapidly,and the aerodynamic boundary of the whole aircraft shrinks sharply.
2.2. Coupling simulation method of aerodynamics and flight dynamics
Aimed at coupling characteristics of aerodynamics and flight dynamics under icing conditions of background aircraft, an integrated parallel simulation platform combining a highprecision unsteady flow field solver (described in Section 2.1)and flight simulation software was developed and a two-way coupling solution strategy was proposed. Generally, there are two commonly used solutions for coupling calculation of aerodynamics and flight dynamics: loose coupling strategy and tight coupling strategy, and this paper uses the loose coupling strategy. The loose coupling strategy is an algorithm that solves the fluid control equation N-S equation and the aircraft rigid body motion/dynamics equation independently in their respective time domains, and the interleaved time advances to obtain the system coupling solution. In each step of time advancement, there is only one data exchange between the flight mechanics equation and the N-S equation. The specific algorithm steps are shown below (Fig. 4). The effectiveness of the coupling algorithm was verified through a typical twodimensional NACA0012 airfoil forced pitch oscillation calculation example.
(1) Transfer the flight state parameters (mainly including flight speed, AOA, sideslip angle, angular velocity and displacement of aircraft in three directions) from the previous time step to the fluid control equation.
(2) Update the flow field grid and boundary condition settings according to the flight state parameters of the current time step, solve the N-S equation, and obtain the aerodynamic force and aerodynamic moment of the current time step.
(3) Transfer the aerodynamic force and aerodynamic moment of the current time step to the flight dynamics equation for the solution, obtain the flight state parameters of the next time step,and transfer them to the N-S equation.
(4) Continue iterating according to the above steps until the total time is reached and the simulation ends.
Considering the computational efficiency,the time step can be defined as the time scale of ice growth, which can be set as 20 s,that is,the grid of ice shape is updated every 20 s.During this step,the grid of ice shape is not updated when interacting with flight mechanics, and only the incoming flow conditions are changed.When the model is a whole three-dimensional aircraft,the RANS method based on the Spalart-Allmaras turbulence model is adopted because of the huge amount of calculation by the IDDES method.
Therefore, the integrated parallel simulation platform can realize the research of the aerodynamic and flight dynamic coupling characteristics under icing conditions at three levels,namely, unsteady aerodynamic analysis under twodimensional airfoil fixed ice shape conditions,the aerodynamic and flight dynamic coupling analysis of the whole threedimensional aircraft under the condition of fixed ice shape,and the aerodynamic and flight dynamic coupling analysis of the whole three-dimensional aircraft under the condition of dynamic icing. A part of the result of a dynamic icing simulation example is shown as follows: Fig. 5 shows the change of flight attitude under the condition of dynamic icing obtained by coupling simulation;Fig.6 shows the airfoil separation flow pattern and space flow field structure of the background aircraft at a certain moment in the process of coupling simulation.
2.3. Risk management module based on quantitative assessment and visualization of flight risk
Before entering the icing area, the quantitative assessment method of flight risk can enable the pilot to perceive possible flight risks in advance, prepare for upset situations or replan the flight path. After entering the icing area, the visualization method of flight risk can inform the pilot of the flight risks that may be caused by various manipulations, and then guide the pilot to perform safety maneuvers.
2.3.1. Quantitative assessment of flight risk based on multiple extreme value theory
The Monte-Carlo method was adopted to extract the extreme value samples of the key flight parameters that characterize the risk under icing conditions.On the basis of samples,multivariate copula extreme value distribution models were established to calculate the flight risk probability.
(1) Monte-Carlo method
Using multivariate copula theory to estimate flight risk requires a large amount of flight data under icing conditions.However, the actual flight data obtained under icing conditions are too rare to be used for the construction of quantitative risk assessment models.Therefore,the Monte-Carlo flight simulation experiment method was adopted.
(2) Multivariate copula extreme value distribution model
Since a flight accident is a low-frequency event with a small probability,for such a small probability event(the probability is on the order of 10), the experimental statistical frequency method cannot be used to determine the probability. Evaluating the probability of a small probability event under a limited sample size is a problem worthy of in-depth study. Extreme value theory provides good theoretical support for solving this problem.The disaster mechanism of flight accidents caused by icing is very complicated, and the main disaster factors are often more than one. Therefore, multiple extreme values of flight parameters are used to assess flight risk. However, there is a strong interdependence among these flight parameters.Copula theory mainly studies the correlation and dependency structure of multidimensional variables, and is widely used in financial and natural disaster risk assessment with its excellent characteristics of nonlinearity, asymmetry and tail correlation between variables.
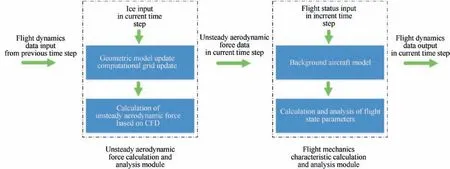
Fig. 4 Flowchart of coupling simulation of aerodynamics and flight dynamics.

Fig. 5 Flight parameter change curves.
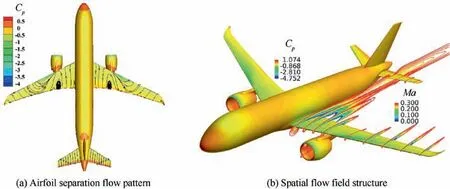
Fig. 6 Airfoil separation flow pattern and spatial flow field structure of background aircraft.
This paper takes two-dimensional extreme values as an example, and four commonly used distribution models for the two-dimensional extreme parameters were constructed:the Gumbel copula model (Eq. (1)), Frank copula model(Eq. (2)), GS copula model (Eq. (3)), and Joe copula model(Eq. (4)).
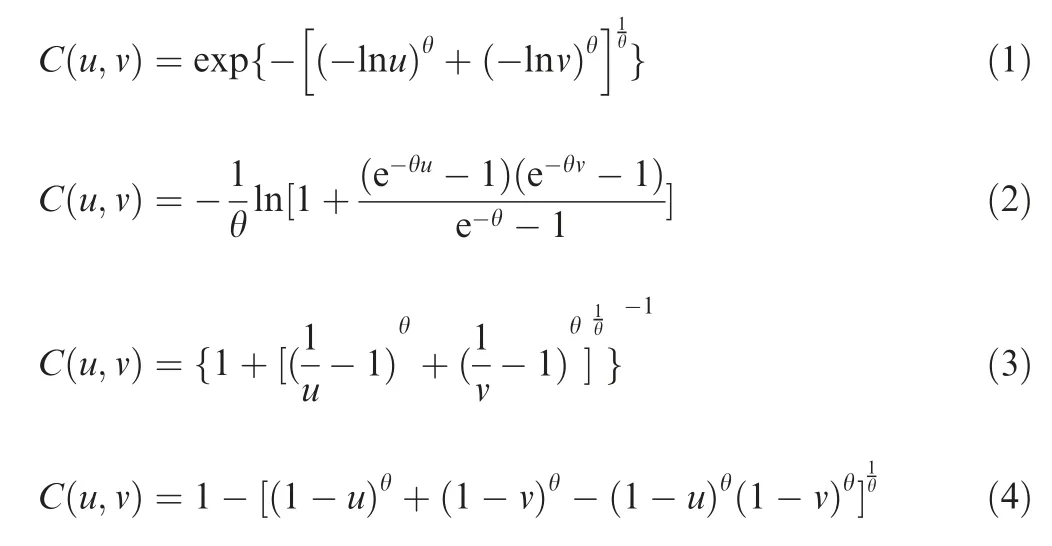
where u and v are one-dimensional extreme value distribution models respectively, θ is an unknown parameter of the distribution models, and the unknown parameters are identified based on the adaptive range particle swarm optimization algorithm.In addition,the Akaike Information Criteria(AIC),the Bayesian Information Criteria (BIC), the χtest, and the K-S test are used to evaluate the goodness of fit for the four models and select the optimal model. Fig. 7 shows the results of the quantitative assessment of flight risk under icing conditions of underground aircraft. The AOA extreme value and normal overload extreme value were selected as the key parameters of flight risk,and the Joe copula model was finally selected to calculate the flight risk probability.
2.3.2. Visualization of flight risk based on safety space theory
The visualization of flight risk can effectively enhance the pilot’s awareness of situational awareness when manipulating aircraft in complex situations. This paper is based on the theory of flight safety space to visually describe the flight risk under icing conditions. It provides the safety range of key flight parameters and the risk level of flight status under the influence of adverse factors in the form of a colorized cloud chart, which provides the pilot with risk warning and avoidance, and manipulation instructions under icing conditions.
(1) Risk quantification of a single status point
The flight parameter values in different intervals are presented in a colorized form, as shown in Fig. 8 (taking the AOA as an example).The color bars in Fig.8 indicate the risk colorization interval corresponding to the flight state parameter, in a certain flight situation. By arranging the risk colors corresponding to the risk interval of flight parameters at each moment in the time series, the chromatogram of these flight parameters can be obtained. The chromatographic signals of different flight parameters in a single flight situation are superimposed to obtain the flight safety spectrum in the flight situation. Obtaining the safety spectrum can intuitively reveal the evolution process of flight risk in a single flight situation.
(2) Spatial risk distribution calculation based on flight safety space
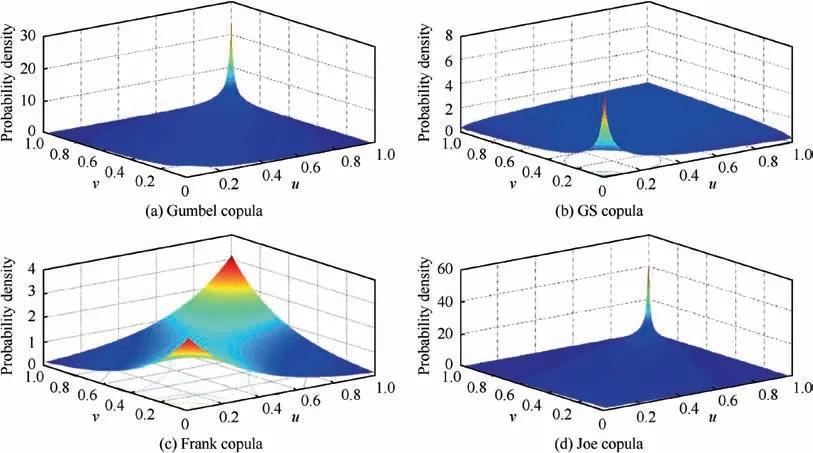
Fig. 7 Flight risk probability density.
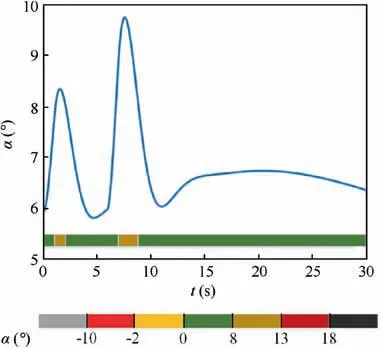
Fig. 8 Colorization interval of AOA.
On the basis of obtaining the flight risk quantification of a single status point, the flight space formed by the commanded roll angle and the commanded heading angle is used as the calculation area, and the calculation area is divided into many calculation units. Each unit corresponds to a flight situation, and then the topological contour of the entire control space risk field can be obtained, namely the flight safety space, as shown in Fig. 9, and this flight space is composed of flight altitude change rate, flight speed, and roll angle.The different colors represent different degrees of risk, and the color illustration on the right of the figure lists the colors corresponding to different risk values (R). To further visually show the internal risk topology structure of the safe space,the corresponding risk distribution under different command speeds is displayed on a two-dimensional plane,and the result is shown in Fig. 10. The risk distribution map in this twodimensional space is called a safety window, which reveals the safe operating range of the aircraft at different commanded flight speeds.
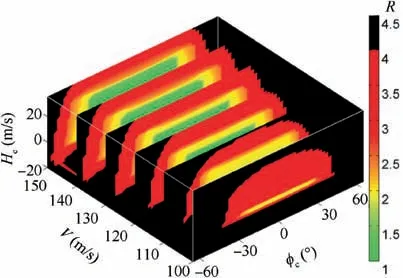
Fig. 9 Flight safety space.
2.4. Envelope protection module based on region of attraction and dynamic inversion control theory
Generally, flight accidents are often accompanied by certain critical flight parameters exceeding their limits. Flight safety envelope protection means limiting the boundary values of certain important flight parameters, and is an effective means to ensure flight safety. First, the region of attraction theory is used to calculate the multidimensional flight safety boundary under icing conditions.Second, based on dynamic inversion control theory,the flight control law was reconstructed and designed, and then based on the idea of command limitation,the icing aircraft flight safety envelope protection system was designed.
2.4.1.Calculation of flight envelope based on region of attraction theory
If there is a continuously differentiable function L, when R→R, it satisfies

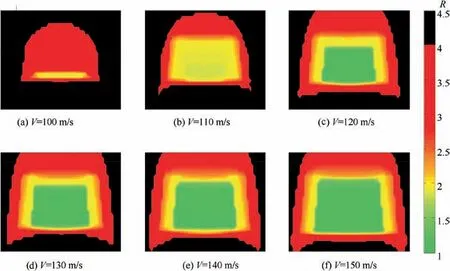
Fig. 10 Flight safety windows.
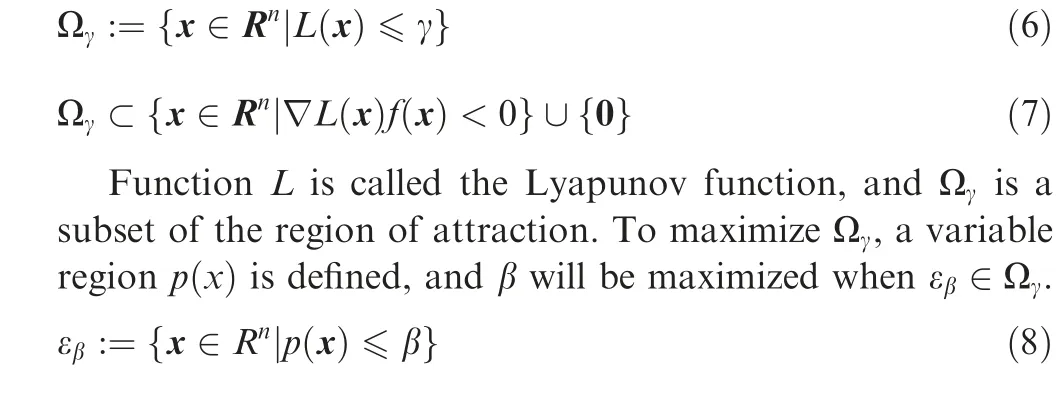
Using the Positivstellensatz theorem in algebraic geometry,the optimization problem can be transformed into the following Sum-Of-Squares Programming (SOSP) problem, which is solved based on SOS theory.This paper takes the longitudinal two-dimensional region of attraction as an example, and the calculation results are shown in Fig. 11.
The red curve represents the trajectory where the initial state point eventually evolves to divergence,and the blue curve represents the trajectory where the initial state point eventually evolves to the equilibrium point. The area enclosed by the green curve is the calculated region of attraction. The region of attraction is located in the stable range near the equilibrium point and occupies most of the stable range area.Starting from every state point in the region of attraction can return to the equilibrium point, indicating that although the stability boundary calculated by SOS theory is conservative and cannot fully cover the entire stability range, it can reflect the stability range of the aircraft near the equilibrium point.
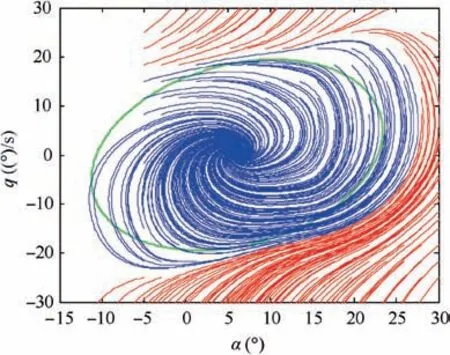
Fig. 11 Region of attraction of underground aircraft.
2.4.2. Envelope protection based on dynamic inversion control theory
Nonlinear dynamic inversion control is a kind of feedback linearization method.Its essence is to transform the original nonlinear system into an equivalent pseudolinear system through nonlinear feedback,and then realize the corresponding control according to the classic linear control theory.For background aircraft, the typical nonlinear dynamic inversion control law can be divided into two loops, a fast loop and a slow loop,for separate control. The fast loop realizes the control of the aircraft’s angular rate parameters p, q, r, and its outputs are the aircraft rudder surface deflection angle δ, δ, δ; the slow loop realizes the control of the aircraft’s airflow angle β, α,μ,and its output parameters are the aircraft angular rate command signals p, q, rwhich pass to the fast loop as input.
Since dynamic inversion control has good tracking performance and steady-state performance, it can be applied to the flight envelope protection system to protect specific flight parameters. A schematic diagram of the icing flight envelope protection system based on nonlinear dynamic inversion is shown in Fig. 12.
As shown in Fig. 12, the icing flight envelope protection system consists of four modules:
(1) Flight envelope calculation module
According to the current icing severity and flight status,the boundary value of flight parameters after icing is calculated based on the region of attraction theory.Considering the measurement error,a reasonable safety margin is set,and the value of the boundary value minus the safety margin is taken as the input of the dynamic inversion module.
(2) Dynamic inversion module
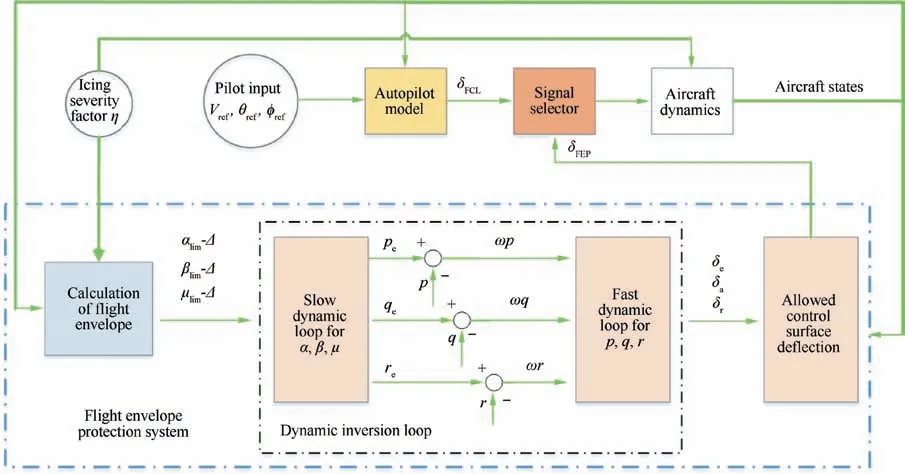
Fig. 12 Schematic diagram of icing flight envelope protection system.
According to the calculation results of the flight envelope calculation module as input, the available limit values of the elevator, aileron and rudder deflection angle are calculated.
(3) Autopilot model
According to the pilot’s input command,the corresponding control input is calculated automatically.
(4) Signal selection module
The final control surface deflection is determined by comparing the control surface output value calculated by autopilot model with the available control surface deflection limit value calculated by dynamic inversion module.By limiting the actual rudder surface deflection angle of the aircraft in real time to exceed the maximum allowable deflection angle,the controlled parameters of the aircraft can always be within the safe range.
2.5. Distributed simulation
Since IRMAPS involves the calculation of a large number of mathematical models during operation, a single computer has difficulty in meeting the requirements of large-scale realtime calculation and data transmission. Therefore, as shown in Fig. 13, based on distributed simulation technology, the IRMAPS is divided into 7 subsystems according to their functions, namely, the main flight simulation node, console node,visual display node, flight risk display and warning display node, simulation cockpit and flight instrument display node,icing flight indication and warning node based on Mixed Reality (MR) technology, and database storage node, which are arranged at different nodes, and data interaction and simulation calculation are carried out through multiple computers to realize the overall function of the IRMAPS.All nodes form a topological network centred on the main flight simulation node through reflective memory boards, reflective memory switches and multimode fibre interconnection.
2.5.1. Main flight simulation node
The main flight simulation node mainly realizes the functions of flight dynamics simulation, including aircraft initial state setting, flight state trim, loading icing aerodynamic model,loading failure (e.g., rudder jam, rudder efficiency reduction,sensor failure, unilateral deicing system failures, and engine failures), loading wind effects (e.g., turbulence, wind shear,and gusts), loading flight envelope protection, loading icecontaining reconstruction flight control and other functions,realizing human-in-the-loop or full-digital virtual flight simulation.
Aimed at the flight simulation of background aircraft under icing conditions, the aerodynamic parameters after icing with different severity levels are interpolated calculations based on the aerodynamic database obtained from high-precision flow field numerical calculations and wind tunnel tests. Due to space limitations, the flight dynamics model, failure model,external wind field model,autopilot model and fly-by-wire system model are not elaborated in this paper.The above models were developed based on the Simulink platform. The simulation system built by Simulink is compiled into C code supported by VxWorks (a real-time system) through real-time workshop, and then downloaded to LINKS-RT (a real-time simulator) for real-time calculation.
The flight data calculated by the real-time simulator pass through the reflective memory network to other required nodes such as the visual display node and the virtual instrument display node,to display the aircraft’s flight position,attitude and other information. The database storage node receives flight data from the main simulation node and stores it in the database for later recall and analysis.The flight risk assessment and warning display node realizes real-time warning of pilot manipulation according to the response of aircraft characteristic parameters under icing conditions, reminding the pilot to avoid improper manipulation, and meanwhile, providing the pilot with a comprehensive visual warning based on the icing position, the severity of icing, the degree of critical flight parameters beyond the safe range and the icy meteorological area passed by the flight route during icing flight. The icing flight indication and warning node of MR technology receives the data sent by the main flight node, and provides the pilot with guidance and warning through the Head-Up Display(HUD)indication interface displayed on the mixed reality helmet glasses.
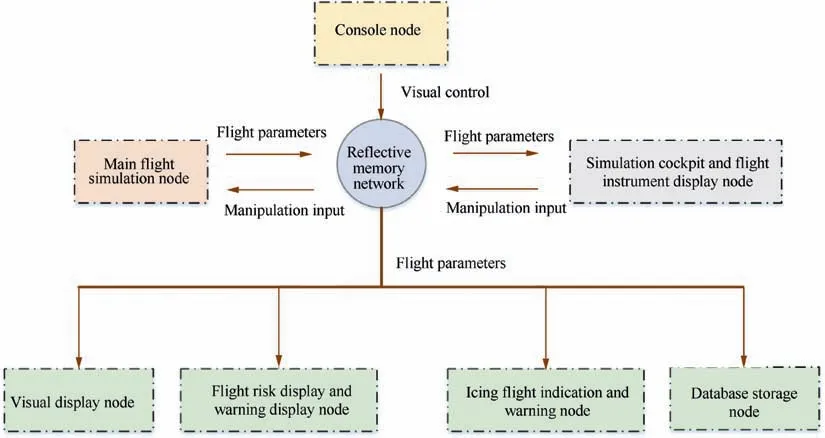
Fig. 13 Schematic diagram of flight safety simulator.
2.5.2. Console node
The console software is the only data interaction interface among the instrument display control, visual scene, sound effect and other modules in the entire system and the main simulation node. It mainly realizes the control of the visual flight scene, model data communication monitoring, virtual instrument communication monitoring, sound effect control, and test data recording and playback functions.
(1) The flight angle of view can be changed through eye point control, including the pilot angle, aircraft tail angle, forward aircraft angle, aircraft rear angle, and free eye point setting options. The weather conditions in the flight scene (cloudy, sunny, rainy and snowy)can be changed by setting the meteorological conditions;the height and thickness of the clouds in the scene can be controlled by setting the cloud and icing conditions,and the icing weather parameters (atmospheric temperature,Median Volume Diameter (MVD), and Liquid Water Content (LWC)) affect the concentration of clouds and the content of supercooled droplets.
(2) The model data and virtual instrument communication interface are designed to monitor whether the flight parameter communication from the main flight simulation node to the visual display node and the virtual instrument node is normal.
(3) The data curve interface is designed to observe the response curve of key parameters.
2.5.3. Visual display node
Fig. 14 shows the hardware composition of the visual display system. The visual display node is composed of three projectors: a fusion controller, a visual computer and a projection curved cylindrical screen. The visual computer processes the visual environment data according to the aircraft position and attitude, environmental parameters, eye point position and other information provided by the flight simulator and the integrated console, and generates realistic, stable and real-time image information within the designated field of view. Then, the edge fusion of the signal of each projection channel is performed by the fusion controller, so that the whole figure on the projection curved cylindrical screen has no physical or optical gaps.
To simulate icing weather conditions vividly,the visual system can be controlled by the console software to change the weather conditions in real time, such as the fog effect, clouds,rain,snow,and duration.The vision system integrates a global landscape database and a large number of civil airport landscape libraries,which can provide support for simulation training flights in specific terrain environments, support the development of user-customized model plug-ins, and observe the dynamic changes of the aircraft’s 3D model, landing gear and rudder surface from a third perspective. The following is a view of the actual flight simulation (Figs. 15-17).
2.5.4. Flight risk display and warning display node
Based on the quantitative assessment and visualization methods of flight risk introduced above, a flight risk assessment and warning display system under icing conditions is constructed to realize dynamic real-time identification of flight risks and the corresponding warning display. Fig. 18 shows the risk identification interface for safe operation and dangerous operation.
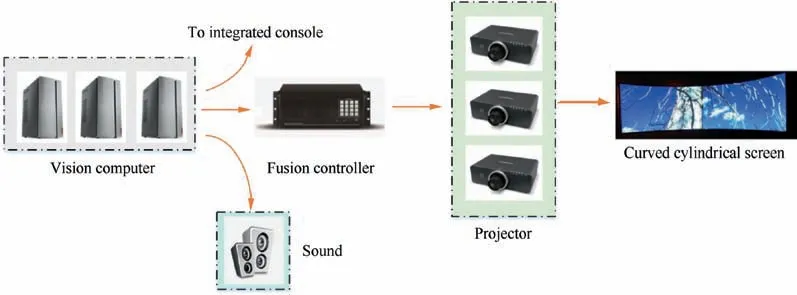
Fig. 14 Hardware composition of visual display system.
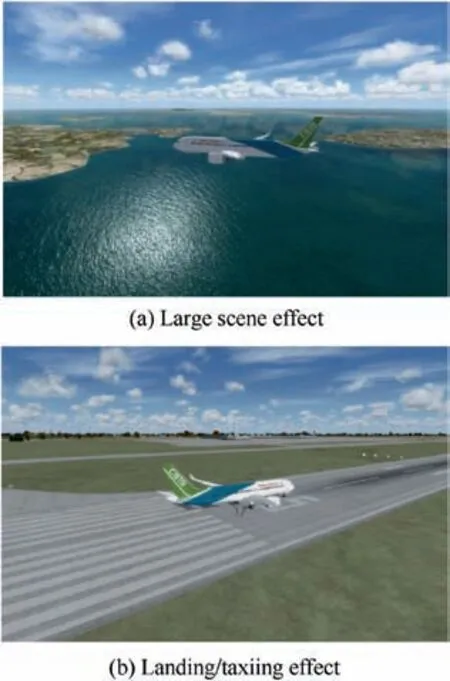
Fig. 15 Air flight and ground taxiing scene.
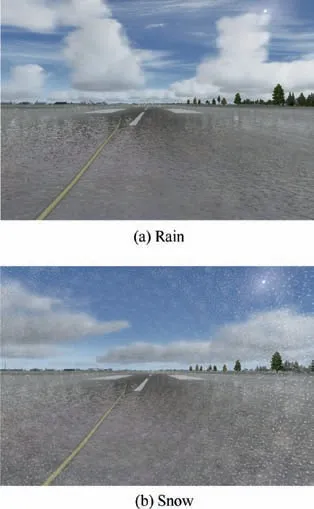
Fig. 16 Simulation scenarios of different weather conditions.
Fig. 19(a) shows the critical flight parameter over-limit warning interface under icing conditions. Through crosslinking with the simulation system, the key parameter values such as flight airspeed, AOA, sideslip angle, pitch angle, roll angle, and normal overload are obtained, and the above parameter values are processed and converted according to the risk quantification of a single status point proposed above.The larger the safe value is, the safer it is, and it is displayed dynamically in the form of a progress bar. When the progress bar changes from left to right,it means that the safety value is gradually reduced,and the color changes from green to yellow to red. Among them, green indicates that the parameter value is within the design limit, yellow indicates that the parameter value has a tendency to exceed the limit and requires close attention,and red indicates that the parameter value is severely exceeded. With this colorized representation, the dynamic changes of key safety parameters and whether they are overrun are displayed in real time.The purpose is to remind the pilot to pay close attention to the changes of flight parameters and prevent improper control from causing parameter overrun.
Fig. 19(b) shows the icing risk warning interface of the designed icing flight route. Based on the icing weather condition data in the visual system and the risk quantitative assessment method proposed above, the potential icing area within the 180°forward direction of the aircraft is displayed in different color according to the divided risk levels. Among them,green is the area with low risk,yellow is the area with medium risk,and red is the area with higher risk.The warning interface can provide effective guidance for the pilot to reasonably choose the route.
2.5.5. Simulation cockpit and flight instrument display node
According to the cockpit layout characteristics of a typical large aircraft, the simulated cockpit and virtual flight instruments of the background aircraft are constructed, and control mechanisms such as joysticks, throttle sticks, side sticks, and pedals are installed,as shown in Fig.20.The simulation cockpit and flight instrument display nodes serve as human-computer interaction interfaces to provide the pilot with realistic and real-time flight control simulation. This node includes two modules: the cockpit man-machine interface module and the cockpit data acquisition and transmission module.
The cockpit man-machine interface module displays the aircraft position,attitude,engine status,and deflection of each rudder surface in the form of a virtual instrument.The cockpit data acquisition and transmission module is used to collect and send the input signals of control devices such as joysticks,throttle sticks, and pedals, and collect and send control panel signals including spoiler control panels, flap control panels,trim control panels, and landing gear control panels.
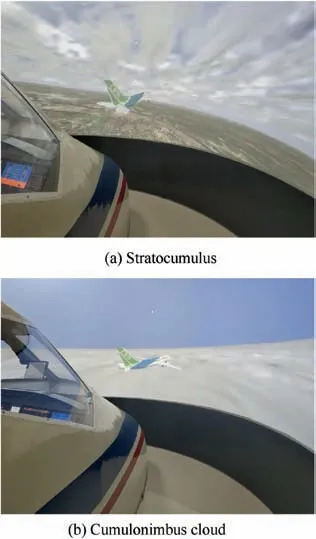
Fig. 17 Flight vision under different icing weather conditions.
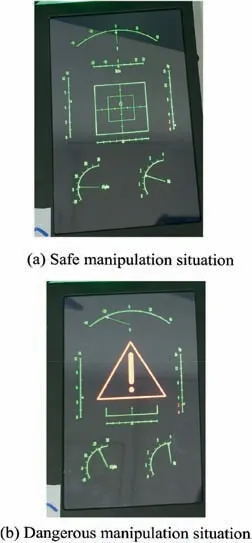
Fig.18 Real-time manipulation risk identification display screen under icing conditions.
2.5.6. Icing flight indication and warning node based on MR technology
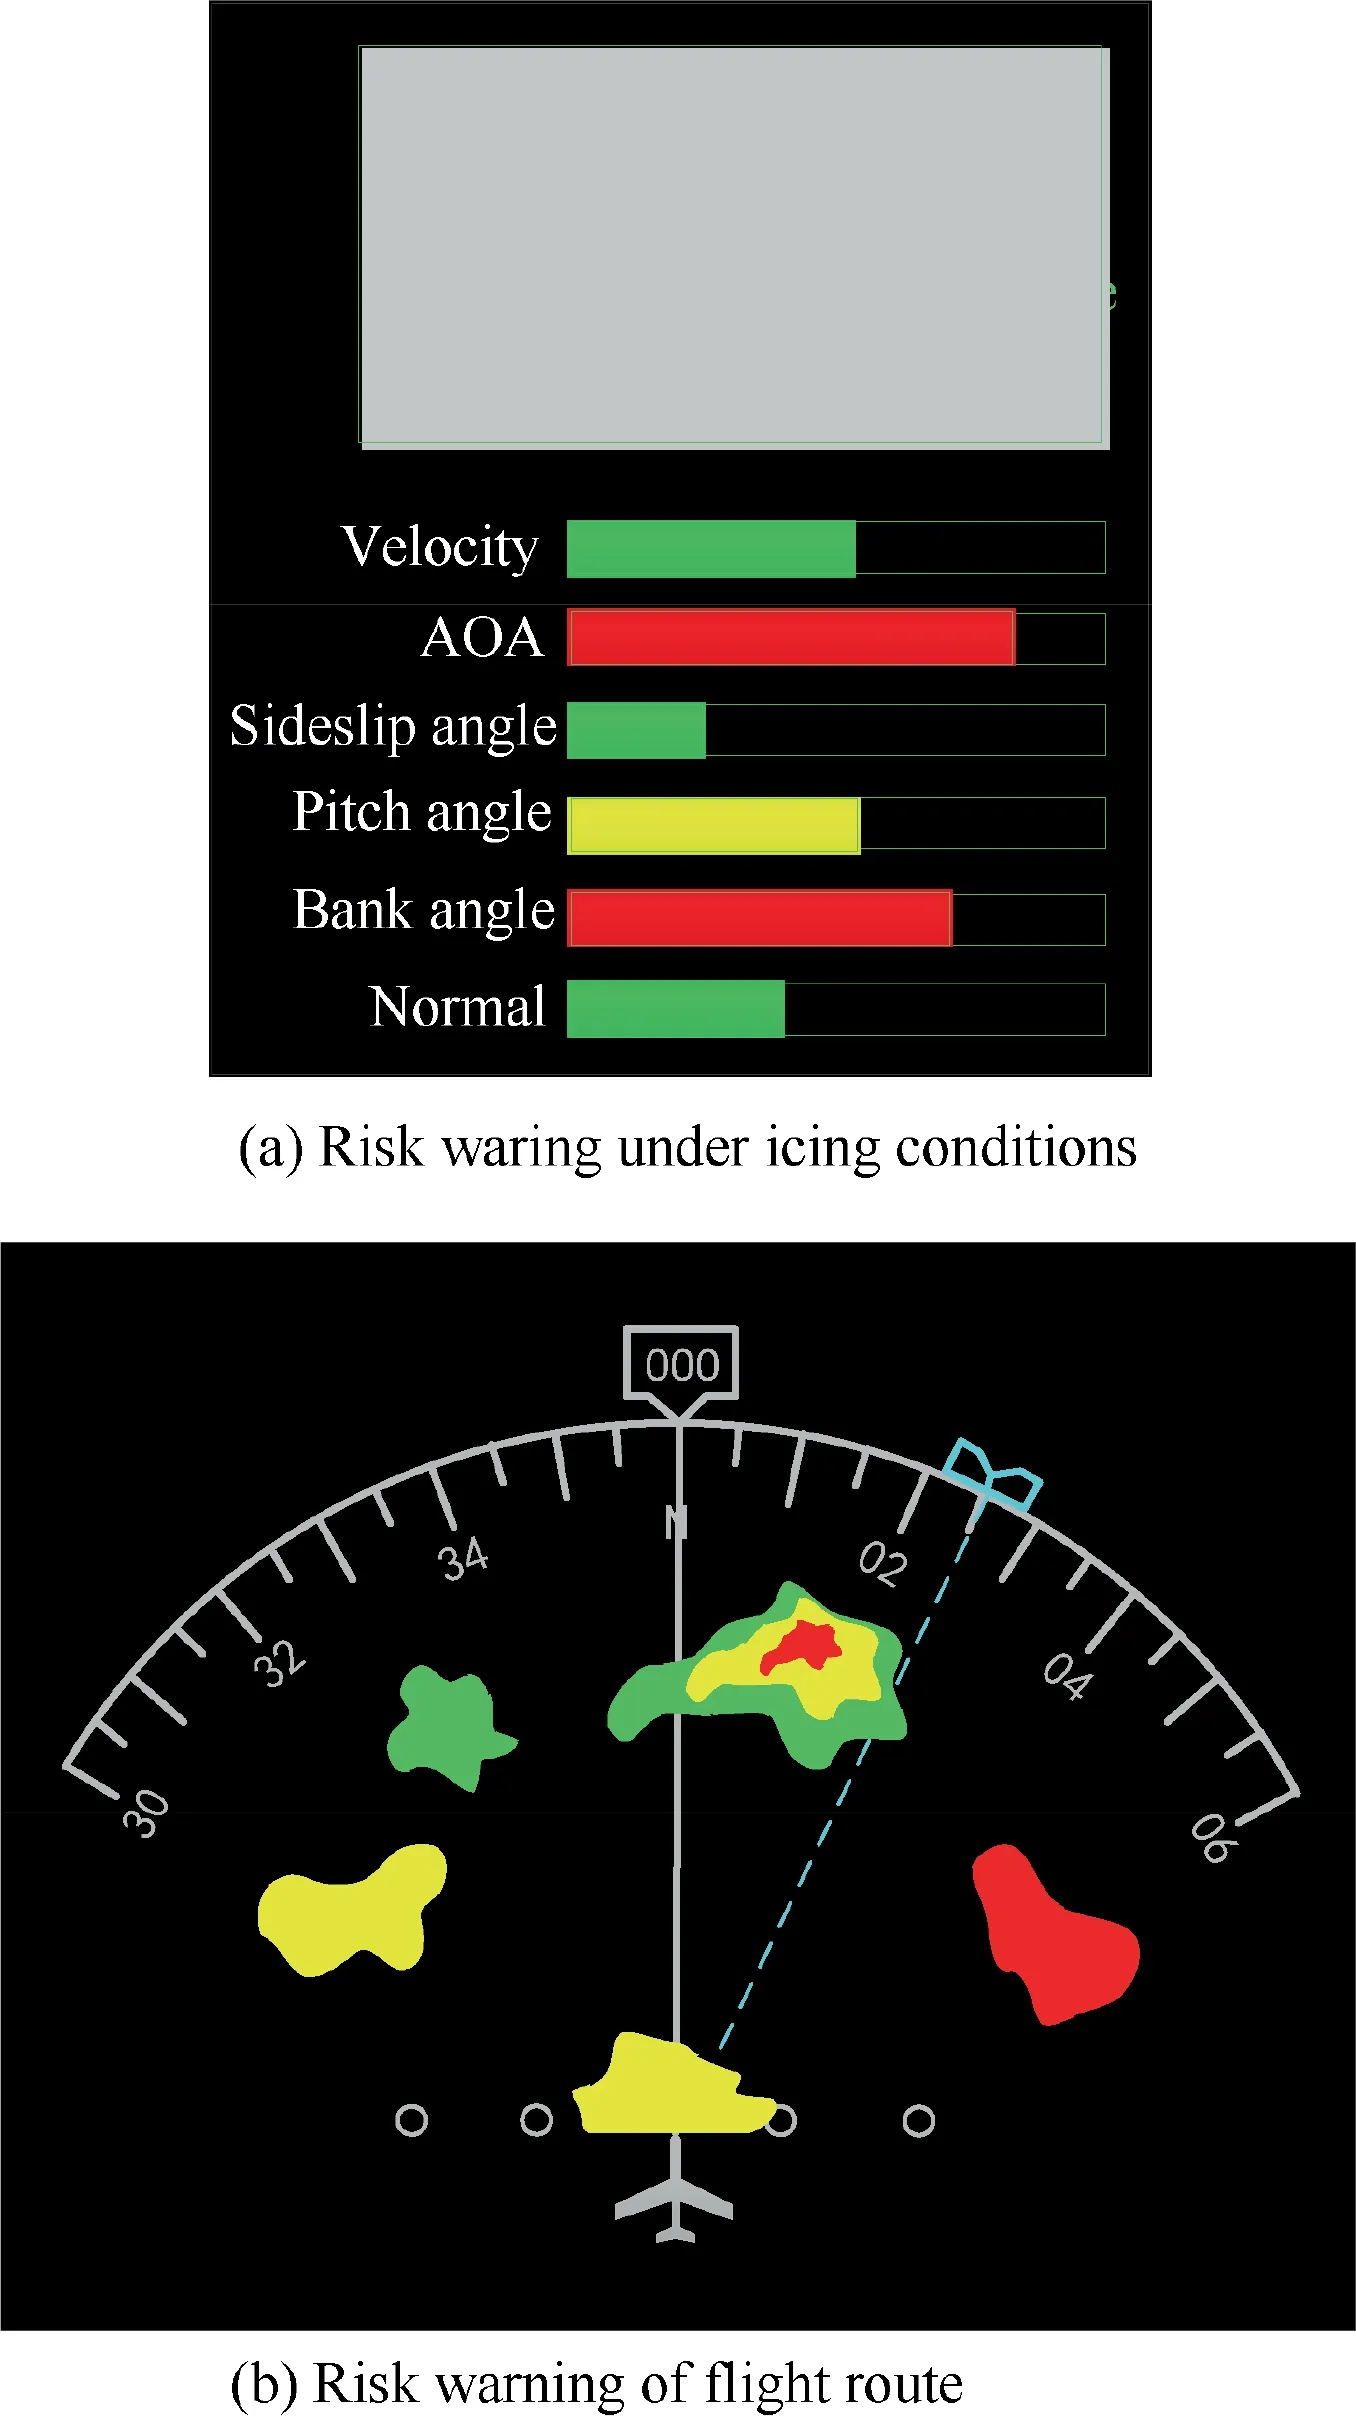
Fig. 19 Icing flight warning screen.
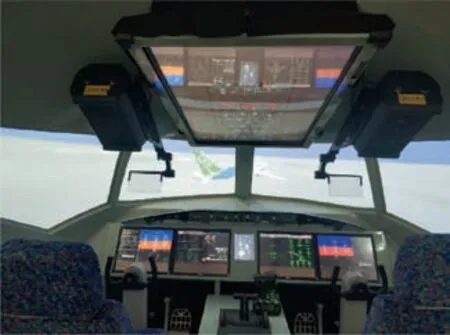
Fig. 20 Simulation cockpit and virtual flight instrument.
To enhance the pilot’s immersive experience of maneuvering the aircraft under icing conditions, and to realize dynamic Head-Up Display (HUD) indication under icing conditions,an icing indication system based on MR technology was developed.
As an auxiliary display device, the HUD can project aircraft flight information(such as key flight parameters,attitude,and navigation information)on the perspective mirror directly in front of the pilot’s field of view,so that the pilot could maintain a head-up view while taking into account both the instrument parameters and external visual reference objects in the same field of view.Compared with the traditional way of looking down at the flight instrument,HUD significantly enhances the pilot’s situational awareness, saves the pilot’s response delay caused by the pilot’s head down and eye focus adjustment, and effectively promotes flight safety. Considering that the actual HUD equipment used in civil aviation is relatively expensive, a design scheme based on mixed reality technology is proposed to realize the HUD dynamic indication function.Specifically, by letting the pilot wear the HoloLens helmet developed by Microsoft,and using augmented reality technology to dynamically display the designed HUD indication screen on the glasses of the helmet, the pilot can master the flight attitude and other information in real time without affecting the external vision.
The icing flight indication and warning system mainly accesses flight simulation data and displays the data on the helmet glasses.It mainly includes the following four modules:network transmission module, UI module, gesture operation module and flight attitude display and alarm information module (HUD module). The network transmission module is responsible for connecting flight parameter data into the Holo-Lens helmet augmented reality helmet;the UI module and the gesture operation module are responsible for managing user gesture input and operating and switching the display page respectively.The flight attitude display and alarm information module mainly responds to process the received flight parameter data with corresponding algorithms, and further displays it on the HUD interface. Fig. 21 shows the system display effect.
2.5.7. Database storage node
A database management program was developed based on the SQL server platform,which can receive real-time flight simulation data, support structured queries and displays, and compare and analyze previous simulation results.
3. Flight simulation test of two typical icing flight scenarios
Based on the IRMAPS, human-in-the-loop flight simulation training under icing conditions of background aircraft was carried out, so that the pilots can experience the impact of icing on aircraft performance and stability characteristics. Simulations were carried out for typical icing flight accidents, which provided effective guidance for the pilots to operate the aircraft safely under icing conditions.
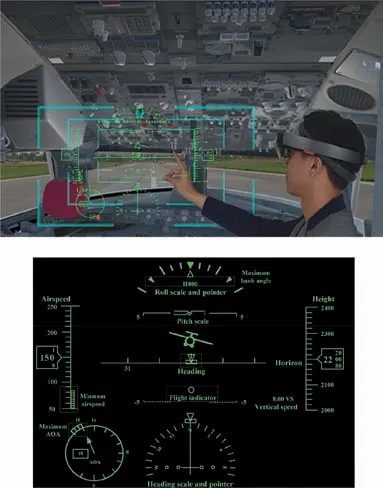
Fig. 21 Comprehensive display effect.
3.1. Landing with wing icing
Simulations of the successful landing of the aircraft and the occurrence of an accident under the condition of wing icing are given below. The simulation conditions are set as follows:the initial altitude is 500 m,the flight path angle is-3°,and the speed 85 m/s is aligned with the runway centreline. The aircraft’s control stabilization system adopts the flight path angle command control configuration.The wing is set to icing when the aircraft crosses an icy weather zone before the landing approach. Fig. 22 and Fig. 23 show the pilot’s landing trajectory when the IRMAPS is turned on or not, respectively.
The pilot needs to adjust the pitch attitude of the aircraft during the landing approach; however, the icing of the wing causes the stall AOA to decrease. During this period, the AOA of the aircraft may exceed the stall AOA.If the pilot uses the wrong control, that is, pulls control stick to level off when the IRMAPS is not turned on,it will cause the aircraft to stall and cause a flight accident, as shown in Fig. 22.
When the IRMAPS is turned on,firstly,before landing,the system will estimate the risk of wing icing landing in advance.Secondly, during landing, the system will prompt the pilot to operate correctly: when the flight speed of the aircraft is close to the stall speed,the throttle lever should be pushed quickly to accelerate, and the lever should be appropriately pushed to ensure that the AOA is gradually reduced. After the flight speed is greater than the stall speed, the lever is slowly pulled to complete the landing. At the same time, the system will ensure that the flight parameters are always within the safe range, even if the pilot takes the wrong control. However,due to the increased speed of the landing approach, a longer runway distance is required, as shown in Fig. 23.
3.2. Roll upset event due to aileron icing
In the working state of the deicing system, the icing on the leading edge of the wing melts and flows to the aileron to refreeze,forming an ice ridge,resulting in turbulence in the flow field on the upper surface of the aileron and abnormally increasing aileron control moment. Therefore, it is difficult for the pilot to control the ailerons to balance the roll attitude,which leads to a roll upset event and eventually causes the plane to fall to the ground, as shown in Fig. 24. Combined with the accident investigation report and related data, it can be seen that the movement trend during the flight accident simulated in this paper is similar to the real accident process,indicating that the simulation analysis of the existing flight accident based on the IRMAPS is reasonable and feasible.
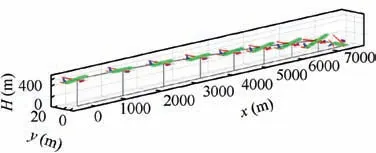
Fig. 22 Landing accident trajectory when IRMAPS is not turned on.
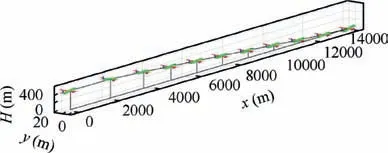
Fig. 23 Successful landing trajectory when IRMAPS is turned on.
4. Conclusions
In summary, compared with current similar systems, the IRMAPS has the following advantages:
(1) On the basis of the coupling simulation method of aerodynamics and flight dynamics under icing conditions,IRMAPS can simulate the complex flow field and unsteady aerodynamics of aircraft after icing so as to ensure that flight simulation results are more accurate.
(2) The function of IRMAPS is more perfect and practical,and mainly has the following four functions: (A) By using the Monte-Carlo method and multivariate extreme value theory, we propose a method to quantitatively assess the flight risk under icing conditions, and on this basis,IRMAPS can enable the pilot to perceive possible flight risks in advance, prepare for upset situations or replan the flight path before entering the icing area.(B) Based on safety space theory, we propose a visualization method of flight risk, and on this basis, the IRMAPS can inform the pilot of the flight risks that may be caused by various manipulations,and then guide the pilot to perform safety maneuvers after entering the icing area. (C) By using region of attraction theory and dynamic inversion control theory, we propose a realtime boundary protection method of key flight parameters, and on this basis, IRMAPS can realize the flight safety guarantee of aircraft in ice-containing flight. (D)Based on distributed simulation technology and flight simulator, IRMAPS can enable pilots to accurately experience the impact of icing on aircraft control, carry out Upset Prevention and Recovery Training (UPRT),and reproduce flight accidents to find the causes of the accidents.
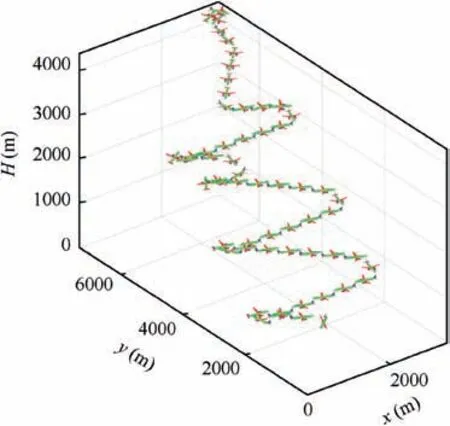
Fig. 24 Flight path of an icing accident.
At the same time,the computing power of IRMAPS should be improved, so that when the calculation model is a threedimensional complete machine, the IDDES method can be used for flight simulation calculation,so as to improve the calculation accuracy.
The authors declare that they have no known competing financial interests or personal relationships that could have appeared to influence the work reported in this paper.
This study was co-supported by the National Basic Research Program of China(No.2015CB755802)and the National Natural Science Foundation of China (No. 61873351 and No.62103440).
