Characteristics of reattached boundary layer in shock wave and turbulent boundary layer interaction
Fulin TONG, Junyi DUAN, Xinliang LI,*
a State Key Laboratory of Aerodynamics, China Aerodynamics Research and Development Center, Mianyang 621000, China
b Computational Aerodynamics Institute, China Aerodynamics Research and Development Center, Mianyang 621000, China
c LHD, Institute of Mechanics, Chinese Academy of Sciences, Beijing 100190, China
d School of Engineering Science, University of Chinese Academy of Sciences, Beijing 100049, China
KEYWORDS Amplitude modulation;Shock wave;Skin friction decomposition;Structural inclination angle;Turbulent boundary layer
Abstract The reattached boundary layer in the interaction of an oblique shock wave with a flatplate turbulent boundary layer at Mach number 2.25 is studied by means of Direct Numerical Simulation(DNS).The numerical results are carefully compared with available experimental and DNS data in terms of turbulence statistics,wall pressure and skin friction.The coherent vortex structures are significantly enhanced due to the shock interaction, and the reattached boundary layer is characterized by large-scale structures in the outer region.The space-time correlation of fluctuating wall shear stress and streamwise velocity fluctuation reveals that the structural inclination angle exhibits a gradual decrease during the recovery process.The scale interactions are analyzed by using a twopoint amplitude modulation correlation. A possible mechanism is proposed to account for the strong amplitude modulation in the downstream region. Moreover, the mean skin-friction is decomposed to understand the physically informed contributions. Unlike the upstream Turbulent Boundary Layer (TBL), the contribution associated with the Turbulence Kinetic Energy (TKE)production is greatly amplified, while the spatial growth contribution induced by the pressure gradient largely inhibits skin-friction generation. Based on bidimensional empirical mode decomposition,the turbulence kinetic energy production contribution is further split into different terms with specific spanwise length scales.
1. Introduction
Shock Wave and Turbulent Boundary Layer Interactions(SWTBLIs) have been extensively studied over the past 60 years because of their engineering interest and flow complexity. For strong interactions, the upstream Turbulent Boundary Layer (TBL) separates due to a large adverse pressure gradient, followed by a separation bubble formed in the interaction zone. Then, the detached flow moves around the bubble and reattaches downstream. It is well known that the Reattached Boundary Layer(RBL)is subjected to a relaxation zone.
A plethora of experiments and numerical computations have been performed in this research area.Although the source of the low-frequency unsteadiness is still under debate, significant advances in the low-frequency unsteadiness have been reported in the literature, as reviewed in Clemens and Narayanaswamy,showing that the driving mechanisms might be related to the upstream TBLor the intrinsic instability of the downstream separated flow.Another important feature of SWTBLIs is turbulence amplification, which has received comparatively more attention in recent decades. More recently, Fang et al.provided a comprehensive review and argued that the amplification of turbulence in the upstream and downstream parts of the interaction is essentially different;the former is mainly induced by the deceleration of mean flow,and the latter is strongly related to the generated free shear layer.
However,to date,a very limited number of SWTBLI experiments and computations have been performed to gain insight and knowledge of the fundamental physical phenomena associated with the RBL,in which peak heat transfer and skin friction coefficient often occur in the reattachment region. For example, Pirozzoli and Grassocarried out a DNS study of impinging SWTBLIs and revealed the occurrence of inclined streaky structures in the downstream region. In a follow-up work, Martin et al.studied the turbulence structure evolutions in the RBL including the structure angle, characteristic streamwise length scales and hairpin packets through a combined analysis of experimental and DNS data related to SWTBLIs in a compression ramp at Mach number 3 and Re=2100(Rebeing the momentum thickness of the incoming TBL).They suggested that the recovery process in the RBL might be fully completed 22δ-30δ downstream of the interaction (δ is the thickness of the upstream TBL). Applying dynamic mode decomposition to the reported DNS of a Mach number 2.9, 24° compression ramp, Priebe et al.found that the downstream region of the streamwise-elongated low and high momentum was linked to the low-frequency unsteadiness.Later, Zhuang et al.experimentally demonstrated the presence of Go¨rtler-type vortices in the RBL of impinging SWTBLIs and provided a possible mechanism to explain the generation.Despite this remarkable progress,the fundamental mechanism of the recovery process in RBL is not fully understood and therefore, needs to be further studied.
The aim of the present study is to improve the physical understanding of RBL in SWTBLIs by means of DNS. The study focuses in particular on the mean skin friction generation in the RBL. For this purpose, the skin-friction decomposition method in compressible flow, proposed by Li et al.,is combined with bidimensional empirical mode decomposition to analyze the DNS dataset of oblique SWTBLIs with mild separation at Mach number 2.25. To our knowledge, no studies have investigated the mean skin friction decomposition in SWTBLIs to date. This method has the capability to provide a physical interpretation of different contributing terms and quantify the contributions associated with specific spanwise length scales.
This paper is organized as follows. The numerical methodology of the DNS, including flow configuration, numerical algorithms and validation, is introduced in Section 2. In Section 3, characterization of the RBL is discussed, mainly in terms of structural inclination angle,inner/outer layer interaction and decomposition of mean skin friction. Finally, concluding remarks are provided in Section 4.
2. Numerical methodology
2.1. Flow configuration
Fig.1 presents a sketch of the computational domain in Cartesian coordinates (x, y, z) with dimensions L× L× L=137.6 mm × 12.7 mm × 4.4 mm,where L, Land Ldenote the size of the computational domain in the streamwise, wallnormal and spanwise directions, respectively.
The origin of the coordinate system is located at the inlet of the domain. A laminar supersonic boundary layer developing on a flat plate is tripped by wall blowing and suction(denoted by the gray region in Fig.1)to generate a fully developed zeropressure gradient turbulent boundary layer upstream of the interaction. An oblique shock wave with an angle of 33.2°,numerically generated by imposing Rankine-Hugoniot relations at the top of the domain, impinges on the incoming TBL with the nominal impingement point located at x= 101.6 mm. The inflow conditions approach the DNS of Fang et al.and the experiment of Dupont et al.,where the freestream Mach number is Ma= 2.25 and the freestream temperate is T= 169.44 K. The Reynolds number based on the boundary layer thickness of the TBL at x=94-mm is Re=ρUδ/μ=51087,very close to the value considered by Fang et al., with ρ, Uand μbeing the free stream density, velocity and viscosity, respectively. Throughout this paper, the subscripts ‘‘∞” represent the free stream parameters.
2.2. Computational setup
In our simulation, an open source high-order finite difference code (OPENCFD-SC), developed by Li et al., is applied,which has been used with great success in many DNS studies of turbulent flows.The governing equations in curvilinear coordinates (ξ, η, ζ) are written as follows:

where U contains the conservative variables and F, G and H denote the convective flux terms in the ξ, η, and ζ directions,respectively. F, Gand Hdenote the corresponding viscous flux terms.The working fluid is a perfect gas.The Sutherland’s law is used to calculate the viscosity coefficient, and the ideal gas state equation is enforced. A bandwidth-optimized fourth-order-accurate WENO scheme,with a combination of absolute and relative limiters,and the Steger-Warming splitting approach are used to discretize the inviscid terms.An eighth-order central difference scheme is employed to calculate the viscous terms. The time advancement relies on the third-order explicit TVD Runge-Kutta method. More details about the equations and numerical methods can be found in the work of Tong et al.
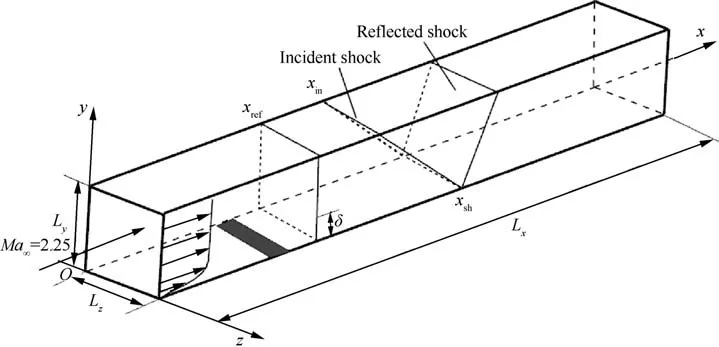
Fig. 1 Sketch of computational domain for DNS case.
The computation grid has 3700 × 300 × 250 points in the streamwise,wall-normal,and spanwise directions,respectively.As shown in Fig.2,the grid points in the streamwise direction are partitioned into three zones: 600 points in the transition zone ranging from x = 0 to x = 76.2 mm, 3000 points uniformly distributed in the interaction region, and 100 points in the fringe region extending from x = 127 mm to x = 137.6 mm with progressively coarsened spacing. In the wallnormal direction, the grid points are hyperbolically stretched and clustered in the near-wall region, ensuring that 195 points are employed inside the boundary layer.In the spanwise direction,the grid points are equally distributed.In wall units at the reference plane xwhere turbulence is expected to be fully developed(see Fig.3,x=94 mm),the streamwise and spanwise grid spacings in the interaction region are Δx=5.6 and Δz= 6.6. The grid spacings at the first grid point above the wall and at the edge of the turbulent boundary layer are Δy=0.66 and Δy=11.3,respectively,which are comparable to those previous well-accepted DNS data. Unless otherwise stated,the subscripts‘‘w”and‘‘e”represent the properties at the wall and boundary layer edge,respectively,and the superscript‘‘+” refers to nondimensionalization with the viscous length scale.
In Fig. 3, the boundary conditions adopted in the simulation are introduced. A steady laminar boundary layer profile is imposed at the inlet, which is determined from the laminar solution of the flat plate under the same freestream flow conditions. To eliminate the disturbance reflection, outflow boundary conditions are enforced at the outlet, and the flow variables are obtained using second-order downstream extrapolation. No-reflecting boundary conditions are used on the upper boundary and the flow variables at x >xare obtained by the Rankine-Hugoniot relations. The selected domain width is sufficiently large to guarantee that the velocity correlation coefficients rapidly fall close to zero, and periodic boundary conditions are utilized in the two spanwise boundaries. At the bottom wall, a no-slip boundary condition is applied with constant wall temperature T= 321.9 K.
As mentioned previously, a laminar-to-turbulent transition method is used to generate a fully developed incoming TBL over a flat plate, which was widely used by Pirozzoli et al.and Tong et al.The formula of wall-normal velocity vintheblowingandsuctionregioncovering 7.62 mm < x < 20.32 mm and 0 < z < 4.4 mm at the wall(denoted by the red line in Fig. 3) is the same as that of Fang et al.Table 1 lists the parameters of the TBL at x, where Re= ρUδ/μ, Re= ρUδ*/μand Re= ρU-θ/μrepresent the Reynolds number based on the nominal thickness δ, displacement thickness δ* and momentum thickness θ of the boundary layer,respectively.Clearly,good agreement with the parameters of Fang et al.is observed,suggesting that our approach is suitable for turbulence generation. Unless otherwise noted, δ is the boundary layer thickness at the reference plane x. It is worth noting that the disturbance amplitude A and the basic disturbance frequency ϖ are set to be larger than those of Fang et al.,due to the shorter transition region used. In the present study,A = 0.2Uand ϖ = 0.628U/δ.

Fig.2 Sketch of computational grid(the grid is plotted at intervals of every ten and five points in both x and y directions,respectively).

Fig. 3 Illustration of boundary conditions (the reference plane is taken at x = 94 mm, denoted as xref).

Table 1 Parameters of TBL at xref.
For a time period of 136δ/U(or 2 flow-through times),the initial transient is completely excluded, and the statistical steady state is reached. Subsequently, 600 three-dimensional instantaneous flow fields are sampled at a constant time interval of ΔtU/δ ≈1.25 to guarantee statistical convergence,and the flow fields at selected streamwise locations are periodically sampled at a shorter time interval of ΔtU/δ ≈0.025 to accurately estimate the two-point correlation and energy spectra.
2.3. Validation
Similar to Pirozzoli et al.and Fang et al.,the spanwise twopoint correlation of velocity fluctuations Ris first computed to assess the spanwise width effect,as reported in Fig.4.As the spanwise spacing ris gradually increased, all the correlations(α=u,v,w)in the near wall region and outer layer are rapidly decreased.In the following analysis,u,v and w are the velocity components in the x , y and z directions, respectively. Obviously, the correlations decay nearly to zero when rincreases to be larger than δ. The domain width used in our simulation is L≈2.17δ, indicating that the effect of the spanwise width on turbulence dynamics can be negligible.
In Fig. 5, the turbulence statistics at x, including the mean velocity profile, turbulence intensities, and productionto-dissipation ratio, are compared with previous numerical and experimental data of the zero pressure gradient TBL.Throughout this paper, the mean refers to the average in time and the spanwise direction. As shown in Fig. 5(a), the profile of the van Driest transformed mean velocity at the reference plane agrees well with the law of the wall (U= y) in the linear sublayer y< 10 and the log law (U=2.44lny+5.2) in the region 30 < y< 100, showing good agreement with the DNS data of Fang et al.Figs. 5(b)-5(c)shows the density-scaled Reynolds stress component R/uin inner scaling and outer scaling, respectively, where udenotes the friction velocity at x. Satisfactory agreement is obtained with the supersonic experimental data of Elena and Lacharmeand the DNS data of Fang et al.and Pirozzoli et al.,demonstrating Morkovin’s hypothesis. The wallnormal distribution of the production-to-dissipation ratio P/ε at xis further reported in Fig.5(d).Consistent with previous DNS data,the ratio peaks at approximately y≈10,attaining an approximate value of 2.0. In particular, the ratio is approximately constant(the value lying between 1.0 and 1.2)for 30 < y< 100, implying a local equilibrium in the log layer.
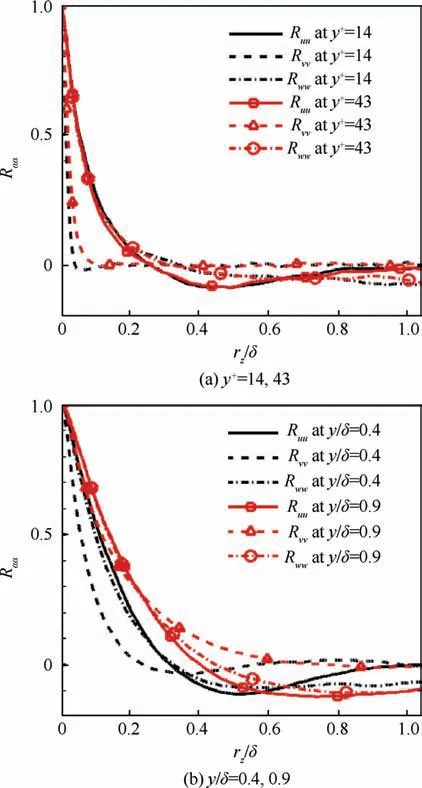
Fig. 4 Two-point correlation as a function of spanwise space rz at x = 96.2 mm.

Fig. 5 Turbulence statistics of upstream TBL at xref.
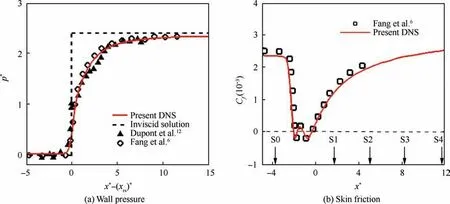
Fig. 6 Distribution of mean wall pressure and skin friction.
Moreover, the mean wall pressure, computed as p*= (p-p)/(p- p), is shown in Fig.6(a)as a function of the scaled interaction coordinate x*=(x-x)/δ.Here,pand pdenote the wall pressure and the free stream pressure,pis the pressure after the incident shock wave. For comparison purposes, the origin of x* is replaced at (x)*, corresponding to the foot of the reflected shock wave. As suggested by Fang et al.,(x)* is determined at the streamwise location where p= p+ p. The mean wall pressure jumps sharply at x* ≈(x)*, in good agreement with the experimental data of Dupont et al.and DNS results of Fang et al.and approaches the inviscid solution in the downstream region.Fig.6(b)compares the mean skin friction(C)distribution with the data of Fang et al.A satisfactory agreement is obtained, where the mean skin friction experiences a sharp drop at x* = -3 and a slow recovery in the reattachment boundary layer x*>0.In particular,two distinct regions with large negative values are clearly identified in the interaction zone. More quantitative evidence to validate the accuracy of the present DNS data is further provided in the following analysis.
3. Results and discussion
3.1. Structure inclination angle
In Fig. 7, the instantaneous vortex structures are visualized with an isosurface of the Q criterioncolored by the wallnormal distance. The isosurface of the pressure gradient modulus is also included to display the shock system. For better visualization, a relatively high threshold (Q/Q= 0.01) is selected to reduce the number of detected vortex structures,with attention only being paid to the vortex evolution in the reattachment boundary layer. Upstream of the interaction,elongated streaky structures are predominant in the nearwall region, consistent with the findings of Priebeand Wanget al. Qualitative comparisons between the upstream TBL and the reattachment region indicate that these largescale streamwise vortex structures are significantly enhanced after passing through the shock system and subsequently lifted off away from the wall due to the separated shear layer, leading to the onset of larger coherent vortices in the outer region of the RBL.
Another important finding gained from Fig. 7 is that the organized vortex structure in the reattachment region inclines at an acute angle with respect to the wall,as observed by Pirozzoli and Grasso.Using the cross-correlation of the fluctuating Wall Shear Stress(WSS) and streamwise velocity fluctuations,Marusic and Heuerfound that the structural inclination angle in wall turbulence is invariant near 14°over a large range of Reynolds numbers. Based on Taylor’s frozen hypothesis,they defined the inclination angle as Φ=arctan y/Δx(),where the spatial delay Δx* is calculated by the convection velocity Uand the time delay peak Δtinferred from the cross-correlation. Here, Uis taken to be the local mean streamwise velocity. Under this definition, the experimental data analyzed by Pabon et al.suggested that Φis 16°. To quantitatively evaluate the inclination angle variation downstream of the interaction, we determine the inclination angle following Marusic and Heuerand direct comparisons are made at five typical streamwise locations, marked as S0-S4 in Fig. 6(b). Specifically, location S0 is placed at the reference plane,where location S1,location S2 and locations S3-S4 correspond to the initial,intermediate and later stages of the reattachment boundary layer, respectively.
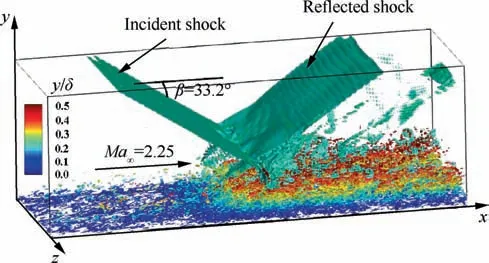
Fig. 7 Isosurface of Q equaling 1% of its global maximum and colored with wall-normal distance y (isosurface of pressure gradient modulus |∇p |δ/p∞=100 is used to visualize shock system).
Fig.8 compares the cross-correlations between the fluctuating WSS at location S0 and streamwise velocity fluctuations for seven selected wall-normal positions, which is defined as

where Δt is the time delay, and τand udenote the rootmean-square value of the fluctuating WSS τand velocity fluctuation u,respectively. In the results that follow,the over-bar denotes averages in the spanwise direction and time.Note that the velocity probes are directly placed above the WSS probe.Consistent with the experimental findings of Wietrzakand Pabonet al.,as the velocity probe moves away from the wall,the correlation experiences a significant decrease,and the peak value of the time delay is increased. At y/δ = 0.4,a high level of correlation is still observed. These behaviors are strongly associated with the inclined structure,which reaches the velocity probe before the WSS probe. A more direct representation of this structure is further provided in Fig. 9, where the time delay is converted to the spatial delay by using the local mean streamwise velocity, similar to Marusicand Pabonet al.For better visualization,the x-and y-axes are not on the same scale.
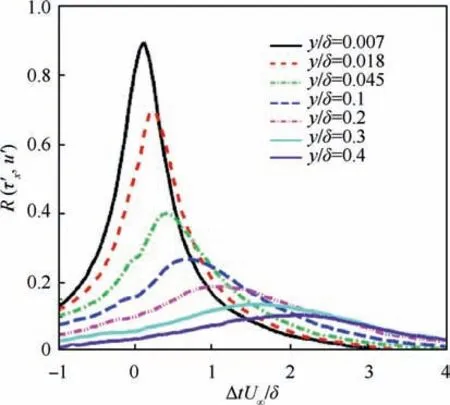
Fig. 8 Cross-correlation as a function of time delay at location S0.
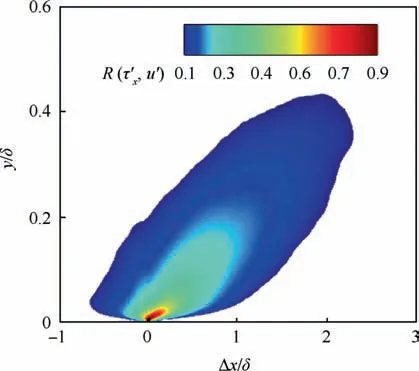
Fig. 9 Cross-correlation as a function of spatial delay and wallnormal location at location S0.
The spatial correlations of the fluctuating WSS and velocity fluctuation at locations S1-S4 and the corresponding structure inclination angle are reported in Fig. 10 and Fig. 11, respectively.As a reference,the correlation value of 0.3 and the inclination angle at location S0 are also included. As shown in Fig. 10, a similar isocontour of the correlation is clearly observed, confirming the existence of inclined coherent structures in the reattached boundary layer. However, significant differences deserve to be emphasized. First, the wall-normal extent of the isocontour is evidently increased,which is mainly attributed to the enhancement of the large-scale vortex structures in the outer region (see Fig. 7). Second, the isocontour inclinations exhibit a considerable decrease in the reattachment boundary layer, with an associated reduction in the structure inclination angle, as shown in Fig. 11, reflecting a typical recovery process in the downstream region. Following Marusic and Heuer,the structure inclination angle corresponding to a given wall-normal location (y) is estimated as the ratio y/Δx, taken at the streamwise spatial separation(Δx) where a local maximum of the spatial cross-correlation is attained.It can be seen from Fig.11 that the computed inclination angle distribution upstream of the interaction resembles very closely the experiment of Pabon et al.in the case of a low-speed zero pressure gradient boundary layer at Re= 4420, and the angle of the inclined structure is found to be nearly 13.6°, suggesting that the compressibility effect is weak. Moreover, it is found that the inclination angle exhibits a significant decrease in the reattachment region. At location S1, the inclination angle is approximately 20.0°, and it is decreased to be 15.9°at location S4,slightly larger than that of the upstream TBL.
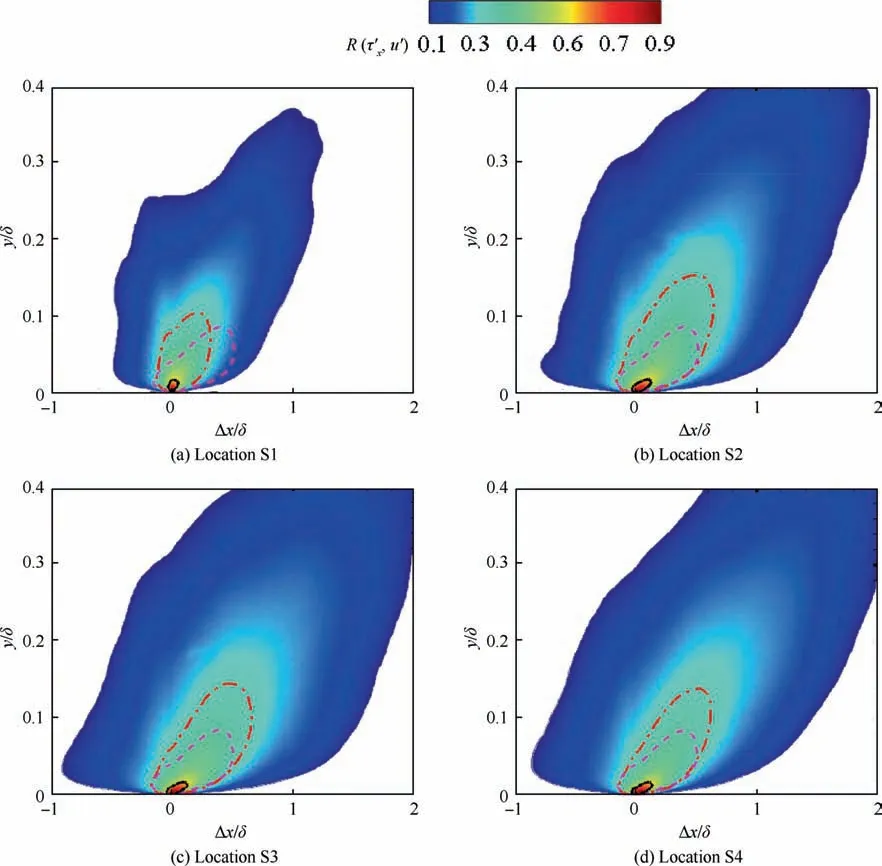
Fig. 10 Cross-correlation as a function of spatial delay and wall-normal location at various streamwise locations (red dotted lines and black solid lines represent correlation value of 0.3 and 0.6,respectively;pink dashed lines represent correlation value of 0.3 at location S0).
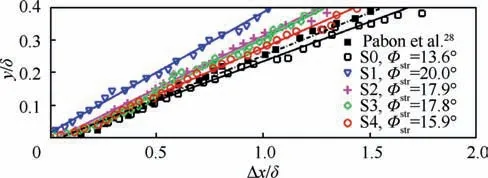
Fig. 11 Structure inclination angles at various streamwise stations.
3.2. Inner/outer layer interactions
The Amplitude Modulation (AM) mechanism has been extensively studied to uncover inner/outer layer interactions in a wide range of compressible and incompressible wall turbulence.Mathis et al.first proposed a one-point analysis with the aid of the Hilbert transform of the velocity fluctuations to quantify the AM effect. According to Schlatter and O¨ rlu¨, the method proposed by Mathis et al.was not suitable to fully characterize AM effects due to its decoupling approach.To cover the inherent shortcomings, Bernardini and Pirozzoliused a two-point AM correlation to represent the top-down interaction. Specifically,the AM covariance is defined as

where u(y) and u(y) denote the large-scale streamwise velocity at wall-normal location yand the low-pass filtered envelope at location y, respectively. In this section, AM covariance is adopted to analyze the inner/outer layer interactions in the reattachment boundary layer.
We herein discuss the results at location S0 to provide basic descriptions about the AM effect. The following procedure,similar to Mathisand Bernardiniet al.,is applied to calculate u(y) and u(y) at a given wall-normal location y:
(1) The large-scale uand the small-scale ucomponents of the raw velocity fluctuation are obtained using the lowand high-pass filters.Here,the determination of the cutoff wavelength is based on the inspection of the densityscaled spanwise premultiplied energy spectra φ, as shown in Fig. 12.
(2) The envelope of uis extracted using the Hilbert transform, and then the low-pass filtered using the same cutoff wavelength is applied in item (1).
In Fig. 12, we notice that the spectra exhibit a primary energy peak with a spanwise wavelength λ≈100 at y≈11.7, corresponding to the near-wall low speed streaks. Due to the relatively high Reynolds number (Re= 750), a secondary peak with a spanwise wavelength λ≈501 (λ≈0.66δ)is visible at y≈100,in agreement with the predictiony≈3.9Re.This is mainly related to the large-scale energy structures in the log layer. Therefore, following Bernardiniand Wuet al., the cutoff spanwise wavelength with λ=374 (λ= 0.5δ), sketched with pink line in Fig. 12, is also employed in the present study.
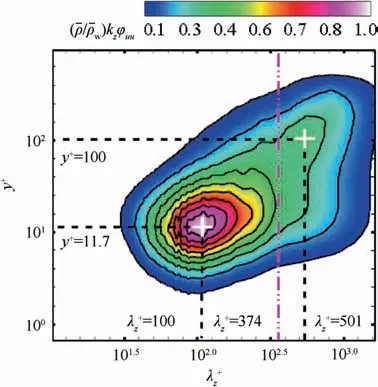
Fig. 12 Spanwise premultiplied energy spectra of streamwise velocity φuu at location S0 (kz is spanwise wavenumber and density-scaled spectra are normalized by its maximum).
Fig. 13 shows the two-point AM covariances extracted from location S0. As expected, the AM contour exhibits roughly symmetric behavior and is mainly characterized by two positive local peaks in the near-wall region.One is a diagonal peak associated with the high fluctuation intensity near the wall. Another off-diagonal peak at y= 59 and y= 6 is the genuine signature of the top-down interaction, suggesting that the small-scale fluctuations near the wall are enhanced and depressed by the positive and negative large-scale fluctuations from the lower region of the log layer, respectively.
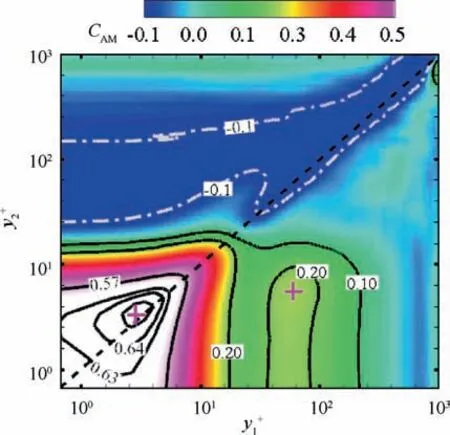
Fig. 13 Contours of two-point AM covariance at location S0 with local peaks denoted by pink crosses.
To examine whether the selected cutoff wavelength is applicable to the reattachment boundary layer, the spanwise premultiplied spectra of the fluctuating streamwise velocity at locations S1-S4 are reported in Fig. 14. This highlights that the inner peak undergoes continuous enhancement,approaching the upstream value, as a consequence of the regenerated near-wall streaky structures in the recovery process.The outer peak moves toward the upper-right side of the spectra,suggesting that the large-scale structures in the outer layer are lifted away from the wall, and the associated spanwise wavelength becomes larger. For instance, at location S4, the outer peak,located at y≈371,is characterized by a spanwise wavelength λ≈812,nearly 1.6 times the characteristic wavelength in the upstream TBL. The spectra also provide convincing evidence to support the qualitative analysis of the coherent structure discussed in Fig. 7. More importantly, it can be seen that the cutoff wavelength λ=374(λ=0.5δ)reasonably separates the large and small components of the spectra for all locations.Meanwhile,a wider range of cutoff wavelengths is also selected to perform the sensitivity analysis. No essential change is observed, confirming the robustness of the cutoff wavelength employed in our study.
The AM effect in the reattached boundary layer is particularly apparent from the two-point covariance maps at locations S1-S4, which are shown in Fig. 15. The figures exhibit a general similarity to the upstream TBL. The diagonal peak seems to be changed little as the disturbed boundary layer develops downstream. Most notable differences are found at the off-diagonal peak, which disappears at locations S1 and S2 and substantially reoccurs at locations S3 and S4.It is interesting to note that the off-diagonal peak for the last two locations is approximately relocated at y=45-55 and y=3.8,close to the values at location S0. Furthermore, the amplitude of the off-diagonal peak is given in Fig. 16, together with previous compressible DNS datacovering the Reynolds number range Re= 205-1123. Upstream of the interaction, the computed peak value at location S0 is approximately 0.22,which is comparable to the empirical correlation proposed by Bernardini and Pirozzoli.Interestingly, the peaks at the last two locations do not follow the logarithmic trend of Re. To be more specific, both peak values are nearly equal and attain a value of 0.33, which is much larger than the corresponding empirical values.

Fig. 14 Spanwise premultiplied energy spectra of streamwise velocity φuu at various streamwise locations (kz is spanwise wavenumber and density-scaled spectra are normalized by its maximum; black solid lines represent location S0).
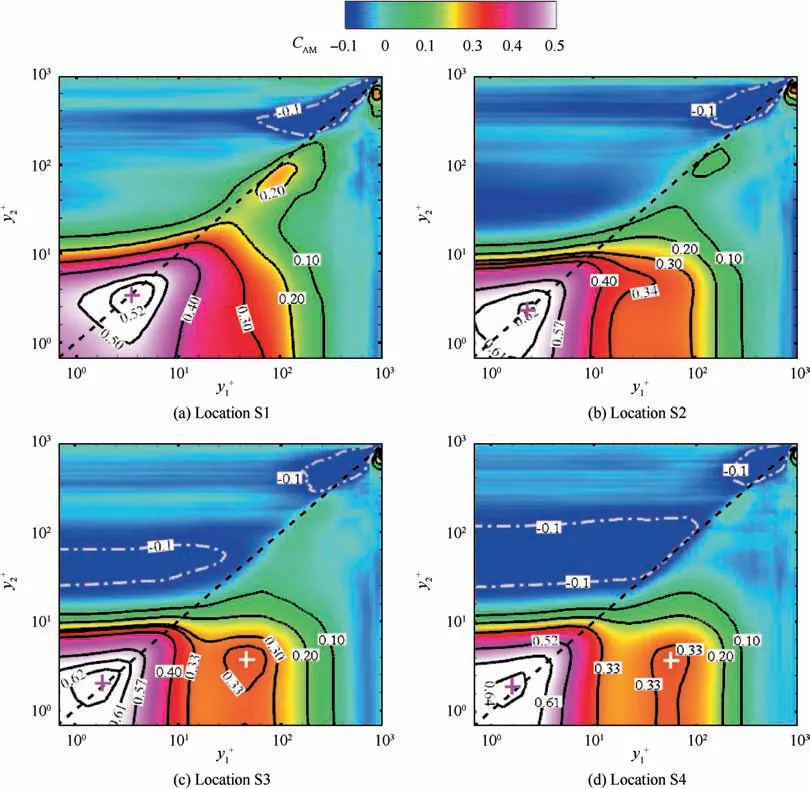
Fig. 15 Contours of two-point AM covariance CAM in reattachment region (crosses represent local peaks).
Combined with the coherent vortex structures in Fig.7 and the spectra in Fig. 14, a possible mechanism is proposed to qualitatively account for the AM effect. At location S1 (just downstream of the interaction),the reattached boundary layer starts recovering. Due to the presence of shock-induced separation bubbles, the near-wall structures are dramatically destroyed,responsible for the disappearance of the inner peak.The large-scale coherent structures,mainly originated from the upstream region, are essentially enhanced and concentrate at higher wall-normal locations after passing through the interaction, which explains the predominance of the outer peaks.Thus, the inner/outer layer interaction is expected to be marginal. However, through the spectral analysis of locations S2-S4, the coherent structure evolution in the inner and outer regions of the recovery process is significantly different. We hypothesize that the formation of Go¨rtler-type vortices associated with centrifugal instability plays an important role in the outer layer. As previously discussed in large-eddy simulations by Pasquariello et al.and experiments by Zhuang et al.in impinging shock wave and turbulent boundary layer interactions, the Go¨rtler-type vortices are characterized by a spanwise length scale of approximately δ(thickness of the incoming TBL). In Figs. 14(b)-14(d), the characteristic spanwise wavelengths of the outer peaks are λ≈1.08δ,very close to previous findings. In the near-wall region, a fast recovery of the lowspeed streaky structure is evident, especially at locations S3-S4.Therefore,it might be argued that the AM effect is related to the strong interaction between the Go¨rtler-type vortices and the regenerated spanwise streaky structures, which would probably explain the emergence of the off-diagonal peaks in the downstream region of the reattached boundary layer.
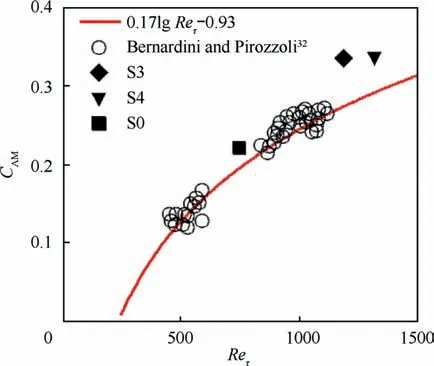
Fig. 16 Amplitude of off-diagonal peaks at various streamwise locations.
3.3. Decomposition of mean skin friction
To understand the mean skin friction generation in the reattachment boundary layer, the novel decomposition technique,which has been successfully applied in compressible turbulent boundary layerand channel flows,is first applied in impinging shock wave and turbulent boundary layer interactions.As suggested by Fan et al.,the decomposition in compressible wall-bounded turbulence is written here as
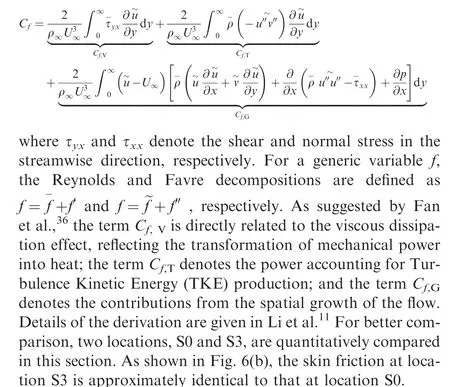
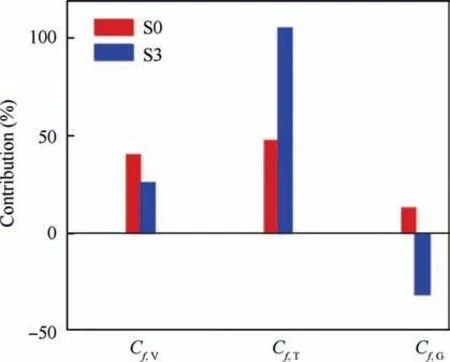
Fig. 17 Contributions to mean skin friction at locations S0 and S3.
The corresponding fractional contributions from the above three contributing terms are shown in Fig. 17. For both locations,the relative errors,defined as(C+C+C-C)/C, are approximately - 0.03% and - 0.09%, respectively,suggesting that the present decomposition method is equally reliable in the reattachment boundary layer. At location S0,the terms Cand Care the dominant components, attaining positive values of 40%and 46%,respectively; whereas the contribution associated with the term Cis rather small and can be negligible. It is suggested that TKE production and direct viscous dissipation play the leading role in skin friction generation for the upstream TBL, as observed by Fan et al.in the case of a Zero Pressure Gradient (ZPG) compressible TBL with Ma= 2 and Re= 580. However, significant quantitative differences can be clearly identified at location S3. Apparently, Cis found to be dramatically increased,nearly close to the total mean skin friction. The direct viscous dissipation Cdecreases slightly, still accounting for 26% of the total, whereas Cfalls to a large negative value of 31%.We further examine the spatial growth component C,which can be separated into flow convection Cstreamwise heterogeneity Cand pressure gradient C,
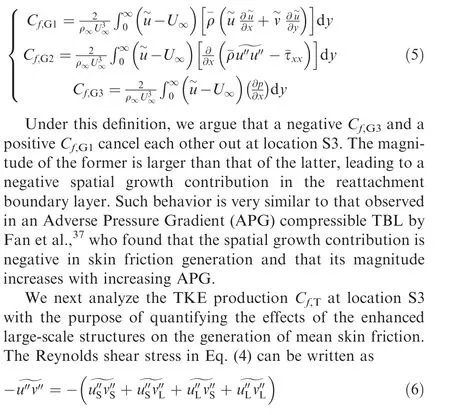
where the subscripts ‘‘L” and ‘‘S”represent the large- and small-scale components of velocity fluctuations, respectively.Therefore, the TKE production Cis split into four different terms:

where the first term Cdenotes the contributions produced by the small-scale structures, the fourth term Cindicates the large-scale structures, and the other two terms (Cand C) are the contributions associated with the interactions between different scales.
Recently, Cheng et al.applied bidimensional Empirical Mode Decomposition(EMD)to separate velocity fluctuations into specific length scales and quantitatively evaluated their contributions to mean skin friction generation in low-speed turbulent channel flows. The present study also utilized the bidimensional EMD technique to achieve the scale decomposition of streamwise and wall-normal velocity fluctuations.Details of the bidimensional EMD are given in the works of Cheng et al.and Agostini et al.
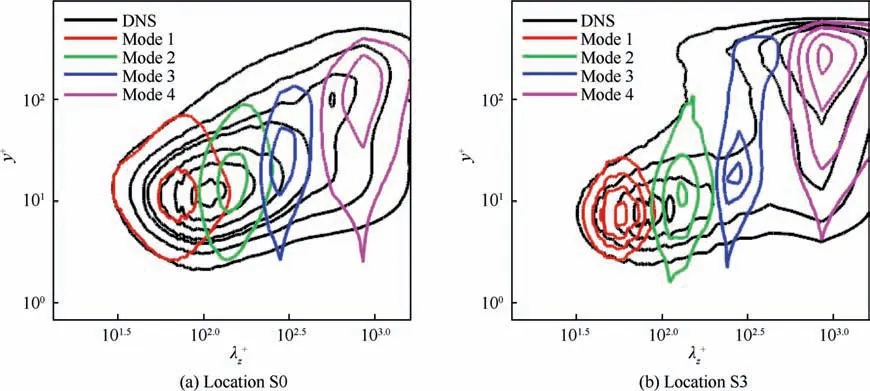
Fig. 18 Spanwise spectra of streamwise velocity fluctuations in EMD modes (black solid lines represent original DNS case).
Based on the bidimensional EMD method, the streamwise and wall-normal velocity fluctuations at locations S0 and S3 are sequentially decomposed into four EMD modes with a relatively narrow range of spanwise length scales. In Fig. 18 and Fig. 19, the spanwise spectra in each mode are directly compared with the full spectra obtained from the raw DNS data.Evidently, the decomposed results effectively capture the general trend of the original spectra.It is clear that the four EMD modes are characterized by different specific spanwise length scales, suggesting that scale decomposition is suitable. We observe that the first and second modes are located in the near-wall region, concentrating at λ≈100, while the third and four modes feature outer peaks, representative of largescale energy-containing structures with characteristic length scales in the range of 316 < λ< 1000. Similarly, Cheng et al.associated the first and second modes with the nearwall streaky structures and quasi-streamwise vortices in turbulent channel flow at Re= 810, and the last two modes are related to the larger streaks and vortex packets in the outer layer.
To assess the contributions associated with different length scales, we divide the four modes into two categories. Specifically, the first two modes represent the small-scale structures in the near-wall region, and the last two modes represent the large-scale structures in the outer part of the TBL. Fig. 20 shows the distribution of the Reynolds shear stress components in Eq.(6),and Fig.21 shows the corresponding contributions to the TKE production C.
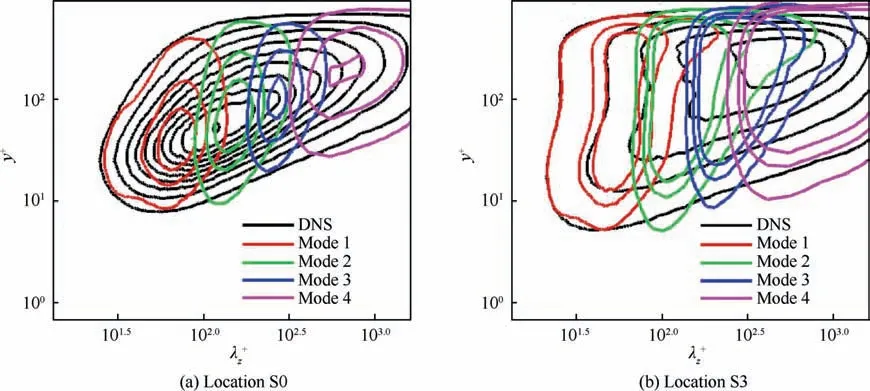
Fig. 19 Spanwise spectra of wall-normal velocity fluctuations in EMD modes (black solid lines represent original DNS case).
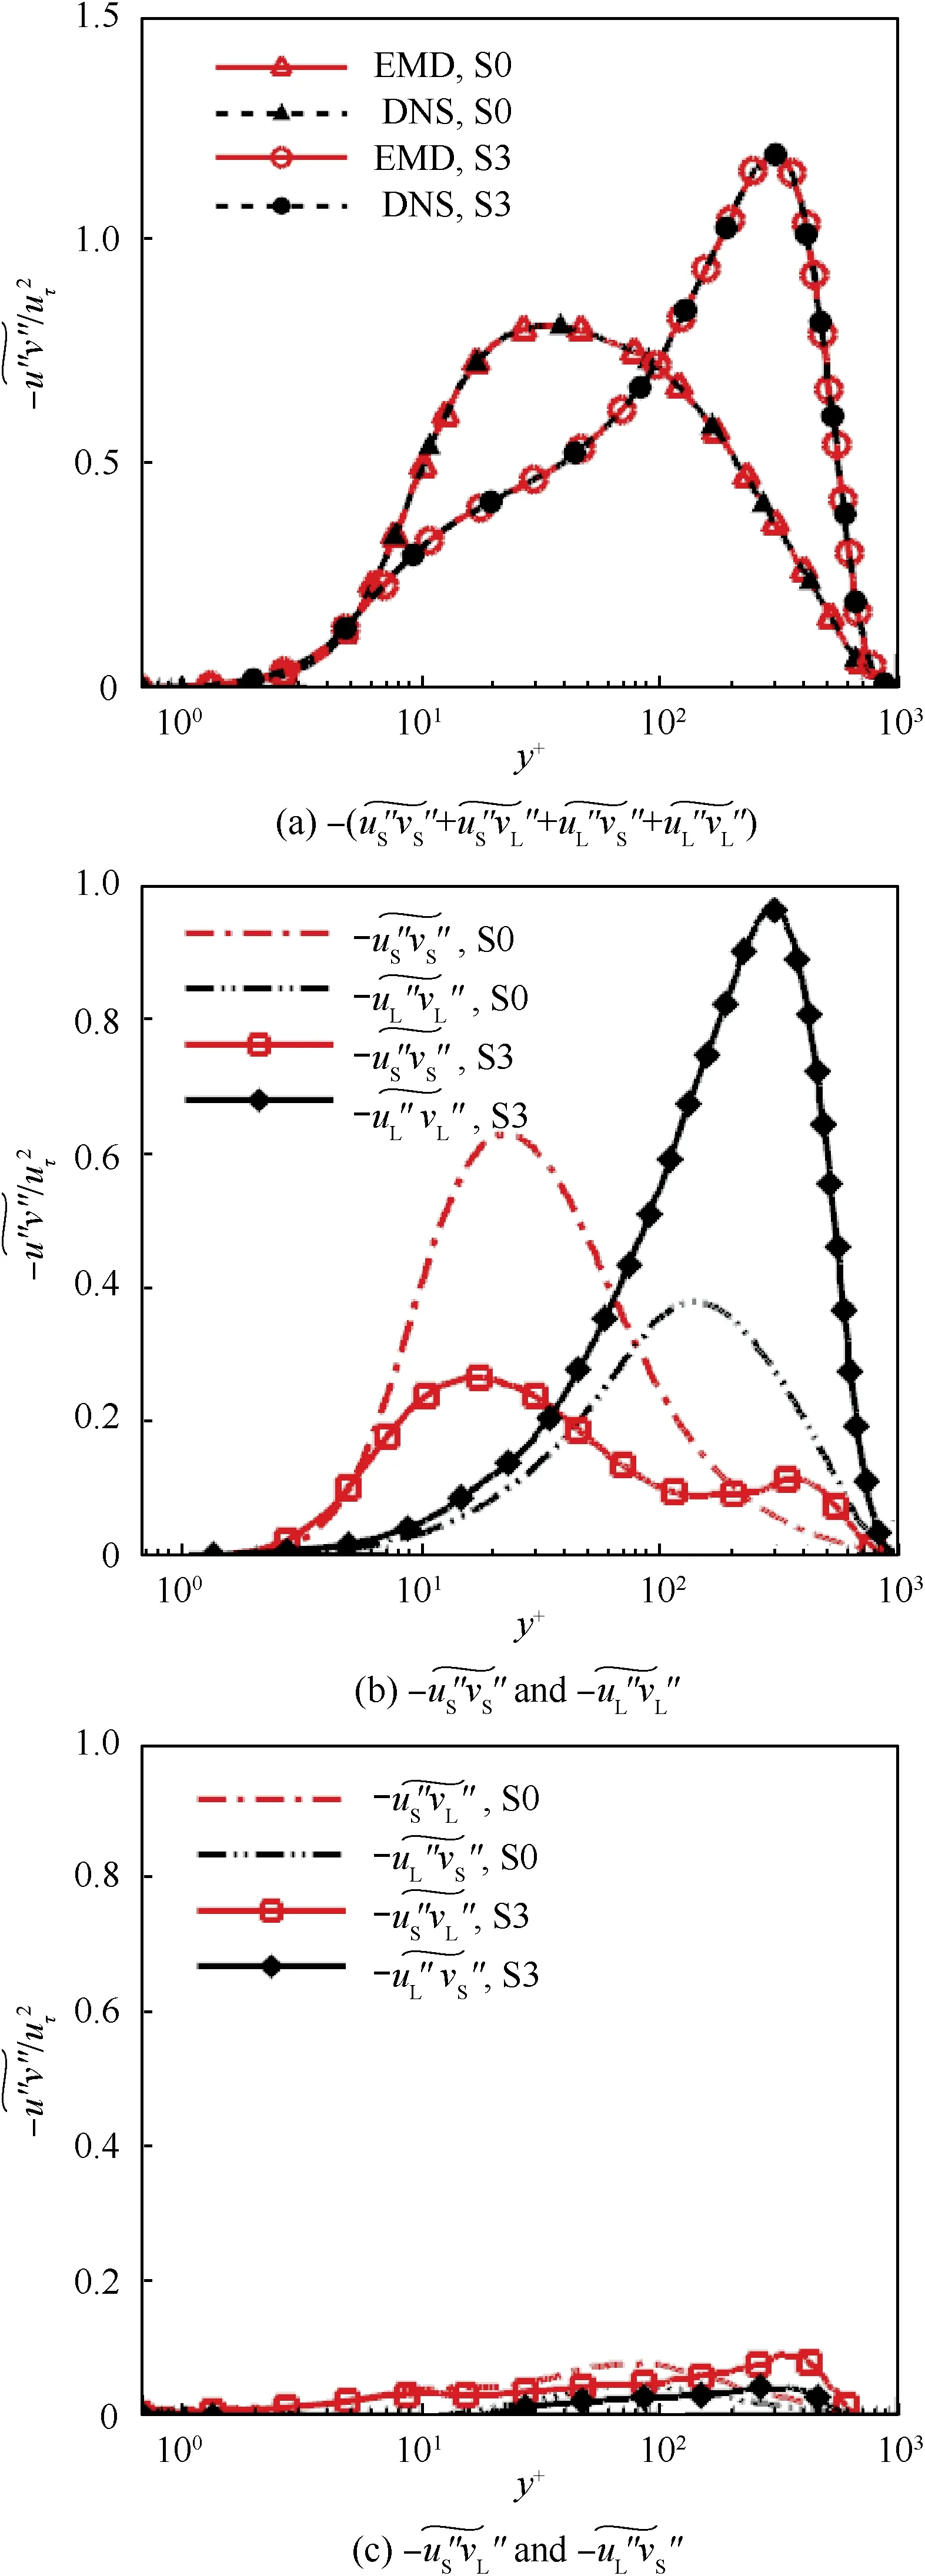
Fig. 20 Distributions of four contributing terms in Eq. (6).

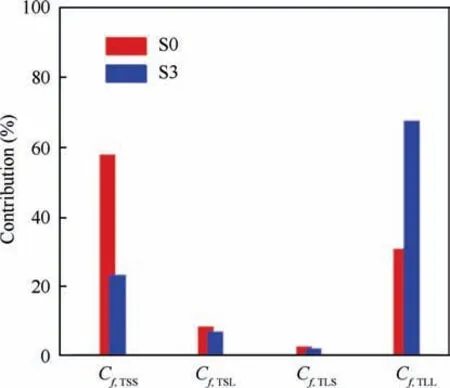
Fig.21 Contributions to TKE production term Cf,T at locations S0 and S3.

4. Conclusions
(1) The characteristics of the reattached boundary layer are investigated exploiting the DNS database of ISWTBLIs on a flat plate at Mach number 2.25. High levels of cross-correlation between the fluctuating WSS and velocity fluctuations proofs that the boundary layer is mainly characterized by enhanced forward-leading large-scale structures. Slightly larger than that of the upstream TBL, the structural inclination angle, determined using Taylor’s frozen hypothesis, decreases as the flow develops downstream.
(2) The occurrence of off-diagonal peaks with high amplitude confirms the top-down influence of the large-scale structures on the inner region in the reattached boundary layer.The peak amplitudes do not fit the logarithmic trend, which might be ascribed to the formation of Go¨rtler-type vortices downstream of the interaction.
(3) Decomposition of the mean skin fiction demonstrates the predominance of the TKE contribution, generated by large-scale structures with increased spanwise length scales in the logarithm and outer region of the RBL.Due to the adverse pressure gradient,the spatial growth of the flow provides a significant negative contribution to the skin friction generation.
The authors declare that they have no known competing financial interests or personal relationships that could have appeared to influence the work reported in this paper.
This study was co-supported by the National Key R&D Program of China(No.2019YFA0405300)and the National Natural Science Foundation of China (Nos. 11972356 and 91852203). The authors are very grateful to Dr. Weipeng LI and Dr. Yitong FAN from Shanghai Jiao Tong University for their helpful recommendations on skin friction decomposition.
 Chinese Journal of Aeronautics2022年6期
- Chinese Journal of Aeronautics的其它文章
- Experimental investigation of a gliding discharge plasma jet igniter
- Evolution of turbulent boundary layer over a three-dimensional bump
- Conceptual design and preliminary experiment of icing risk management and protection system
- Direct thrust control for multivariable turbofan engine based on affine linear parameter-varying approach
- Structurally coupled characteristics of rotor blade using new rigid-flexible dynamic model based on geometrically exact formulation
- Shape preserving topology optimization for structural radar cross section control
