Operational modal parameter identification with colored noise excitation
Xiangyu LU, Xudong HE, Huaihai CHEN, Ronghui ZHENG
State Key Laboratory of Mechanics and Control of Mechanical Structures, College of Aerospace Engineering, Nanjing University of Aeronautics and Astronautics, Nanjing 210016, China
KEYWORDS Colored noise;Half power bandwidth;Modal parameter identification;Operational Modal Analysis;Trapezoidal spectrum
Abstract Operational Modal Analysis (OMA) refers to the modal analysis of a structure in its operating state.The advantage of OMA is that only the output vibration signal of a system is used in the analysis process. Classic OMA is based on the white noise excitation assumption and many identification methods have been developed in both time domain and frequency domain. But in reality,many environmental excitations are not compliance with the white noise assumption.In this paper, a method of half power bandwidth analysis is applied to power spectrum analysis to deal with the colored noise and trapezoidal spectral excitation.The modal frequencies and modal damping ratios are derived and the error caused by trapezoidal spectral and colored noise excitation are analyzed. It is proved that the OMA algorithm based on the white noise assumption can be extended to the colored noise environments under certain conditions.Finally,a simulation example with a cantilever beam and a vibration test with four kinds of colored noise and trapezoidal spectrum base excitation are carried out and the results support the proposed method.
1. Introduction
Operational Modal Analysis (OMA) is widely used in structural modal parameter identification. Compared to the Experimental Modal Analysis(EMA),OMA presents the advantage that only the vibratory responses of the structure are used for analysis. Because excitation information is not needed in OMA, the test cost can be greatly reduced, and the modes of large structure can be obtained which cannot be obtained in laboratory.
The study of OMA began in the 1960s.Clarkson and Mercer proposed to use cross-correlation functions to estimate the frequency response characteristics of structures subjected to the white noise excitation in 1965.1OMA has attracted wide attention since the mid-1990s. Many new analytical methods were proposed and developed both in time and frequency domains. The time domain methods include random decrement method,2,3time series analysis method based on Autoregressive Moving Average (ARMA)model,4natural excitation identification technology5.6and Stochastic Subspace Identification (SSI) method.7,8Frequency domain methods include Frequency Domain Decomposition(FDD)9method,enhanced FDD or Enhance Frequency Domain Decomposition(EFDD)10–12and Frequency-Spatial Domain Decomposition(FSDD)13,14. FSDD uses singular value decomposition to enhance the Power Spectral Density (PSD) of response. A mode near the enhanced power spectrum peak can often be approximated to a Single-Degree-of-Freedom(SDOF)system,and then the frequency and damping ratio of the mode can be obtained by least square fitting.
OMA has been applied in many cases in the recent years.Sitarz and Powalka15presented Dual Ant Colony Operational Modal Analysis parameter estimation method (DAC-OMA)to solve the problems in stabilisation diagram. The algorithm is fully automated. Lund et al.16suggested a new freeze–thaw test based on OMA method for pervious concrete and tested on one baseline mix,with three different contents of entrained air. Hansen et al.17presented a kind of vibration-based damage localization and quantification method, based on natural frequencies and mode shapes. Zhu et al.18presented OMA of an eight-story concrete building using environmental vibration data collected in an ‘asynchronous’ manner. The identified modal parameters based on asynchronous data are evaluated by comparing with those identified based on synchronous data. The identification uncertainties of modal parameters are investigated through the posterior coefficient of variation in a Bayesian context.
However,the above OMA is based on the white noise excitation assumption. In many cases, the excitation is non-white noise. For example, the pressure fluctuations excitation in hypersonic wind-tunnel is not flat spectrum.19In recent years,some researches on non-white noise excitation are about the fusion of white noise and several fixed frequencies.20–22Research on OMA under broadband colored noise excitation is still lacking.
In this paper,the OMA with colored noise and trapezoidal spectrum excitation is investigated. First, the response PSD of a SDOF system under the colored noise excitation is studied.The formulas of natural frequency and damping ratio are obtained by the half-power bandwidth method.It is found that these formulas for the colored noise and trapezoidal spectrum can be approximated to the results of the white noise in most cases. Subsequently, the method is extended to a Multi-Degree-of-Freedom (MDOF) system. Four colored noise excitations and trapezoidal spectrum are simulated and the identified modal parameters are compared with the white noise excitation. Finally, an OMA test is carried out with a cantilever beam under base excitation with a three-axis shaker,and the results support the viewpoints presented in the paper.
2. Definition of colored noise
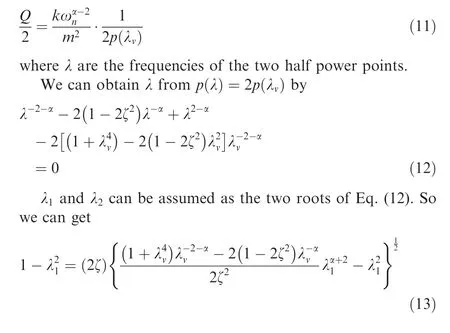
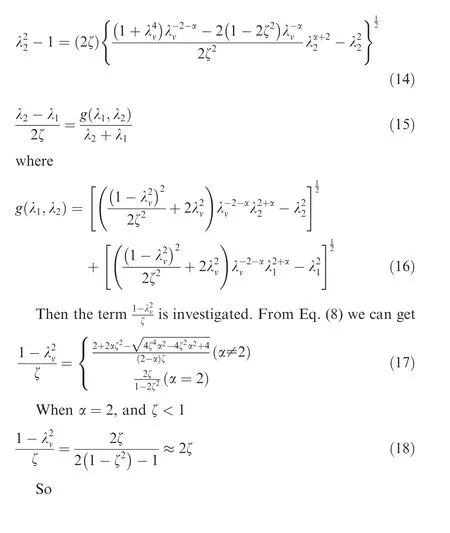
Colored noise refers to the noise with non-uniform distribution of PSD in the frequency domain.The colored noises are distinguished by their shapes of PSD respectively. Here, four kinds of common colored noises are researched, which are pink noise, blue noise, purple noise and brown noise, the PSD Gxxcan be expressed as:
where k is related to the magnitude, ω is the excitation frequency and α determines the color (-1 is for pink noise, 1 is for blue noise, 2 is for purple noise,-2 is for brown noise.).Fig. 1 shows the PSD of different colored noise.
3. Modal parameter identification excited by colored noise and trapezoidal spectrum
3.1. Single degree of freedom system
It can be assumed that the system studied in this paper is linear,and the modal parameters of the system are identified only according to the responses.
For a SDOF system, the amplitude of the velocity frequency response function can be expressed as
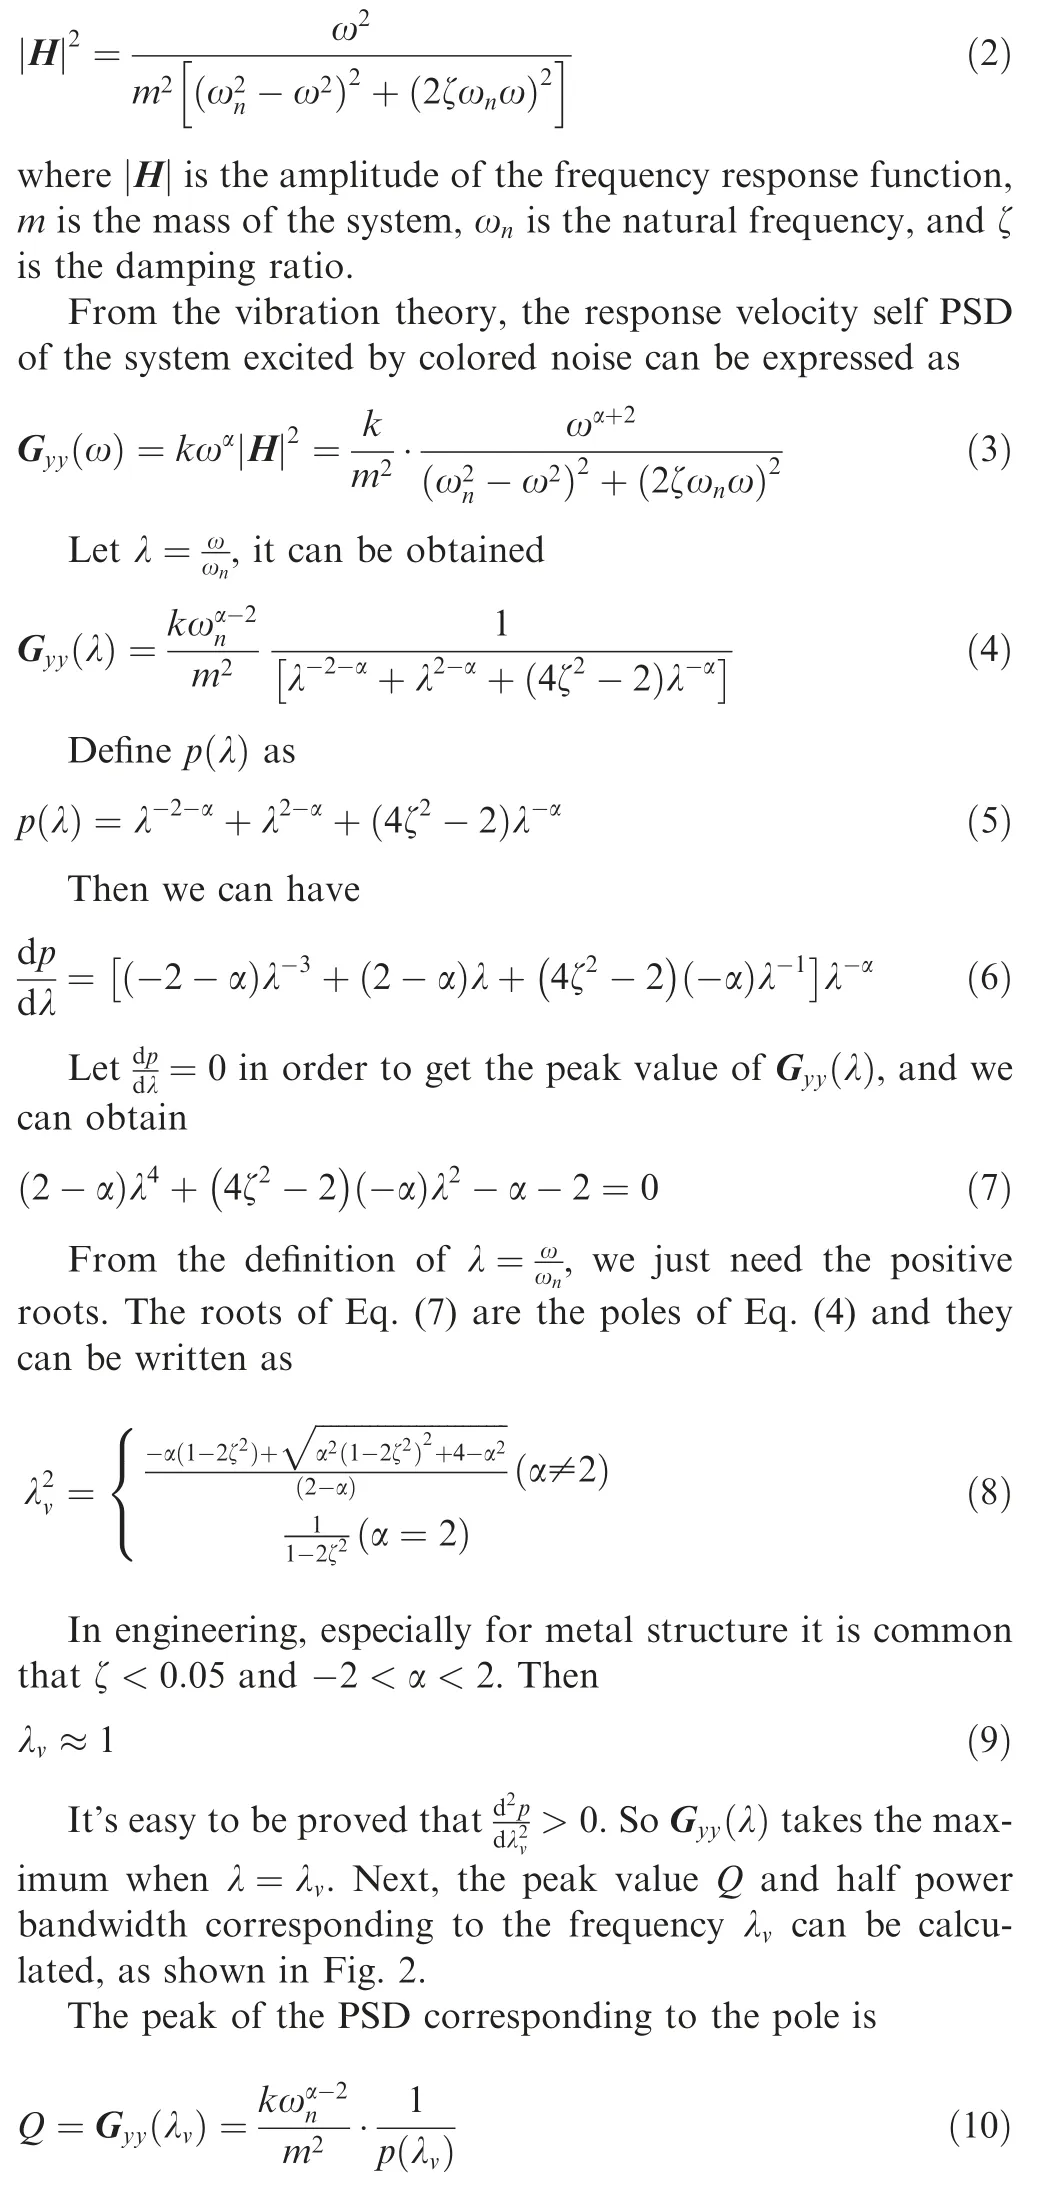
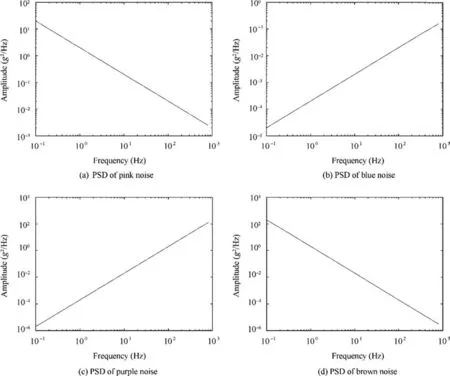
Fig. 1 PSD of colored noise.
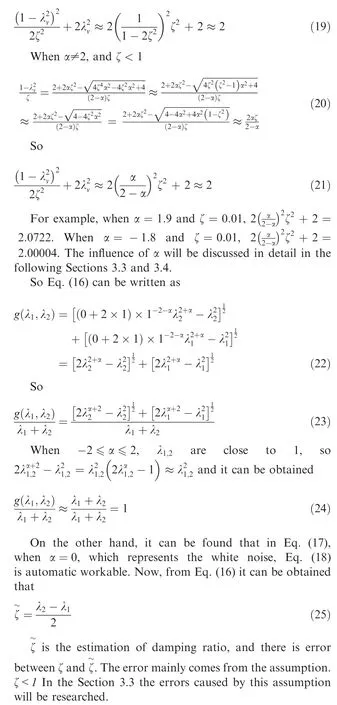
In a summary, when excited by colored noise, the frequency and damping ratio of a SDOF system can be obtained by Eqs. (9) and (25) respectively. It can be seen that the expression of damping ratio under colored noise excitation is consistent with that of white noise. Therefore, it can be concluded that when the damping ratio is small enough,the OMA method can be extended to the case of colored noise. Although the above half-band expressions are derived for the velocity frequency response function, known from vibration theory, they are also suitable for displacement or acceleration frequency response functions. So, in the following sections we do not distinguish the type of the frequency response function.
3.2. Multi-degree-of-freedom system
For a linear classic damping MDOF system with N random inputs and N random outputs, the response of the system in the frequency domain can be expressed as

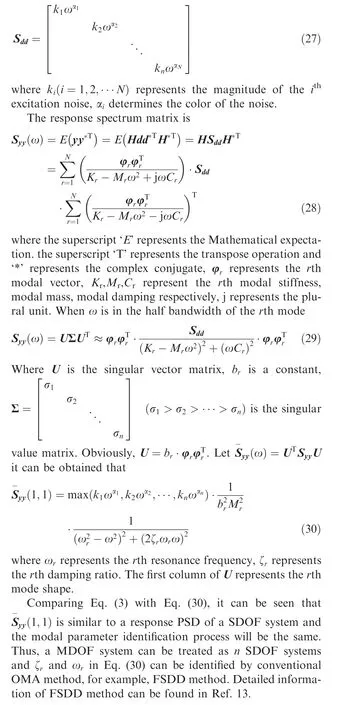
where y is the response vector, H is the frequency response matrix, d is the excitation vector. Suppose that the noise excitations in d are uncorrelated with each other. Then the PSD matrix of d can be expressed as
3.3. Error analysis of colored noise
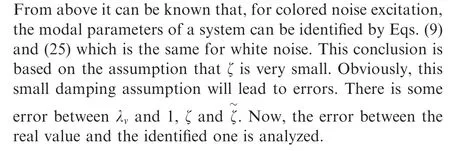
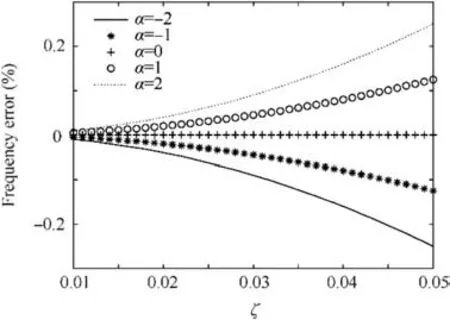
Fig. 3 Natural frequency error.
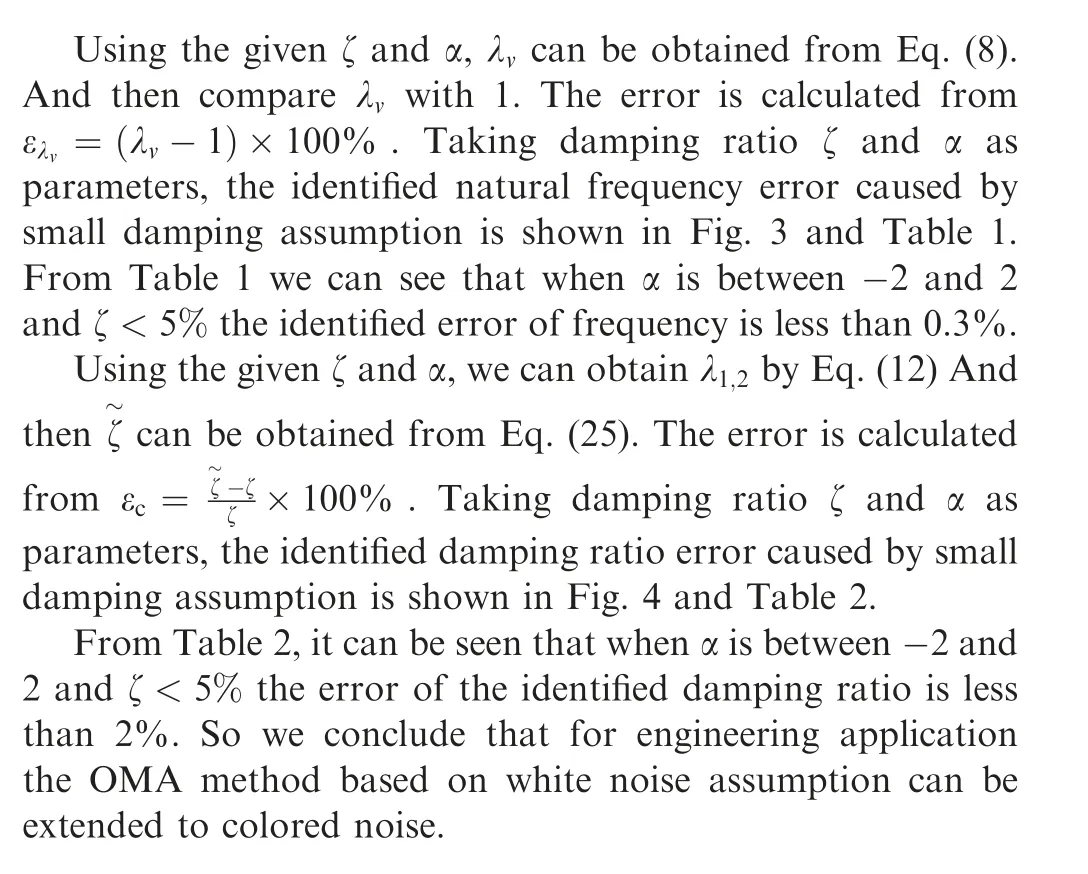
3.4. Trapezoidal spectral excitation
Now, we consider the trapezoidal spectrum which is widely used in the vibratory environment test is shown in Fig. 5.The trapezoidal spectral excitation condition can be classifiedinto 9 cases according to the relative position of resonance peak and the excitation spectrum, which are shown in Fig. 6.

Table 1 Identified frequency errors.
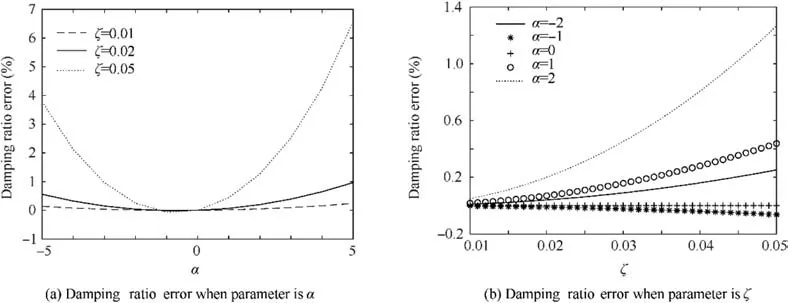
Fig. 4 Identified damping ratio error.

Table 2 Identified damping ratio error.
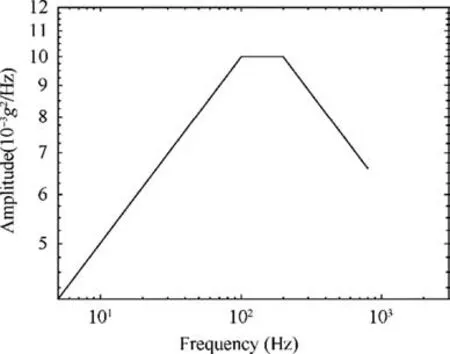
Fig. 5 PSD of a trapezoid spectrum.
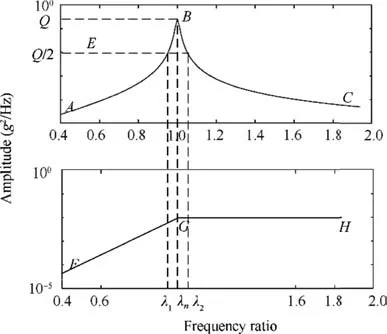
Fig. 7 PSD of a special trapezoid spectrum.
In the Case 1, the two half power points of trapezoidal spectrum fall in segment A-B. In the Case 2, the two halfpower points of trapezoidal spectrum fall in segment A-B, BC respectively and natural frequency fall at point B. In the Case 3,the two half-power points of trapezoidal spectrum fall in segment A-B,B-C respectively,and natural frequency fall in segment A-B. In the Case 4, the two half-power points of trapezoidal spectrum fall in segment A-B, B-C respectively,and natural frequency fall in segment B-C. In the Case 5, the two half power points of trapezoidal spectrum fall in segment B-C. In the Case 6, the two half-power points of trapezoidal spectrum fall in segment B-C,C-D respectively and natural frequency fall at point C.In the Case 7,the two half-power points of trapezoidal spectrum fall in segment B-C,C-D respectively,and natural frequency fall in segment B-C. In the Case 8 the two half-power points of trapezoidal spectrum fall in segment B-C, C-D respectively, and natural frequency fall in segment C-D. In the Case 9, the two half power points of trapezoidal spectrum fall in segment C-D.
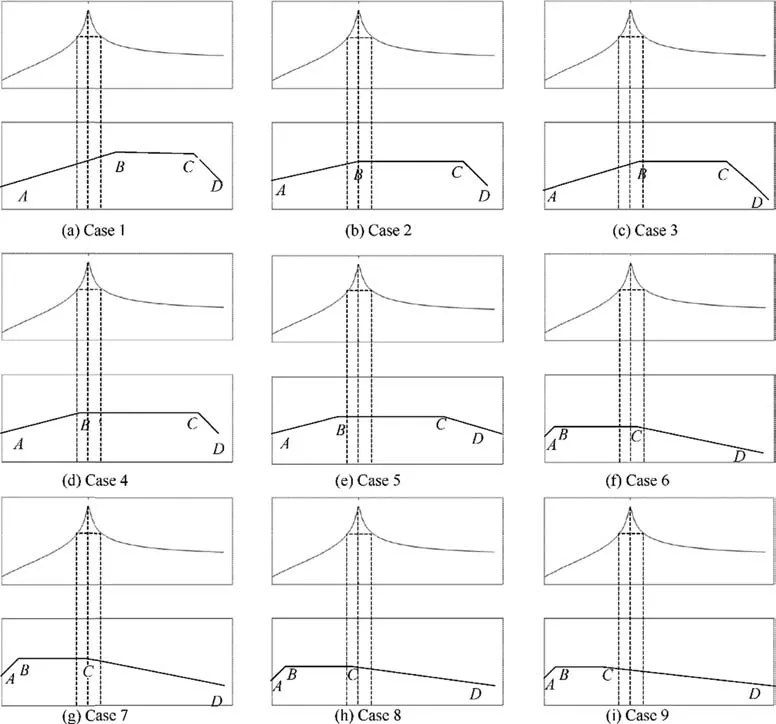
Fig. 6 Different cases under trapezoidal spectral excitation.
Case 2:Natural frequencies ωnfalling in break point of the trapezoidal spectrum, which is shown in Fig. 7.
Case 1, Case 5 and Case 9 can be summarized as two halfpower bandwidths fall in the same band of the spectrum.Usually, a trapezoidal spectrum as shown in Fig. 8 can be divided into three bands.If two half-power bandwidths fall in the same band of the spectrum, from the view point in frequency domain,Eq.(4)is applicable at any frequency point in any frequency band.So Eq.(9)and Eq.(25)are also applicable to the case of trapezoidal spectral excitation.
Now, the case when two half-power bandwidth points fall in different bands of the spectrum are considered. Cases 2–4 are analyzed in detail.
In the Fig. 7, line segment F-G represents the PSD of the excitation of colored noise, segment G-H represents the PSD of the excitation of white noise with limited band, curve segment A-B represents the PSD of response under excitation frequency band of segment F-G,segment B-C represents the PSD of response under excitation frequency band of segment G-H,and the PSD of response reaches the peak value Q at point B.According to Eq. (3), the PSD of response can be obtained.
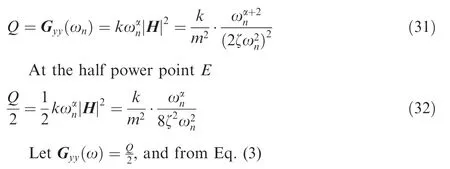
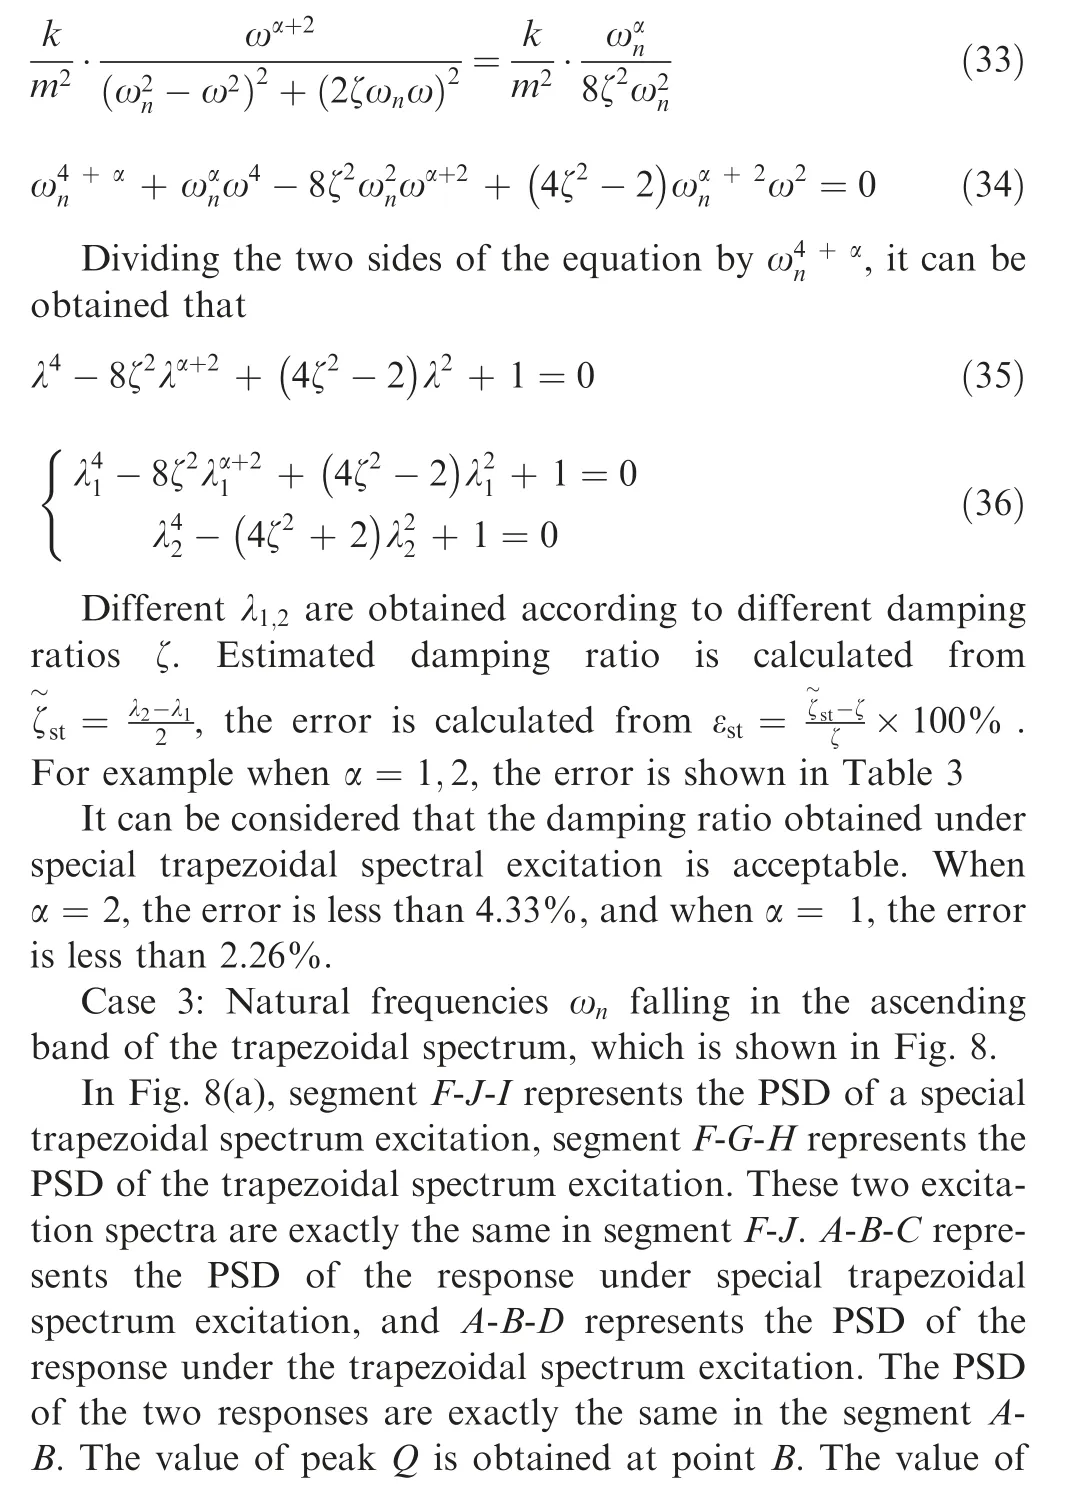
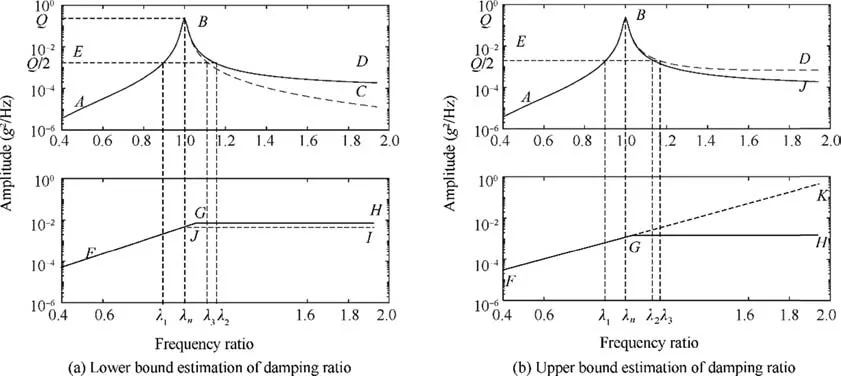
Fig. 8 Natural frequency falling in ascending band.

Table 3 Identified frequency errors under special trapezoid spectrum when α=1,2
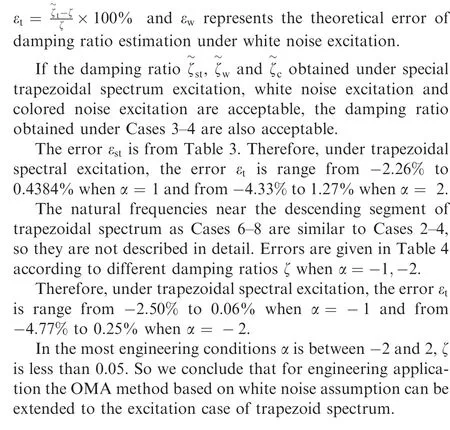
Fig. 9 Natural frequency falling in straight segment.
4. Simulation example
4.1. Simulation settings
4.1.1. Cantilever beam setting
The cantilever beam in Fig. 10 is for the simulation. The parameters of the cantilever beam are shown in Table 5. The colored noise or the noise with trapezoidal spectrum is applied at the free end. The 10 response accelerations are obtained by the finite element method with plane beam elements.
4.1.2. Settings of the colored noises
In this simulation example,the definitions of the colored noise are shown in Table 6 and Fig. 1.
4.1.3. Parameter settings of the trapezoidal spectrum
In this simulation example, the trapezoidal spectrum settings are shown in Table 7 and Fig. 5.
4.2. Analysis
The theoretical frequency and the identified frequency usingFSDD under various excitations are listed in Table 8.Theoretical damping ratios and the damping ratios identified by FSDD under various noise excitations are listed in Table 9.The first four identified modes under excitation with trapezoidal spectrum are shown in Fig. 11.

Table 4 Errors of the identified frequency under special trapezoid spectrum when α=-2,-1

Fig. 10 Ten-element cantilever beam model.

Table 5 Parameters of cantilever beam and analysis

Table 6 Settings of colored noises
It can be seen from Tables 8 and 9 and Fig.11 that there are no significant difference between white noise excitation and colored noise excitation.

Table 7 Settings of trapezoidal spectrum

Table 8 Identified frequencies(Hz) and errors under different noise excitation

Table 9 Identified damping ratios and errors under different noise excitation
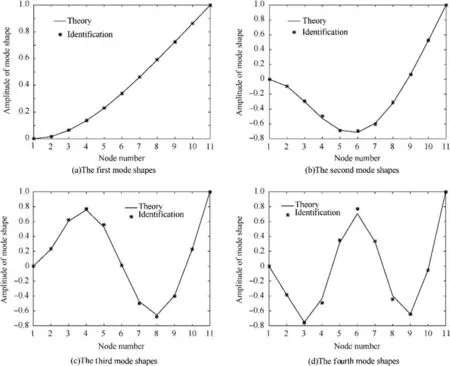
Fig. 11 Mode shapes of cantilever beam under trapezoidal spectrum.
5. Experiment
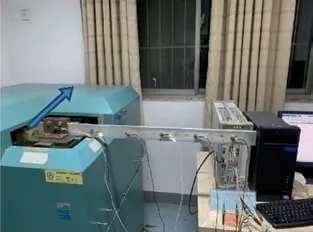
Fig. 12 Experiment scenario.
The experimental scenario is shown in Fig.12.The total length of the cantilever used in the experiment was 1 m, the free length was 0.78 m, the width was 0.06 m and the height was 0.0125 m of the cross section. The distance between any two adjacent accelerometers was 0.16 m. The excitation was provided by a three-axis shaker. As shown in Fig. 12, the excitation direction is transverse vibration in the y-axis direction.The data acquisition and sending instrument was Agilent VXI. The sampling frequency was 2560 Hz and the sampling time was 32 seconds. The average number of PSD was 40.The analysis frequency band was 1000 Hz. The number of spectral lines was 800. The colored noises as excitations were shown in Table 10. The trapezoidal spectrum of the noise was shown in Table 7 and the RMS was 1.5 g.
The frequencies and the damping ratios obtained by FSDD under various noise excitations are shown in Tables 11 and 12 respectively. From the results we can see that the identified modal parameters of the beam by the six kinds of noise are similar. The first four mode shapes of the beam excited by white noise and other noise are shown in Fig. 13.
6. Conclusion and discussion
In this paper, we set forth the general expressions to identify the modal parameters only with the response PSD under colored noise excitation. We conclude that when the damping ratio is less than 0.05 and the order α of colored noise isbetween-2 to 2 the OMA methods based on white noise excitation assumption can be extended to colored noise. The idea is validated by simulation example and test. The condition when |α |>2 need further study. The modal parameter identification problem of OMA only be discussed in the frequency domain in this paper. The applicability of the conclusions in time domain needs further study.

Table 10 The colored noises used in experiment

Table 11 Frequencies(Hz) and errors under different excitations

Table 12 Damping ratios and errors under different excitations
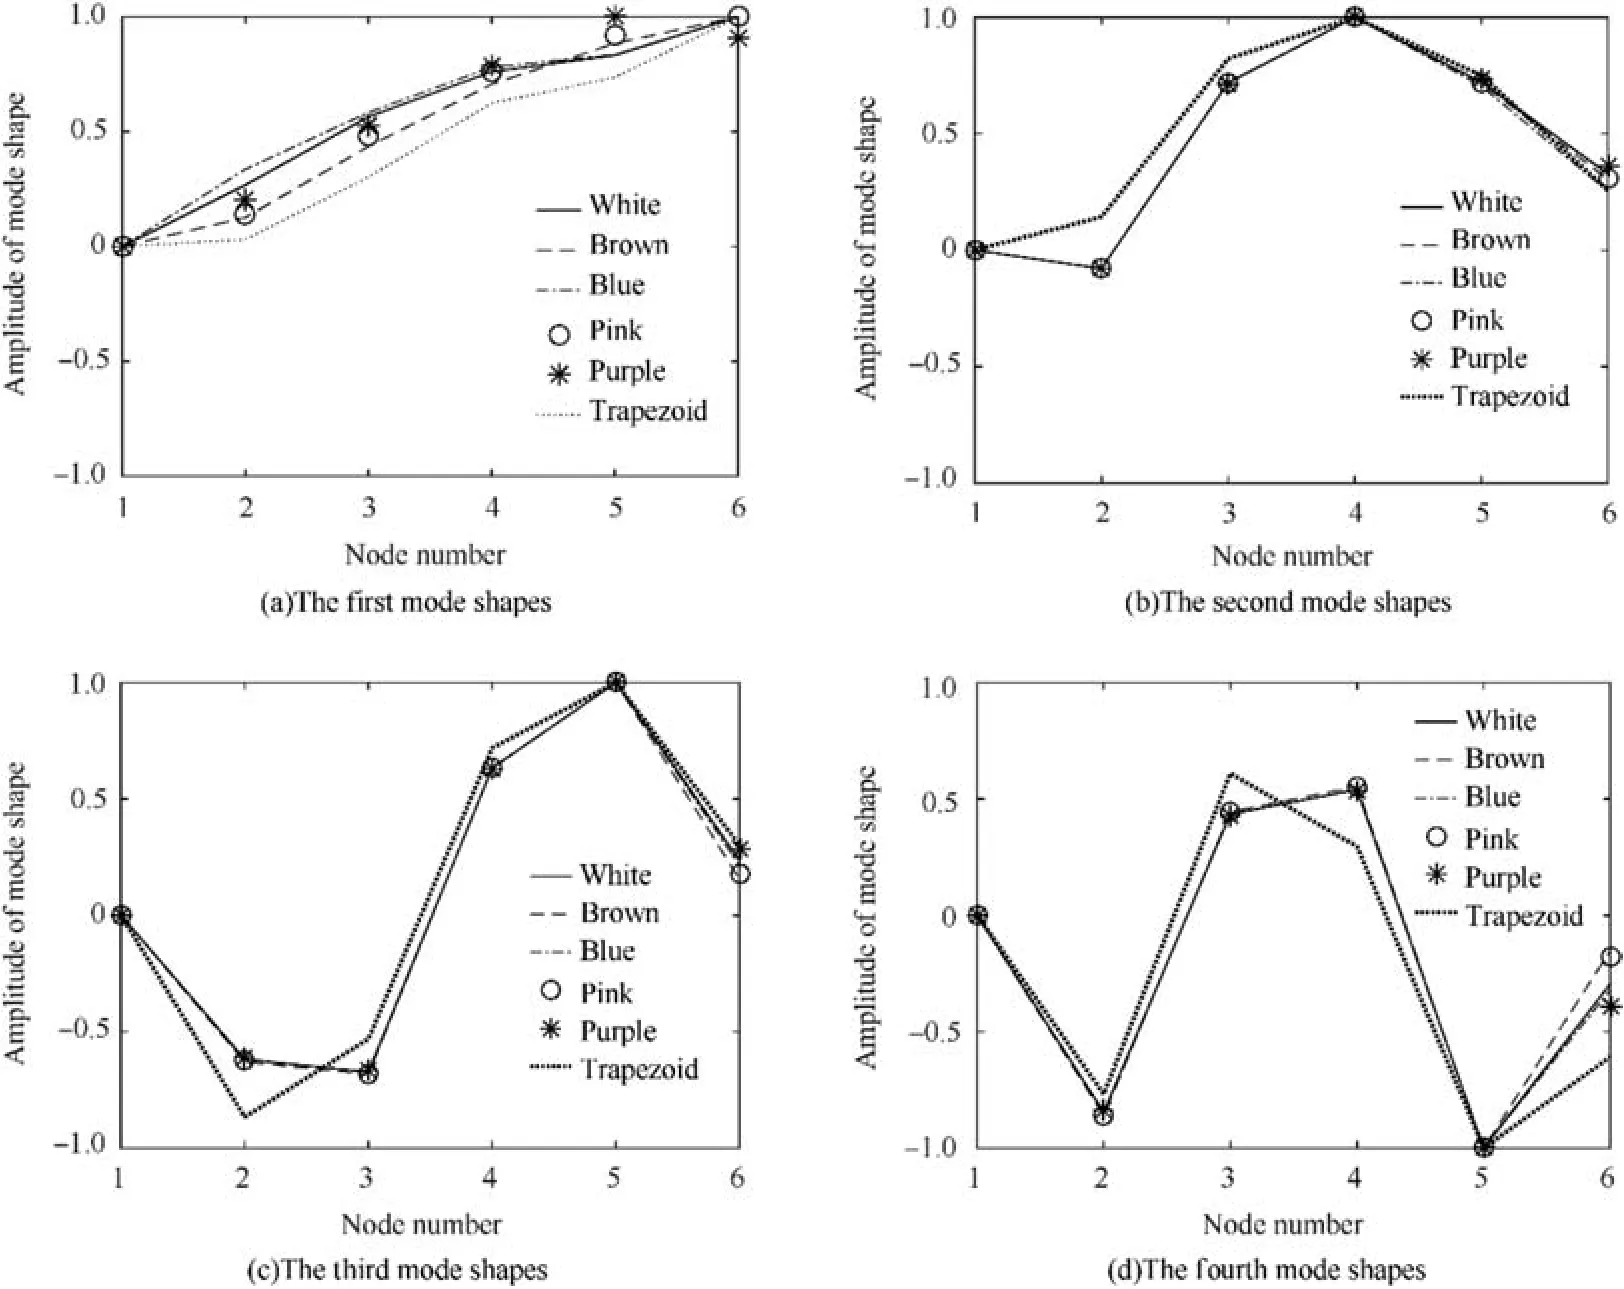
Fig. 13 Modal shapes under different noise excitation.
Declaration of Competing Interest
The authors declare that they have no known competing financial interests or personal relationships that could have appeared to influence the work reported in this paper.
 CHINESE JOURNAL OF AERONAUTICS2021年2期
- CHINESE JOURNAL OF AERONAUTICS的其它文章
- Recent active thermal management technologies for the development of energy-optimized aerospace vehicles in China
- Electrochemical machining of complex components of aero-engines: Developments, trends, and technological advances
- Recent progress of residual stress measurement methods: A review
- Micromanufacturing technologies of compact heat exchangers for hypersonic precooled airbreathing propulsion: A review
- Towards intelligent design optimization: Progress and challenge of design optimization theories and technologies for plastic forming
- A combined technique of Kalman filter, artificial neural network and fuzzy logic for gas turbines and signal fault isolation
