Helicopter maritime search area planning based on a minimum bounding rectangle and K-means clustering
Peisen XIONG, Hu LIU, Yongling TIAN,*, Zikun CHEN, Bin WANG,Ho YANG
a School of Aeronautic Science and Engineering, Beihang University, Beijing 100083, China
b Dong Hai No. 2 Rescue Flying Service of The Ministry of Transport, Xiamen 361006, China
KEYWORDS K-means clustering;Minimum bounding rectangle;Mission planning;Probability map;Search and rescue
Abstract Helicopters are widely used in maritime Search and Rescue (SAR) missions. To ensure the success of SAR missions, search areas need to be carefully planned. With the development of computer technology and weather forecast technology, the survivors’ drift trajectories can be predicted more precisely, which strongly supports the planning of search areas for the rescue helicopter. However, the methods used to determine the search area based on the predicted drift trajectories are mainly derived from the continuous expansion of the area with the highest Probability of Containment(POC),which may lead to local optimal solutions and a decrease in the Probability of Success (POS), especially when there are several subareas with a high POC. To address this problem, this paper proposes a method based on a Minimum Bounding Rectangle and Kmeans clustering(MBRK).A silhouette coefficient is adopted to analyze the distribution of the survivors’probable locations,which are divided into multiple clusters with K-means clustering.Then,probability maps are generated based on the minimum bounding rectangle of each cluster.By adding or subtracting one row or column of cells or shifting the planned search area,12 search methods are used to generate the optimal search area starting from the cell with the highest POC in each probability map. Taking a real case as an example, the simulation experiment results show that the POS values obtained by the MBRK method are higher than those obtained by other methods,which proves that the MBRK method can effectively support the planning of search areas and that K-means clustering improves the POS of search plans.
1. Introduction
As a Search and Rescue Unit (SRU) with high speed and hovering capability, the helicopter is increasingly being used in maritime Search and Rescue (SAR) missions to save people’s lives.1–3Even with good equipment,however,a successful SAR mission still requires careful planning, including determining where to search and how to search. Many countries have invested in developing computer systems and algorithms for SAR mission planning.4–7As an authoritative manual, the International Aeronautical and Maritime Search and Rescue(IAMSAR) Manual provides a method to roughly calculate the possible drifting trajectories of survivors based on the on-scene environment information and provides a multipletrail method for planning search areas when the distribution of the survivors’ probable locations is not standard.8With the development of computer technology and weather forecast technology, more precise environment information can be obtained to predict the survivors’ drift trajectories, making it possible to plan search areas more accurately.9–11Li succeeded in obtaining the probable locations of a search target when the SRU arrived at the scene based on the predicted trajectory and determined the search area for the SRU.12Agbissoh improved the calculation algorithms for the Probability of Containment(POC)and Probability of Detection(POD)based on predicted survivors’ probable locations and studied searching the optimal search area using the cell iterative search method.13In a further study, Ai et al proposed a SAR resource scheduling model based on the genetic simulated annealing algorithm and the regional task allocation algorithm to solve the problems of resource scheduling and task allocation.14Taking the track spacing violation and overlap constraint as constraints,Kratzke et al. performed an accordion search to determine the best size and location of the search area of each SRU based on the probable locations of search targets.15Lv et al. established a model of the discrete maritime static target search problem and proposed an improved Particle Swarm Optimization (PSO) algorithm to solve it.16Chen et al summarized the optimization objectives and constraint conditions of SAR mission area planning according to search theory and then performed parametric modeling of the mission area legitimately and obtained the global optimal solution with the PSO method by continuously exploring the parameter definition domain.17Morin et al proposed the multiple rectangular search area problem and solved it based on mixed-integer linear programming;optimal search areas were planned for multiple SRUs to obtain the highest POS.18Wang improved the calculation algorithm of the POD based on the random search pattern proposed by Koopman and calculated the distribution map of the POS to assist searchers in determining the search area.19
Although there are some methods for planning search areas based on the predicted drift trajectories of the survivors, the search area plan is mainly derived from the continuous expansion of the area with the highest POC,which may lead to local optimal solutions and a decrease in the Probability of Success(POS),especially when there are multiple subareas with a high POC that are far away from one another. To address this problem, this study proposes a method for planning search areas based on a Minimum Bounding Rectangle and Kmeans clustering (MBRK). To determine the optimal number of clusters, a silhouette coefficient is adopted to analyze the distribution of the predicted survivors’probable locations.20,21Then, the probable locations are divided into several clusters with K-means clustering, while the Minimum Bounding Rectangle(MBR)of each cluster is computed to develop probability maps.By adding or subtracting one row or column of cells or shifting the planned search area,12 search methods are used to generate the optimal search area starting from the cell with the highest POC in each probability map to achieve a balance between the coverage factor and POC to obtain the highest POS. Taking a real case that occurred in the Taiwan Strait as an example, the simulation experiment results show that the POS values obtained by the MBRK method are higher than those obtained by other methods, which demonstrates that the MBRK method can effectively support the planning of search areas for helicopter maritime SAR missions and that K-means clustering improves the POS of search plans.
2. Determining optimal search areas with MBRK method
As Fig. 1 shows, the process of planning search areas can be divided into two parts: where to search and how to search.To determine where to search for survivors, the distress incident location and the probable drift trajectories should be estimated based on the on-scene wind and current information.Then, the survivors’ probable locations at the time the SRU arrives at the scene can be calculated.To determine the search areas,the survivors’probable locations are divided into multiple clusters by K-means clustering, while the optimal number of clusters is obtained with the silhouette coefficient. Finally,the probability map for each cluster is developed,and the optimal search areas are generated.The MBRK method proposed in this article mainly focuses on the process of determining how to search for survivors.
2.1. Predict drift trajectory of survivors
The drift trajectories of survivors can be influenced by winds,currents and their own physical properties. Any uncertainties can lead to significant differences in the predicted drift trajectories.22,23To predict the possible drift trajectories of people in distress as comprehensively as possible, Monte Carlo experiments can be used to simulate the effects of various drift possibilities with a large number of samples.24,25In this paper,the drift trajectory of a search objects is predicted with the dynamic drift trajectory prediction method proposed by Wang et al.26in combination with the on-scene environment data,the three-dimensional flow field and the improved AP98 wind pressure model.
As shown in Fig. 2, using 23.82954°N, 119.00897°E as the initial point, 10 possible 48 h drift trajectories of a drowning person are calculated using the meteorological conditions on December 5, 2019.
The distribution of probable positions of the search objects can be obtained by intercepting all of the predicted drift trajectories at a certain time, as Fig. 3 shows.
2.2. Determine optimal number of clusters and divide survivors’probable locations into multiple clusters by K-means clustering
K-means clustering is adopted in this study to divide the probable locations into several clusters. In this paper, each probable location is marked as a point initially assigned a weight of 1. The algorithm of K-means clustering is as follows:
Step 1. Determine the number of clusters k.
Step 2. Select k points randomly as the initial clustering centers.
Step 3. Assign all points to the closest cluster center.Step 4. Calculate the new center of each cluster.
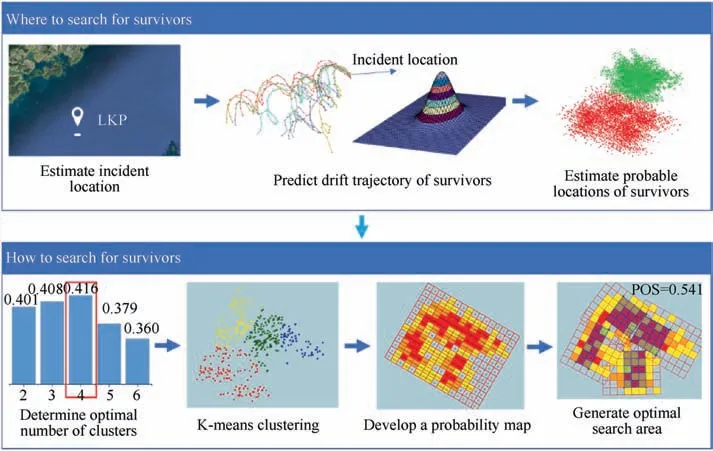
Fig. 1 Process of planning search areas.
Step 5. If the centers of newly formed clusters do not change, stop clustering, otherwise, return to Step 3.
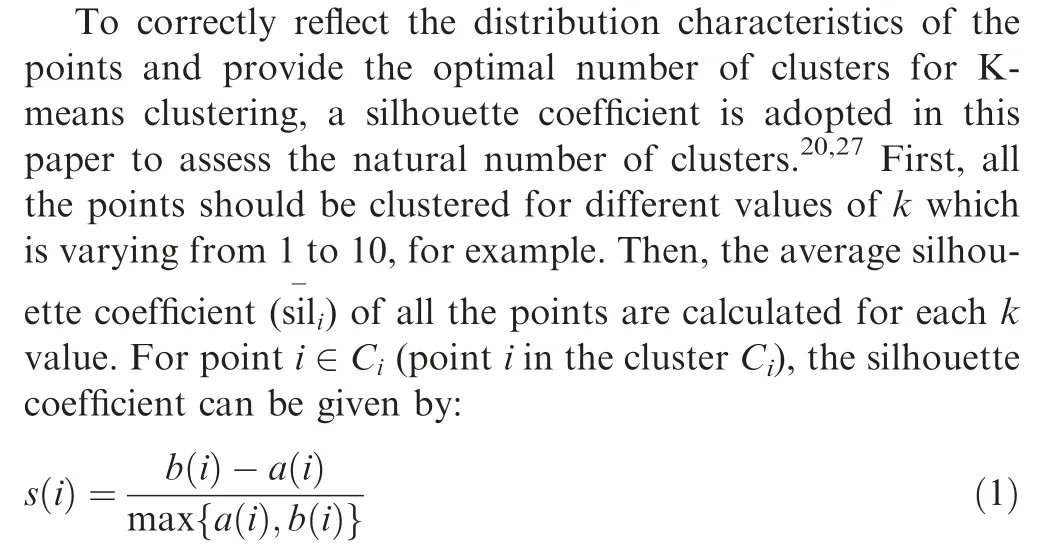
where a(i)is the mean distance to the other points in the same cluster and b(i) is the mean distance to the points of the next closest cluster.
The k value corresponding to the highest average silhouette coefficient is the optimal number of clusters.Fig.4 shows that different numbers of clusters result in different average silhouette coefficients.
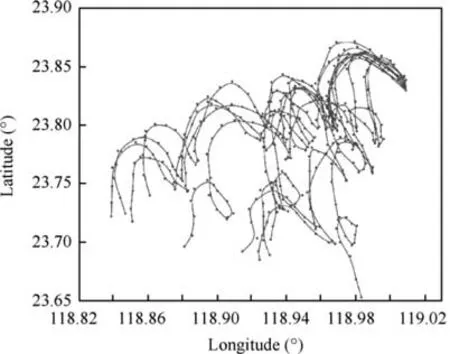
Fig. 2 Examples of possible drift trajectories of a drowning person predicted with dynamic drift trajectory prediction method.
2.3. Generate MBR and develop probability map
As Fig.5 shows,the probability map is defined as‘‘a set of grid cells covering a scenario’s possibility area where each grid cell is labelled with the probability of the search object being in that grid cell. That is, each grid cell is labelled with its own POC value”.8The application of the probability map is beneficial to the planning of the search area. The POC of a single cell is equal to the sum of the weights of the points in that cell divided by the total number of points. The POC of the search area is equal to the sum of the POC of each cell in the planned search area.
To develop the probability map, the minimum convex hull is first generated using the Graham scan algorithm,which is an efficient algorithm for finding the convex hull of a finite set of points in the plane with time complexity O(nlgn).13,14,28Then,the MBR is generated, and the probability map is developed.The detailed steps are as follows.
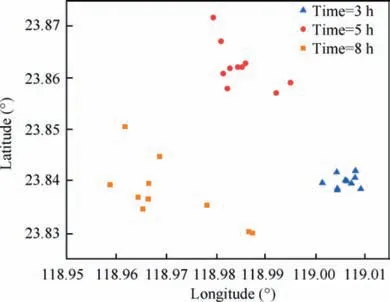
Fig. 3 Probable locations of drowning person at hours 3,5,8.
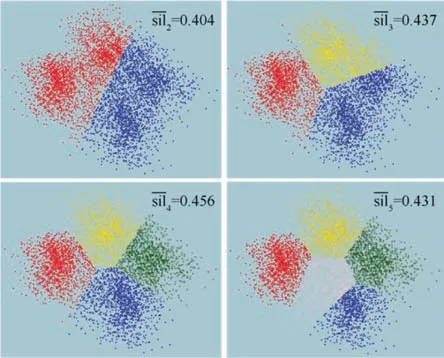
Fig. 4 Different numbers of clusters result in different average silhouette coefficients.
2.3.1. Generate the minimum convex hull
The number of points is assumed to be n.
Step 1. Find the southernmost point. If two more points have the same latitude, then the point with the smaller longitude is considered. Let the point be R0.
Step 2. Sort the remaining points by the polar angle in counterclockwise order around R0,and then generate and sort R.If the polar angles of two points are the same, then put the nearest point first.
Step 3.Create an empty stack S and push R0,R1and R2to S.
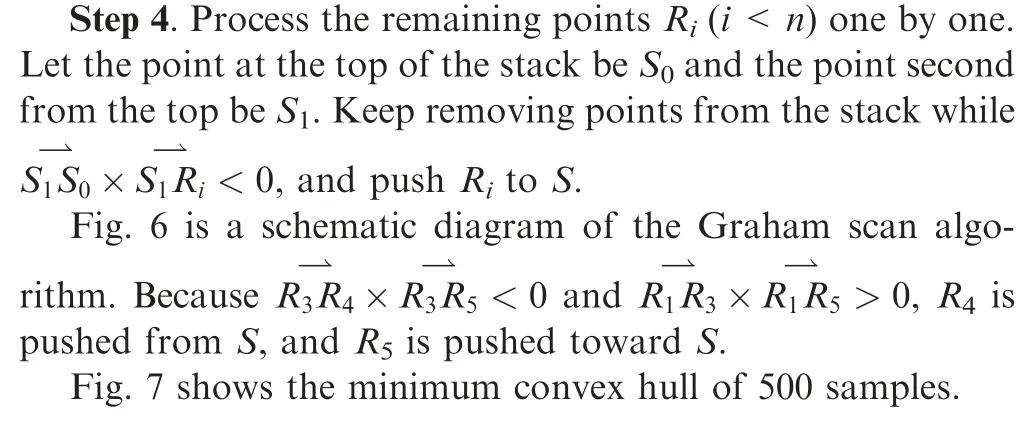
2.3.2. Develop probability map
The number of points is assumed to be n,while the size of the stack S is assumed to be m.
Step 1. Perform a Mercator projection20on the convex points in the stack S.
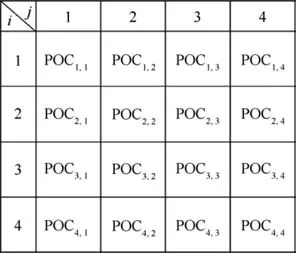
Fig. 5 Probability map.
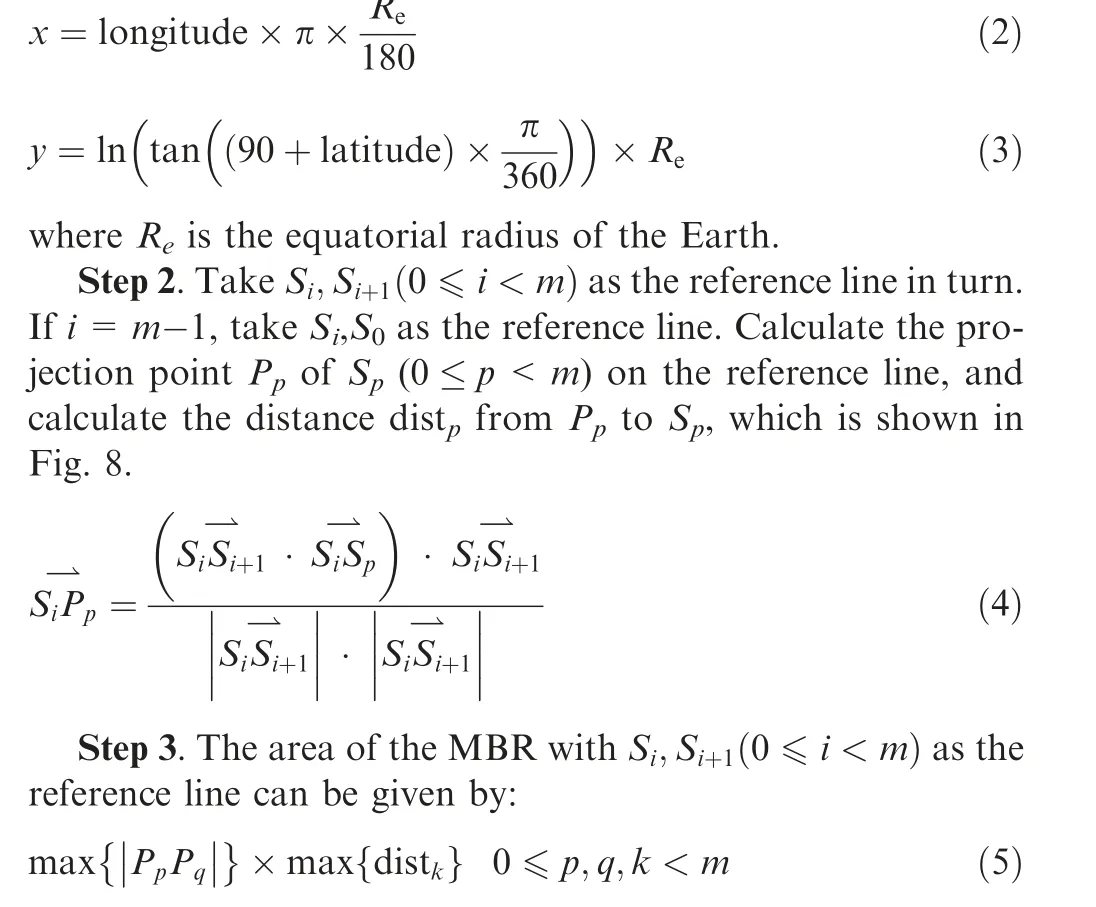
Step 4. The rectangle with the smallest area is the MBR to be solved.The positions of the four corners of the rectangle are calculated as follows.
As shown in Fig.9,the MBR of the 500 points is generated by the control of S8,S9,S4,S1,S13. The positions of the four corners are:
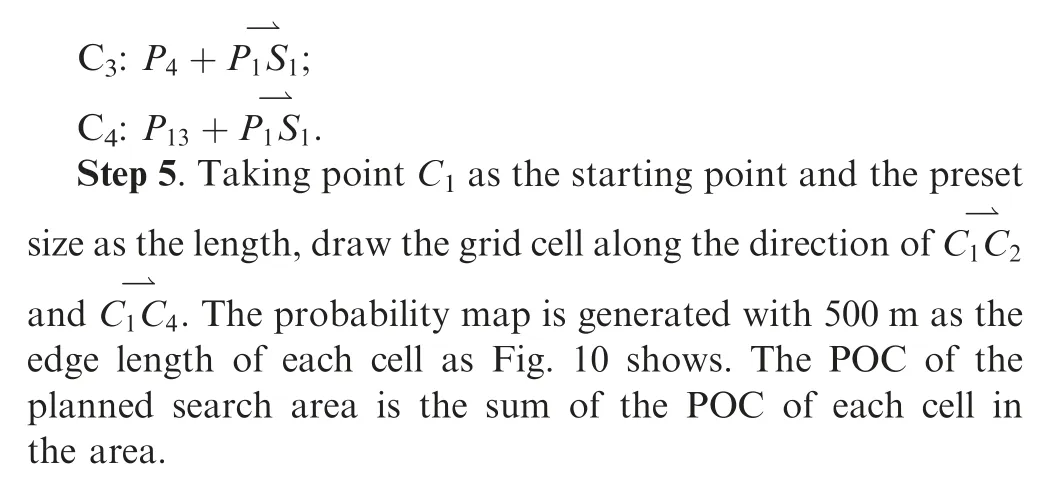
C1: The projection points P13of S13on the line S8,S9;
C2: The projection points P4of S4on the line S8,S9;
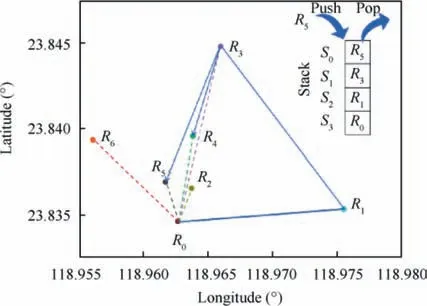
Fig. 6 A schematic diagram of Graham scan algorithm.
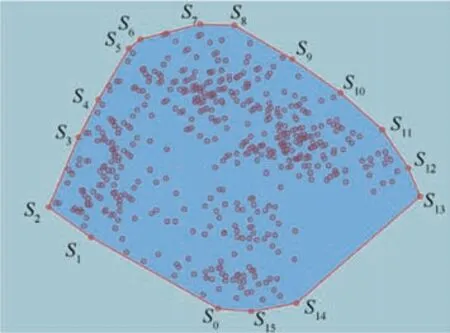
Fig. 7 The minimum convex hull of 500 samples.
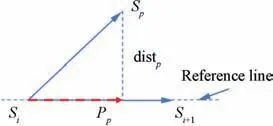
Fig. 8 Schematic diagram of algorithm Step 2.
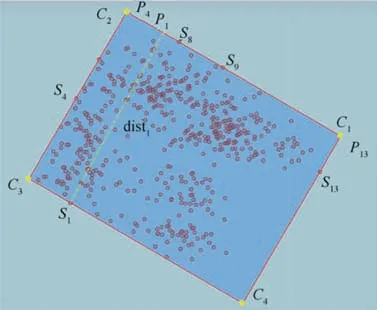
Fig. 9 MBR of 500 points.
2.4. Determine search area
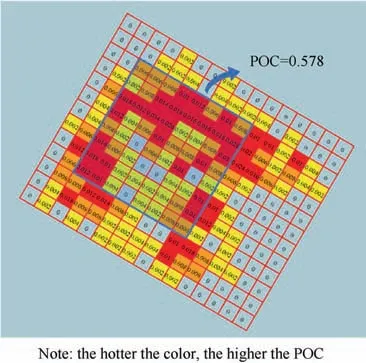
Fig. 10 Probability map of 500 points.
Specifying the planned search area requires five variables.These are the positions of the four corners of the search area and the search time allocated to this search area. The goal of determining the search area is to maximize the Probability of Success(POS)under the constraint of the available search time of the rescue helicopter while the POS in turn depends on POC and Probability of Detection (POD), and they are given as follows.
According to search theory,the POS of a search area can be given by29:

where POD is the probability of the search object being detected, assuming it was in the areas that were searched.The POD is a function of the coverage factor, sensor, search conditions and the accuracy with which the search facility navigates its assigned search pattern and measures the sensor effectiveness under the prevailing search conditions.8
The Coverage factor(C)is the ratio of the search effort(Z)to the area searched (A)29:

The search effort(Z)is a measure of the area a search facility can effectively search within the limits of the search speed(V), search endurance (T), and sweep width (W)29:

The sweep width (W) is a measure of the effectiveness with which a particular sensor can detect a particular object under specific environmental conditions.8IAMSAR provides the sweep widths of common SAR facilities to common search objects and the correction factor under typical environmental conditions.
Assuming that all the points are divided into K clusters,the sum of the weights of the points in the ithcluster is Wiand the total weight of all points is Wtotal.The search time allocated to the ithcluster (Ti) can be calculated by:

The search pattern also affects the POD. Fig. 11 shows three typical search patterns that can be used for different SAR missions. Generally, the Parallel Sweep search (PS) is used when the uncertainty in the survivors’ location is large.It is most effective when used over water.8
Frost concluded that for an inverse cube sensor, the POD for a parallel sweep search pattern can be given by8,29:

As the lateral range function becomes lower, flatter, and more spread out with the worsening of environmental conditions, the POD function for the parallel sweep will approach that of a random search.8The POD can be given by:

Fig. 12 shows the corresponding curves for the average POD in an area covered by equally spaced parallel sweeps as a function of the coverage factor.

Fig. 11 Typical search patterns.3
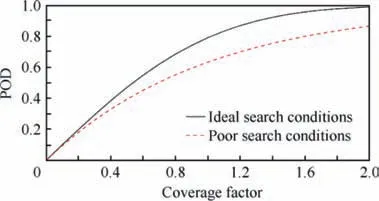
Fig.12 Average Probabilities of Detection(PODs)over an area for visual searches using parallel sweeps.8
The size of the search area affects both the POC and the POD. Due to the limitation of a search effort, a higher POC might be obtained in a larger search area, leading to a decline in the POD,while a higher POD might be obtained in a smaller search area,leading to a decline in the POC.The purpose of search area planning is to generate an optimal search area that obtains a balance between the POC and POD under the limitation of a search effort. In this paper, an iterative method is used. By adding or subtracting one row or column of cells or shifting the planned search area in all four directions, 12 adjustments are used to search for the optimal search area starting from the cell with the highest POC in the probability map. The 12 adjustments are grouped into 3 categories as Fig. 13 shows.
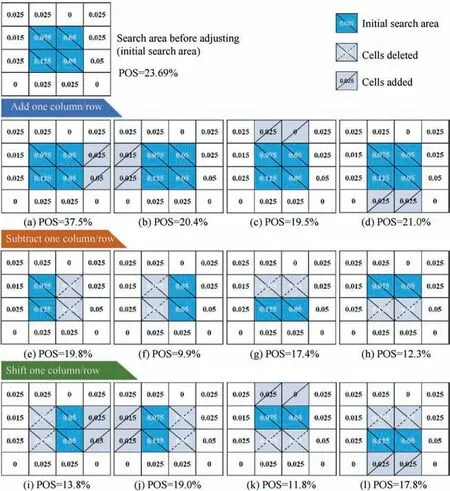
Fig. 13 Schematic diagram of 12 adjustments to the search area and their POS values.
The detailed steps for planning a search area based on each probability map are as follows:
Step 1. Calculate the search time that can be allocated to this cluster.
Step 2.Find the cell with the highest POC in the probability map and start searching for the optimal search area from that cell.
Step 3. Calculate the POS value based on the search area currently planned.
Step 4. Adjust the search area as shown in Fig. 13. Calculate the POS of each search area after the adjustment.
Step 5.If the POS of any search area after the adjustment is higher than before the adjustment, take the search area with the highest POS as the initial search area, and return to Step 4 for the next round of adjustment, otherwise output the search area before the adjustment. As Fig. 13 shows, the POS of the first adjustment is the highest and the search area will be used as the initial search area for the next round of adjustment.
2.5. Estimate POS of planned search areas
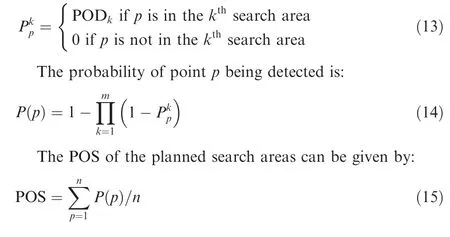
A simplified method is used to estimate the POS of the planned search areas.If there are m search areas and the POD of the kthsearch area is denoted as PODk, the probability of point p being detected in the kthsearch area can be given by:at an altitude of 200 ft (1 ft=0.3048 m) and a speed of 60 kt (1 kt=1.852 km/h). The sweep width is 200 m according to IAMSAR Manual, and the weather correction factor is 0.5 based on the on-scene environment conditions. The search effort is computed as follows:

The distribution of the survivors’ probable positions when the helicopter arrived at the scene is shown in Fig. 14.
According to the bar plot shown in Fig. 15 of the average silhouette coefficients resulting from K-means clustering of the probable positions, 3 is selected as the optimal number of clustering, and the search areas planned are shown in Fig. 16.
To further study the performance of the MBRK method in different distribution ranges of the survivors’locations,search areas were planned using the MBRK method, the MBRK method without clustering (marked as MBR method) and
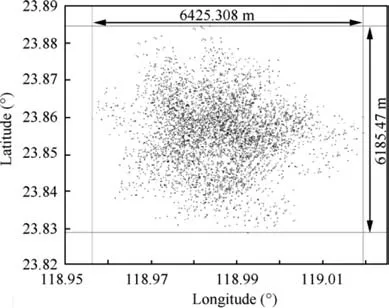
Fig.14 Distribution of survivors’probable locations at 9:00 am.
3. Simulation experiments and discussion based on a real case
Simulation experiments were conducted based on a real case as follows.
At 5:30 am on December 5, 2019, the fishing vessel numbered ‘‘Minshi Yu 07705” sank in the waters at 119°0’32”E,23°49’46”N,30and four fishermen fell into the water and disappeared.The B-7346 helicopter belonging to the Donghai No.2 Flying Service of Ministry of Transport took off from the Xiamen Gaoqi International Airport at 8:18 am and arrived at the scene of the accident at 9:00 am for the SAR mission.
Considering the error of the location, 100 positions were randomly selected around the Last Know Point (LKP) within a radius of 2 km as the initial positions of the samples to estimate the probable drift trajectories of the survivors. For each initial position, 50 samples were used for the Monte Carlo experiment.
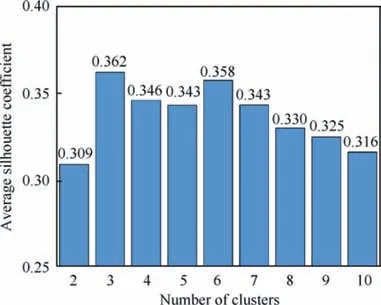
Fig.15 Bar plot of average silhouette coefficients resulting from K-means clustering of probable positions using a number of clusters in range of 2–10.
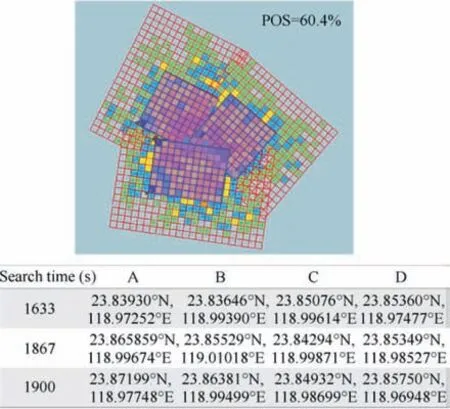
Fig. 16 Search areas planned with MBRK.
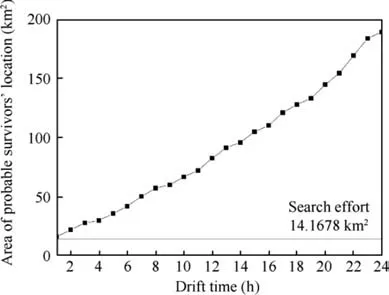
Fig. 17 Area of probable survivors’ location at different time.
Assuming that the on-scene endurance of the helicopter is 90 min, the search endurance can be calculated as 0.85×90=76.5 min. The helicopter searches for survivors the PSO method16,17with the drift time varying from 1 to 24 h to represent different distribution ranges. The POS values of different search plans were calculated by Eq. (15). Fig. 17 shows that the area of probable survivors’ locations increases with the drift time.
The comparison of POS values obtained by the MBRK,MBR and PSO methods with drift time varying from 1 to 24 h is shown in Fig. 18, and the optimal numbers of clusters for the MBRK method are given simultaneously.We can conclude that the POS obtained by the MBRK method is the highest and that the advantage of the MBRK method becomes more obvious as the area of the distribution of the survivors’probable locations increases. Moreover, the POS obtained by the MBRK method is higher than that obtained by the MBR method, which demonstrates that K-means clustering improves the POS of search plans.
4. Conclusions
Existing search area planning methods for helicopter maritime SAR missions may easily obtain local optimal solutions, especially when the search area is large. This paper proposes the MBRK method to plan multiple search areas for the rescue helicopter based on the predicted drift trajectories of the survivors to obtain a higher probability of finding survivors.A silhouette coefficient is used to obtain the optimal number of clusters, and K-means clustering is used to divide the survivors’probable locations into several clusters.Then,the probability map is developed based on the MBR of each cluster.Twelve search methods are used to generate the optimal search area starting from the cell with the highest POC in each probability map by adding or subtracting one row or column of cells or shifting the planned search area. Consequently, a balance between coverage factor and POC is achieved, and the highest POS is obtained.
Taking a capsizing incident that occurred in the Taiwan Strait as an example, the simulation results show that the POS values obtained by the MBRK method are higher than those obtained by the MBR and PSO methods,and the advantages become more obvious as the area of the distribution of the survivors’ probable locations increases. The MBRK method strongly supports the planning of helicopter maritime search areas and can be used as the basis for the study of more complex SAR mission planning involving multiple SRUs and multiple sorties to aid increasingly busy maritime production operations.
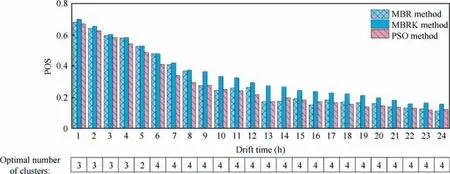
Fig. 18 Results of experiment.
Declaration of Competing Interest
The authors declare that they have no known competing financial interests or personal relationships that could have appeared to influence the work reported in this paper.
 CHINESE JOURNAL OF AERONAUTICS2021年2期
- CHINESE JOURNAL OF AERONAUTICS的其它文章
- Recent active thermal management technologies for the development of energy-optimized aerospace vehicles in China
- Electrochemical machining of complex components of aero-engines: Developments, trends, and technological advances
- Recent progress of residual stress measurement methods: A review
- Micromanufacturing technologies of compact heat exchangers for hypersonic precooled airbreathing propulsion: A review
- Towards intelligent design optimization: Progress and challenge of design optimization theories and technologies for plastic forming
- A combined technique of Kalman filter, artificial neural network and fuzzy logic for gas turbines and signal fault isolation
