Aerodynamic investigation of twist angle variation based on wing smarting for a flying wing
Ruhollah KARIMI KELAYEH, Mohammad Hassan DJAVARESHKIAN
Department of Mechanical Engineering, Ferdowsi University of Mashhad, Mashhad, Iran
KEYWORDS Aerodynamics;Flying wing;Twist;Wing smarting;Numerical simulation
Abstract In this paper, the effects of twist angle variation on aerodynamic coefficients and flow field on the wing with wing smarting approach are studied using numerical simulation. The simulation was performed using incompressible Reynolds-Averaged Navier-Stokes (RANS) equations based on the two-equation k-ω Shear Stress Transport (SST) turbulent model for flow speed 30 m/s and a Reynolds number of 69000. Investigations have been carried out for several twist angles and at a specific range of angles of attack. The twist applied is the type of geometric twist(wash-out), which is linearly distributed along the span. The test case is a lambda-shaped tailless aircraft with a wing fracture on the trailing edge,and a sweep angle 56°.The results show that with increasing twist angle, the aerodynamic efficiency improves over a wide range of angles of attack,but at 0°angle of attack it will decrease significantly.By increasing the angle of attack,the effect of twist on the flow field and aerodynamic coefficients will gradually decrease; hence, at a certain amount of angle of attack, the effect of twist will stop, that angle is called the neutral brink angle.Longitudinal stability analysis shows that by growing the twist angle, the conditions required for longitudinal stability are satisfied, and the pitch-up phenomenon will be delayed.
1. Introduction
A survey of designed aircraft in recent years shows that the configuration of the flying wing has been taken into much consideration. In the configuration, the drag force decreases sharply because of the reduction of the wetted surface area and the flow interferences on the body due to the removal of the vertical and horizontal tails.1The monolithic structure of the flying wing geometry causes the whole body has a contribution to lifting force production, which increases aerodynamic efficiency,range,and flight endurance;2–5by removing the vertical and horizontal tails, the vertical body angles reduce;therefore, declining the Radar Cross-Section (RCS) and increasing the capability of stealth.6–8Today, the above features have led many military aircraft to benefit this configuration in the form of reconnaissance, surveillance, and combat Unmanned Air Vehicles (UAVs).9,10
In addition to the mentioned advantages, there are some problems in the field of stability and control for this type of aircraft, which has caused many kinds of research and studies to resolve them. Removal of the horizontal tail has led to the use of a wing with the relatively high aft-swept angle, in order to satisfy longitudinal stability.11Dehghan et al.12analyzed a model of lambda-shaped flying wing aircraft experimentally.The results show that 2°increasing in sweep angle of the wing cause 1°increasing in the Angle of Attack (AoA)α of starting pitch-up. Also, by increasing the sweep angle, the slope of the pitch moment curve decreases, because the center of pressure of the wing move backward and lead to increase longitudinal stability. Alongside the above advantages, the aft-swept wings also have problems;that most important of which is the unsatisfactory performance of the wingtip at high angles of attack and starting the flow separation from these areas.13It reduces the aerodynamic efficiency as well asa performance of the control surfaces located on the out parts of the wings; as a result,the performance of the control system is reduced.14
Applying a wash-out to the wing,the angle of attack of the Wing Outer Sections(WOS)decreases,and therefore,the start of separation in these regions will delay,which improves aerodynamic efficiency and also the performance of control surfaces at high angles of attack.15Also, the aft-swept wing with wash-out can be used as a useful method to improve longitudinal stability.11,16Lyu and Martins studied several design variables, in order to optimize a flying wing aircraft model;they concluded that reducing the induced drag and also increasing the stability of the aircraft is due to wash-out.17Researches show that applying a Twist Angle (TA) appropriate to flight conditions for a wide range of wing geometries except for the wing with an elliptical horizontal view reduces the induced drag and fuel consumption.18,19Due to the contradictory performance of the wash-in to the wash-out, its application to the wing has not received much attention. Rodrigue et al.20increased the angle of attack of the WOS using wash-in,which leads to increase in the lift force in low angles of attack.However, by increasing the angle of attack for more than 8°,applying wash-in on the wing reduced the lift coefficient.Also,compared to the case without the twist angle, the drag coefficient at α=6° increased sharply, which has led to a decrease in aerodynamic efficiency.
The variable behavior of the geometrical parameters of the wings in different flight conditions has given rise to the idea of wing smarting. Accordingly, by changing the geometrical shapes,the aircraft can be placed in the best aerodynamic conditions. The most essential thing in the wing smarting is morphing technology; this technology enhances the aircraft’s ability to perform various missions by changing the shape of the wing and body.21This will be accomplished through various methods,including the use of smart and adaptable materials such as Shape Memory Alloys (SMS), Shape Memory Polymer (SMP), Piezoelectric material, etc.22. Morphing can create smoother aerodynamic surfaces and reduce wing mechanical components. Pecora et al.23used from variable camber at the trailing edge to optimize takeoff and landing performances. In another study, they also introduced a strategy for roll control in an aircraft with a high aspect ratio;the system was based on the twist angle change in a morphing wing.24Lyu and Martins25using the morphing approach,optimized the trailing edge, and adapted it to flight conditions,which resulted in reduced drag force and fuel consumption.Woods and Friswell26introduced a wingspan morphing concept, this concept couples a compliant skin to a mechanism based on an internal structure to create a morphing wing able of changes in span and aspect ratio.
The most significant goal of this study is to improve the flight performance of flying wing aircraft based on making the wing smart. For this purpose, the most optimum amount of twist in each flight condition can be applied to the wing according to the morphing technology to maintain longitudinal stability along with preservation and upgrade of aerodynamic efficiency in a wide range of angles of attack. A prerequisite for this is to discover how the aircraft is affected by a specific range of twist angles and at different angles of attack; the matter, which was not observed by researchers of this study, for tailless aircraft, especially the studied model in this research.In this study,which is based on numerical simulation, the effects of the twist angle (wash-out) on the aerodynamic coefficients and the flow field around the wing have been investigated for a flying wing configuration called swing. The simulation was performed for three different twist angles in the range of 0°to 6°,and the range of-5°to 20°for the angle of attack. The applied twist angle on the wingtips is a kind of geometrical twist which is distributed linearly along the wingspan.
2. Test case
The investigated geometry is a lambda-shaped tailless aircraft model with a fracture on the trailing edge of the wing, which uses a wing with a sweep angle 56°.The planform of the swing model and its geometrical characteristics are shown in Fig. 1 and Table 1. The airfoil used in this model is NACA66009,which is a symmetrical airfoil. The existing bump across the middle part of the body is intended for the installation of the engine, communication and imaging systems and for approaching the characteristics of the study to operational standards. Also, it has been used small corners in the body to improve stealth capability. Fractures at the leading edge have increased the aspect ratio and taper ratio, which leads to increase in aerodynamic efficiency.Experimental tests about this model are performed in the low-speed wind tunnel of L-2000 at the Royal Institute of Technology(KTH)(Fig.2).Further details about the test conditions are available in Refs.27,28.
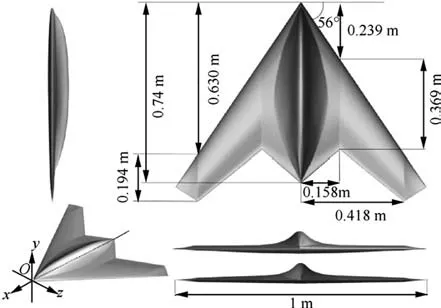
Fig. 1 Planform and geometric data of model.
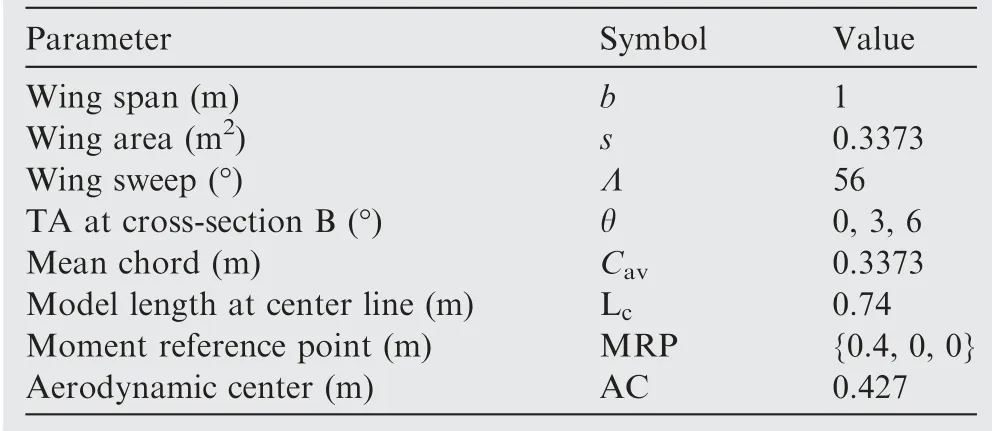
Table 1 Model parameters.
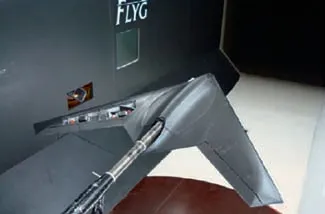
Fig. 2 Swing model located in wind tunnel.7
Fig.3 illustrates how the twist is applied in this simulation;in order to obtain a geometric twist in the outer areas of the wing (blue region), cross-section A was considered fixed, and cross-section B is twisted up around the Leading Edge (LE),to obtain a negative twist angle (wash-out), and TE is trailing edge.The changes in the twist angle are linear along the wingspan, and the twist angle will gradually increase, from crosssection A to cross-section B. The twist angle from crosssection B to wingtip with zero chords, will be equal to crosssection B.
3. Numerical simulation method
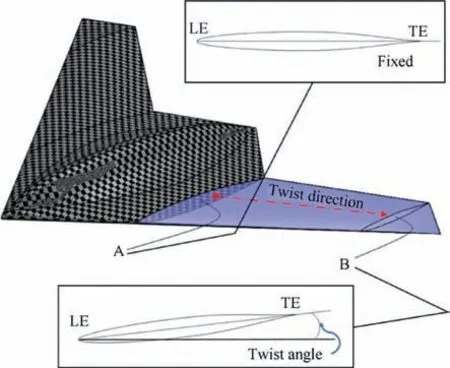
Fig. 3 Twist angle distribution along wing span.
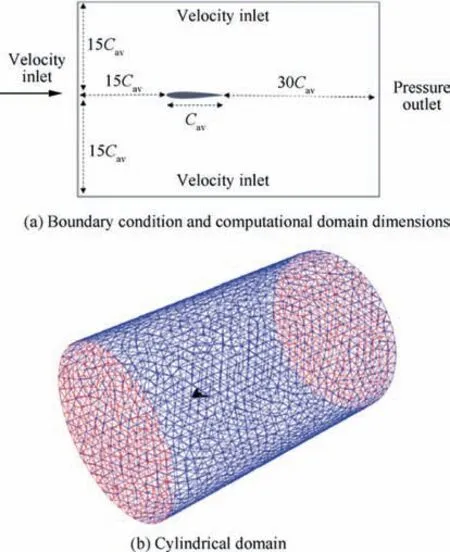
Fig. 4 Computational domain and boundary condition.
In the present simulation, the Reynolds-Averaged Navier-Stokes (RANS) equations are discretized using the finite volume method and then are solved. For coupling the velocity and pressure terms, the Simple C algorithm was used. This algorithm benefits a semi-implicit method for coupling the equations of momentum, continuity, and pressure29. Performed calculations are time-independent, and no-slip conditionis applied to the model body surface. The velocity of the free stream is 30 m/s consistent with experimental test conditions, which, concerning to the mean aerodynamic chord 0.3373 m and standard atmosphere condition at the sea level,the Reynolds and the Mach numbers will be 690,000 and 0.125 respectively. The turbulence of the flow is simulated using the two-equation k-ω-SST model of Menter30. This model has good accuracy in simulating separated flows and adverse pressure gradients. Also, unlike the (k-ω-Standard)model, this model is independent of free stream ω31. Due to the incompressibility of the flow, the velocity inlet boundary condition has been chosen for inlet Fig. 4(a). The turbulence intensity is not mentioned in the technical report of the experimental test,and so,the amount of this parameter was considered small and about 1%, in which the best agreement was achieved between the experimental and numerical results.For discretizing the term pressure, the second-order scheme,and for discretizing the equations of momentum, turbulent kinetic energy and dissipation rate,second-order-upwind,were used. Also, the gradient terms in the Navier-Stokes equation are discretized employing the least squares cell-based method.This method calculates the gradient values using the amounts of the neighboring cells of the surface and using a changes function based on the surface geometry32. Because of the flow pattern symmetry, the simulation is performed for half of the model.
4. Computational grid
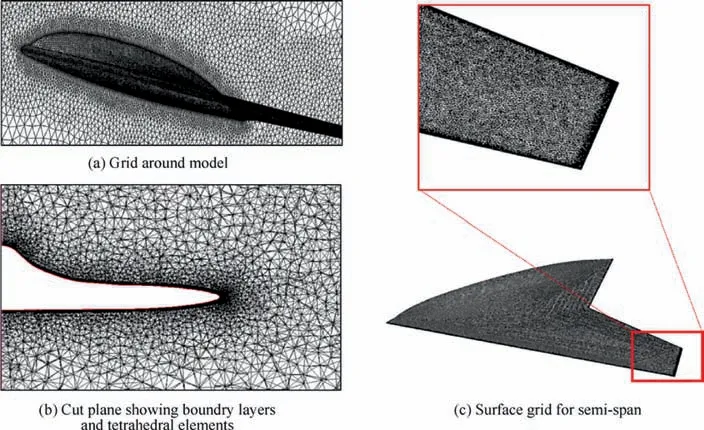
Fig. 5 Computational grid in different views.
The RANS mesh was produced in hybrid on a cylindrical domain Fig. 4(b). This mesh is a combination of prismatic,tetrahedral, and pyramidal elements. About 22% of the grids are prismatic elements of the surface mesh and boundary layer.Due to the complexity of the boundary layer mesh generation process on the fracture region of the wing at the trailing edge,only a small number of pyramidal elements(less than 0.1%of the total grids) are used, and tetrahedral cells have been applied for the rest of the domain. Fig. 5 displays a view of the generated mesh around the model.Due to the high velocity and pressure gradients,the mesh is finer near the leading/trailing edge and the wingtip.Besides the density of mesh increased around and downstream of the model. For this purpose, a cubic structure to height 15Cavis drawn from the nose of the model to the downstream location, and grid density is increased in this cube.To model,the boundary layer was used automatic near-wall treatment with y+value of less than 100 for all areas of the body33. To ensure the accuracy of the results and its independence on the number of cells, the drag coefficient was evaluated at α=10°,for five meshes with a different number of cells.The variation of the drag coefficient CDfor different cell numbers is shown in Fig.6.According to the trend of the curve,it is clear that the grid 3 is the most appropriate one in terms of accuracy and value of the computation.
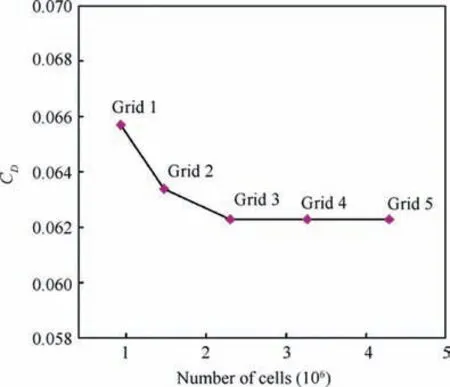
Fig. 6 Mesh convergence.
5. Results and discussion
5.1. Validation
In order to evaluate the accuracy of the results, obtained values for the lift and drag coefficients, are compared with the experimental data presented in Ref. 7. Fig. 7 displays the lift coefficient CLfor different angles of attack. According to this figure,numerical simulation has been able to predict the trend of experimental data accurately. There is also a perfect agreement with the mentioned reference in terms of result’s values.However, in general, the numerical results under estimate the coefficient of lift to a very insignificant amount, for all angles of attack. The maximum amount of the difference occurs at α=20° and is about 5.11%.
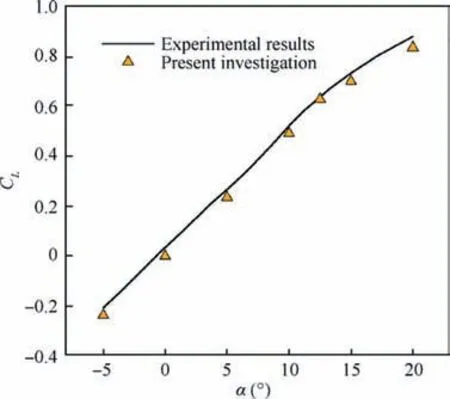
Fig. 7 Comparison between computation result and experimental data7 for lift coefficient.
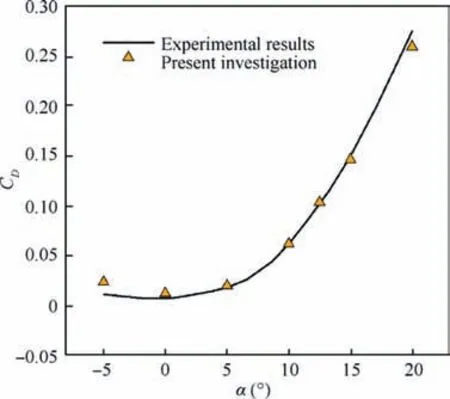
Fig. 8 Comparison between computation result and experimental data7 for drag coefficient.
To improve the validation,the drag coefficient and its comparison with the experimental data are shown in Fig. 8. As reported by the figure,the results obtained for the drag coefficient, such as the lift coefficient, are in good agreement with the experimental data; but there is still a 5.5% error at α=20°.Based on the results,it is evident that the existing differences appear at high angles of attack, because the flow structure on the wing at high angles of attack is oscillating and turbulent, which has caused the turbulence model and steady of the solution process, to be recognized as a reason for existing differences.
In order to better evaluate the accuracy of the numerical simulation,a comparison is made between the shear stress distribution and surface streamlines in this study with the visualization technique by fluorescent oil in the experimental study.According to experimental data in Fig. 9(a), a bright-line has begun to form of the leading edge and close to cross-section A(see Fig.3)and continues to the outermost part of the trailing edge.This line shows the region of flow separation.At the downstream of this line, a strong vortex is formed that produces a lateral flow at the wing surface.The shear stress distribution in Fig. 9(b) shows that the separation region predicted by numerical simulation is in good agreement with the experimental data. Furthermore, the lateral flow path at the wing surface is very similar to experimental data,but there is a slight discrepancy in the wing fracture region. Also, areas of high shear stress in the CFD result indicate the trajectory of vortices formation behind the separation line.
6. Aerodynamic coefficients
6.1. Lift coefficient
Lift coefficient variations versus different angles of attack and twist angle θ are shown in Fig. 10. It can be seen that in general, the lift coefficient decreases as the twist angle grows;because increasing the wash-out reduces the local angle of attack in the WOS; as a result, lift production weakens in this region. At α=0°, due to the lack of flow separation and formation of the wing surface vortices, the lift force will typically be produced(conventional lift),and there will be no vortex lift.Also, this is partly correct for angles of attack 5° and -5°.Hence, the vortex lift at these angles will be very slight. In the above range of angle of attack,with the growth of the twist angle, the curve slope remains constant, but the lift coefficient decreases by a certain ratio. This is due to the arithmetic progression in the twist angle increment, and also the lack of a substantial change in the flow structure on the wing. According to Fig.11,it is observed that at each of the angles of attack 5°, 0°, -5°, pressure distribution, and a relatively similar streamline pattern occur along the wingspan; this means that the WOS will have the same function as the inner areas of the wing. This has caused, by changing the angle of attack in the mentioned range,the participation percentage of the outer parts of the wing in the lift production stays almost constant;hence increasing the twist angle will have a relatively similar effect on changing the lift coefficient for all three angles of attack.
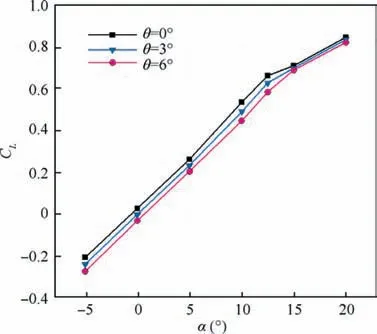
Fig 10 Lift coefficient variation with AoA and TA.
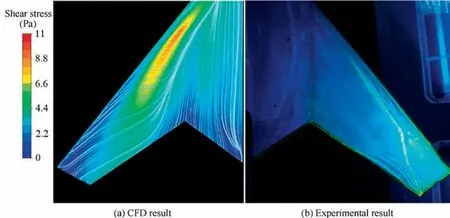
Fig 9 Comparison of shear stress distribution in CFD result and oil flow visualization in experimental.7

Fig. 11 Stream lines and pressure coefficient distribution at the θ=0°.
By increasing the angle of attack up to 10° and 12.5°, the effect of the twist has increased, and the lift coefficient has undergone further changes.At the angles of attack mentioned,due to the separation of flow at the leading edge and the growth of pressure gradients, the flow of structural changes and the wing surface vortices will be strengthened.Hence,coupled with conventional lift production,there will also be a vortex lift.Researches show that if the wings have a significant aftswept angle, the separated flow in the leading edge and pressure difference between the lower and upper surface causes the formation of stable conical vortices. These vortices reduce the pressure on the wing surface and cause the production of vortex lift.11By growing the twist angle and consequently reducing the angle of attack in the WOS, the conventional lift will decrease; this decrease with the same constant ratio of lift coefficient changes will occur at low angles of attack. Nevertheless, the factor that increases the lift coefficient changes in α=10° and 12.5° is the wide variation of the vortex lift due to the increased twist angle. Something that is not important at low angles of attack. Variations of the flow pattern and weakening of the leading edge vortices at α=10° are displayed at the Fig.12.With the increasing twist angle and subsequently decreasing the separation of flow in the leading edge,the process of cone vortices formation and their development in the WOS will be delayed. Therefore, the vortex lift will be significantly reduced. Variation of the pressure coefficient on the upper surface of the wing is shown in Fig.13.Regions with the minimum pressure coefficient at each twist angle,represent the location of the vortices formed on the wing. It is observed that by growing the twist angle,the pressure drop on the WOS is decreased, and the graph is flat in these regions. This indicates the weakening of the vortices formed on the wing and consequently,a reduction in the vortex lift;the same argument exists at the 12.5°angle of attack.In general,it can be said that at angles of attack of 10° and 12.5°, due to the reinforcement of the leading edge vortices and the strong influence of the WOS on the organization of the vortices, twist causes significant changes in the lift coefficient.
At α=15° and 20°, the change in the twist angle will not have much effect on the lift coefficient. This will be due to the slight impressionability of the flow pattern from the twist angle variations. According to Fig.12 it can be observed that,for mentioned angles of attack, by growing the twist angle up to 6°, the flow structure on the wing remained virtually unchanged. Because of the increasing angle of attack and as a result, the vast separation of the flow at the wingtip, the performance of the WOS will decrease. Since the twist angle growth causes the geometrical structure of the wings to change in the WOS, accordingly,its performance in affecting the flow pattern will be significantly diminished. This results in minor variations in the vortex and conventional lift.
6.1.1. Drag coefficient
The drag coefficient variation with angle of attack and twist angle is demonstrated in Fig. 14. According to this figure,the effects of a twist on the drag coefficient at high angles of attack is more fabulous than low angles of attack.Meanwhile,the minimum effect of twist is observed at α=0°.At this angle of attack,the viscous drag has a high contribution to the total drag. Fig. 15 shows the variations of the skin friction drag coefficient Cfat θ=3° and 6° versus θ=0°. At zero angle of attack, the skin friction drag coefficient decreases at both twist angles,especially at θ=6°.Because the wash-out causes increment absolute value of the angle of attack in the WOS,this diminishes the contact surface of flow with the wing; as a result, the viscose drag is reduced. On the other hand, due to the increasing projected frontal area in the WOS, the pressure drag will augment. Superposition of the mentioned alterations results in a negligible difference in the drag coefficient at this angle of attack.
Increasing the angle of attack, and thereby enhancing the pressure forces, enhancements the difference in the drag coefficient.As shown in Fig.14,the growth of the twist angle leads to a decrease in the drag coefficient. One of the reasons is reducing the contribution of the WOS to lift production. This causes the distribution of the lift to approach the elliptical distribution and thus reducing the downwash. Therefore, this leads to the reduction of the induced drag. Variation of the pressure drag is another effective factor for such a difference.Unlike α=0°, by growing twist angle at α=5° to 20°, local angle of attack in the WOS will decrease, which reduces the projected frontal area.Hence, the pressure drag is diminished.At angles of attack greater than 10°, the viscosity effects will have a meager impact on total drag. So changes in the skin friction drag can be ignored.By contrast,at α=5°,the change of skin friction drag will be effective.According to Fig.15,the growth of the twist angle at this angle of attack increases the skin friction drag,which partly offsets the decrease in pressure drag and causes a slight difference in the total drag. Further details on how twist affects the frictional force and shear flow structure are presented in Section 5.3.2. In comparison the lift coefficient graph at low angles of attack, which shows a constant difference of the lift at various twist angles,there is a uniform difference of the drag coefficient at high angles of attack(10° to 20°), which the reason is the same effect of induced drag and profile drag superposition. As shown in Fig. 14, at α=-5°, unlike the positive angles of attack, the drag coefficient growths with increasing of the twist angle.Since the angle of attack is negative here, the wash-out leads to an increasing angle of attack of the WOS and projected frontal area, which will increase the induced drag (due to negative lift) and the pressure drag, respectively. But a significant reduction in skin friction drag will somewhat offset the growth of the pressure and induced drag Fig. 15.
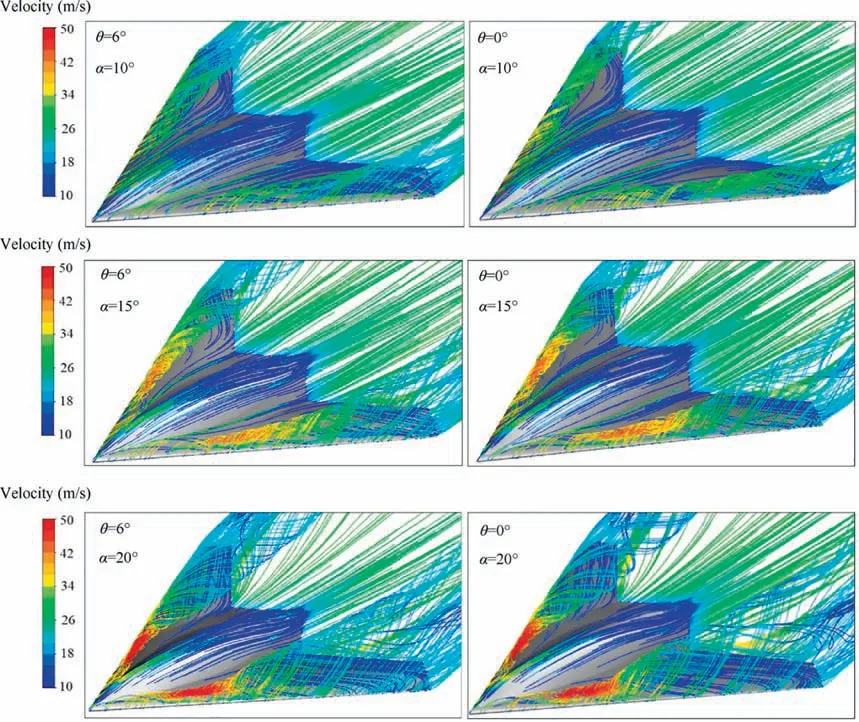
Fig. 12 Pattern of stream lines on the wing at different AoA and TA.
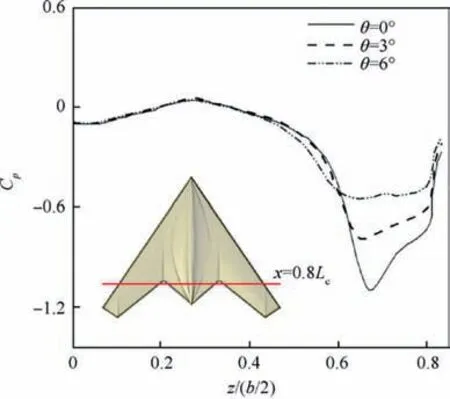
Fig. 13 Pressure coefficient for longitudinal cross section at α=10°.
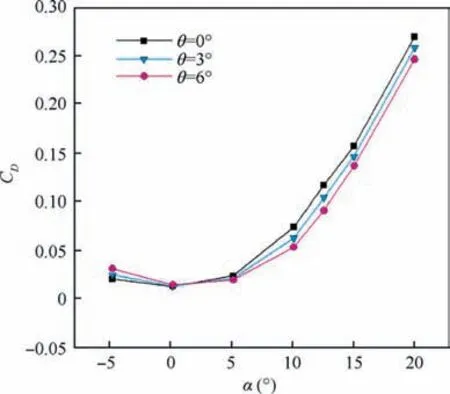
Fig. 14 Drag coefficient variation with AoA and TA.
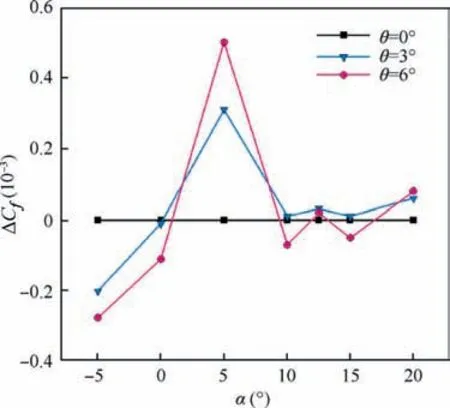
Fig.15 Changes in Cf values relative to θ=0°degree at different AoA.
6.1.2. Aerodynamic efficiency
Fig. 16 illustrates the opposite effect of the twist angle at high and low angles of attack. Applying the twist angle at high angles of attack,such as 10,12.5,15 and 20 degrees, increases the aerodynamic efficiency.It is predicted that the highest positive effect of twist occurs at α=10°. At this angle of attack,by growing the twist angle up to 6°, aerodynamic efficiency had a 15.5% enhancement. This means that, for maximizing the benefit of the twisting performance and improve aerodynamic efficiency, the flight must happen within the range of this angle of attack. At α=12.5° the growth of aerodynamic efficiency due to twist will be 13%, and at α=15° with a 4% decrease compared to the α=10°, it reaches about 11.5%. The increment of the aerodynamic efficiency caused by a twist has fallen sharply at α=20°. Therefore, it can be said,the twist at this angle of attack,will not have much application.It is clear that for high angles of attack,the twist can be effective only in a specific range of angles of attack. This impact occurs with the improvement of the WOS performance.Overall,considering the flight conditions and also,geometrical characteristics of the model,to introduce a feature of twist,an angle of attack that called Neutral Brink Angle (NBA) can be suggested.Hence,for angles bigger than that,the twist cannot affect the flow wingtips performance and aerodynamic efficiency.The NBA for this model and these flight conditions will be in the range of 20°.
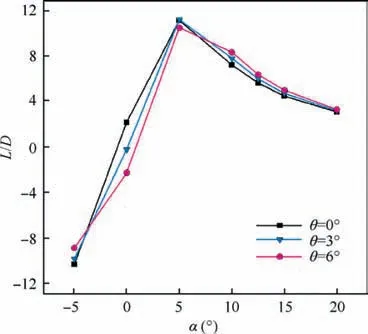
Fig. 16 Lift-to-drag ratio variation with AoA and TA.
Unlike high angles of attack,growing the twist angle at low angles of attack has a negative influence on aerodynamic efficiency in which the maximum influence is observed at α=0°.Lift force drop caused by the negative angle of attack in the WOS and lack of decrease in drag force are reasons for aerodynamic efficiency decrement in this angle of attack. According to Fig. 16, the highest L/D value exists for all three twist angles at α=5°. Therefore, this angle is introduced as the angle of attack of the cruise phase. It can be seen that by increasing the twist angle up to 3°, there is no change in the aerodynamic efficiency. But at θ=6° the aerodynamic efficiency decreased. At α=-5° negative L/D decreases with the growth of twist angle. Because the increase in drag force due to the reinforcement of the pressure drag will be more effective than the increase in negative lift force.
It is clear that applying the twist angle can result in an increase in aerodynamic efficiency in a wide range of attack angles. Meanwhile, the α=5° should be very noticeable; it was found that twist had a negative function at this angle of attack and reduced the aerodynamic efficiency of the cruise phase. This results in increased fuel consumption and reduced range and endurance of flight. But without considering longitudinal stability conditions, the twist cannot be considered harmful in the cruise phase. This is discussed in the next section.
6.1.3. Longitudinal stability
In high angles of attack,due to the change of flow pattern and non-linear variation of lift force (representative of moment force), the moment around the aerodynamic center changes,and this location losing its essence.Therefore,the pressure center location has been used for longitudinal stability surveys at a high angle of attack.Also,according to the right-hand law,the positive direction of the pitching moment around the lateral axis is related to the clockwise rotational direction, indicating upward rotation of the nose.
The pitching moment coefficient Cmvariation with angle of attack and twist angle is demonstrated in Fig. 17. Generally,without considering the twist effects, the stability condition of Cmα<034for zero twist angle up to α=10° and for twist angles 3° and 6° up to α=12.5° is established. Because, due to the high sweep angle of the wing, the aerodynamic center location, XACwill be located behind the Moment Reference Point (MRP). Hence, the Static Margin (SM) will be positive.This is understandable from Eqs. (1)–(3)16,34:
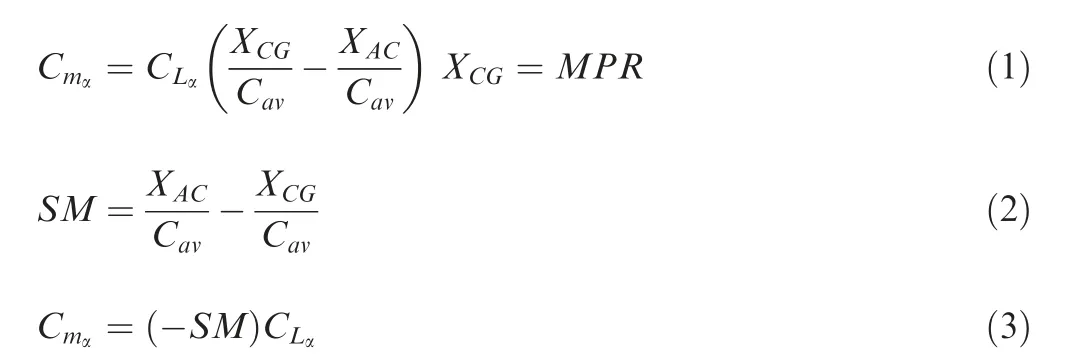
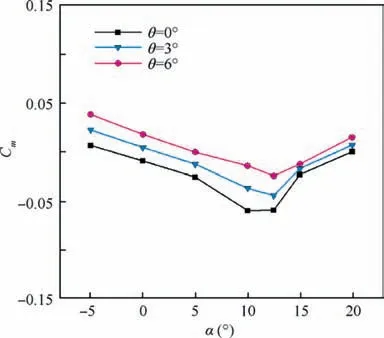
Fig. 17 Pitching moment coefficient variation with AoA and TA.
where XCGthe center of gravity, Cmαthe slope of the pitching moment curve, CLαthe slope of the lift coefficient curve. The variation of pressure center location Xcpin the longitudinal direction is shown in Fig. 18 and Table 2. By increasing the angle of attack in all twist angles,Xcpmoves towards the nose of the aircraft. Hence the distance between Xcpand the MRP location will be reduced. Consequently, the moment arm length, Larmdecreases. Therefore, the absolute value of the moment coefficient decreases at α=15° and causes the slope of the momentcurve to be positive. This will be a start forpitch-up phenomena. Besides for α=20°, this trend will continue and cause Cmto be positive.
Hitherto,the general trend of Cmvariations versus angle of attack was studied without considering the twist effect. Now,the twist angle effects on Cmvalues will be investigated.
The Cmα<0 is the necessary condition for longitudinal stability,but it is not sufficient condition.The pitching moment at α=0°should also be positive(Cm0>0)to establish longitudinal stability.35In this regard, one of the strategies in tailless aircraft is the utilization of a negatively cambered wing section or a reflex-cambered section.11,36Such sections are rather weak in some specifications like lift and drag and could lead to a decrease in aerodynamic efficiency.11According to Fig. 17,at θ=0°the Cm0has negative value;but by growing the twist angle, its value increases and will become positive. Because increasing the absolute magnitude of the angle of attack in the WOS causes that the wingtip to have similar performance to the horizontal tail. Therefore, at α=0° by generating negative moment force and in a location behind the MRP, the pitch moment will be positive. As a result, the stability condition (Cm0>0) would be established.
At α=5°, 0° and -5° growing the twist angle does not change Cmα,but only causes the curves to move parallel to each other; the reason for this could be observed in Eq. (1). In the mentioned range angles of attack, by increasing the twist angle, XACwill not change significantly, and the CLαhas remained constant Fig. 10. Therefore, Cmαwill not change.The non-displacement of the aerodynamic center due to twist also proved in Ref. 37.
With the increasing angle of attack up to 10°, the pitch moment changes increment. According to the Cmgraph, it is clear that at this angle of attack, the curve slope will decrease as the twist angle increases. Fig. 19 shows the distribution of pressure coefficient Cpon the wing for angles of 10 to 20 degrees. It can be seen that at α=10° by growing the twist angle, the pressure coefficient will increase in the WOS. This weakens the pressure force in these areas. Therefore, the contribution of end areas of the model from producing the lift force will decrease, and the location of Xcpwill move towards the nose Table 2. So the simultaneous decrease in arm length and moment force due to the increase in twist angle are the causes of massive changes in pitch moment at α=10°. At α=12.5°, the behavior of the graph is slightly different.According to Fig. 17,by increasing the angle of attack from 10 to 12.5 degrees at θ=0°,the effect of reducing arm length(moving the center of pressure forward) offsets the effect of moment force growth, thereby moment coefficient will not change. At θ=3°, the trend of increasing the absolute value of moment coefficient with constant slope continued; but at θ=6° the slope of the curve is slightly increased; the reason is the simultaneous increase in arm length and moment force.As shown in Table 2, at θ=6°, unlike other twist angles, the pressure center moved backward by increasing the angle of attack up to 12.5°. Because the drop in the vortices size and their sweep length on the wing due to the growth of the twist angle are less than α=10°;this can be understood by surveying the low-pressure areas in Fig. 19. Therefore, the pressure drop at the rear of the model at α=12.5° will be higher than α=10°,which will cause the center of pressure to move backward and increase the moment arm length. At α=15° and 20°, the sensitivity of pressure center location relative to the twist angle variation decreases Table 2. According to Fig. 19,by increasing the angles of attack up to 15° and 20°, the pressure coefficient distribution on the wing will not have significant changes. This, alongside with negligible effect on Xcp,will result in the decrease of moment force variations. Thus,the twist will have little effect on pitch moment. For the angle of attack 20°and at the θ=3°and 6°,the moment coefficient will become positive. The reason for that is the precedence of Xcpfrom the moment center Fig. 18. However, at the θ=0°,the moment coefficient will not have any values due to Xcppositioning on the MRP.
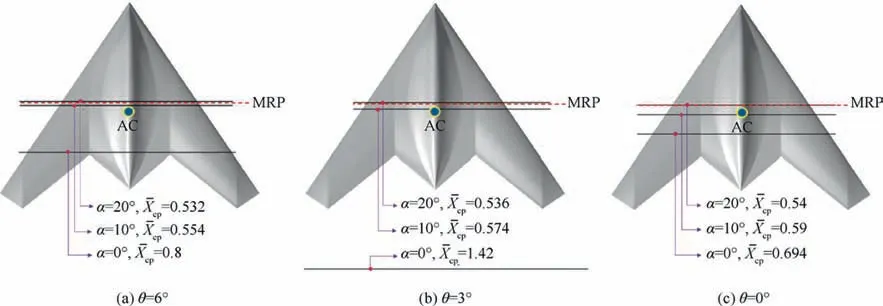
Fig. 18 Location of AC, MRP and center of pressure for different AoA and TA (X-cp =Xcp/Lc).

Table 2 Center of pressure location and longitudinal moment arm length.
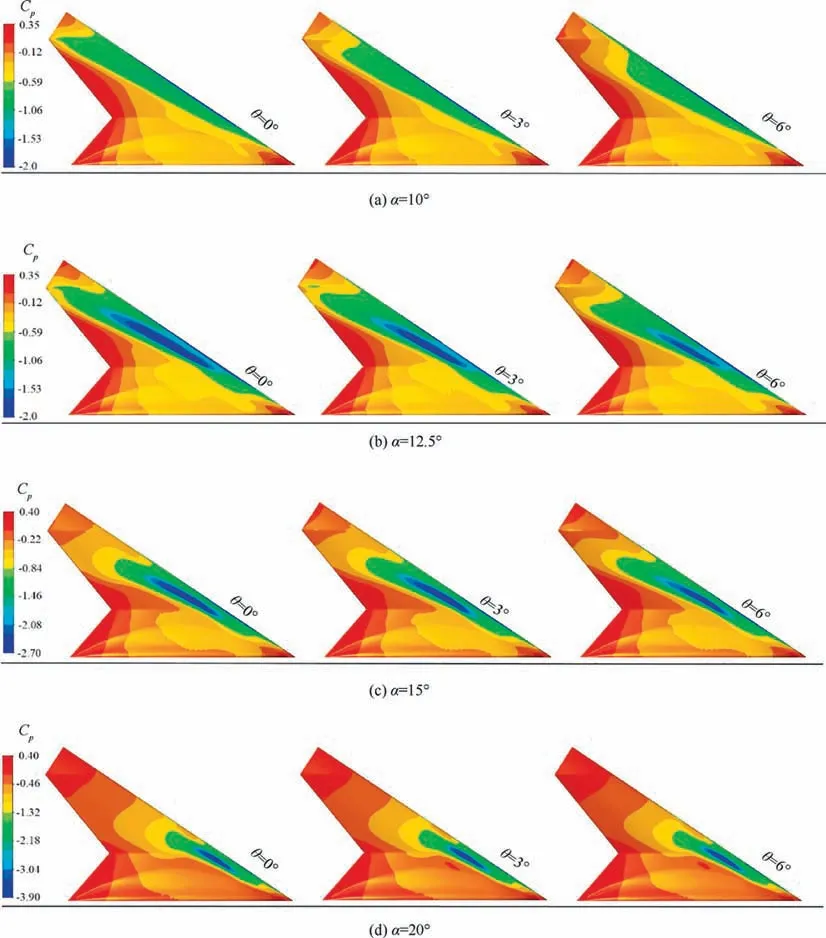
Fig. 19 Distribution of pressure coefficient at wing upper surface for different AOA and TA.
The 12.5° angle of attack will be a critical position in the longitudinal stability of this flying wing. Because the slope of the graph Cmchanges for all three twist angles at this angle of attack. According to Fig. 17, for angles of attack higher than 12.5°, as the twist angle increases, the sudden increase of the moment coefficient is prevented, and the graph slope decreased. Therefore, it could be concluded that by growing the twist angle, the‘‘Pitch Up” phenomena would be delayed.This will be a significant aerodynamic achievement in flying wing aircrafts.
Generally, the more negative slope of the pitch moment curve means more longitudinal stability. At α=10° an increase in twist angle will reduce the Cmα, and the degree of stability will decrease. Since that was decreasing the degree of stability results in increased maneuverability of the aircraft,it can be concluded that applying the twist angle not only satisfies all stability conditions but also improves maneuverability within the range of this angle of attack.Also,before α=12.5°,growing the twist angle increases the slope of the graph.Hence the degree of stability near this critical angle of attack will increase.
It was noted in Section 5.2.3 that increasing the twist angle up to 6° decreases L/D at α=5° (cruise phase). However, in order to accurately evaluate the effects of a twist on the aerodynamic efficiency, it is necessary to study the pitching moment. Fig. 17 shows that at θ=6°, the trim point(Cm=0) is located at 5° angle of attack. To put it another way, the stabilizer moment will automatically put the aircraft in the cruise phase,and there is no need to use control surfaces,so the trim drag will be significantly reduced. But with the decreasing twist angle,the trimming angle of attack goes away from α=5°; there by the trim drag increases to keep the aircraft in cruise mode; this results in reduced aerodynamic efficiency. Therefore, it can be concluded that applying the twist angle will increase the aerodynamic efficiency in the cruise phase.With this in mind, it is clear that twist will increase aerodynamic efficiency at all angles of attack, except for α=0°.Hence the twist will be useful for a wide range of flight conditions. Furthermore, given that after the landing, the angle of attack will be zero degrees. As a result, the twist will reduce the required runway length.
6.2. Flow field
6.2.1. Vortices on wing
A general view of the flow pattern is shown in Fig.12,to investigate the effect of twisting on the aerodynamic forces.Fig.20 presents the flow field on the wing in more detail.In this figure,the vorticity magnitude is illustrated for several longitudinal positions. Also, for a better description of the vortex core,ISO surfaces are used based on the least amount of pressure coefficient on the upper regions of the wing.
At angles of attack less than 10°,no clear image of the vorticity magnitude on the wing has appeared. Researches show that the center of the vortices at low angles of attack is very close to the surface and has interaction with the boundary layer.38,39As already pointed out, the twist performance at α=20° is significantly reduced due to the development of wing surface vortices and significant separation in the WOS.Therefore, the twist could not cause significant changes in the flow field on the wing; but these changes are visible at α=10° and 15°. Generally, without considering the twist effects, increasing the angle of attack from 10 to 15 degrees amplifies the shear layer vortices and pressure gradients at the leading edge, which results in the vortices development and increasing the dimension of the formed core in front of the model (ISO surfaces with least amount of Cp). Also, vortices have more vertical growth than lateral displacement on the wing surface.Another consequence of increasing the angle of attack is the movement of the vortices toward the inner sections and root wing.It is clear that at α=10°the vortices trajectory forms around the leading edge,but increasing the angle of attack up to 15°, causes the vortices to be pulled inward.
At α=10°, the WOS play a decisive role in formation of the flow structure.Increasing the twist angle and consequently reducing the pressure gradient and flow separation at the leading edge, weakens the shear layer vorticity. Accordingly, vortices feeding decreases along the flow and the vortices formed at the wing surface weakened, and the dimensions of the vortex core decreased sharply. It can be seen that there is no coherent vortex core at θ=6°,and the vortex tip is smaller(Fig. 20(b)). However, this delays the separation of the WOS.According to Figs.19 and 20 extending coherent vortex flow to the wingtips at θ=0°, results in a considerable pressure drop in this region. Hence the local lift coefficient will increase in this region, which accelerates the flow separation in the WOS. But by growing the twist angle, which results in the weakening of the vortices, the local coefficient of the Wing tip decreases, and the flow separation will be delayed.
The effect of the twist angle on the flow field at α=15°lower than the α=10°. Fig. 20 demonstrates that applying the twist reduces the length and diameter of the vortex core.For instance, at θ=6°, dimensions of the ISO surface are about 30% declined Fig. 20(a). By contrast, growing the twist angle improves performance of the WOS and the density of the vortices produced in these are as increased somewhat.Thus the twist increases the effective length of the wingspan at 15°angle of attack.
6.3. Shear flow distribution
Applying the twist changes the shear flow structure at all angles of the attack. At high angles of attack (10°,12.5°,15°,and 20°), there will be two forms of shear stress. The first is the conventional shear stress due to the longitudinal flow at the lower surface and the middle regions on the model. However, the second type of shear stress is due to the lateralflow formed at the upper surface of the wing. Following the development leading edge vortices at high angles of attack, a lowpressure area will be produced in the WOS, resulting in the generation a transverse flow on the wing surface. Synergistic of this flow with the vortex flow adjacent to the wall increases the shear stress on the wing surface and especially along path the vortex formation. This is the same lateral flow effect. It is evident that by strengthening vortices,shear stress increases in the upper surface of the wing.
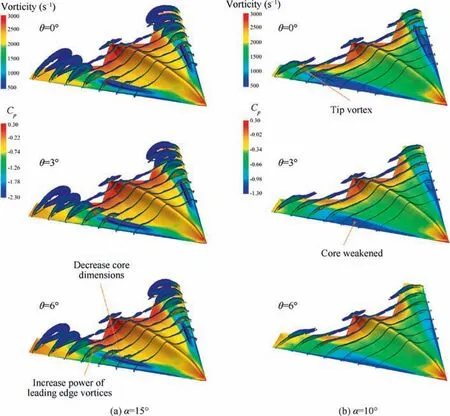
Fig. 20 Vortices on wing at α=10° and 15°.
Fig.21(a)shows the distribution of shear stress at α=10°.At this angle of attack,the twist angle growth causes the wing surface vortices to weaken (see Fig. 20), and hence the shear stress at the wing surface is reduced. However, the condition will be different on the lower surface of the wing. In this region,the shear stress is strengthened in the WOS by growing the twist angle.Because,due to the reduction of the local angle of attack in the WOS, the flow will be more aligned with the surface. As a result, the tangential flow to the surface in these areas to reinforcement and shear stress increases.
Remarkably, how the viscous drag changes due to shear stress variation at the lower and upper surface of the wing.Since shear stress at the below surface of the model arising from longitudinal flow, then shear stress change in this area will be more effective in the skin frictional drag variation.According to Fig. 15, at α=10° and 15°, with the increasing twist angle up to 3°, no significant change in frictional drag is observed. Because, the increase in shear stress under the wing will be equal to the decrease in the longitudinal component of the stress at the top surface of the wing, so they neutralize each other’s effect. However, at θ=6° the decrement of the shear stress effects on the upper surface of the wing is more than the increment of that on the lower surface of the WOS which results in decreasing the skin friction drag. At 12.5° angle of attack, the changes are relatively small, but at α=20°, due to the complete development of the leading edge vortices at all twist angles, constant shear stress dominates on the wing. Nevertheless, as the twist angle grows, the shear stress on the lower surface of the wing will be enhanced,which leads to an increase in the skin friction drag.
At low angles of attack (-5°, 0°, and 5°) due to under development of the cone vortices on the wing, the lateral flow of the wing will be very weak.Therefore,the longitudinal flow has the highest effect on the production of shear stress and skin friction drag. As noted in Section 5.2.2, by growing the twist angle at α=0°, the angle of attack of the WOS increases,which this leads to a reduction of shear stress and frictional drag. This effect will be enhanced at α=-5°, because of the twist angle grows in the opposite direction of the angle of attack. Therefore, the superposition of these two will further increase the angle of attack of the WOS. According to Fig. 21(c), as the twist angle increases, shear stress decreases at the all upper surface as well as areas of the lower surface.However,high local angle of attack in the WOS led to the formation of leading edge vortices on the lower surface of wingtip, which subsequently will increase the lateral flow and shear stress. The area of the maximum value for shear stress at θ=3° and 6°, shows the trajectory of the formed vortices under the wing. At α=5°, the angle of attack of the WOS decreases, with growing the twist angle, which causes the amount of skin friction drag to an enhancement.As illustrated in Fig. 15, for both θ=3°and θ=6°,the maximum amount of the graph is at this angle of attack, because the twist angle applied leads to the shear stress to increase simultaneously in both surfaces (Fig. 21(b)). This indicates that the highest impact of the twist angle on the shear stress happens at this angle of attack.
6.4. Velocity distribution in WOS
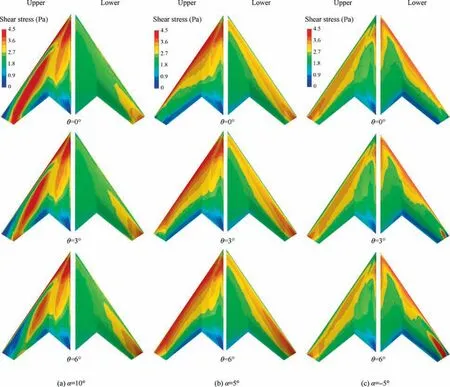
Fig. 21 Distribution of shear stress at the lower and upper surface of wing for different AoA and TA.
In this section,the effect of twist angle on velocity distribution has been investigated in the wing tip cross-section. Fig. 22 illustrates the flow velocity distribution in the cross-section A(see Fig. 23) and for α=10° to 20°. At α=10° the flow in the trailing edge is attached to the surface for all the twist angles; nonetheless due to the three-dimensional effect of the flow,by increasing the twist angle and subsequently decreasing the transverse flow, the velocity decreased in this region. By contrast, at the leading edge, the boundary layer will be detached from the wall and is attached again. This means the formation of the separation bubble in this area. Considering the figure, the twist leads to a decrease of accelerated flow trajectory angle on the wing;but despite this because of improper pressure distribution in this area of the surface, not only has the separation not been prevented in the leading edge,but also the separation region has been extended, especially at θ=6°. Fig. 19 shows that by applying the twist at the α=10°, the pressure coefficient along the flow has increased in around the cross-section A. In this regard, Fig. 23 shows the trend of variation of pressure coefficient variation on this cross-section. At all twist angles, by moving towards the trailing edge, the pressure coefficient on the upper surface increases. Nevertheless, due to increasing the twist angle, the pressure coefficient variations on the wing surface increase,and in the areas near to the leading edge, a sudden growth of pressure has happened. This has caused the formation of a robust reverse pressure gradient at the WOS, which is the reason for the flow separation at the leading edge.
At 12.5° angle of attack, the increase of the twist angle reduces the dimensions of the vortex domain and the lowvelocity region.Furthermore,similar to the reasons mentioned at α=10°, the separation bobble size near the leading edge increased, and the velocity at the trailing edge decreased. At α=15° the flow separation starts from the initial 10% of the chord, but increasing the twist angle causes the area of the low velocity to be detached from the surface and shrink.Therefore, the dynamic pressure on the surface increases.According to Fig.19,in the WOS,the twist leads to the change of pressure coefficient along the chord; but because of the almost identical behavior of three-dimensional flow,these variations will be fewer compared with α=10° and 12.5°. So the separation bubble will grow less at the leading edge. At α=20°and for all twist angles,the flow separation has started from the leading edge and has resulted in the complete stall of the wingtips. This subject confirms the negligible performance of the twist at high angles of attack. Nevertheless, it could be observed that by growing the twist angle, the velocity slightly increases at the trailing edge, and the dimensions of the separation region decrease.
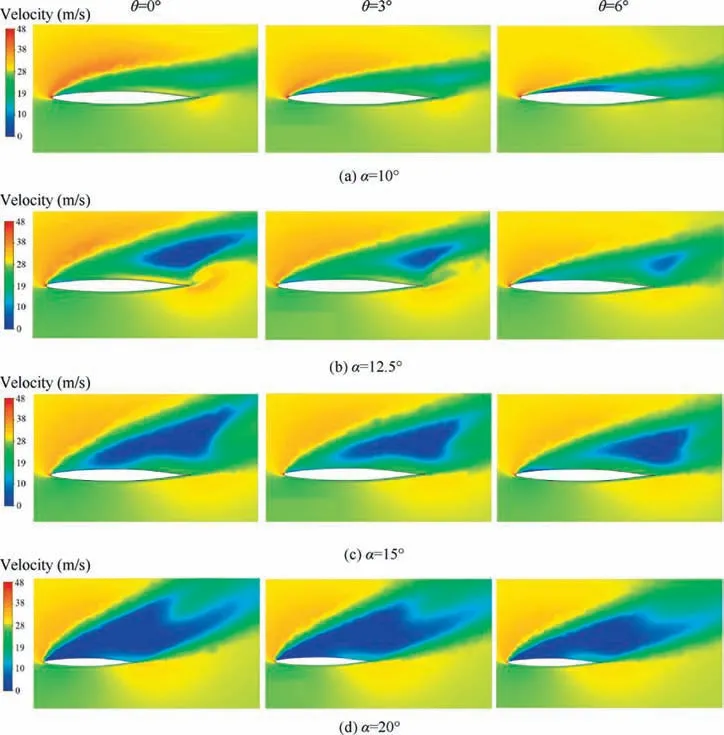
Fig. 22 Velocity distribution in cross-section A.
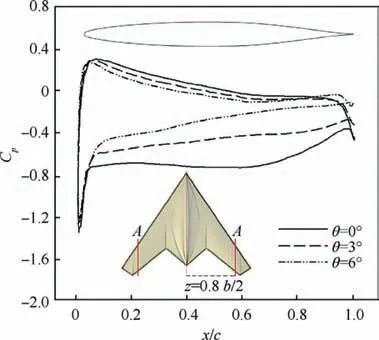
Fig. 23 Pressure coefficient in cross-section A and at α=10°(c is chord length at cross-section A).
Using the results, the effect of twist on the performance of conventional control surfaces at the wing surface can be estimated.The velocity distribution at α=10° shows that in case of the positioning of the control surfaces like a spoiler in the wing surface and the ‘‘elovns” in the trailing edge, applying the twist could lead to the weakening of their performance.However,at α=12.5°and 15°regardless of the slight separation of flow at the leading edge, the increase of the twist angle improves the performance of the control surfaces.Because the dimensions of the low-velocity zone are reduced on the wing.Consequently, the control surfaces experience more dynamic pressure. At α=20°, there is little change in the velocity distribution,but a negligible increase of velocity value at the trailing edge increases the sensitivity of the existing control surfaces in these areas.
7. Conclusions
In this paper,the effects of twist angle changes with the aim to enhance the aerodynamic performance of a fly-wing and in order to smart the wing were studied using Computational Fluid Dynamics (CFD). The following is a summary of the most important results:
(1) Growing the twist angle reduces the lift coefficient at all angles of attack; But due to the decline in twist performance at α=15° and 20°, the mentioned lift reduction is negligible.Also,at the high angle of attacks(α=10°,12.5°,15°,and 20°)with increasing twist angle,the drag coefficient will decrease significantly. However, at low angles of attack and especially at α=0°, the drag coefficient changes are inconsiderable.
(2) Growing the twist angle at high angles of attack could lead to an increase of the lift to drag ratio (L/D). However, by increasing the angle of attack up to a special value,the twist effectiveness on the L/D will significantly decrease. This angle of attack has been called the Neutral Brink Angle (NBA). The lift to drag ratio has been decreased for low angles of attack and especially at α=0°.
(3) Investigating the longitudinal stability shows that applying the twist is a necessity to meet the stability conditions and the ‘‘Pitch up” phenomena will be delayed.By increasing the twist angle,the Cm0would have a positive value. This results in the stability at positive attack angles. Also, at θ=6°, the trim point (Cm=0) is located at α=5°, where the L/D ratio is maximum.So the trim drag will be drastically reduced. This will have a significant increase in aerodynamic performance.
(4) Investigation of the flow field at α=10° shows that growing the twist angle reduces the strength and dimension of the wing surface vortices.At α=15°,the vortex core shrinks, but the vortex strength in the WOS has increased slightly.
(5) At high angles of attack,growing the twist angle reduces the shear stress at the upper surface of the wing,but vice versa, the shear stress at the lower surface will increase.At α=5°, twist increases shear stress at both wing surfaces.Therefore,there will be the highest amount of skin fraction drag at this angle of attack.
(6) According to the velocity distribution in the WOS,it can be predicted that at α=10° with the increasing twist angle the efficiency of control surfaces will decrease;however, at α=12.5° to 15° it improves the performance of control surfaces.
Declaration of Competing Interest
The authors declare that they have no known competing financial interests or personal relationships that could have appeared to influence the work reported in this paper.
 CHINESE JOURNAL OF AERONAUTICS2021年2期
- CHINESE JOURNAL OF AERONAUTICS的其它文章
- Recent active thermal management technologies for the development of energy-optimized aerospace vehicles in China
- Electrochemical machining of complex components of aero-engines: Developments, trends, and technological advances
- Recent progress of residual stress measurement methods: A review
- Micromanufacturing technologies of compact heat exchangers for hypersonic precooled airbreathing propulsion: A review
- Towards intelligent design optimization: Progress and challenge of design optimization theories and technologies for plastic forming
- A combined technique of Kalman filter, artificial neural network and fuzzy logic for gas turbines and signal fault isolation
