Improved model of ionosphere variability and study for long-term statistical characteristics
Xueheng BIN, Yang LIU
School of Instrumentation and Opto-Electric Engineering, Beihang University, Beijing 100083, China
KEYWORDS Analysis of anomalies;Long-term statistics;Regression model;Total electron content
Abstract Ionospheric variability is influenced by many factors, such as solar radiation, neutral atmosphere composition,and geomagnetic disturbances.Mainly characterized by the total electron content(TEC)and electron density,the climatology of the ionosphere features temporal and spatial changes. Establishing a multivariant regression model helps substantially in better understanding the ionosphere characteristics and their long-term variability. In this paper, an improvement of the existing ionosphere multivariate linear fitting regression model is proposed and investigated using data from both the ionosonde and the global ionosphere map (GIM) derived from groundbased Global Navigation Satellite System (GNSS) observations. The proposed method gives more consideration to the impact of the solar activity and adds modeling of the annual periodic fluctuations and half-year periodic fluctuations for the F10.7 index. The improved model is verified to have a better correlation with the real observations and can help reduce the calculation uncertainty.Moreover,the proposed model is used to evaluate the fitting accuracy of the GIMs produced by five authorized data analysis centers from the International GNSS Service(IGS).The results show that there is a fixing hole in the North America region for the GIM model where the correlation between the GIM and the proposed model always returns lower values compared to other places.
1. Introduction
The ionosphere is an area of the Earth’s atmosphere between approximately 60 km and 1000 km above the Earth’s surface.In this region, the constant radiation from the sun and Xrays from the universe causes the neutral atmosphere molecules and atoms to partially ionize. Many factors can change the ionosphere, resulting in ionospheric variability; some variabilities about the physical mechanisms are easy to understand, while others remain unknown. There are multiple factors of changes in the ionosphere, resulting in regular and irregular variabilities. Usually, the regular variability includes the solar cycle, seasonal changes and diurnal variations, while other irregular variabilities are disturbances caused by solar flares, geomagnetic disturbances, changes in the neutral components and changes in aurora particles of different scales.
A series of studies have focused on ionospheric variability.Quantified by the root means square error, it has been determined that low latitudes have greater variabilities under both geomagnetic quiet and disturbed conditions.1Many studies have focused on the F layer variability in different geophysical locations and compared this with the existing International Reference Ionosphere(IRI)models,2,3among which the equatorial ionospheric variability is prominently discussed, since it is most representative.4,5Those studies used similar methodologies to investigate the changes in foF2 or the Total Electron Content (TEC) and were then compared with the background ionosphere models,such as IRI and NeQuick.The ionosphere features under geomagnetic storms have been considered. A more favorable way to study the variability was proposed and involves classifying the ionosphere characteristics under different geomagnetic conditions or different phases. Since one solar cycle covers 11 years, observing the ionosphere variations in such a period provides opportunities and sources to learn long-term ionosphere climatology.6Through this study,how important solar activity is for ionosphere changes can be understood. Further investigations have been conducted on the correlation between the ionosphere and solar indices,such as the F10.7 and others.7Moreover, some scholars have asserted that the variability of the ionosphere is also influenced by meteorology, and it is necessary to separate the meteorological impact on the ionosphere from the solar impact. A linear regression model has been proposed considering the annual and semiannual variation of the solar flux,where the meteorological influence was less than 20% in low frequency variability case for the F-region peak plasma density under such an estimation.8Furthermore, it has been concluded that the total variability error can be attributed to three major sources: the solar flux, the geomagnetic disturbance and the meteorological change.9These proposed models are helpful for understanding the characteristics of ionospheric variability, for determining which factor plays a more critical role, and for determining which factor is weak enough to be neglected.
The global ionosphere map divides the global ionosphere into 2.5° plus 5° grids points, with latitudinal intervals of 2.5° and longitudinal intervals of 5°, covering 87.5° N to 87.5° S and 180° W to 180° E. Over 400 International GNSS Service(IGS)ground observatories are used to derive the Global Ionosphere Map (GIM) product by modeling the global ionosphere as a spherical function or a higher order polynomial function of geophysical parameters.Rapid GIM products can be achieved in one day, and the final product is usually updated three or four days later.To date,there are seven data analysis centers authorized by the IGS to provide GIM products.The GIM is useful for learning about the global morphology of the ionosphere, for broadcasting ionosphere delay for precision navigation and for studying ionosphere anomalies caused by space weather, such as the ionosphere disturbance during a geomagnetic storm.
To address the problem, this paper proposes an improved multivariate linear regression model based on previous studies.8,9The fitting correlation coefficient between the model output and observables are better adjusted with the proposed model. Moreover, a daily variated TEC modeling is extended using the proposed work, obtaining a better accuracy. Different sources of GIM data provided by the IGS are validated,considering a variability error and a fitting coefficient.
2. Data and methods
2.1. Data
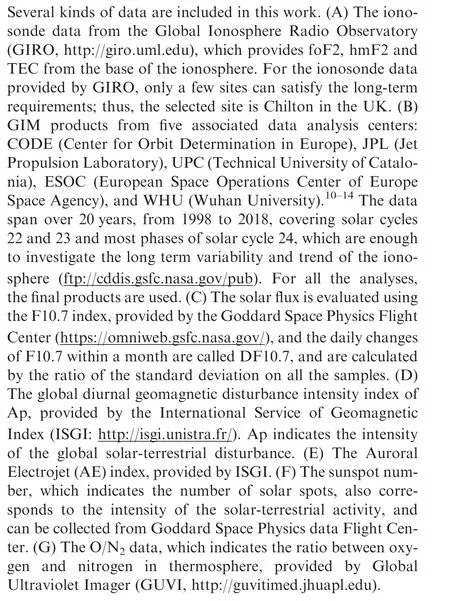
2.2. Proposed TEC model
According to Refs. 8,9, the long-term TEC variability can be modeled by a multiple linear regression function, with a part of the background TEC,and the variable terms corresponding to both solar activity and geomagnetic perturbations. A general formula is given

where TEC0denotes the invariable background TEC, Ap and F10.7 are estimated by the monthly average values, and Izdenotes the geophysical global zonal circulation index, which is considered as attribution from meteorology. DF10.7 indicates the variation of F10.7. Those coefficients are estimated by multiple regression procedures.t denotes the sampling time interval, here is months considered for analysis in the year.From the formula, the monthly variation is mainly characterized by trigonometric functions. As proven by a previous study, the zonal circulation index plays a small role in the whole variability,and thus can be overlooked from the modeling. The simplified formula is given
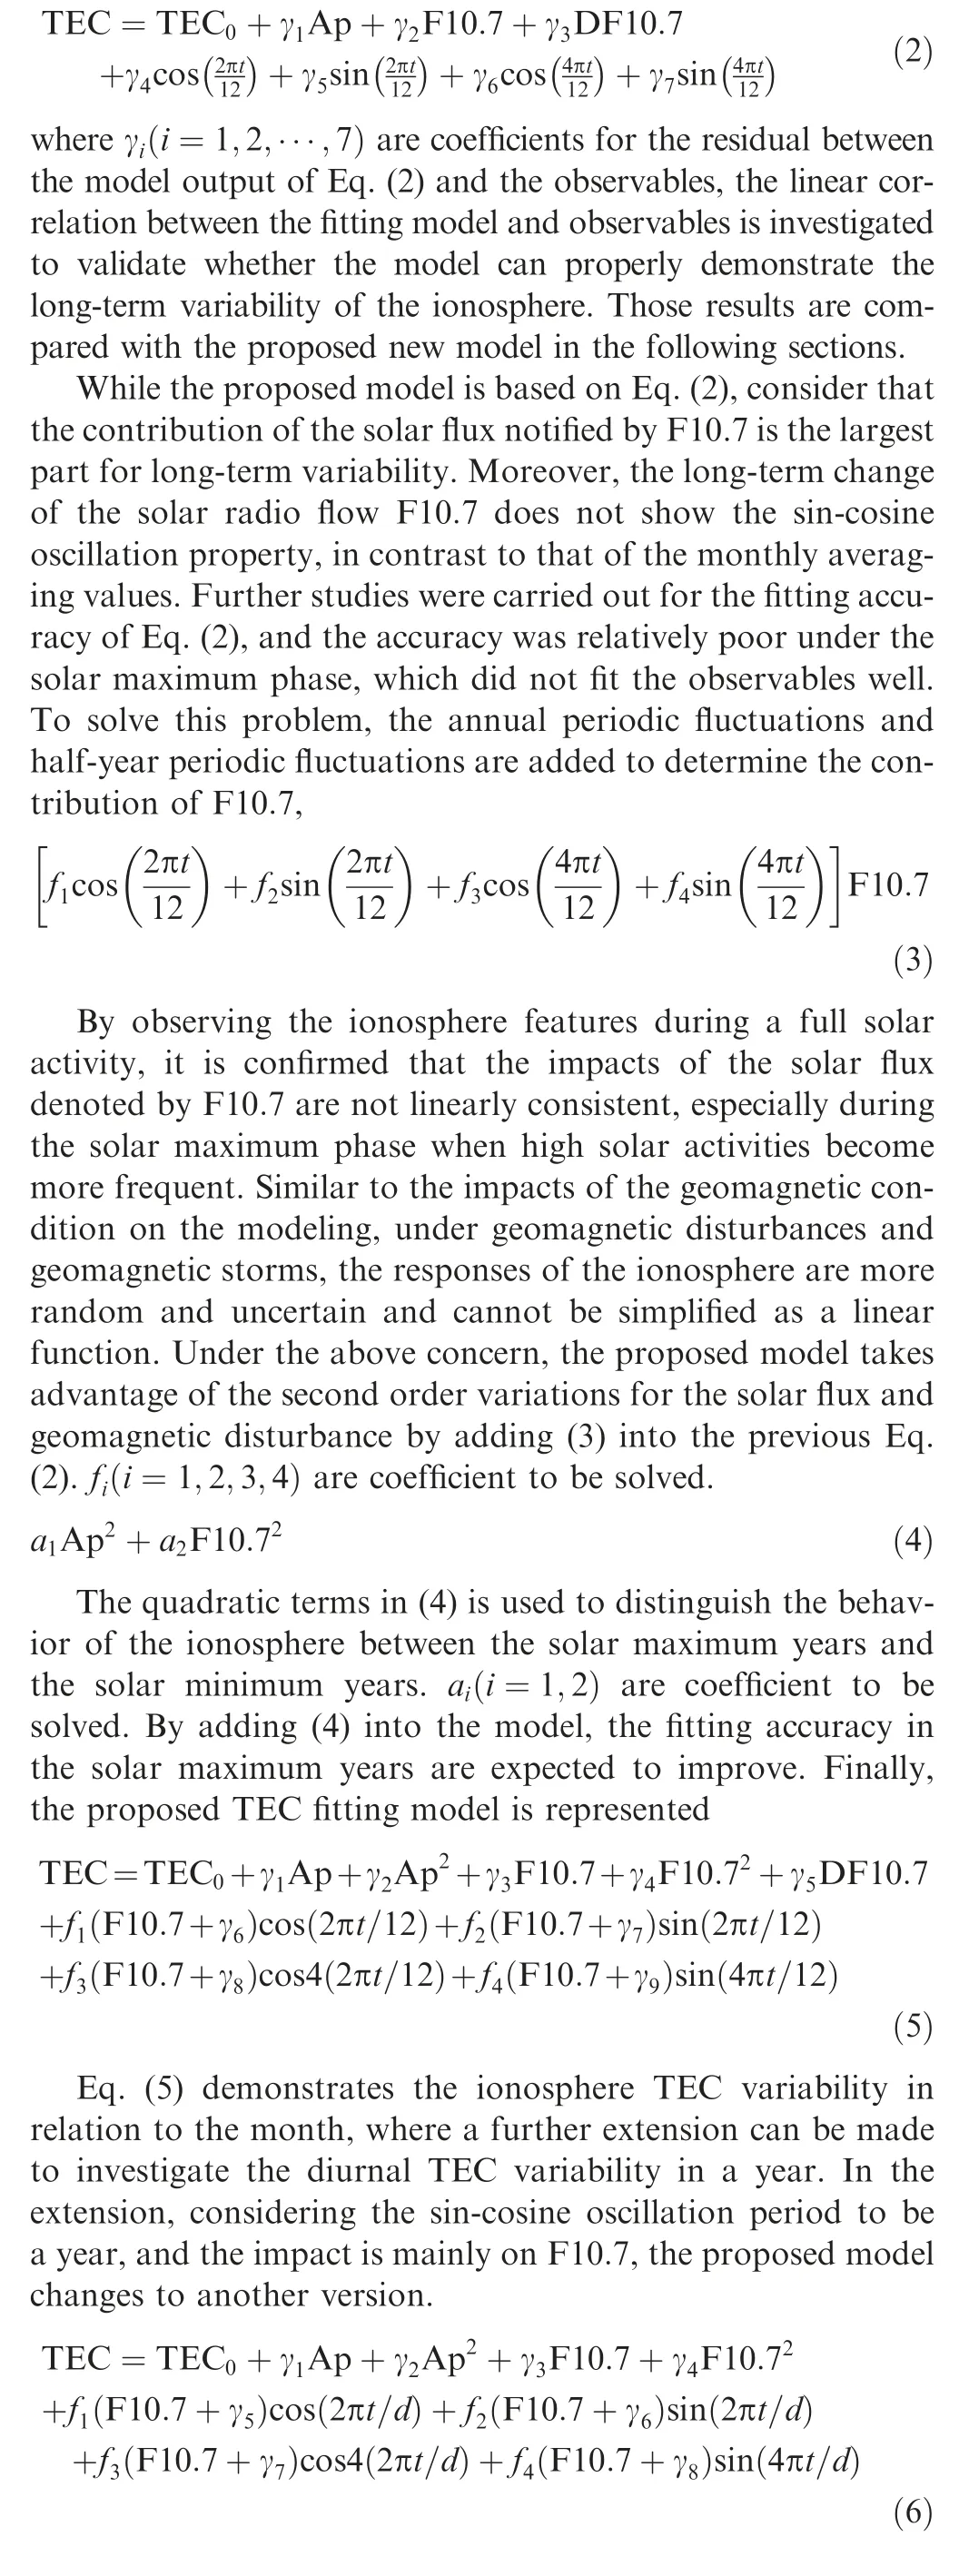
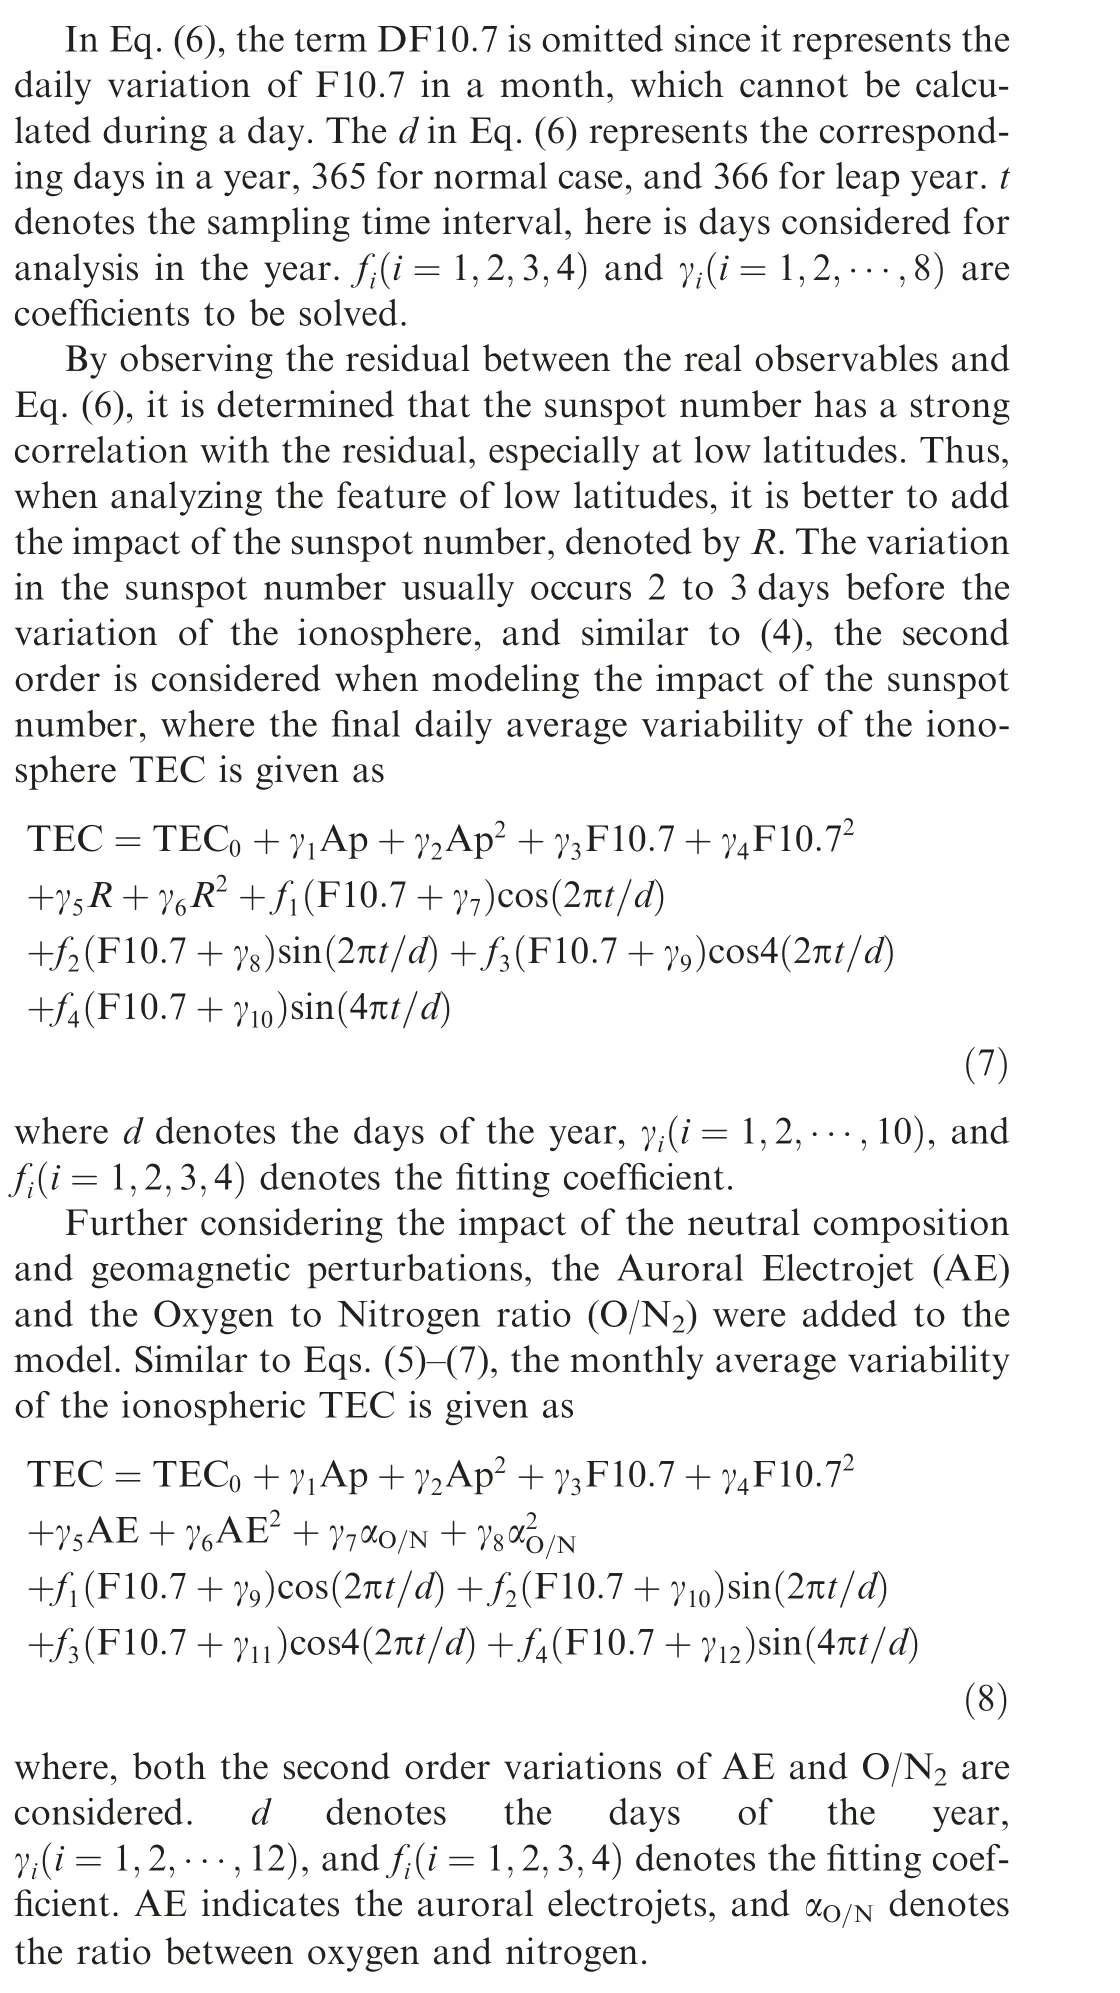
3. Experiments
The proposed model is validated using both GIRO and GIM data. The GIRO observatory with the longest measurement span, located in Chilton, UK, is selected, and the time span is from 1998 to the present. The GIM results are compared by polynomial fitting of the GIRO station’s location. Moreover, the long-term variability of the TEC is investigated with an improved model denoted by both Eqs. (5), (7) and (8). By calculating the residuals between the GIM gridded values from the IONEX file and the values derived from Eq.(5),the Residual Square Sum(RSS)is compared between the GIM products provided by the CODE,UPC and WHU data analysis centers.The fitting correlation between the model and GIM values is further studied by Eq.(7)with GIM products provided by different data analysis centers.The fitting correlation between the model and real TEC derived from IGS observatories are studied by Eq. (8). The global asymmetry of TEC distribution is also evaluated by Eq. (8), the fitting correlation is compared between original model and Eq. (8) with AE considered. In general, Eq. (5) is used for a coarse evaluation with monthly averaged TEC,and Eqs.(7)and(8)take AE and the O/N2into account, and are adjusted to more accurate evaluations with daily TEC.
3.1. TEC model based on original and improved models
Observations from GIRO station RL052 (51.5° N, 359.4° E)are used to derive base of the TEC. The data in RL052 is the most complete, starting from 1998 to the present. A comparison between the TEC interpolated values by the GIM in the corresponding latitude and longitude and the TEC derived from the GIRO is conducted,and here,the GIM data are provided by the WHU data analysis center. For both types of data, the mean TEC in a month is selected as an input for the original TEC model,denoted by Eq.(2),and the improved model denoted by Eq. (5). The fitting coefficient is then analyzed, as Fig. 1(a) and (b) demonstrate. In Fig. 1(a), for Fig. 1(a1) and (a3) the left panels, the blue and red lines indicate the observed TEC (GIRO and GIM data) and the calculated TEC from the original model given by Eq. (2). In Fig. 1(a2) and (a4), the fitting correlation coefficients are calculated for both the GIRO and GIM data. The blue dots indicate observables, and the red line indicates a linear regression.Fig. 1(a1) and (a3) show the temporal variation of the TEC,and a clear pattern is observed that for both the GIRO and GIM data, the temporal feature of the TEC is closely associated with solar activities, and the TEC values increase during high solar activity years, such as 2002, 2003 and 2013, 2014;the maximum TEC observed by the GIM is larger than that observed by GIRO at the same location, which is reasonable,since the GIM takes advantage of ionosphere-transit measurements. But the GIRO TEC is just measured from the bottom side of the ionosphere. The TEC values decrease during low solar activity years, such as from 2006 to 2010. The Fig. 1(a2) and (a4) indicate fitting coefficient correlations between the observed TEC and the modeled TEC. In Fig. 1(b), for the Fig. 1(b1) and (b3), the blue and red lines indicate the observed TEC from the GIM and the calculated TEC from the original model given by Eq. (5). By comparing Fig. 1(a)and (b), it is shown that the improved model denoted by Eq.(5) helps increase the fitting correlation coefficient, especially for the GIRO case, as an improvement of 0.06 is achieved.Although this improvement is not that prominent, from Fig. 1(b), the large TEC values become more concentrated than the result in Fig.1(a),indicating the improved model has benefits for a large part of the TEC,which mainly occurs during high solar activity years.
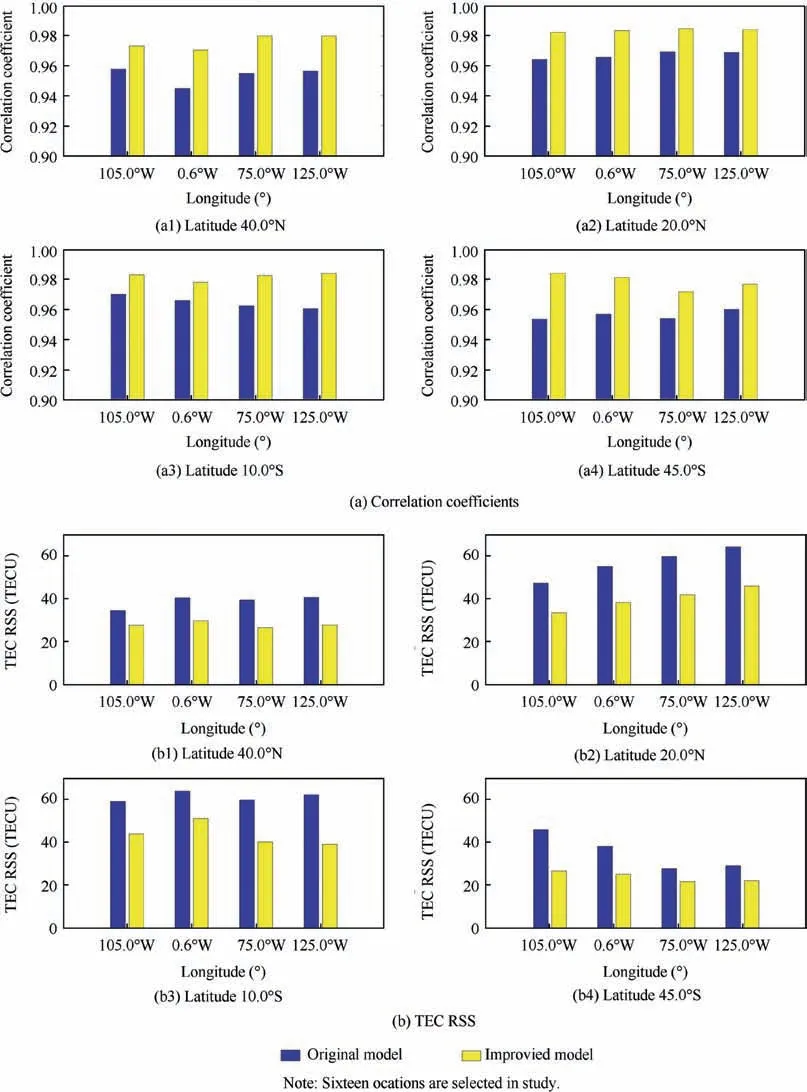
Fig. 2 Comparison of correlation coefficients and TEC RSS between original and improved model for different locations.
Moreover, without losing generality, 16 locations in the global region are selected to compare the accuracy between the original model denoted by Eq.(2)and the improved model denoted by Eq.(7).Both the fitting correlation coefficients and the squared sum of residuals are evaluated in the study. The selected 16 locations cover high and middle latitudes and low latitudes in the north and south hemispheres, as represented by Fig. 2. In Fig. 2(a), four latitudes are considered in both hemispheres. For each considered location, the correlation coefficients vary according to the different longitudes. For all locations,the improved model denoted by Eq.(7)works better than the original model and shows less of a discrepancy between the different longitudes.For the northern hemisphere,the lowest correlation coefficient occurs at 0.6°W for the original model but has been supplemented in the proposed model denoted by Eq. (7). The highest correlation coefficient derived from the proposed model is over 0.98, exceeding all the correlation coefficients achieved by the original model. A more prominent improvement can be found for the TEC RSS between the observations and modeled values. In Fig. 2(b), it is found that the TEC RSS is larger at low latitudes than at middle latitudes for both hemispheres. However, by comparing the RSS derived by the original model and those derived by the proposed model denoted by Eq. (7), a decrement of almost 20 TECU (1TECU=1016electron/m2) can be achieved when applying the improved model.A prominent discrepancy is discovered at 45°S for different longitudes,while at 40°N and 10°S, the discrepancies are small for different longitudes.
3.2. Comparison of global residuals between original model and improved model
To better understand the TEC residuals between the observations and model values, the global distribution of the TEC residuals is further discussed, and the GIM data are selected from 1998 to 2017 and provided by the WHU, UPC and CODE data analysis centers, spatially covering 180° W to 180° E and 87.5° N to 87.5° S. The amounts of the data provided by those three analysis centers have slight difference;for instance, both the WHU and CODE data cover 1999 to 2018, and the UPC data covers 2002 to 2017. However, this slight difference does not impact the experiment.The monthly TEC RSS is studied for the GIMs of the three analysis centers,and the results of the original model denoted by Eq. (2) and the proposed model denoted by Eq. (5) are compared, as shown in Fig.3.In the results,the prominent TEC RSS decrements are discovered by the improved model, especially from April to August, with June having a minimum TEC RSS for all the results provided by the WHU, CODE and UPC. In the original model, the data from CODE have the largest TEC RSS for most months, with the exception of December and January. In those two months, the TEC RSS of the WHU data slightly exceed the results of the CODE data.The results of the UPC data become dominant only in January, while for the remaining months, the results of the UPC data always have the least TEC RSS compared to the results from the other two data analysis centers. Similar patterns are observed in the improved model,with July as exception,when the largest TEC RSS is from WHU GIMs. It has been estimated that on average, the improved model helps to reduce the TEC RSS by over 500 TECU per month; the maximum decrement is 3054 TECU on July for CODE GIM, and the minimum decrement occurs in January for CODE GIM, with only 310 TECU achieved.
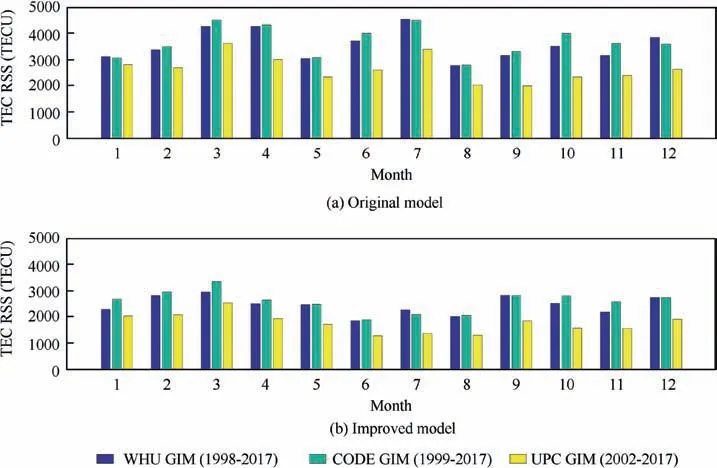
Fig. 3 Monthly TEC RSS variations for the WHU, CODE and UPC GIM data throughout entire time span.
The results of two years are selected to compare the TEC residual in the global region: the solar minimum year 2009 and the solar maximum year 2014. The global TEC residual corresponding to the GIM grids are analyzed for these two years, with three data analysis centers considered: WHU,CODE and UPC. Fig. 4(a) shows the results of the June Solstice. Remarkable TEC residual decrements can be seen for the solar maximum year compared with the solar minimum year for the UPC GIM products. However, the maximum TEC residual for the two years occurs in WHU GIM products that are relatively large within the absolute values of 20 TECU.Prominent improvements are achieved by the proposed model denoted in Eq. (5) for WHU, CODE and UPC GIM in 2009.The TEC residual improvement for WHU GIM in 2014 is not so obvious; a probable reason is that different GIM modeling algorithms are applied for the three data analysis centers. In general, the proposed model takes advantage of the second order variations of the geomagnetic and solar activity and has less TEC estimation residuals under both high and low solar activity conditions. Fig. 4(b) shows the results of the December Solstice. Compared with Fig. 4(a), a prominent TEC residual depletion is observed in the south hemisphere for CODE GIM in 2009,which demonstrates the inconsistency of the CODE GIM model for different seasons. Opposite features of the TEC residual depletion are found for UPC GIM in 2014 when using the Eq. (2); however, the features are further recovered by the proposed model denoted by Eq. (5). Moreover,in the December Solstice, the proposed model has better performances during the solar maximum year for the GIMs provided by all the three data analysis centers considered in this work.
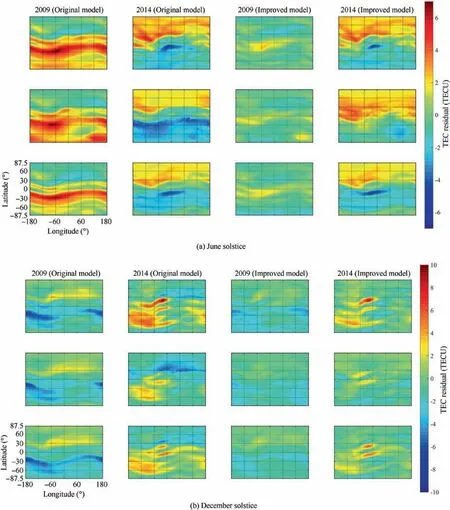
Fig.4 Global TEC RSS variations for the WHU,CODE and UPC GIM data in June and December Solstice in the solar minimum year(2009) and the solar maximum year (2014).
3.3. Global correlation coefficient between observations derived from GIM and values derived from improved model
To study the model accuracy, the correlation coefficient between the observations derived from the GIM and the modeled values is calculated at each grid point for the GIM products provided by the WHU, ESA, IGS and JPL. Specifically,the global correlation coefficients distributions of the recent three years are carefully analyzed, as demonstrated in Fig. 5.In Fig. 5,the global correlation coefficients distributions from 2015 to 2017 are plotted, and it is observed that the WHU GIM demonstrates a poor fitting accuracy in 2017, with the worst case approaching 0.3 in the North America region.The noticeable correlation coefficients decrement also occurs in the remaining three GIM products in 2017, but it is not as severe as the WHU GIM product.
To further validate the correlation coefficients depletion region,long-term data are used for the investigation,as shown in Fig. 6. For the WHU GIMs, the correlation coefficients depletions occur for most of the years, with the exceptions of 2002 and 2011. For the CODE GIMs, the most severe years are 2003, 2008 and 2017; for the UPC case, the correlation coefficient fits best among those data considered,and the most severe year is 2017. The discrepancy among the results of different analysis centers indicates the difference of the GIM model used and the data processing strategies.15Another assumption is that due to the geophysical differences, there are some special locations that do not follow the generality of the proposed model or of the GIM model. The feature is interesting and worth further investigation.
3.4. Dependences on AE and O/N2
The dependences on AE and O/N2are further investigated by the real TEC calculated from the dual frequency observables provided by the IGS observatories. In the study, the correlation coefficients between the proposed model denoted by Eq.(8) and the real TEC calculated from the IGS observatories were computed, with the data selected from 2008 to 2017.For each year, more than 180 observatories were considered to conduct the experiment. The results show that the correlation coefficient increased from 0.0175 to 0.0535 (equals from 1.07% to 6.24%) after the AE was modeled by Eq. (8); moreover, the correlation coefficient achieved further improvement when O/N2was considered. The correlation coefficient increased from 4.26% to 15.44% when both the AE and O/N2were considered in the model by Eq. (8). The most prominent increment of the correlation coefficient occurred in the solar maximum year, 2013 and 2014. It was also revealed that the O/N2has a greater impact on the correlation coefficient between the TEC derived by Eq. (8) and the real TEC calculated from the IGS observatories.The detailed results are listed in Table 1.
The impact of AE on the correlation coefficient was then studied from a global perspective, considering the GIM data.The results show that AE mainly helps to increase the correlation coefficient in the high latitudes of the north hemisphere and has a strong hemisphere asymmetry, as shown by Fig. 7.In Fig. 7, the correlation coefficient differences between the improved model by Eqs.(7)and(8)are globally demonstrated.The increment of the correlation coefficient at high latitudes was dominant in low solar activity years, such as 2009 and 2010, indicating that the AE has a greater influence on the ionospheric TEC in the low solar activity years than in the high solar activity years. For all the WHU, CODE and UPC GIM products, the increments of the correlation coefficient in 2017 were dominant, especially in the America high latitudes.Another obvious increment of the correlation coefficient was discovered in 2010 at America high latitudes.It should be mentioned that the impact of O/N2on the correlation coefficient cannot be observed with the GIM data, since the GIM itself does not consider the influences of neutral compositions.
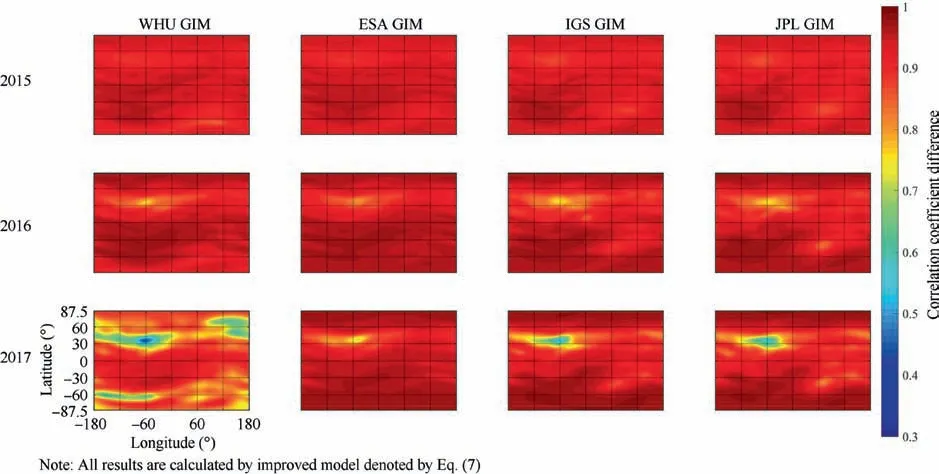
Fig. 5 Global correlation coefficient distributions for the WHU, ESA, IGS and JPL GIM data from 2015 to 2017.
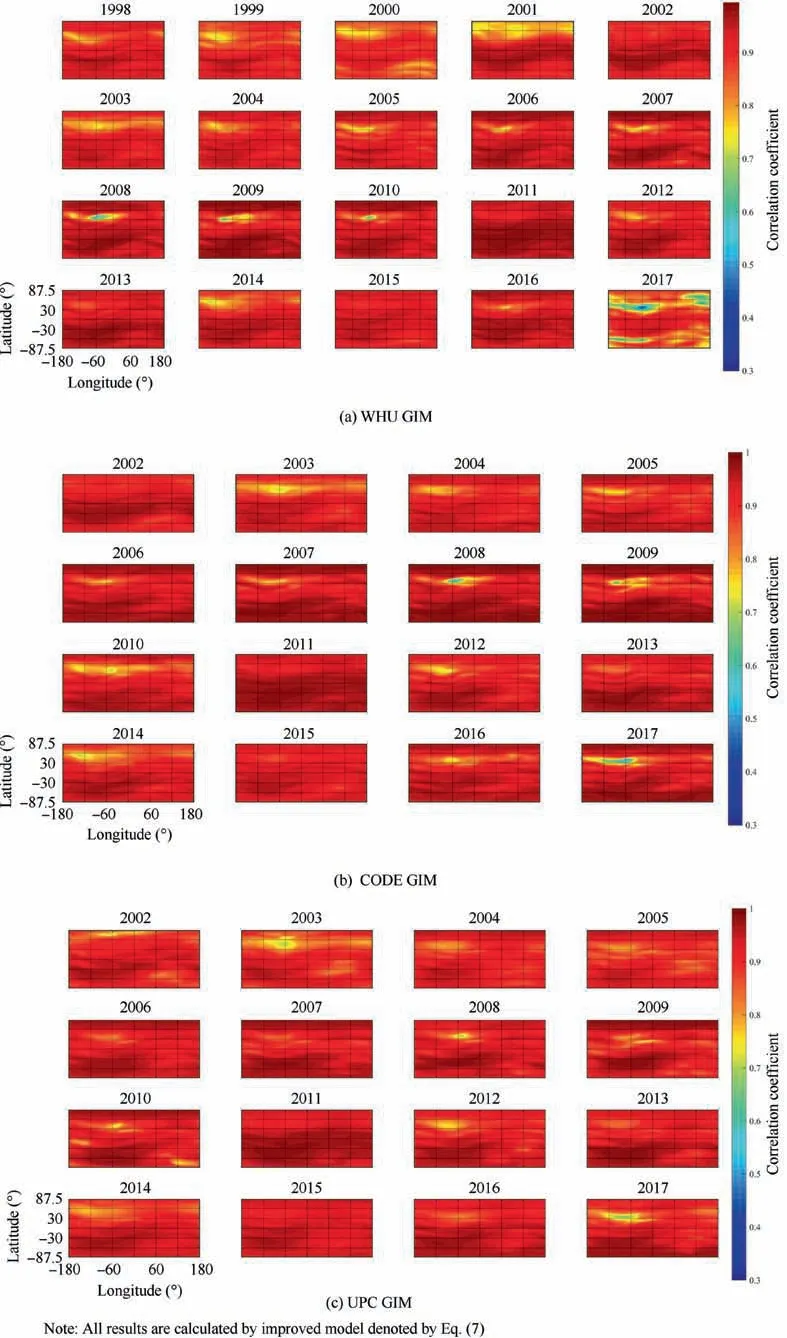
Fig. 6 Global correlation coefficient distributions for the WHU, CODE and UPC GIM data for all time spans.

Table 1 Correlation coefficient between proposed model by Eq. (8) and real TEC derived by IGS observatories.
4. Discussion
The ionospheric variability has been modeled in relationship with the geomagnetic index and solar flux, as well as the temporal and spatial geophysical factors. By analyzing the fitting accuracy and the TEC RSS, the original model proposed by Refs. 8,9 shows a poor performance during high solar activity years. The probable reason is attributed to the impact of higher order terms for the geomagnetic index and solar flux,which has been omitted in the previous model. In fact, those higher order attributions have been validated in the past studies16and need to be considered for a more accurate model.Moreover, it is critical to distinguish how those higher order factors influence ionospheric variability, as stated by previous literature.17In general, the variability is modeled with sinecosine variations. The regional and global ionosphere features are studied based on this assumption, and has been proven to be correct. Thus, in the proposed model, higher order influences of the solar flux and geomagnetic index are modeled following the same regulation. Two criteria are selected to validate the proposed model:the TEC RSS and the fitting correlation coefficient. From the real data analysis, the results show that the proposed model exceeds the original model in both metrics, especially the TEC RSS. Moreover, by studying long term global TEC features derived by the proposed model,the geophysical discrepancy of TEC RSS and the correlation coefficient are discovered for GIM products provided by different IGS associated data analysis centers.15Some features are valuable for further investigation, shed light on some unique spatial characteristics of the global ionosphere TEC distribution, and can help in understanding the GIM modeling. The discovered inconsistency in the middle latitudes of North America varies year by year,indicating that there is also a temporal variability to impact the consistency between the TEC model and the GIM model. Solar activity, geomagnetic status, the neutral composition and thermosphere circulation are all responsible for explaining the correlation coefficients depletion or the inconsistency between the model and observation.18
Considering previous studies, the probable cause of inconsistency between the TEC model and GIM model in the middle latitudes of North America could be attributed to the temporal fluctuations of the TEC, which are dominant in the global view. Another probable impactor is the existence of a midlatitudes ionosphere trough.19A series of studies conclude that the feature of a midlatitudes trough, in association with a plasmapause, is driven by the conviction of an electric field.20,21A further study demonstrates that the formation of a midlatitudes trough is controlled by the factors of a neutral wind, downward field-aligned currents and ion temperature changes.22The feature of the ionosphere trough is also ascribed to seasonal variations and has some symmetric properties for the north and south hemispheres.23
The proposed model is represented in three ways, given as Eqs. (5), (7) and (8), all of which help to improve the fitting accuracy. Eq. (5) is suitable for modeling the monthly ionosphere TEC variability, which is useful for long-term analysis and provides a better performance than the original model.Eq. (7) is further improved to model the daily ionosphere TEC variability, while maintaining a better fitting accuracy compared with the original model. Eq. (8) further considers the geomagnetic perturbations denoted by the impact of the AE and the neutral composition denoted by the impact of O/N2. The fitting accuracy has been improved by modeling the second order variation of the AE, especially for high latitudes in north hemisphere. This is a means to compensate for the low correlation coefficients calculated in Fig. 6. The study also reveals that the TEC variability in North America is more complicated than in other regions. With real IGS TEC observables considered, improving the fitting accuracy by adding O/N2into the model helps more, and it shows that neutral composition influence cannot be neglected in the real condition. The extension of the proposed model is to consider the meteorology contribution in long-term ionospheric variability and to add some global meteorology concerned parameters in the model.However,the previously addressed solution for considering the global circulation index failed to achieve important attribution by analysis of the GIM data in this work. Although some studies have modeled the contributions of ionospheric variability into three parts (solar activity, geomagnetic perturbations and meteorology variations,8,9the impact of the last factor still remains unknown and is under investigation.
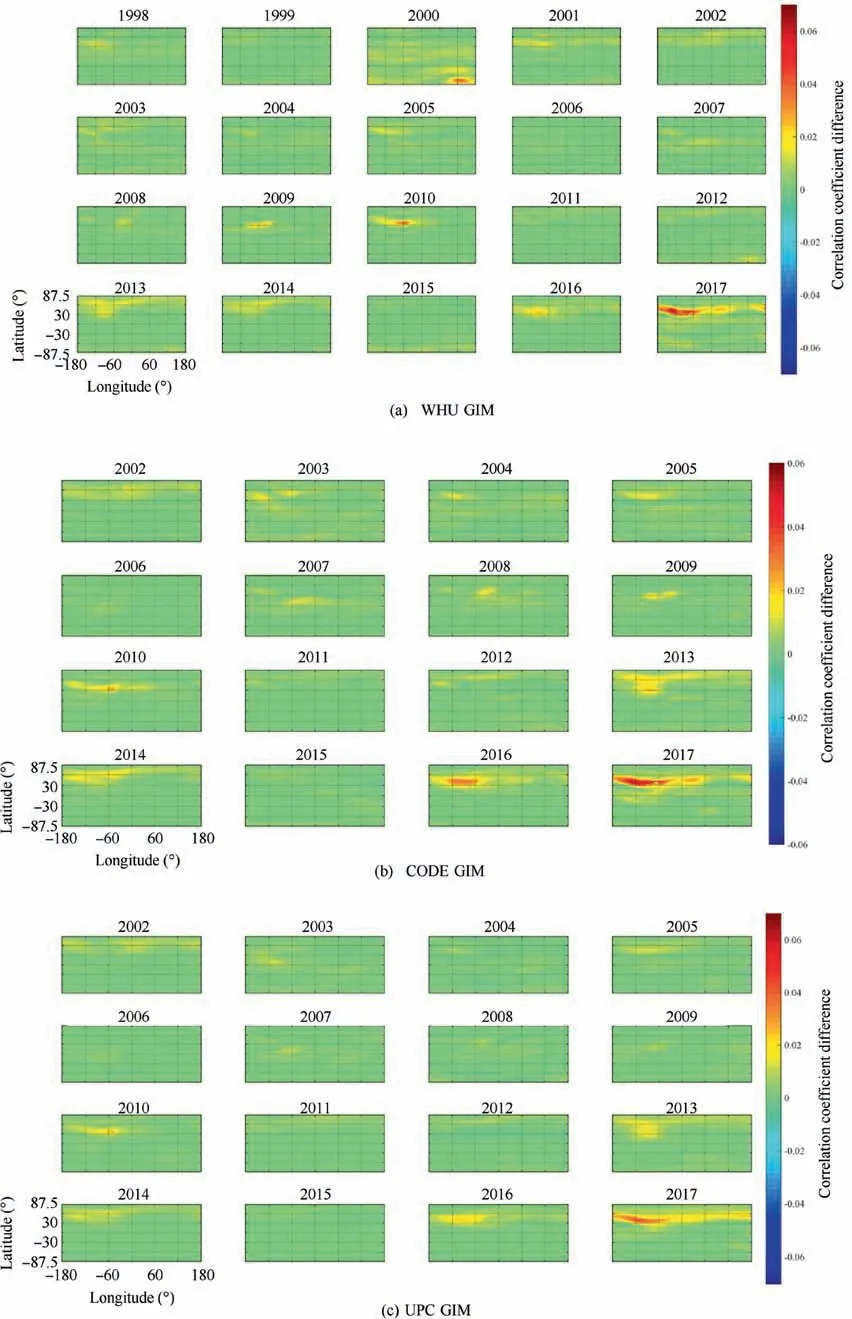
Fig. 7 Global correlation coefficient difference distributions for the WHU, CODE and UPC GIM data for all time spans.
5. Conclusions
In this study, an improved ionospheric TEC model is proposed,considering the second order variations of the geomagnetic index and the solar flux. The proposed model has three representative methods,denoted by Eqs.(5),(7)and(8)in this work. By analyzing the long-term TEC variability of the GIRO data and GIM data, the proposed method is further confirmed to be helpful. The global fitting accuracy is studied by comparing the TEC RSS and the correlation coefficient between the observations derived by the GIM and the proposed model values.The proposed work can help to better predict ionospheric TEC and know the regularities of ionospheric TEC activities, which brings benefits to know more about the response of ionosphere during space weather. The results are summarized as follows.
(1) The proposed model can improve the fitting correlation coefficient for both the GIRO and GIM data, and the TEC RSS has been greatly decreased. In fact,the fitting accuracy between the IRI-derived TEC and the GIM is also investigated, with a worse accuracy than the result of the proposed model in this work.
(2) The global TEC residual distribution is analyzed by the GIM data provided by different associated data analysis centers.All the results demonstrate a better performance of the proposed model than the original model. Moreover, the proposed model can help improve the fitting accuracy during high solar activity years and provide an effective accuracy during low solar activity years.
(3) By comparing the global correlation coefficient derived by different IGS-associated data centers,low correlation coefficients are discovered in the North America midlatitudes, mainly 30° N to 60° N. The relatively low correlation coefficient varies depending on the year. The results show poor correlation coefficients in the year 2017 for all the GIM data analysis centers, especially WHU GIM.
(4) The impact of the geomagnetic perturbations is considered by modeling AE in Eq. (8), with an analysis of GIM products from WHU, CODE and UPC. It is revealed that modeling AE can help increase the correlation coefficients, especially in the high latitudes of the north hemisphere. The results are dependent on solar activity and can achieve better correlation coefficients in low solar activity years, such as 2010 and 2017. The improvement in the correlation coefficients are dominant in 2017 in North America. The impact of the neutral composition is considered by modeling O/N2in Eq.(8), with an analysis of 10 years of real TEC from the IGS observatories.This shows that O/N2is a critical factor that can determine the variability of ionosphere TEC, which is consistent with the basic mechanism of ionization and ionosphere recombination.
(5) Another probable reason for the low correlation coefficients in North America shown in Fig. 6 is the ionosphere trough. This phenomenon is controlled by several complex factors, such as the changes neutral components, the particle precipitation, the conviction of the electric field and the field aligned currents. The variability of the ionospheric trough is also associated with season variation and solar activity.The mechanism is worth further study.
Acknowledgements
 CHINESE JOURNAL OF AERONAUTICS2021年2期
- CHINESE JOURNAL OF AERONAUTICS的其它文章
- Recent active thermal management technologies for the development of energy-optimized aerospace vehicles in China
- Electrochemical machining of complex components of aero-engines: Developments, trends, and technological advances
- Recent progress of residual stress measurement methods: A review
- Micromanufacturing technologies of compact heat exchangers for hypersonic precooled airbreathing propulsion: A review
- Towards intelligent design optimization: Progress and challenge of design optimization theories and technologies for plastic forming
- A combined technique of Kalman filter, artificial neural network and fuzzy logic for gas turbines and signal fault isolation
