Imaging of target with complicated motion using ISAR system based on IPHAF-TVA
Adelkader ALI CHERIF, Yong WANG
a Algerian Space Agency, Satellite Development Center, Oran 31000, Algeria
b Research Institute of Electronic Engineering Technology, Harbin Institute of Technology, Harbin 150001, China
KEYWORDS Inverse Synthetic Aperture Radar (ISAR);Maneuvering target;Multi-component Polynomial Phase Signal (m-PPS);Product High-Order Ambiguity Function (IPHAF);Time Varying Amplitude(TVA)
Abstract The technique of imaging a target with a complicated motion using an Inverse Synthetic Aperture Radar(ISAR) system is an effective tool in the field of radar signal processing. After the translational compensation, the received signal reflected from the target can take the form of a multi-component Polynomial Phase Signal (m-PPS), and the high quality ISAR image can be provided via the combination between the estimated parameters of the m-PPS and the Range Instantaneous-Doppler technique (RID). For a target with a high maneuvrability, the occurrence of scatterers Migration Through Resolution Cell (MTRC), caused by the rotational movement could be appearing.That is why the variation in the amplitude of the echo during the time of observation cannot be neglected. The purpose of this study is the parameters estimation of the m-PPS signal with order three in the case of the Time Varying Amplitude (TVA). The Improved-version of the Product High-order Ambiguity Function (IPHAF) with TVA is proposed to improve the quality of the ISAR image compared with traditional techniques based on a constant amplitude;the experimental outcomes confirm that the new IPHAF-TVA method presented in this study is an effective technique to make the ISAR image very clear.
1. Introduction
The rapid technological development of modern targets with non-cooperative motion pushes the specialists,the operational users and researchers worldwide to give a significant importance for the radar imaging1–4; and the appropriate technique that can be used in this case is ISAR imaging,where it becomes a very important research subject in the radar signal processing domain.5This technique is a well-known technology that exploits the relative movement between the targets and radar.6–8The principle of the ISAR imaging technique is to use the Doppler information provided by the motion of the targets. This makes the ISAR system different from other radar imaging systems.7The importance of ISAR is its capacity to provide a high-resolution image of far non-cooperative targets with known motion parameters in any type of weather,day and night.7–9The type of target varies between objects made by humans (aircraft, ships and satellites, etc.) to natural objects like planets.10This type of radar plays a very important role in many applications in different areas.It has been identified as an effective tool for target acquisition, and it is widely applied by the military (defense industry, automatic, target identification, space survey and aircraft monitoring, etc.) and civilians in some areas.11,12A high-resolution in the range and the cross-range can be provided by the transmission of a large bandwidth coded signal and the coherent integration of the gathered echoes.12The primary process before the ISAR imaging is motion compensation, which comprises the envelope alignment and the phase adjustment.12After the step of range-compression, the compensation of the translationalmotion can be obtained by the envelope alignment.12–14The phase errors between two neighboring echoes can be eliminated by the implementation of the phase adjustment.15The most often used techniques for the envelope alignment include the improved global range alignment algorithm16and minimum entropy algorithm.14The Phase Gradient Autofocus(PGA) algorithm can be adopted for the phase adjustment.15
For a target with uniform motion, it is assumed that the Doppler frequencies of all the scatterers are constant during the observation period. The ISAR image can be acquired by the implementation of the Range Doppler (RD) method,in which the Fourier Transform (FT) can be applied to processing the azimuth part of the echo to obtain a Two-Dimensional (2D) ISAR image.17However, the severe motion of a target induces a variation in the Doppler frequency during the period of observation.18–21Therefore, the spreading phenomenon of the FT makes the RD technique not efficient for a target characterized by complicated motion.5The Range Instantaneous Doppler (RID) technique is a suitable tool to solve this problem and obtain a focused ISAR image, where the time–frequency representation replaces the FT.22,23
There are two kinds of RID algorithms.5The first kind is based on the Time-Frequency Distribution (TFD) with high concentricity. The most common algorithms used in this case include the Wigner Ville Distribution (WVD),24Short Time Fourier Transform (STFT),25etc. These algorithms are effectively computational and can decrease the cross-term,but they suffer from trade-offs between the frequency resolution and the cross terms.In the second type,the received echoes located in the range cell take the form of the m-PPS Signal,and by estimation of its parameters, the ISAR image can be obtained with a high accuracy. In the situation of non-complicated maneuverable target, the use of m-PPS signal with a second order (Linear-Frequency-Modulated (LFM) signal) is enough to get a clear ISAR image, and several algorithms can be executed to estimate the parameters of the m-LFM signal,such as the Match Fourier Transform26and the Nuttall window Energy Barycenter Correction Method.27However, if the maneuvrability of the target is complicated, the appearance of the high-order phase term makes the m-LFM signal not suitable to obtain an ISAR image with a high accuracy, then the echo can take the form of m-PPS signal with order three(Quadratic Frequency-Modulated (QFM) signal), and by its parameters estimation, a clear ISAR image can be correctly obtained. Recently, various techniques were proposed to estimate the parameters of the m-QFM signal such as the Generalized Cubic Phase Function (GCPF),5Integrated GCPF,28Product GCPF,29Modified Discrete-polynomial Phase Transform (MDPT),5Product High-order Ambiguity Function(PHAF),30Improved version of PHAF (IPHAF),12etc. These algorithms have a good performance for targets characterized by a complex motion or a high maneuvrability.The amplitude is considered constant in the aforementioned algorithms, and the MTRC phenomenon caused by the rotational movement is usually ignored.31As a matter of fact,in the case of a target with severe motion, the variation in the amplitude for the received signal induced by MTRC cannot be neglected.32
In Ref. 28, the GCPF founded on TVA provides a good quality ISAR image compared to the conventional technique GCPF that uses a constant amplitude. The goal of this paper puts forward a parameters estimation of the m-QFM signal using the newly proposed IPHAF-TVA algorithm, and from the experimental work,we can see that the quality of the ISAR image becomes much clearer than the conventional IPHAF method.
This paper consists of seven sections.Section 2 presents the geometry of the ISAR imaging,the m-PPS signal and m-QFM signal paradigm based on TVA. Section 3 then focuses on the estimation of parameters for the m-QFM signal determined by the proposed IPHAF-TVA method.Section 4 provides the theoretical side of this study. Section 5 demonstrates the experimental work. Section 6 is the conclusion of this paper.
2. Signal paradigm for backscattered signal
In this part,we describe the construction of the received signal reflected by a target with a complicated movement by the ISAR system. It is proposed that the reference point O is the center of the target rotation as depicted in Fig. 1. The radar and the target are located in the same plane oriented along the y axis,is the coordinate of the ith scatterer, where xi=Risin(αi) is the cross-range coordinate, whereas yi=Ricos(αi) is the range coordinate.
We propose that the motion compensation of the backscattered signal has been performed at the radar receiver, and the rotation of the target is non-uniform, thus the instantaneous angular velocity ω(t) can be given as follows

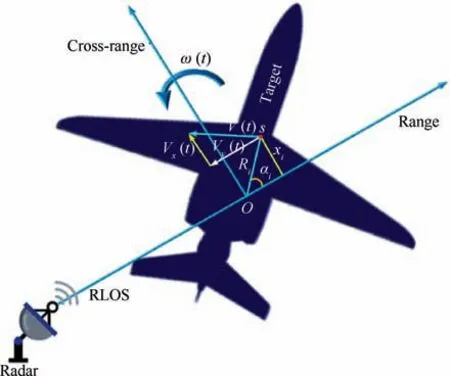
Fig. 1 Illustration of ISAR system geometry.
where ω0is the rotational velocity,ω1is the acceleration,ω2is the acceleration rate,ω3is higher order terms and Riis the distance between the reference point O and the scatterer s.
The radial velocity V(t) is divided into two composites,Vx(t)and Vy(t),where Vy(t)is parallel to the RLOS direction,which provokes the Doppler frequency of the scatterer s.Vx(t)is perpendicular to the RLOS direction and it has no impact on the Doppler frequency. Hence, the efficient radial velocity can be given as
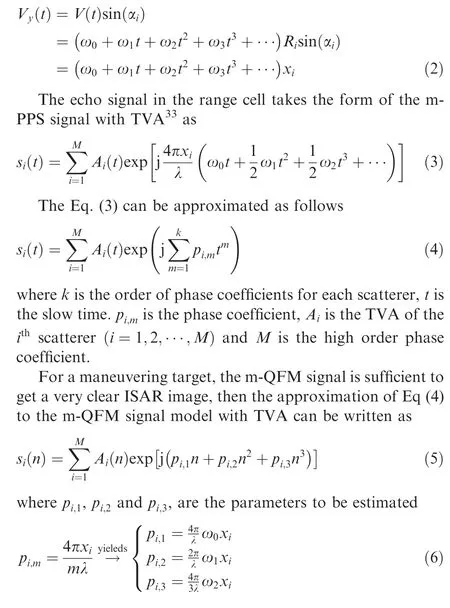
3. Parameters estimation of QFM signal model using IPHAF algorithm
3.1. QFM signal with constant time amplitude
In this subsection, the discrete form of the m-QFM signal can be given as follows

where N is the length of the signal, |n|≤(N-1)/2 and Aiis the constant amplitude of the ithcomponent.
3.2. Brief review of High-order Ambiguity Function (HAF)
The discrete form of HAF of the m-QFM signal model is defined as follows

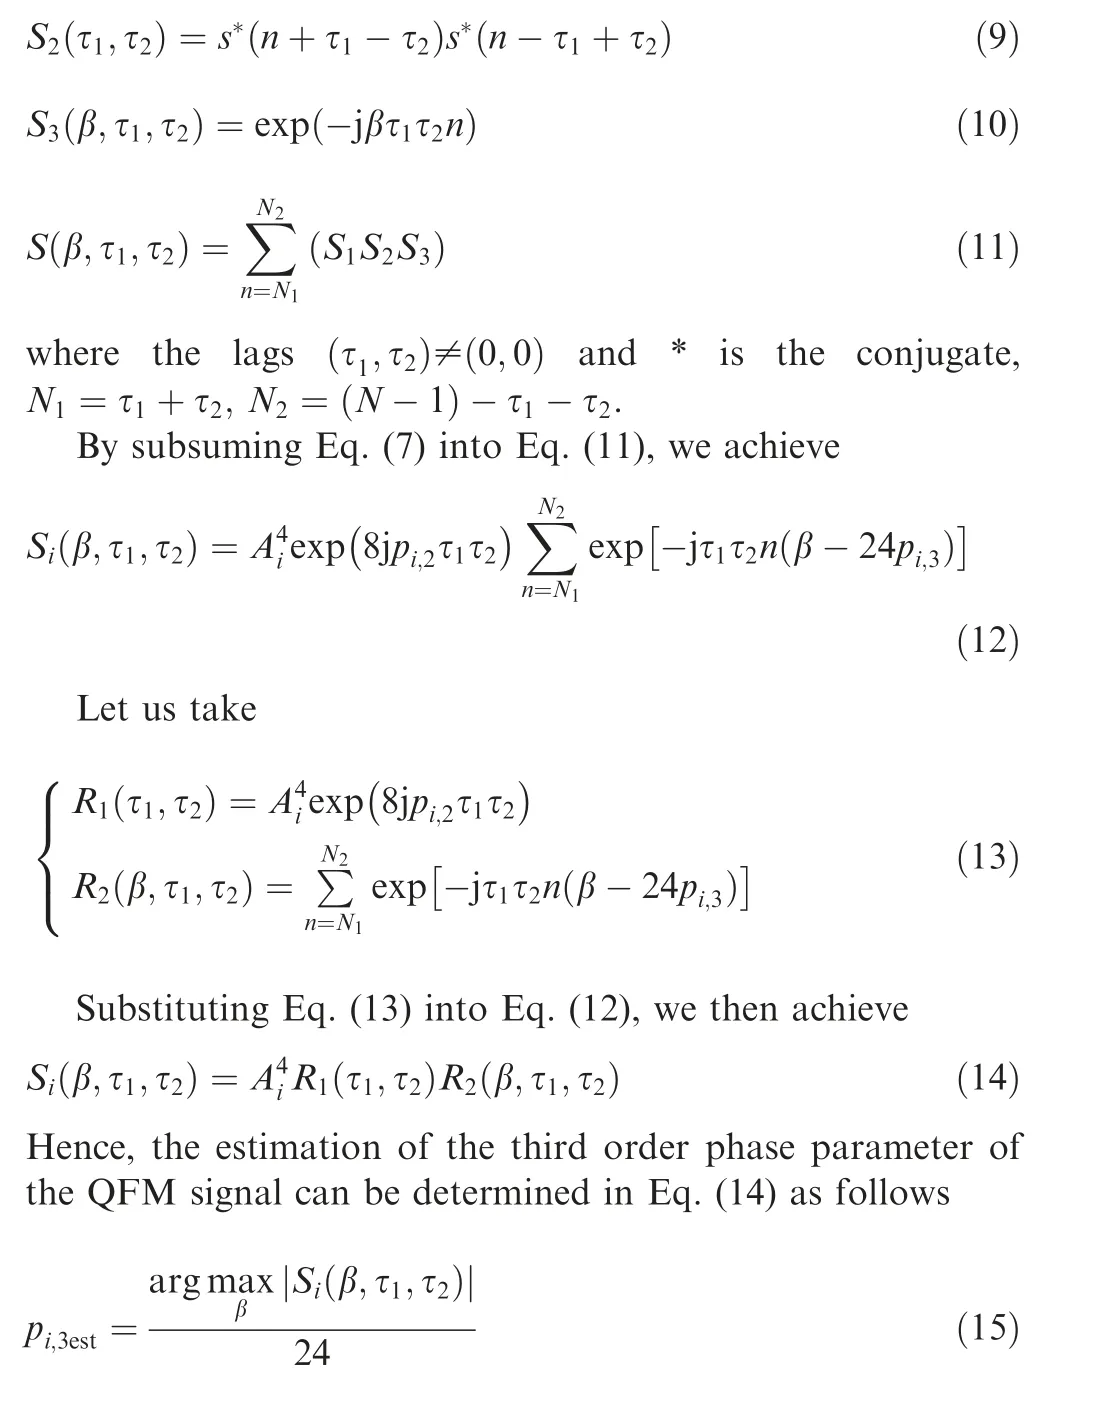
where pi,3estis the pi,3estimated.
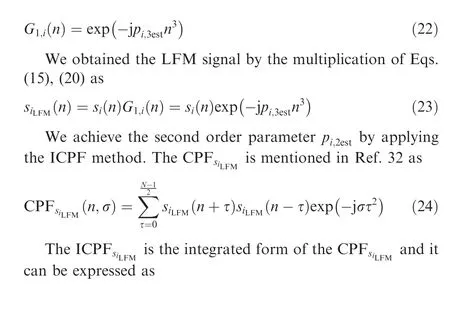
After the estimation of pi,3,the LFM signal can be obtained by applying the Dechirp technique to the m-QFM signal. The other phase parameters can then be estimated by applying the Fractional Fourier Transform (FRFT)34and the Integrated Cubic Phase Function (ICPF).19
The IPHAF algorithm used in Ref.12 is a powerful method to estimate the third phase coefficients of the m-QFM signal,and it can be expressed as follows

4. Parameters estimation of m-QFM signal model using IPHAF-TVA algorithm
4.1. m-QFM Signal model based on TVA
Based on Section 3.2,we can state that the IPHAF is an effective algorithm to estimate the parameters of the m-QFM signal model with a constant amplitude.In this subsection,the novel technique IPHAF-TVA was applied to estimate the parameters of the m-QFM-signal. The detailed analytical form of the TVA for a PPS signal is explained in Ref.28.We now take into account the TVA, because the real situation of the ISAR imaging is based on the small integration of the time intervals.The QFM signal model with a slow TVA can be depicted as follows
where AiTVAis the slow TVA and|n|≤(N-1)/2.According to Ref.28,we can see that the TVA has the form of a polynomial of finite order or slowly varying beating (cosine) wave.
4.1.1. Phase parameters estimation
The phase parameters of the m-QFM will be estimated one by one in detail as follows
Based on Eq. (14), the IPHAF of Eq. (17) can be achieved as follows
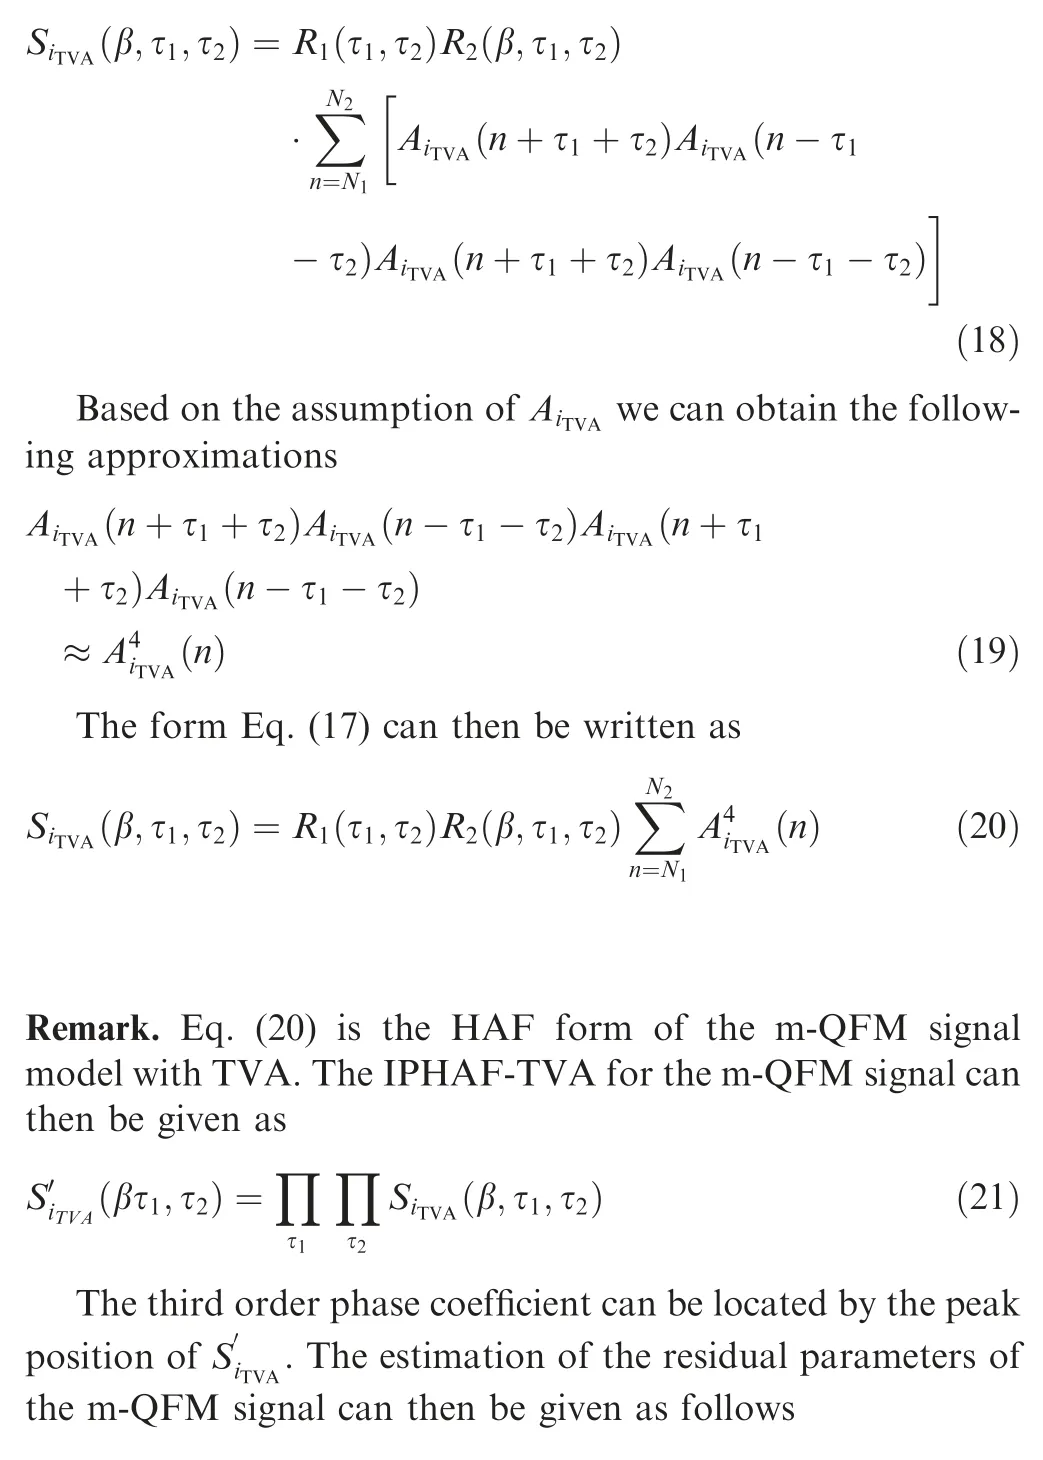
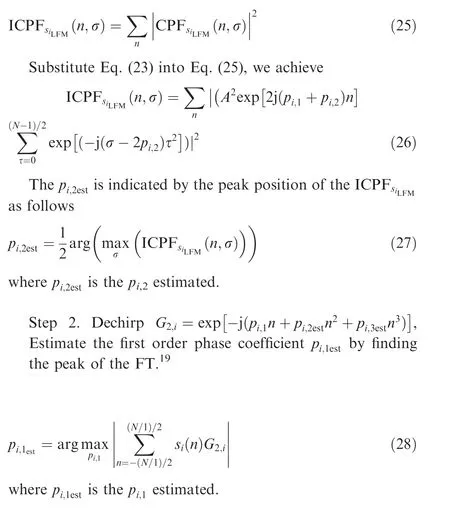
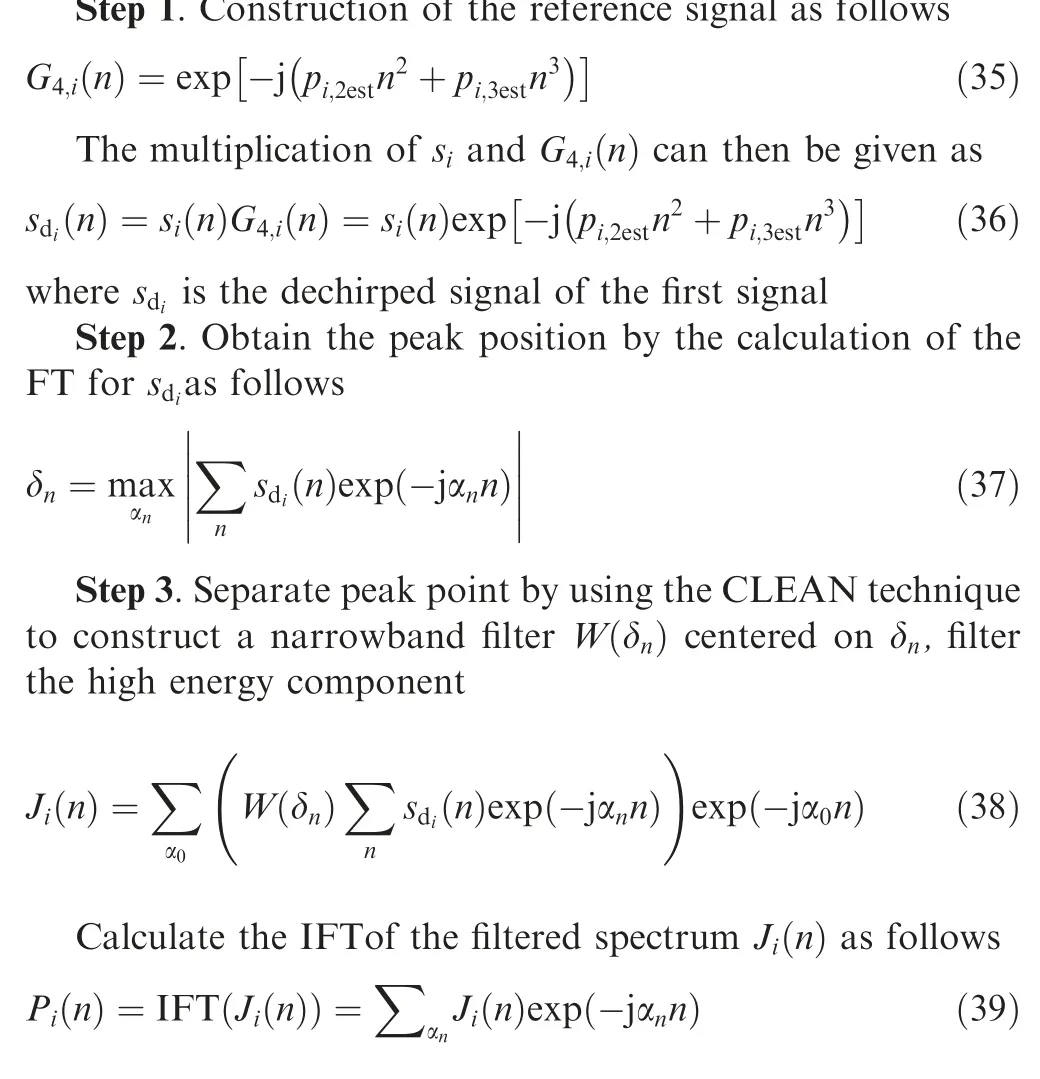
Step 1. After estimation of the third order parameter pi,3estas mentioned in Eq.(15),the form of the LFM signal model can be distinguished by applying the Dechirp technique on the original m-QFM signal as follows
4.1.2. Amplitude estimation
After the estimation of phase parameters,we have two kinds of to be estimated amplitude, including the constant amplitude and the TVA.
(1) The estimation of the constant amplitude

(2) The estimation of the time varying amplitude
The TVA of m-QFM signal can be estimated via the following steps.
Step 1. Construction of the reference signal as follows
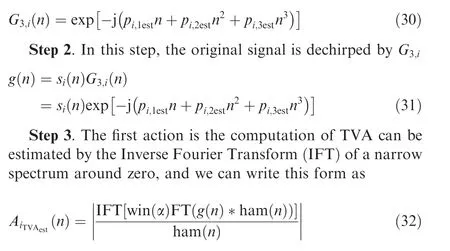
where FT is the Fourier transform,IFT is the inverse FT,ham is the hamming window, α is the window width and win(α) is the window function defined as
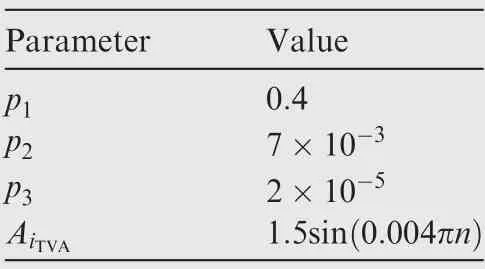
Table 1 One QFM with TVA.

where the determination of αLand αRis based on the narrow spectrum width around zero.
In the above-mentioned step,the phase parameters and the TVA of the m-QFM signal model can be estimated based on the IPHAF algorithm. In the situation of m-QFM signal with TVA, the CLEAN technique can be implemented one by one for the parameters estimation of all components.In next paragraph, a well detailed analysis about a clean technique was described for the parameters estimation of the m-QFM signal model with TVA.
We assume that the discrete form of the m-QFM signal with TVA can be written as follows

We initialize Eq. (34) by i=i+1, and we estimate the phase coefficients of si(n) using the Eqs. (15), (27), (28), then the TVA can be estimated by Eq. (32).
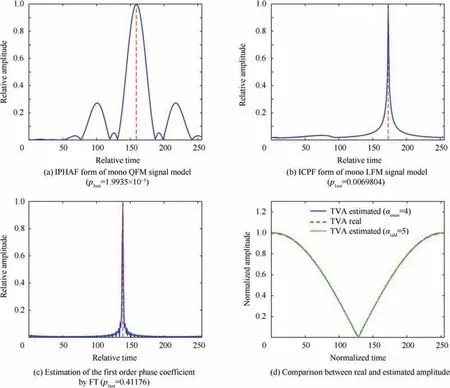
Fig. 2 Estimation values of QFM signal model with TVA.

Table 2 Parameters of three-components QFM signal with TVA.
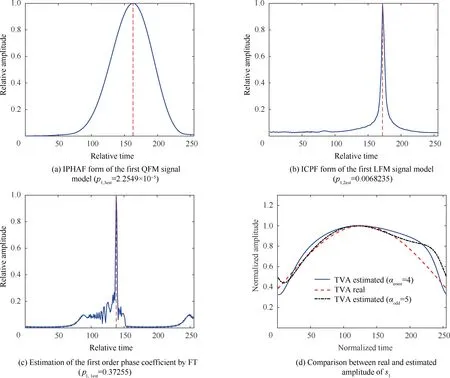
Fig. 3 Estimation of phase coefficients and TVA for the first component QFM signal.
After the estimation of the ithcomponent of the m-QFM signal, we subtract it for the original signal si(n) by the CLEAN technique determined by the following steps
Step 4. (1) We can obtain the form of a signal without the estimated ithcomponent of the QFM signal model as

(2)Update i=i+1,and apply a recursive action above until i=M or ε the predetermined threshold,is greater than energy of rest signal.
4.2. Numerical examples for QFM signal with TVA
Some numerical examples are given to show the effectiveness of the proposed IPHAF-TVA algorithm. We use the discrete form of the QFM signal model mentioned in Ref. 32, where N=255 is the length of the signal.
4.2.1. One-component QFM signal with TVA
The parameters of the mono-component QFM signal with TVA are indicated in Table 1.
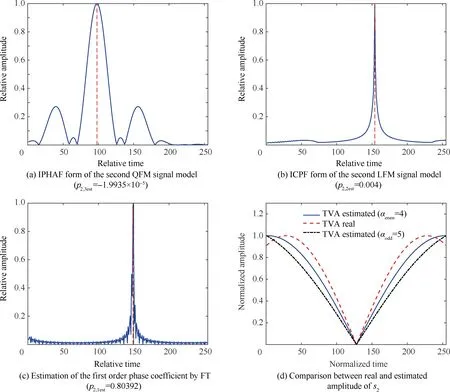
Fig. 4 Estimation of phase coefficients and TVA for the second component QFM signal.
Fig. 2(a) is the IPHAF of the QFM signal s(n) (monocomponent), and the phase coefficient with order three (03)can be estimate by locating the position of the peak. In Fig.2(b),the second phase parameter of the signal s(n)is estimated by locating the position of the ICPF peak for the LFM signal Dechirped from the QFM signal as previously shown in Eqs. (22), (23). In Fig. 2(c), the first order phase parameter then can be estimated by Eq.(28).In Fig.2(c),it is noted that the values of the TVA estimated by αodd=5 are very convergent to the real TVA values. Fig. 2(d) provides a comparison between the original amplitude(true values)and the estimated time varying amplitude for two cases of the window’s width,αenen=4 and αodd=5.
4.2.2. Three-components QFM signal TVA
The values of the phase coefficients pi,1,pi,2,pi,3and TVA of the three QFM signal models are shown in Table 2, where(p1,1,p1,2,p1,3)≠(p2,1,p2,2,p2,3)≠(p3,1,p3,2,p3,3).
Fig. 3(a) is the IPHAF form of the three-components(s=s1+s2+s3), and the peak position indicates the estimated third order phase coefficient of the higher energy signal.The estimation of the phase coefficient with order two(02)can then be obtained by Eq. (27) using the ICPF algorithm, as shown in Fig.3(b).Fig.3(c)is the FT peak position calculated by the Eq.(28) and it indicates the first order parameter of the signal with a high energy. Fig.3(d)is the comparison between the true value of the TVA and the values estimated by the Eq.(32) with αenen=4 and αodd=5.
After obtaining the rest of the original signal by applying the CLEAN technique,the parameters of the second QFM signal can be estimated by the same steps used for the first signal.Fig. 4(a) is the IPHAF form for the other QFM signal model and the peak indicate the third phase coefficient order. Fig. 4(b) is the ICPF for the LFM signal Dechirped from the QFM signal, and the peak position indicate the second phase coefficient order of the second component. Fig. 4(c) shows the first order coefficient of the second QFM signal. Fig. 4(d) is the comparison of the real values for the amplitude and estimated amplitude with αenen=4 and αodd=5.
The parameters of the third component can be estimated by the same steps used for parameters estimation of the second component. Fig. 5(a) is the IPHAF form of the third component s3, and the peak position indicates the estimated third order phase coefficient. As shown in Fig. 5(b), the estimation of the phase coefficient with order two can then be obtained by Eq.(27)using the ICPF algorithm.Fig.5(c)is the FT peak position calculated by the Eq. (28) and it indicates the first order parameter of the third signal.Fig.5(d)is the comparison between the true TVA and the estimated TVA with αenen=4 and αodd=5.
4.3. Imaging algorithm determined by on m-QFM signal model with TVA
In this section, the azimuth echo in a certain range cell takes the form of the m-QFM signal with the TVA.
The parameters of the m-QFM signal with TVA will be estimated using the proposed algorithm in this study by the following steps
Step 1. Achievement of motion compensation of the echo signal.
Step 2.The echo signal takes the form of the m-QFM signal with the TVA, as shown in Eq. (17).
Step 3. Initialize i=1 in Eq. (17), and estimate the phase parameters pi,1,pi,2and pi,3using the forms mentioned, respectively, in Eqs. (15), (27), (28).
Step 4. Estimation of TVA by Eq. (32).
Step 5. Subtraction of the estimated signal from the global received signal by the implementation of the CLEAN technique
Step 6. Update i=i+1, and follow the afore mentioned steps. This operation must be stopped when i=M or the energy of the remaining signal is lower than μ.
Step 7. The combination of the parameters estimated by the RID method to generate an instantaneous ISAR image.
Fig.6 is comprised of the previous steps of the ISAR imaging, where U is the total of the range cells.
5. Experimental results
In this section, the results of the data simulation for aircraft and real data by ISAR imaging system demonstrate the potential of the IPHAF-TVA.
5.1. ISAR imaging result of simulated data
In this subsection,it is assumed that transmuted signal is LFM and the phase of the motion compensation has been terminated, and Table 3 contains the radar parameters as follows
In Fig.7,we can see a simulation of aircraft founded on the LFM signal style. Fig. 7(a) is the simulation of aircraft with 193 points, and Fig. 7(b) is an ISAR image for aircraft with severe motion via a Range Doppler algorithm, which we can remark that the RD technique is not suitable for this kind of movement, thus the ISAR image here is a blurry picture.
Fig. 8(a) and Fig. 8(b) are the ISAR image of aircraft founded on the QFM signal style by the implementation of the IPHAF algorithm in case of a constant amplitude. Fig. 8(c) and Fig. 8(d) are the ISAR image of the same target by applying the proposed IPHAF-TVA technique.
From the simulation results of the imaging target by the ISAR system founded on the m-QFM signal style depicted in Fig. 8, we can see that the implementation of the IPHAFTVA algorithm can generate a more focused ISAR image than the IPHAF algorithm with a constant amplitude, where in Fig. 8(a) and Fig. 8(b), the spurious scatterers are clearly appear for the IPHAF algorithm with a constant amplitude compared to the IPHAF-TVA algorithm in Fig. 8(c) and Fig. 8(d). Here, it can be inferred that the implementation of the IPHAF-TVA algorithm for the ISAR image of a high maneuvering target can reduce the spurious scatterers and obtain a high quality ISAR image.
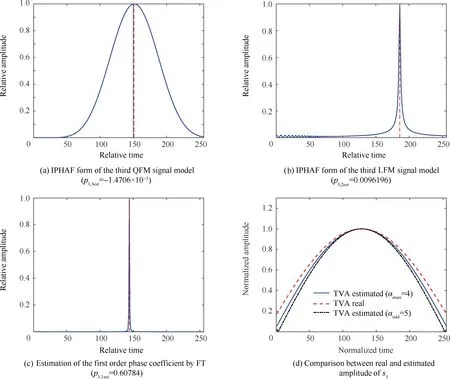
Fig. 5 Estimation of phase coefficients and TVA for the third component QFM signal.
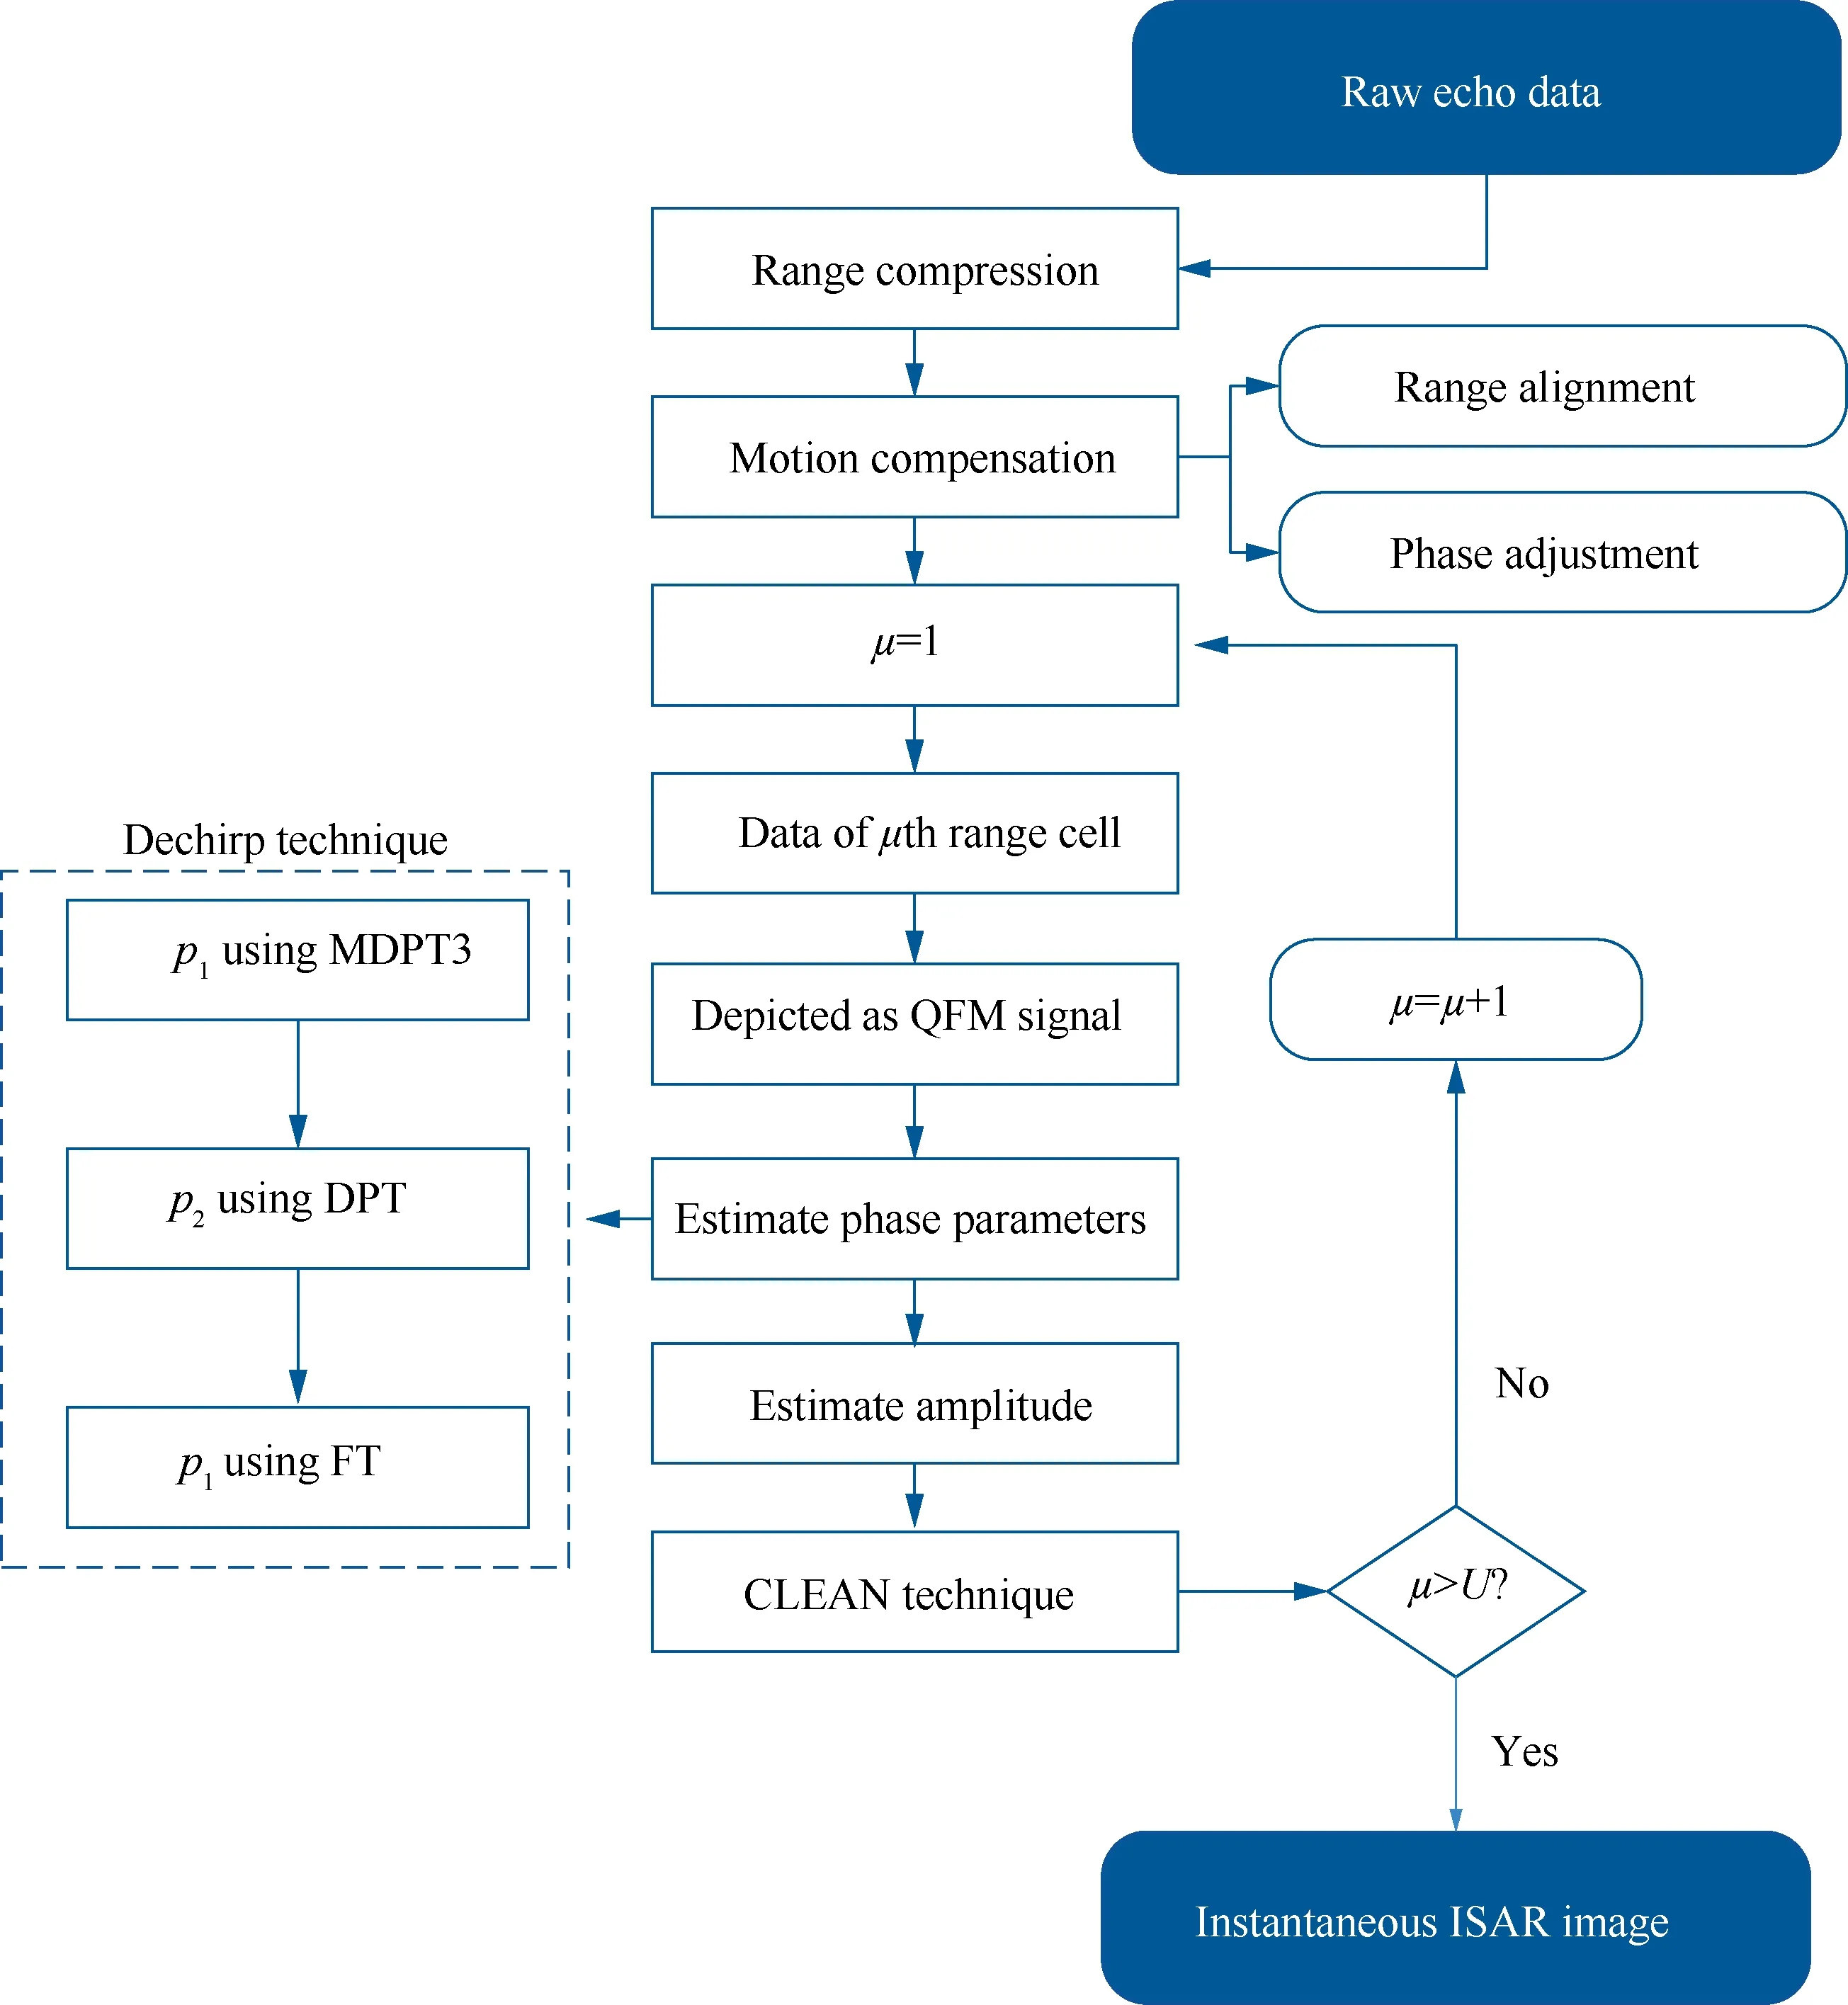
Fig. 6 Steps of ISAR imaging technique.
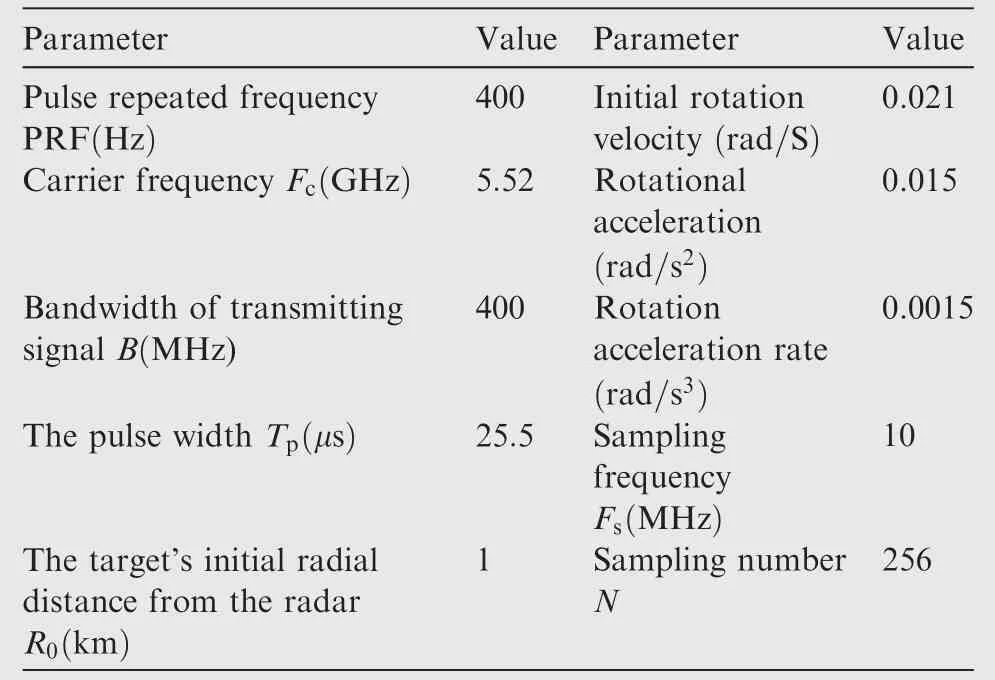
Table 3 Parameters of radar.
The concept of entropy is commonly utilized in engineering to measure the disorder of any system. Moreover, this technique can be adopted to measure the intensity of 2D ISAR images.In our study,we calculate the entropy of ISAR images obtained via IPHAF and IPHAF-TVA to measure the disorder of 2D ISAR images. Based on the obtained entropies results, we can compare between the two methods. The entropies of the proposed method (IPHAF-TVA) are smaller than those of the previous method (IPHAF). These results indicate that obtained images of the proposed method are clearer since smaller entropy means a better-focused image.
We calculate the Entropy to measure the quality of the ISAR images in Fig. 8, the results are listed in Table 4. The Entropy of the complex ISAR image ISARim(m,n)is calculated as follows
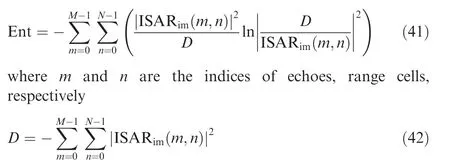
The best image quality has the smaller entropy value; we can see from the Table 4 results that the entropies values of Fig. 8(c) and Fig. 8(d) are smaller than those in Fig. 8(a)and Fig. 8(b), respectively. This result proves the effectiveness of the proposed method to obtain a high ISAR image compared with the previous technique.
5.2. ISAR imaging result of real aircraft data
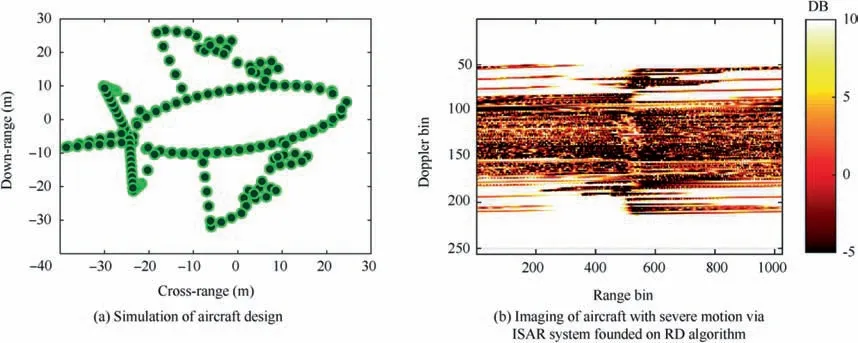
Fig. 7 Simulation of aircraft design and result of ISAR imaging based on LFM signal model.
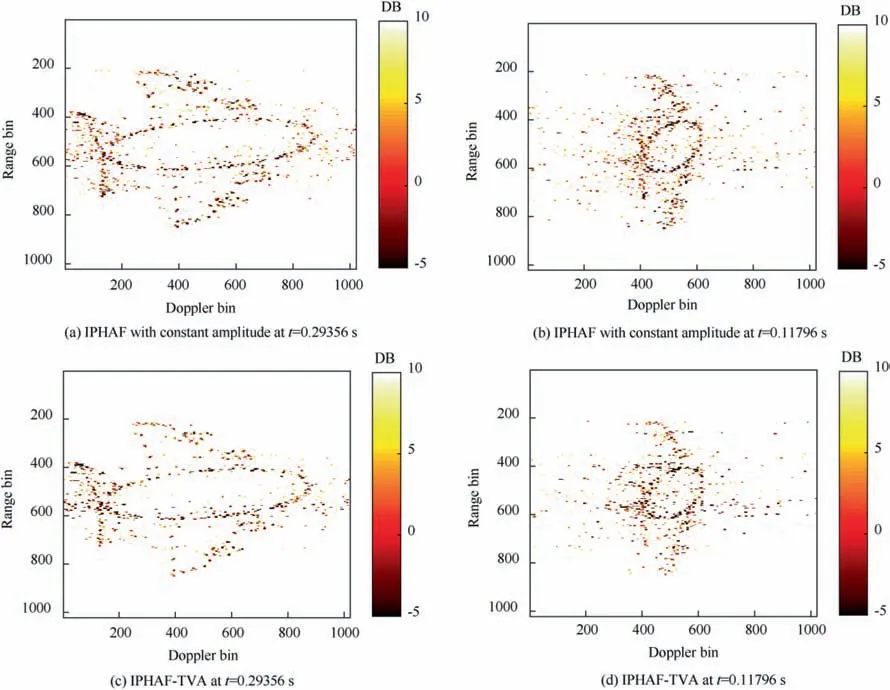
Fig. 8 Imaging of target via ISAR system founded on m-QFM signal.
This subsection is devoted to analyzing the ISAR imaging with real data YAK-42 aircraft, and it is based on m-QFM style model by applying IPHAF algorithm in the situations (constant amplitude and TVA) to prove the effectiveness of the proposed algorithm.The transmitted signal is the LFM signal,the carrier frequency is F0=5.52 GHz, and the pulse repetition frequency is PRF=40 MHz, and the bandwidth is B=400 MHz.
Fig.9(a)is the dimension of shape for Yak-42 plane with its ISAR image based on RD algorithm as shown in Fig.9(b).We can see that ISAR image in Fig. 9(b) is severely blurred, that means the RD algorithm is not suitable for target with highspeed target with sever maneuverability.
Figs. 10 and 11 provide a comparison between the IPHAF(constant amplitude) and IPHAF-TVA. We can observe that erroneous scatterers are decreased in Fig. 10(b), Fig. 11(b)compared to Fig. 10(a), Fig. 11(a), respectively.
The ISAR images quality of the results of real data is measured using the entropies and it can be calculated as shown in Eq. (41), the entropies values are listed in Table 5.

Table 4 Entropy values of ISAR images in Fig. 8.
In Table 5, we can remark that the entropies values of the ISAR images in Figs.10(b)and 11(b)are smaller than those in Figs. 10(a) and 11(a), respectively. This prove that the focus quality of the IPHAF-TVA method is better than the previous method IPHAF, and the inclusion of the time varying amplitude for the received signal is effective.
The mentioned experimental results prove that the suggested method in this IPHAF-TVA study is quite effective for imaging a target characterized by a complicated motion by the ISAR system, and the improvement of the image fineness is very clear.
Remark
(1)In the IPHAF algorithm indicated in Ref.12.(A)The delay parameters are selected as different from zero. (B) The incensement of the number of delay parameters will improve the precision of the IPHAF algorithm. (C)Because of the computational complexity, the number of delay parameters will not be too large.
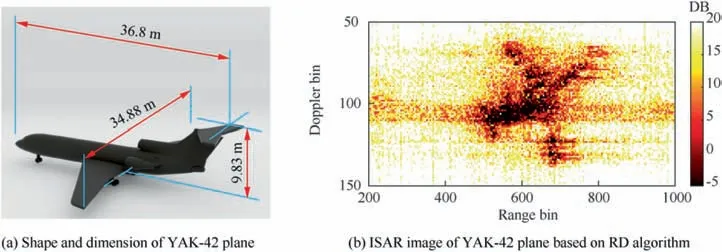
Fig. 9 Shape of target and it’s ISAR imaging result.

Fig. 10 Imaging of target via ISAR system founded on m-QFM signal (real data) at t=1.3101 s.

Fig. 11 Imaging of target via ISAR system founded on m-QFM signal (real data) at t=1.7619 s.

Table 5 Entropy values of the ISAR images in Figs. 10 and 11.
(2)For Time Varying Amplitude(TVA).(A)The implementation of the proposed algorithm to estimate the TVA, will improve the accuracy of ISAR images obtained compared with constant amplitude. (B) The computational complexity using TVA will be augmented compared with the use of constant amplitude.
6. Conclusions
In the real situation of the ISAR imaging for a target with severe motion or a complicated maneuvrability, the received signal located in the range cell takes the form of the m-QFM signal with TVA. The IPHAF technique is implemented for estimation of the m-QFM signal model’s phase parameters,where the estimation of the TVA can be adopted by the combination of the Dechirp technique and IFT. The simulated data and real data given in the Section 5, show a comparison between the proposed algorithm and the previous method based on the constant amplitude.Furthermore,it is noted that the quality of the ISAR image can be clarified.Finally,we conclude that the proposed IPHAF-TVA algorithm in this study is an effective tool to improve the quality of the ISAR image for a high maneuvering target.
Acknowledgement
This work was supported in part by the National Natural Science Foundation of China (No. 61871146).
 CHINESE JOURNAL OF AERONAUTICS2021年2期
- CHINESE JOURNAL OF AERONAUTICS的其它文章
- Recent active thermal management technologies for the development of energy-optimized aerospace vehicles in China
- Electrochemical machining of complex components of aero-engines: Developments, trends, and technological advances
- Recent progress of residual stress measurement methods: A review
- Micromanufacturing technologies of compact heat exchangers for hypersonic precooled airbreathing propulsion: A review
- Towards intelligent design optimization: Progress and challenge of design optimization theories and technologies for plastic forming
- A combined technique of Kalman filter, artificial neural network and fuzzy logic for gas turbines and signal fault isolation
