Mechanical behaviour of adhesively single lap joint under buckling conditions
Ferhat KADIOGLU
Department of Aerospace Engineering, Ankara Yildirim Beyazit University, 06050 Ulus, Ankara, Turkey
KEYWORDS Adhesive joins;Buckling mode;Energy absorption;Finite element method;Single lap joint
Abstract Adhesive Single Lap Joints have been subjected to tensile and bending investigations by many researchers.However,the joint is also likely to experience buckling loading in some aerospace applications. The aim of this work is to investigate the joint behaviour under quasi-static buckling conditions. For this purpose, the joints with three different adherend thicknesses and 25 mm overlap length were tested using two different types of adherends and an adhesive film.They were modelled using a non-linear Finite Element Method via the ABAQUS Explicit package programme.Load to failure and stress distributions in the joints were predicted and compared with the experimental results,which were found in a good agreement.The adhesive layer in the joint was assumed to experience shear stresses under the buckling mode,similar to that in tensile loading,yet,the stress concentrations at the ends of the overlap, the main cause of the failure, resulted in different effects on the joint performance;for the buckling mode the critical stresses were in compression but for the tensile case in peeling.Unlike the latter,the former was found to prevent failure of the layer depending on the adherend thickness, causing different failure mechanisms. There were two different failure modes of the joints; a complete failure in the adhesive layer and large plastic deformation of adherends which could be a good source for crashworthiness situations. Mechanical properties of the adherends were found to play important roles on the joint performance.
1. Introduction
Adhesive bonding as a joining technique has been used especially in aerospace and automotive applications for many years as it provides some advantages over traditional mechanical joining systems such as bolted,riveted and pinned joints.There are many types of adhesive joints,1yet,Single Lap Joint(SLJ)configuration is the one mainly preferred by the designers due to its simplicity and being representative to those used in real applications.In existing literature,the joint performance under tensile and bending loadings have been investigated by many researchers. For example, Adams and Peppiatt2are the first to conduct in-depth experimental and numerical investigations about the joints under tensile loading. In the study, it was found the bonded region was under multi-axial stresses resulting in stress concentrations especially at the ends of the region.Different techniques, such as spew fillet, tapered ends, etc.were aimed to overcome the problem.3Investigations about the SLJ revealed that there were many parameters affecting the joint performance, mainly, bonding methods, surface preparation, mechanical properties of adherends and adhesives, and geometrical parameters (adhesive and adherend thickness, overlap length, fillet et al.).4It was also found that the strength of the joint was affected by different loading modes, tension and bending. For instance, an adhesive which was relatively stronger in one mode,tension,was not necessarily so for the other mode, e.g. bending.5Some applications especially in aircraft industry have revealed that some adhesively-bonded structures are subjected to compressive(buckling) loading during their service life. A fuselage splice joint from composite materials, a stringer-stiffener and wing spar assembly are the example of aircraft applications. Some works on the bonded joints in buckling mode have been carried out so far but they are mainly related to those in plate forms rather than in traditional SLJ configuration, i.e. ASTM 1002 standards. The bonded plates are generally analysed to assess their mechanical performance sensitivity to artificial defects created in bonded region. For example, Kim and Kwon6developed closed-form buckling solutions for generic one-edge-free problems common to partially disbonded composite structures. These solutions were shown to be accurate by comparison with experimentally measured buckling loads.The buckling of partially disbonded regions in adhesive joints were thought to be a safety concern due to the potential for ensuing buckling-driven disbond growth.In another work conducted by the same authors,7the strains at which buckling and disbond growth in adhesively bonded composite flanges containing an initial disbond were measured experimentally. Test parameters including initial disbond geometry, flange material stiffness, and the adhesive critical strain energy release rate(Gc) were investigated. Disbond growth was found to be strongly dependent on initial disbond length but weakly dependent on flange width; i.e., disbonding resistance did not increase in direct proportion with the bonded overlap dimension. Senthil et al.8investigated the effect of disbonds on the structural performance of adhesively-bonded curved Carbon Fiber Reinforced Plastic (CFRP) panels with a quasiisotropic lay-up under compressive loading environment.Two types of specimens were tested, one without disbonds and the other with disbonds of specified size, artificially introduced within the lap region.The effects of location of disbond and panel curvatures were studied computationally incorporating disbonds of different sizes. It was found that disbond location along the specimen length had significant effects,and the buckling load reduced when the panel curvature increased for the same disbond size.The computational model predictions were found in a good agreement with experimental observations. In another work,9the effects of disbond shape,size and interface were investigated numerically under uniaxial compression (buckling). It was concluded that disbond initiation and growth were dominantly governed by the Mode-I energy release at the disbond boundary and presence of disbond closer to the free surface had more tendency to grow at low load level.
Angelidi et al.10is one of the few studying the tensile and compressive performance of two different adhesives using double lap joint with timber adherends. The results showed that the joints with relatively flexible adhesive had better performance especially for those in compression loading.
As explained above, some adhesively-bonded structures used in aerospace applications such as a stringer-stiffener and wing spar assembly are dominated by buckling loading during their service life, and there are only limited works in the literatures related to the subject.It is believed that studying mechanical behaviour of bonded single lap joints under such a loading mode will close this gap and motivate many designers to focus on the subject. The aim of this study is to investigate the performance of SLJs under this type of loading using some parameters such as different adherend materials (aluminium 6061 and aluminium 7075) and adherend thickness (2 mm,4 mm and 6 mm). The joints with a constant adhesive layer,0. 20 mm, were subjected to buckling quasi-static loading and the experimental results were compared with numerical ones using the ABAQUS Explicit package programme.
2. Experimental works
Tensile and compression tests were carried out with a Besmak BMT-S 100 kN universal testing machine to characterize the elastic, plastic and failure response of the adherend materials,AA6061 and AA7075, and the adhesive film (AF163-2K), a knit film made of thermosetting modified epoxy produced by 3M Scotch-WeldTM, used in this study. Tensile test specimens of bulk adhesive and adherends with the geometrical details are presented in Fig.1(a),and details of compression adhesive specimens are shown in Fig.1(b).The bulk adhesive formed by putting some layers of the adhesive film on top of each other was cured for 60 minutes at a temperature of 125°C with a pressure of around 2 bar (1 bar=105Pa) as the supplier recommended. Then, the cured adhesive was cut into the tensile and compression test samples shown in Fig.1(a)and(b).Four specimens of each material were tested with a cross-head speed of 2.0 mm/min. The axial extensometer mounted on the test section of the specimen was used to make accurate measurements of the strain in the specimen. The adherend and the adhesive representative engineering stress–strain curves are shown in Fig. 2(a) and in Fig. 2(b), respectively. All the SLJs were manufactured using a specially designed jig in which the specimens were allowed to be manufactured with different adherend thicknesses and different overlap lengths. The surface portion of the adherend to be bonded was cleaned with acetone, and then the adhesive film was applied to the substrate taking care to minimize the amount of air entrapped as a result of application. Before putting the joints in the jig,it was sprayed with release agent, and thin oven paper was placed under specimens to prevent the samples from sticking to the frame.After putting the jig in a digitally controlled oven for the curing process explained above,a weight was placed at the top of it to apply a pressure of around 2 bars to the specimens, according to the supplier recommendation (3 M). A detail about the jig in the heating system is shown in Fig. 3(a). In the meantime, the adhesive layer was adjusted to 0.2 mm thickness using some shims, as shown in Fig. 3(b).
3. Numerical works

Fig. 1 Geometrical details of specimens used.
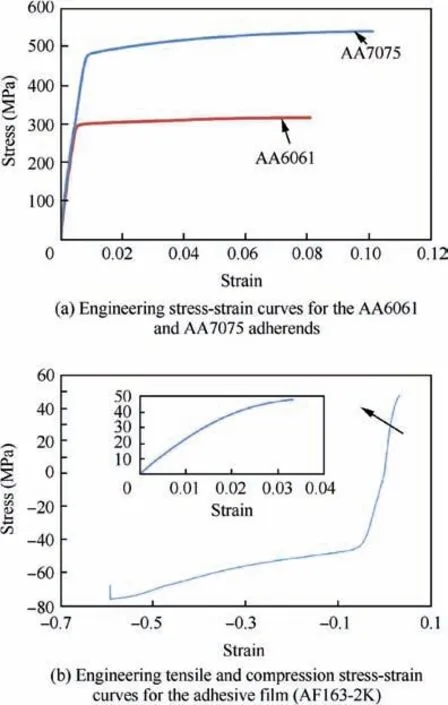
Fig. 2 Engineering stress–strain curves of materials used.
For the prediction of load against crosshead displacements and stress distributions in the SLJ under buckling load (see Fig. 4), a nonlinear Finite Element Method (FEM) was applied via the ABAQUS Explicit package programme. For the nonlinear method, the curves of the adherends and adhesive, shown in Figs. 2(a) and (b), respectively, were used as input data in the numerical analysis, which allows these materials to behave fully in a nonlinear way under the compressive applied load. CPS4R was chosen as an element type for the both, adhesive layer and adherends, by which 4-node bilinear plane stress quadrilateral, reduced integration and hourglass control were achieved.
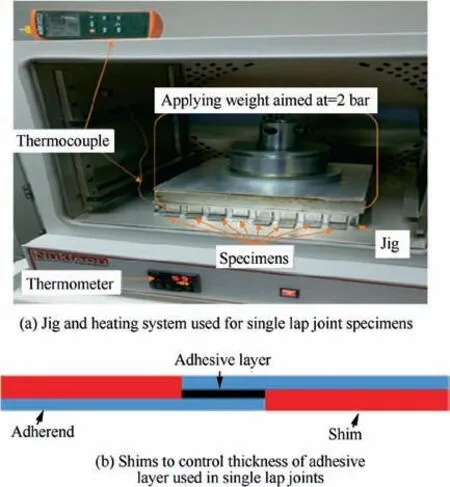
Fig. 3 Manufacturing of specimens.
The number of elements were changed for every thickness of the adherends, and small elements were used for critical regions. A two dimensional model with meshing elements is shown in Fig. 4(b) for the joints with 2 mm adherend thickness, which consists of 2000 and 9403 elements of adhesive layer and adherends,respectively.Because of the same element dimensions, number of elements were increased for the joints with the thicker adherends (4 mm and 6 mm). Boundary conditions for the joints are shown in Fig. 4(c), in which the bottom adherend at the end is clamped, but the top one is only allowed to move in x direction, in the same direction with the applied buckling load, P. The SLJ under buckling mode has been shown to experience multi-axial stress distributions,especially in some part of the top adherends and around the region of the adhesive layer. In this study,the stresses at these regions were indicated by using the von Mises stress-criterion,which allows the multi-axial stresses to be transferred into uniaxial stresses. Accordingly, when the von Mises stresses at the critical zones, such as at the ends of the overlap, reached the ultimate uni-axial stresses of the materials used, shown in Fig. 2(a) and in Fig. 2(b), it was assumed that the failure of the joints took place. Then, the assumed failure stresses were compared with the experimental failure of the joints. The materials, AA6061, AA7075 and AF163-2K (the adhesive)are assumed to fail when their uni-axial stresses reach at values of 316 MPa, 541 MPa and 76 MPa (in compression), respectively. The same is the case for the adhesive with a value of 47 MPa in tensile (see Fig. 2(b)).
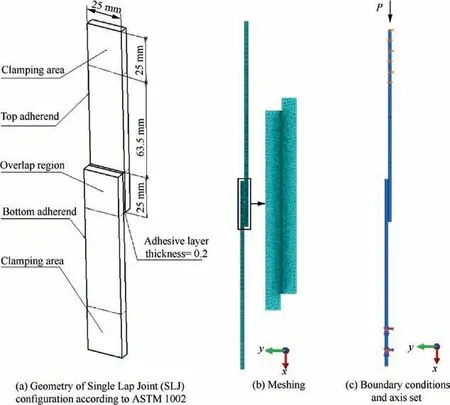
Fig. 4 Details of specimens for numerical modelling.
4. Results
Figs. 5 and 6 show a comparison of experimental and predicted curves of load against crosshead displacements for the joints with 2 mm thickness of 6061 and 7075 adherends,respectively. The maximum experimental load was about 2.3 kN for the former,and 2.8 kN for the latter.From the figures,it is seen that the experimental and the predicted curves are in agreement, in general. After a 5 mm applied crosshead displacements, no visible failure of adhesive layer was predicted for the both joints resulting in huge plastic deformations of the adherends.
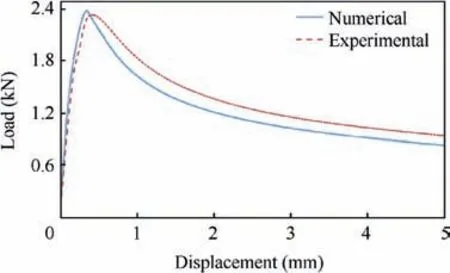
Fig. 5 A comparison of experimental and numerical curves of load verses crosshead displacements for the joints with 2 mm AA6061 adherend thickness.
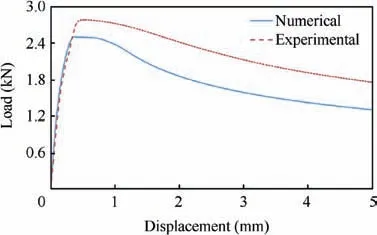
Fig. 6 A comparison of experimental and numerical curves of load verses crosshead displacements for the joints with 2 mm AA7075 adherend thickness.
The von Mises stress maps for the both joint types are predicted in Figs.7 and 8,which show that the top adherends are stressed more compared to the bottom ones. So, the top ones will be under consideration hereafter as these are more critical.The maximum stresses of the AA6061 top adherend at the maximum load are about S=295 MPa, S11=-301 MPa,S22=-21 MPa and S12=25 MPa. Where S, S11, S22and S12denote von Mises stress, stress in x direction, stress in y direction and shear stress, respectively. The maximum von Mises stress value at 5 mm crosshead displacement is about 316 MPa, which corresponds to its maximum tensile stress shown in Fig. 2(a), implying full plastic behaviour of the top adherend. Compared to the stresses at the maximum load,there is a considerable decrease in amount of S22and S12,-13 MPa and -2 MPa, respectively, but an increase in amount of S11,about-323 MPa.The buckled AA6061 adherends experiences high stress concentrations and so plastic deformations at two different points, one at the end of the overlap and the other near the clamping region.It is clear that the joint is not capable of carrying more load, but tends to rotate around the two points, which is supported by the real deformed specimen shown in Fig. 7(b).
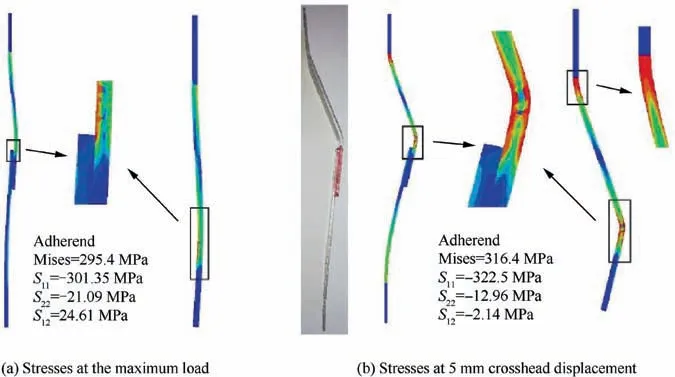
Fig. 7 Predicted joint behaviour, stress map of von Mises and maximum stress values of S (von Mises), S11 (in x direction), S22 (in y direction) and S12 (shear) for the joints with 2 mm AA6061 adherend thickness.
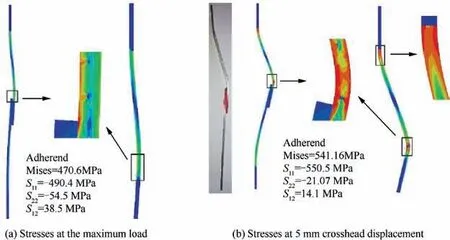
Fig. 8 Predicted joint behaviour, stress map of von Mises and maximum stress values of S (von Mises), S11 (in x direction), S22 (in y direction) and S12 (shear) for the joints with 2 mm AA7075 adherend thickness.
Similar results with relatively higher values have been found for the joint with the 2 mm thickness of the AA7075 adherends with large plastic deformation.While the maximum stresses in the top adherend at the maximum load are about S=471 MPa, S11=-490 MPa, S22=-55 MPa and S12=39 MPa those at the 5 mm crosshead displacement are about 541 MPa, -551 MPa, -21 MPa and 14 MPa, seen in Figs. 8(a) and (b), respectively.
Fig.9 shows stress distributions of the adhesive layer across the interface of the top adherend for the AA6061 joint with 2 mm adherend thickness.It seen that the stress values are high at the ends of the overlap but quite small in the middle. The layer does not seem to experience shear stresses effectively,most likely due to the buckled adherends.The most dominant stress is S22which is in compression at around 25 mm overlap length, where buckling of the top adherend takes place near the bonded region.The maximum value of the von Mises stress is about 45 MPa for the layer which does not fail according to the stress–strain curve presented in Fig. 2(b), but a complete plastic deformation of the adherends take place for this joint,as explained above.
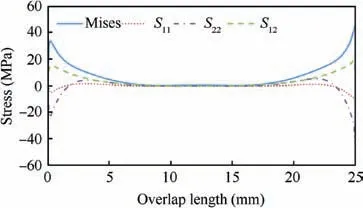
Fig.9 Stress distributions of S(von Mises),S11(in x direction),S22 (in y direction) and S12 (shear) in the adhesive layer at the maximum load for the joints with 2 mm AA6061 adherend thickness.
Stress distributions of the layer across the interface of the top adherend for the AA7075 joint with 2 mm adherend thickness are shown in Fig.10.The distributions are more-less similar to the AA6061 joints shown in Fig. 9. The stress concentrations at the end of the overlap near the buckled top adherend are quite high compared to those at the other end. The maximum stresses at the maximum load are about S=52 MPa, S11=-16 MPa, S22=-56 MPa and S12=23 MPa.This implies that the layer has failed according to the tensile stress curve but not according to the compression one (see Fig. 2(b)). While a clear evidence of buckling was observed in the adherend,any failure of the layer was not witnessed during the experiment, in agreement with the predictions. The main reason for this is because the adhesive with maximum values of about S22=-56 MPa, remains mostly under compression in the critical regions, at the ends of the overlap, and because the adhesive in compression is stronger than in tension (see Fig. 2(b), it did not fail.
The experimental and predicted curves of load against crosshead displacements for the joints with 4 mm thickness of AA6061 and AA7075 adherends are indicated in Fig. 11 and Fig. 12, respectively, which show a considerable increase in the maximum loads compared to those with the 2 mm adherend thickness. It is seen that the experimental and the predicted results are in a good agreement,with values of about 10 kN and 11 kN for the AA6061 joints,and 14 kN and 15 kN for the AA7075 joints, respectively. Increase in the adherends thickness,from 2 mm to 4 mm,seems to contribute to the joint strength remarkably, and in spite of this increase, any failure of adhesive layer did not witness during the test for the both joint types (AA6061 and AA7075). The test caused a large plastic deformation of the adherends,and in general,the behaviour of the adhesive layer and adherends under the applied load was quite similar to that of the joints with 2 mm adherend thicknesses.The stress maps in the AA6061 and AA7075 joints are presented as shown in Figs.13 and 14,respectively.The figures indicate that the top adherends experience a complete plastic deformation especially at the two points mentioned above,and there are great similarities between the real buckled specimens and their predicted behaviours at 5 mm crosshead displacement (see Figs. 13(b) and 14(b)). The maximum stresses at the maximum load are about S=305 MPa,S11=-313 MPa, S22=-25 MPa, and S12=25 MPa for the AA6061 joints, and S=316 MPa, S11=-304 MPa,S22=-20 MPa, and S12=67 MPa for the AA7075 joints. These values at 5 mm crosshead displacement are S=498 MPa, S11=-518 MPa, S22=-70 MPa, and S12=68 MPa for the former and S=541 MPa, S11=-538 MPa,S22=-12 MPa, and S12=58 MPa for the latter.
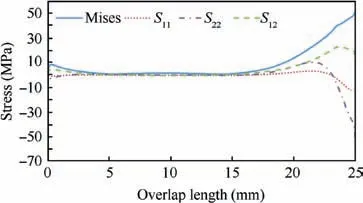
Fig.10 Stress distributions of S(von Mises),S11(in x direction),S22 (in y direction) and S12 (shear) in the adhesive layer at the maximum load for the joints with 2 mm AA7075 adherend thickness.
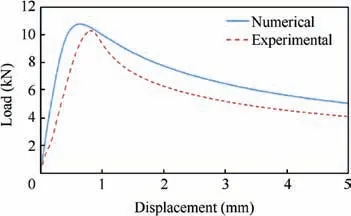
Fig. 11 A comparison of experimental and numerical curves of load verses crosshead displacements for the joints with 4 mm AA6061 adherend thickness.
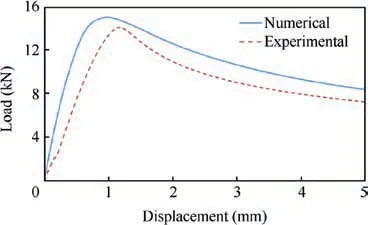
Fig. 12 A comparison of experimental and numerical curves of load verses crosshead displacements for the joints with 4 mm AA7075 adherend thickness.
The stress distributions of the adhesive layer for the joints with the 4 mm AA6061 adherend thickness are indicated in Fig. 15. It is seen that the layer experiences relatively higher shear stress values with relatively more uniform distributions.It is clear that the most effective stress is S22,and it is in compression at the critical regions, the ends of the overlap. The maximum value of the von Mises stress is about 58 MPa and it is well below that of the compression stress shown in Fig. 2(b), which implies no failure of the layer. The maximum values of S11, S22and S12are -22 MPa, -65 MPa and 26 MPa,respectively,and these are relatively higher compared to those with 2 mm adherend thickness.
The distributions for the adhesive layer of the AA7075 joint with 4 mm adherend thickness are shown in Fig. 16, which posses even higher stresses compared to those with 4 mm thickness of AA6061 adherend,shown in Fig.15.It is obvious that the layer is in shear stresses effectively and the stress distributions are reasonably uniform. The maximum values of stresses at the end of the overlap are about S=68 MPa,S11=-19 MPa, S22=-75 MPa and S12=28 MPa. With these values, any failure of the layer is not predicted due to the reasons explained above; the maximum value of S for the layer is below 76 MPa,and S22stresses are in compression at the critical regions.
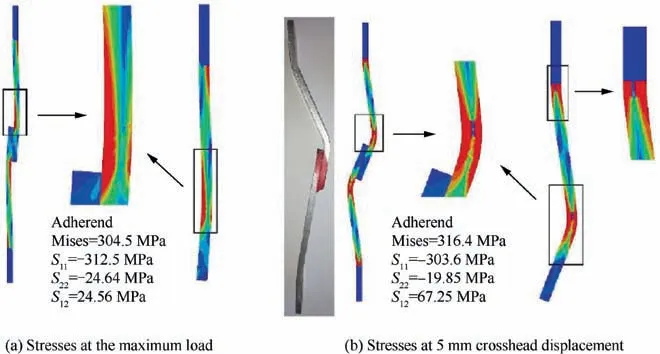
Fig. 13 Predicted joint behaviour, stress map of von Mises and maximum stress values of S (von Mises), S11 (in x direction), S22 (in y direction) and S12 (shear) for joints with 4 mm AA6061 adherend thickness.
From the curves of load against crosshead displacement for the AA6061 and the AA7075 joints with 6 mm adherend thickness, it was found that the joint strength increased further compared to those with the 4 mm adherend thickness is seen in Figs.17 and 18,respectively.The experimental and the predicted maximum loads are about 22 kN and 20 kN for the joints with the AA6061 adherends, and 25 kN and 26 kN for those with the AA7075 ones, respectively. This means the latter has relatively higher strength thanks to its higher adherend mechanical performance(see Fig.2(a)),the case for those with 4 mm adherends,too.While the former experienced large plastic deformation of the adherends, in a similar fashion to those mentioned before, the latter experienced a complete failure in the adhesive layer, cohesive failure. As seen in Fig. 19, the maximum von Mises stress in the top AA6061 adherend under the maximum buckling load is at its utmost level, 316.4 MPa,implying full plastic deformation of the adherend,quite similar to 2 mm and 4 mm adherend thicknesses. Unlike the AA6061 adherends, a local plastic deformation of the 6 mm AA7075 adherend takes place at the maximum load yielding a maximum value of von Mises stress, about S=500 MPa, which occurs only in the small part of the adherend seen in Fig. 20.From the figure it is clear that most of the adherend remains in its elastic limit, which leads to the failure of the adhesive layer as shown in Fig.20.It is worth pointing out that the difference in the experimental and the predicted results seen in Fig.17 and in Fig.18 is likely to due to the unwanted spew fillet of the adhesive happening at the ends of the overlap, and also due to slippage between the specimen surface and the gripping jig of the machine, Besmak BMT-S 100 kN. It was observed that these two phenomenon (the fillet and slippage)were especially effective for the high strength joints, the case for the 6 mm adherends.
The stress distributions of the adhesive layer is presented in Fig. 21 for the AA6061 joint with the 6 mm adherend thickness.The stress values are relatively high,in general,compared to those mentioned before. The layer seems to experience highly uniform shear stress distributions with an average value of 30 MPa.The maximum stress values of S,S11,S22and S12,are about 72 MPa, -16 MPa, -47 MPa and 35 MPa,respectively.
For the same reasons as mentioned above;any failure of the layer is not predicted, which is in agreement with the experimental observations.
The highest level of stress distributions are presented in Fig. 22 for the AA7075 joint with the 6 mm adherend thickness. The layer is stressed mainly in shear mode resulting in fairly uniform stress distributions with an average value of about 40 MPa. The von Mises stress reaches its utmost level,above 76 MPa,at some points near the ends of bonded region,implying failure of the layer,in agreement with the experimental observations, a cohesive failure is shown in Fig. 20,obtained after the test. Due to the S22stresses in compression at the critical regions of the overlap, the shear performance of the layer increased considerably under the buckling condition,compared to the joint subjected to the tensile loading.
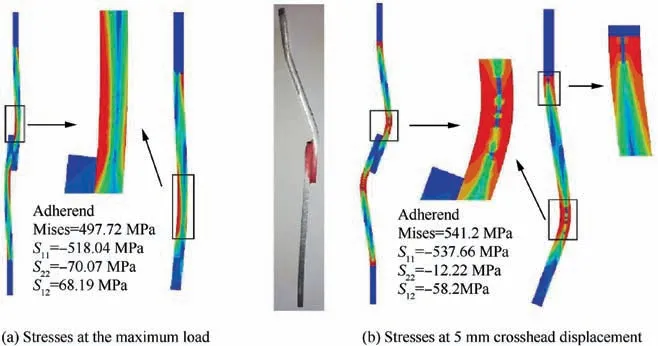
Fig. 14 Predicted joint behaviour, stress map of von Mises and maximum stress values of S (von Mises), S11 (in x direction), S22 (in y direction) and S12 (shear) for joints with 4 mm AA7075 adherend thickness.
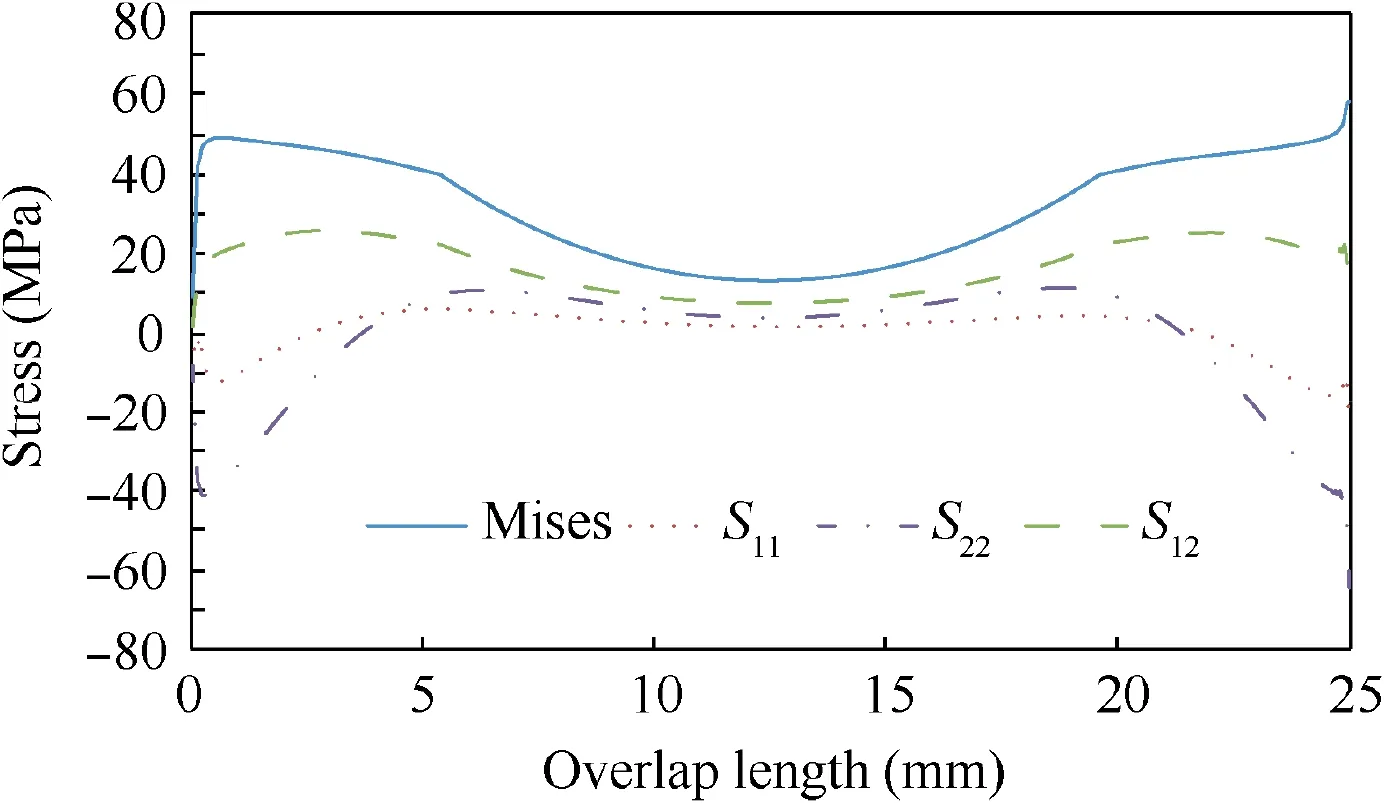
Fig.15 Stress distributions of S(von Mises),S11(in x direction),S22 (in y direction) and S12 (shear) in the adhesive layer at the maximum load for the joints with 4 mm AA6061 adherend thickness.
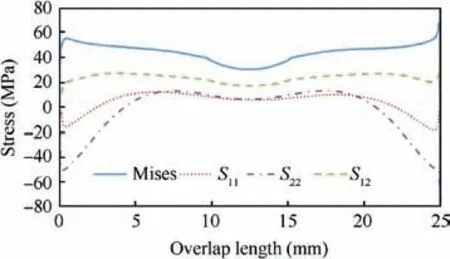
Fig.16 Stress distributions of S(von Mises),S11(in x direction),S22 (in y direction) and S12 (shear) in the adhesive layer at the maximum load for the joints with 4 mm AA7075 adherend thickness.
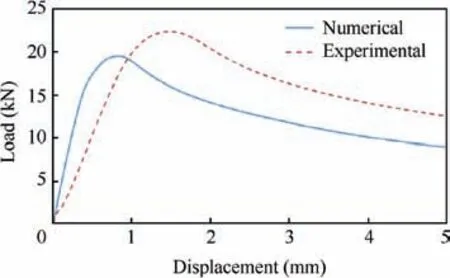
Fig. 17 A comparison of experimental and numerical curves of load verses crosshead displacements for the joints with 6 mm AA6061 adherend thickness.
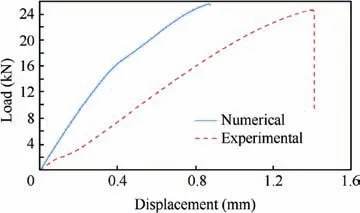
Fig. 18 A comparison of experimental and numerical curves of load verses crosshead displacements for the joints with 6 mm AA7075 adherend thickness.
5. Discussion
The results show the adherend thickness is one of the most important parameters effecting the joint performance; a relatively thick adherend results in a better joint strength. The joints with 2 mm, 4 mm and 6 mm AA6061 adherend thicknesses yielded about 2.3 kN, 10 kN and 22 kN maximum experimental results, and those with the AA7075 adherends gave 2.8 kN, 14 kN and 25 kN, respectively, which were supported by the predicted results. The performance of the joints with the thin (2 mm) adherends is confined by the buckling phenomena which is experienced mostly in relatively thin and long structures.11All the joints behaved nearly the same way,except those with 6 mm AA7075 adherends which mostly remained in their elastic limit under the applied buckling load(see Fig. 20). It was found that the joints with the 6 mm AA7075 adherend thickness resulted in the best performance with an average shear stress of about 40 MPa (obtained by applied load over the bonded region), the highest value compared to those from the others.The effect of mechanical properties of the two different adherends,AA6061 and AA7075,on the joint performance is undeniable; it was observed that the latter with its higher maximum stress value (see Fig. 2(a))was able to produce stronger joints,in general.Similar findings have been claimed by some other researchers for the SLJ under tensile loading, pointing out adherend plasticity is one of the important parameters affecting the joint performance.12,13
Mechanical behaviour of the adhesive used as a bonded layer is another parameter to be taken into account in designing the joints.When an adhesively-bonded SLJ is designed,the adhesive tensile stress–strain curve is usually used as the input data for prediction of the stresses.14,15However,in the current study this curve does not seem to suffice for correct simulation of the joint under buckling mode in which the adhesive layer is also expected to experience shear behaviour in the overlap region. This can clearly be seen, for instance, from the maximum applied load, seen in Fig. 10(a), which produces von Mises stress value at which the adhesive layer is expected to fail according to the tensile curve (see Fig. 2(b)). In this case, the predicted maximum loads would be underestimated compared to the experimental ones. On the other hand, when the compression stress–strain curve was chosen as the input data, the predicted results yielded correctly, in agreement with experimental ones; while the joint with the 6 mm AA7075 adherend thickness failed in the adhesive layer,all the others experienced large plastic deformation of adherends, and no failure of the adhesive layer was predicted according to the von Mises stress-criterion. A representative S22stress distribution can be seen in Fig.23 for the joints in tensile and also in compression modes,which indicates the stress distributions at the ends of the bonded region are in peel effect for the tensile loading but in compression for the buckling mode. It is well known that these effects producing stress concentrations are the main causes of the adhesive failure,1–3and these can be related to the behaviour of stress–strain curve represented in Fig.2(b)showing the adhesive in compression is stronger than in tensile.For better understanding, a depicted behaviour of the adhesive layer in the bonded region for compression and tensile cases are shown in Fig. 24(a) and (b), respectively.
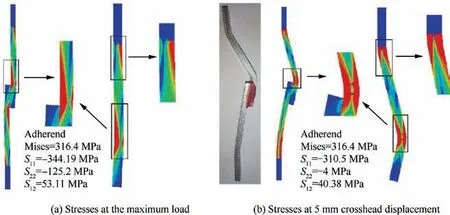
Fig. 19 Predicted joint behaviour, stress map of von Mises and maximum stress values of S (von Mises), S11 (in x direction), S22 (in y direction) and S12 (shear) for the joints with 6 mm AA6061 adherend thickness.
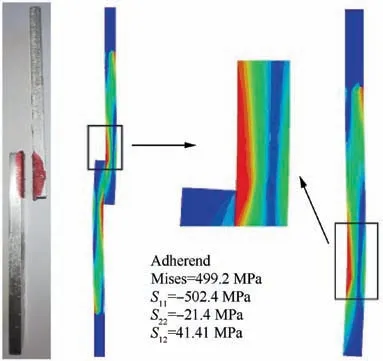
Fig. 20 Predicted joint behaviour, stress map of von Mises and maximum stress values of S (von Mises), S11 (in x direction), S22(in y direction) and S12 (shear) for joints with 6 mm AA7075 adherend thickness at the maximum load.
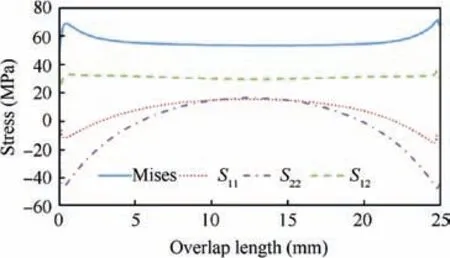
Fig.21 Stress distributions of S(von Mises),S11(in x direction),S22 (in y direction) and S12 (shear) in the adhesive layer at the maximum load for the joints with 6 mm AA6061 adherend thickness.
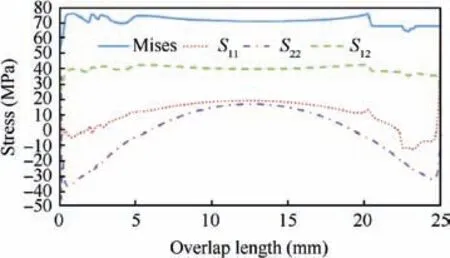
Fig.22 Stress distributions of S(von Mises),S11(in x direction),S22 (in y direction) and S12 (shear) in adhesive layer at the maximum load for joints with 6 mm AA7075 adherend thickness.
If the experimental results from the current study are compared with the ones carried out previously for the joints tested in tensile mode,16it will be seen the joint behaviours and also joint failure mechanisms are affected by the loading mode significantly; while the joints with thin adherends under tensile loading produces higher strength compared to those under compressive loading, the opposite is the case for those with the thick adherends (6 mm). Without exception all the joints under the tensile mode failed in adhesive layer,but those under the buckling mode experienced huge plastic deformation without any failure of the layer, except those with 6 mm 7075 adherends, which produced the highest shear performance,even higher than those under tensile loading.16As explained above, this can be attributed to the stress distributions in the joint behaviour depicted in Fig. 24, because the joint with the thick adherend mostly remained in its elastic region.There has been some attempts by some researchers to increase performance of the SLJ in tensile mode, and this has been achieved by altering shape of the bonded region in which some part of the adhesive layer is subjected to the compression S22stresses.17,18
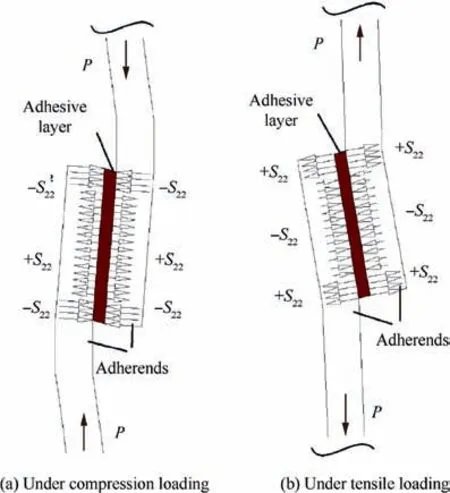
Fig. 24 A depicted adhesive layer in the joints (-S22: compression stress, +S22: peel stress).
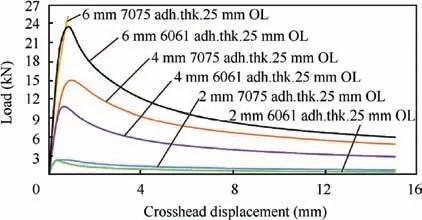
Fig. 25 Typical curves of loads verses crosshead displacements for the all joints with different adherend thickness (adh.thk.) and 25 mm overlap length (OL).
It is also worth noting that the joints under the buckling loading yielded more crosshead displacements compared to those under the tensile mode,meaning more energy absorption capability preferred for impacted sutiations.19This can be seen in Fig. 25, which represents typical load against the crosshead displacements of the AA6061 and AA7075 joints with 2 mm,4 mm and 6 mm adherend thicknesses. It is seen that all the joints experiencing complete plastic deformations of adherends were subjected to the crosshead displacements upto 15 mm,and then the test was halted since any change in the joints was not expected. This means more crosshead displacements of the joints would produce more energy absorption. Using the load–displacement curves shown in Fig. 25, the energy absorption of the joints, obtained under area of the curves,is remarkably higher compared to those under tensile loading.For example, while the energy absorptions of the joints with the 4 mm AA6061 and AA7075 adherend thicknesses,and also with the 6 mm AA6061 thickness were more than 77 Joule,114 Joule and 183 Joule, respectively, these values were about 22 Joule, 21 Joule 14 Joule for those under the tensile loading.16This refers to new possibilities of crashworthiness designs of the bonded joints under buckling conditions for the future.
6. Conclusions
It was found that the adhesively-bonded Single Lap Joint under buckling (compressive) mode behaved differently from that under the tensile mode. Since the joints are prone to the buckling problem, relatively thick adherends seemed to increase the joint strength remarkably. The 6 mm AA7075 adherends produced the best joint performance with reasonable shear stress distributions, even better than that under the tensile loading. This was because the adhesive layer at edges of the bonded region remained in compression S22stresses which contributed to the joint strength. An important parameter affecting the joint strength was plasticity of the adherends, especially the case for the thin ones limiting the shear performance of the adhesive dramatically, and with this respect, the adherend with the higher mechanical properties(AA7075) produced higher joint strength. For correct prediction of the joint strength, the compression stress–strain curve was used in the numerical analysis as the input data since the critical parts of the adhesive layer were mainly subjected to the compression stresses, which was opposite to the joints under tensile loading.The results presented in the current work suggest that the adhesively bonded structures under the buckling conditions could be more useful for crashworthiness satiations since they are able to absorb more energy.More studies are being carried out on this subject.
Declaration of Competing Interest
The authors declare that they have no known competing financial interests or personal relationships that could have appeared to influence the work reported in this paper.
 CHINESE JOURNAL OF AERONAUTICS2021年2期
- CHINESE JOURNAL OF AERONAUTICS的其它文章
- Recent active thermal management technologies for the development of energy-optimized aerospace vehicles in China
- Electrochemical machining of complex components of aero-engines: Developments, trends, and technological advances
- Recent progress of residual stress measurement methods: A review
- Micromanufacturing technologies of compact heat exchangers for hypersonic precooled airbreathing propulsion: A review
- Towards intelligent design optimization: Progress and challenge of design optimization theories and technologies for plastic forming
- A combined technique of Kalman filter, artificial neural network and fuzzy logic for gas turbines and signal fault isolation
