Near real-time modeling of global ionospheric vertical total electron content using hourly IGS data
Zhipeng WANG, Kiyu XUE, Cheng WANG,,*, To ZHANG, Lei FAN,Ziye HU, Chung SHI,, Guifei JING
a School of Electronic Information Engineering, Beihang University, Beijing 100083, China
b Research Institute for Frontier Science, Beihang University, Beijing 100083, China
KEYWORDS GNSS;Ionosphere;Modeling;Near real-time;Total electron content
Abstract The International GNSS Service (IGS) has been providing reliable Global Ionospheric Maps (GIMs) since 1998. The Ionosphere Associate Analysis Centers (IAACs) model the global ionospheric Total Electron Content(TEC)and generate the daily GIM products within the context of the IGS.However,the rapid and final daily GIM products have a latency of at least one day and one week or so,respectively.This limits the value of GIM products in real-time GNSS applications.We propose and develop an approach for near real-time modeling of global ionospheric TEC by using the hourly IGS data.We perform an experiment in a real operating environment to generate near real-time GIM(named BUHG)products for more than two years.Final daily GIM products,Precise Point Positioning (PPP)based VTEC resources, and JASON-3 Vertical TEC (VTEC)measurements are collected for testing the performance of BUHG. The results show that the performance of BUHG is very close to that of the daily GIM products. Also, there is good agreement between BUHG and PPP-derived VTEC as well as with JASON-3 VTEC.It is possible that BUHG would be further improved with an increase in available hourly GNSS data.
1. Introduction
The ionosphere is one of the most important parts of the Earth’s upper atmosphere.1Several kinds of equipment, such as an ionosonde, a sounding rocket, and radar, are installed all over the world for ionospheric sounding and obtaining characteristic parameters, such as electron density, electron temperature, and Total Electron Content (TEC).2–8For several decades, the Global Navigation Satellite System (GNSS)dual-frequency measurements have been used to retrieve ionospheric TEC.9–12Establishing ground-based GNSS station networks creates an opportunity for modeling the ionospheric Vertical TEC (VTEC) with high accuracy, as well as temporal and spatial resolution not only regionally but also globally.10,13–18In 1998, the Ionosphere Working Group (IWG)was established within the context of the International GNSS Service(IGS).The group consists of seven Ionosphere Associate Analysis Centers (IAACs). The centers provide independent daily Global Ionospheric Maps (GIMs) in the Ionosphere Map Exchange(IONEX)format by using different methods and strategies. IGS provides the final global ionospheric products by combining the IAACs’ GIMs. Since 1998, the final IGS GIMs have become a reliable source of ionospheric information.19,20
However,the rapid and final GIM products have a latency of at least one day and one week or so,respectively. Thus,the time delay limits applications of the daily GIM products,which cannot be used for real-time GNSS applications.Although the IGS Real-Time Service (RTS) has provided real-time precise orbit and clock corrections since 2013, as yet there are no real-time GIM products provided.21In recent years, several centers of IWG have been studying Real-Time Global Ionospheric Modeling (RTGIM). Also, some centers of IGS have been providing preliminary real-time service for global ionospheric total electron content modeling.22In addition,regional ionospheric modeling could provide service for real-time singlefrequency precise point positioning.23However, the real-time GIM products are still actually in the test stage, possibly due to lack of stability and therefore are not suitable for real-time applications. There might be several reasons for this issue.One important reason is the insufficient number of IGS stations that support a real-time data stream for global ionospheric modeling. In addition, network interruption or data loss in real-time data stream transmission will also affect the stability and accuracy of real-time GIM products. Fortunately, IGS provides hourly GNSS data with a latency of nearly 30 minutes for more than 150 stations all over the world.When compared to a real-time data stream, one hour of steady GNSS data would be beneficial for actual data processing,such as data preprocessing, carrier-to-code leveling for a long arc, and quality control. Therefore, it is possible to model the global ionospheric VTEC in near real-time using the hourly IGS data.
In this study, we focus on the models and algorithms of near real-time global ionospheric modeling that provide stable hourly GIM products (named BUHG). We present details of the functional models and strategies for BUHG with hourly IGS data.To validate the BUHG,we compare the hourly estimated GIM products with daily GIM products, with VTEC measurements obtained by JASON-3, and with VTEC values derived from Precise Point Positioning (PPP) obtained from raw observations.21,24,25We also compare the daily GIM products with JASON-3 VTEC data as well as PPP-derived VTEC values as a reference in the investigation. Finally, we present the summary and conclusions in the last section.
2. Methodology
2.1. Basic methodology of global ionospheric modeling
Since 1998, IAACs have been providing independent daily rapid and final GIM products using different methods, algorithms, and strategies. The Center for Orbit Determination in Europe(CODE)uses a Spherical Harmonic(SH)expansion to represent the global ionospheric VTEC maps.26The Jet Propulsion Laboratory (JPL) interpolates the VTEC maps with triangular tiles and introduces climatological models as simulated data to generate GIMs without gaps.27The Technical University of Catalonia(Universitat Polite`cnica de Catalunya in Spanish, UPC) implements a two-layer tomographic model for estimating VTEC and uses a Kriging interpolation to improve GIMs.28,29Other centers basically take SH expansion as the main algorithm to represent global ionospheric VTEC maps.18,30,31In this study,the SH expansion is also used for near real-time global ionospheric modeling. The basic equations for GNSS measurements and ionosphere modeling are given by
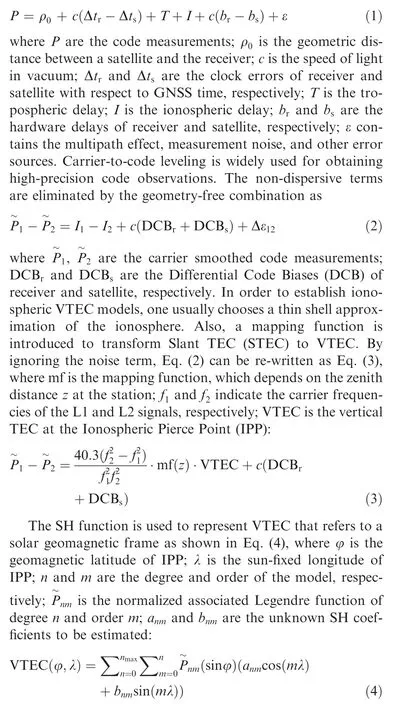
In this study, hourly GPS measurements of approximately 160 IGS stations are used for near real-time modeling.A minimum elevation cutoff of 20°is configured to avoid particularly noisy measurements. The model is based on a solargeomagnetic reference frame with spherical harmonic expansions up to a degree and order of 15.18,26,32The unknown SH coefficients are considered to vary linearly with time,which means that the parameters are linearly interpolated between consecutive nominal epochs. Two groups of SH parameters,one at the beginning and one at the end of the hour, are estimated by the least square method. Additionally, the DCB of satellites and receivers can be estimated along with SH parameters. A datum is also introduced as a zero-mean condition imposed on all observed satellites so that the DCB parameters of satellites and receivers can be separated. If there are 32 observed GPS satellites and 160 available stations, there will be a total number of 704 parameters (2×256+32+160)to be estimated.
2.2. Near real-time modeling using priori information
IGS provides daily GNSS measurements from several hundreds of stations all over the globe. These IGS stations could produce more than three million IPP observations on a daily basis.By considering post-processing global ionospheric modeling, the model could achieve high precision due to the plethora of GNSS measurements. However, there are insufficient data for near real-time modeling on an hourly basis. In this case,we can obtain hourly GNSS data from approximately 200 stations per hour on average. However, there are only around 160 stations available for modeling due to the latency and deficiency of the hourly GNSS data.Fig.1 shows the geographical distribution of available IGS stations (unit: degree).Fig. 2 presents the number of available IGS stations, which provide the hourly GNSS measurements during the year 2018.Basically,there are more than 170 available IGS stations,with fewer than 150 stations providing only a few hours. If there are an average number of eight GPS satellites observed by stations at every epoch, the total number of observations would be 153, 600 during a one-hour period. Although the number of observations is much larger than that of unknown parameters, the model still might not be precise enough due to the lack of data during the period following the current hour.
Fortunately, we have the daily estimated parameters and the corresponding covariance matrix as the priori information,which can be introduced into near real-time models.The Least Square Estimation(LSE)with priori information is given by33
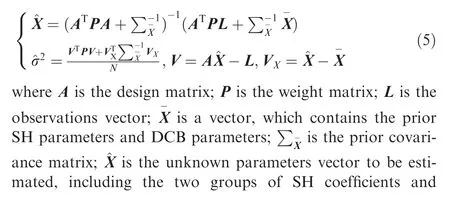
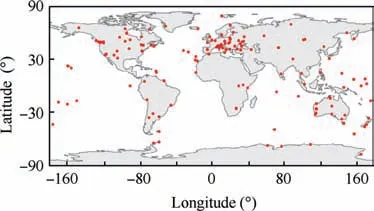
Fig. 1 Geographical distribution of available IGS stations,which provide hourly GNSS observations.
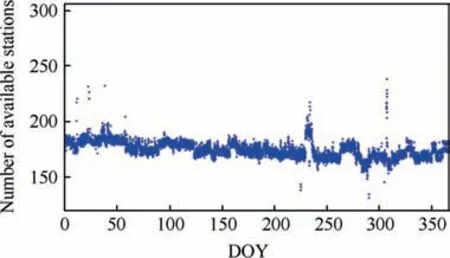
Fig. 2 Number of available IGS stations, which provide hourly GNSS observations during 2018.

In practical near real-time modeling,the priori information(including SH coefficients, DCBs of satellites and receivers,and covariance matrix) can be ascertained from the modeling for the previous day or the previous hour. To initialize near real-time models, we need to introduce the priori information from the post-daily model on the previous day. Then, the following hourly model could import the priori information from the model for the previous hour.Once the GPS measurements are available for near real-time modeling,the unknown parameters vector ^X could be updated by LSE with the priori information. Fig. 3 shows the flow processing for near real-time modeling of global ionospheric VTEC using hourly IGS data.According to this approach, near real-time hourly GIM products can be generated.
2.3. Near real-time GIMs and reference data
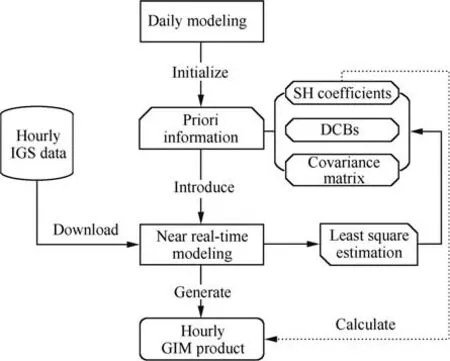
Fig. 3 Flowchart for near real-time modeling of global ionospheric VTEC using hourly IGS data.
Based on the presented algorithms and approach, we performed an experiment to investigate the performance of near real-time GIM products in a real operating environment lasting more than two years. The hourly GIM products (named BUHG) are available via FTP (ftp://pub.ionosphere.cn/hourly/). The latency of the products is around 50 minutes.That means that a near real-time GIM product at 12:00 UTC would be available at 12:50 UTC.Due to the unstable network speed and uneven quality of hourly IGS data, the near realtime GIM products might have lower performance than the daily GIM products with post-processing. In this study, we collect our daily GIM products (named BUAG, postprocessing) to validate near real-time GIM products BUHG during 2018.Other daily GIM products(named CODG)from CODE are also collected as independent reference data. In addition, PPP-derived VTEC values (hereafter called PTEC)from about 300 IGS stations are calculated for comparison.34The stations will be eliminated in comparison in order to ensure objectivity and accuracy of the evaluation results,which have low signal-noise rate observations or have large residual errors in PPP solutions. Also, PTEC is the slant TEC with elimination of the DCBs of satellites and receivers which are obtained from the final GIMs BUAG.Moreover,VTEC measurements obtained by JASON-3 (hereafter called JTEC) are prepared as an external resource to investigate the performance of both near real-time GIMs and final daily GIMs over the oceans.
The comparison of the near real-time GIM products with other VTEC resources is performed in terms of the average(bias) and Root Mean Square (RMS) of the differences, as shown in Eqs.(6)and(7),where N is the total number of grid points; VTEChand VTECoare the near real-time GIM products BUHG and the other VTEC resources (BUAG, CODG,PTEC, and JTEC), respectively.

3. Results and analysis
3.1. Comparison with daily GIMs
The performance of near real-time GIM products BUHG is evaluated by comparing with daily GIM products BUAG and CODG. Several types of comparison outcomes are investigated:the average(bias)and RMS on a daily basis,an hourly basis, a latitudinal basis, and a grid-point basis. The differences between BUHG and BUAG as well as CODG are shown in Figs. 4–7.
In Fig. 4, the red and blue points show the daily bias and RMS of differences in BUHG, respectively, compared with BUAG and CODG. As seen from the bias values presented in Fig. 4, the annual means of the daily bias values are very close to zero TECU. In addition, the narrower distribution range of bias values is basically within±1 TECU.It indicates that near real-time GIM products BUHG have no apparent systematic bias compared to daily GIM products BUAG and CODG.However,BUHG generally underestimate VTEC values on a global scale when compared to BUAG,in contrast to overestimating VTEC values when compared to CODG.Additionally, RMS values shown in Fig. 4 indicate that there is good agreement between BUHG and BUAG as well as CODG,especially during northern summer.The annual means of RMS values are marginally larger than 2 TECU. Also, the consistency between BUHG and CODG is slightly better than that between BUHG and BUAG.Furthermore,there are some obviously unusual biases(larger than 1 TECU)and RMS values (larger than 3 TECU) for two time periods (from 283 to 290 and from 308 to 311). Fig. 8 presents SunSpot Numbers(SSN), solar radio flux at 10.7 cm (F10.7), Kp indices, and Dst indices with different color lines from the Day of Year(DOY) 280 to 315 in 2018. There are no sunspots except for only a few days during this period. Also, the solar radio flux at 10.7 cm is only about 70 SFU. However, Kp indices reach five on DOY 280, 283, 286, and 308, and even rise to six on DOY 309. In addition, Dst indices are less than -50 nT on DOY 280 and 309. Thus, an increasing level of geomagnetic activity might affect the modeling of global ionospheric VTEC values.
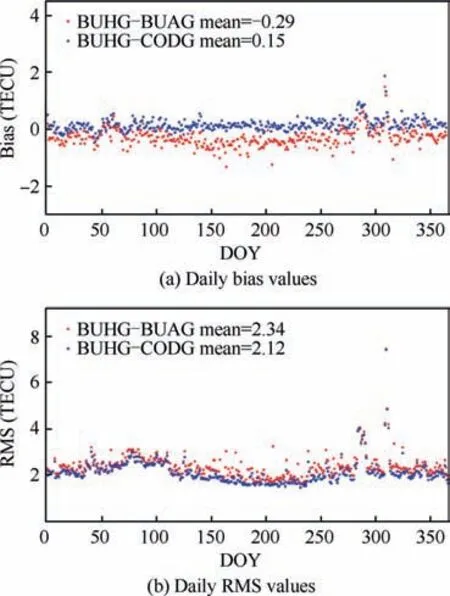
Fig.4 Differences between near real-time GIM products BUHG and daily GIM products (BUAG and CODG) with post-processing in 2018.
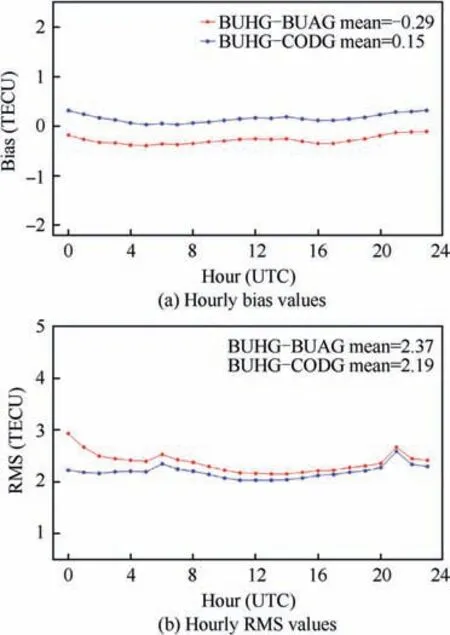
Fig.5 Differences between near real-time GIM products BUHG and daily GIM products (BUAG and CODG) with post-processing in 2018.
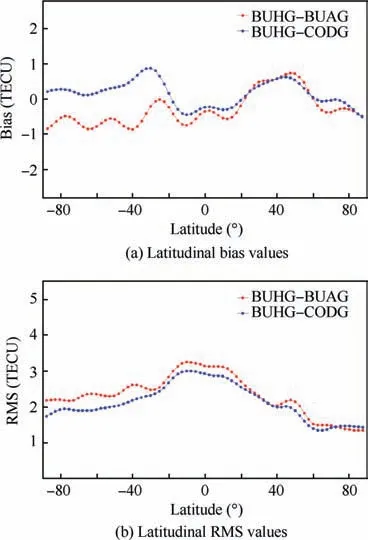
Fig.6 Differences between near real-time GIM products BUHG and daily GIM products (BUAG and CODG) with post-processing in 2018.
Fig.5 presents the hourly bias and RMS values of the differences between BUHG and daily GIM products (BUAG and CODG), respectively. Considering the bias depicted in Fig. 5,we note that two groups of bias values are relatively stable during a 24-h period. A narrow distribution range of hourly bias values is basically within ±0.3 TECU. On an hourly basis,BUHG generally underestimates VTEC values with respect to BUAG.However,BUHG slightly overestimates VTEC values when compared to CODG.In addition,the stable hourly RMS values indicate that there is good agreement between BUHG and CODG most of the time, except at 21 UTC. Meanwhile,there is a slightly large discrepancy between BUHG and BUAG during the first few hours with the RMS values up to nearly 3 TECU.However,despite that,BUHG and BUAG show excellent agreement most of the rest of the time.
Additionally, Fig. 6 presents the differences in latitudes between BUHG and BUAG and CODG. The fluctuant bias values in Fig. 6 indicate that the differences between BUHG and daily GIMs are quite different in different latitudes.BHUG generally overestimates VTEC values in middle latitudes of the Northern Hemisphere. Except for these latitudes,BUHG basically underestimates VTEC values with respect to BUAG. However, BUHG underestimates VTEC values in a few low latitudes and high latitudes of the Northern Hemisphere when compared to CODG. This is in contrast to overestimating VTEC values in middle and high latitudes of the Southern Hemisphere. Furthermore, two groups of RMS values have a similar trend from the southern latitudes to the northern latitudes. Most RMS values of differences between BUHG and CODG are smaller than those of differences between BUHG and BUAG, especially in southern latitudes.Also, there is better agreement between BUHG and daily GIMs in mid- high latitudes of the Northern Hemisphere.Moreover, the discrepancy between BUHG and daily GIMs is apparently larger in the Equatorial Ionization Anomaly(EIA)region,with the RMS values of approximately 3 TECU.
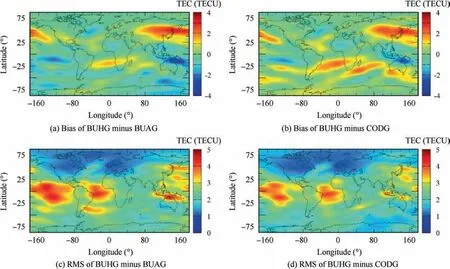
Fig.7 Differences between near real-time GIM products BUHG and daily GIM products(BUAG and CODG)with post-processing in 2018.
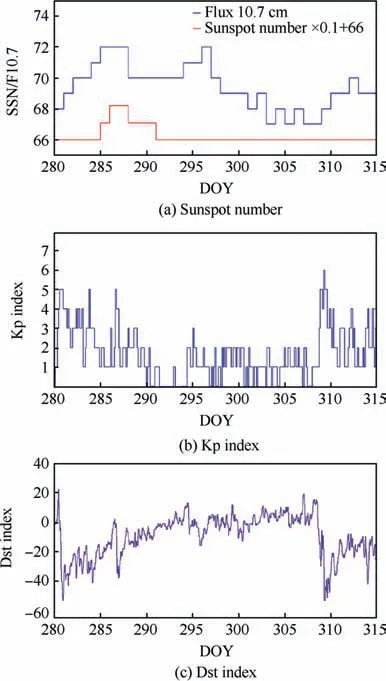
Fig. 8 Sunspot number, solar radio flux at 10.7 cm, Kp indices,and Dst indices from DOY 280 to 315 in 2018.
The performance of hourly GIMs BUHG is also investigated at the level of a geographic grid point. Fig. 7 presents the maps showing the grid-point bias and RMS of differences between BUHG and daily GIMs(BUAG and CODG)in 2018.In this figure, the units of both bias and RMS values are TECU. As the bias values presented in Fig. 7 illustrate, it is obvious that BUHG overestimates VTEC values over eastern Asia and underestimates those over northern Australia and a few parts in the middle of the Pacific. Also, with respect to CODG, BUHG overestimates VTEC values in southern latitudes, especially over southern Atlantic Ocean and southern Indian Ocean. The RMS values in Fig. 7 show that there is a good agreement between BUHG and daily GIMs (both BUAG and CODG)in middle and high latitudes of the Northern Hemisphere. However, there also is an obvious discrepancy between BUHG and daily GIMs over the middle of the Pacific Ocean and Atlantic Ocean. Also, it is apparent that the differences between BUHG and BUAG are much larger than those between BUHG and CODG over the oceans. This might be due to the limited measurements from the inadequate number of GNSS stations installed over oceans.
3.2. Comparison with PPP-derived VTEC values
The PPP technique is another independent approach to retrieve high-precision TEC based on undifferenced and uncombined GNSS observations. PPP-derived VTEC values(PTEC)are suitable for the evaluation of GIMs.In this study,the performance of near real-time GIM products BUHG is investigated by using PTEC in terms of daily, hourly, and latitudinal bias and RMS values. Daily GIM products CODG and BUAG are also included as a reference for comparative analysis. Figs. 9–11 show the differences in BUAG, CODG,and BUHG, respectively, when compared with PTEC.
The daily bias values that compare BUAG and PTEC are stable, as shown in Fig. 9. The daily bias values between BUHG and PTEC have a relatively obvious fluctuation with the seasons. All GIMs including BUHG, BUAG, and CODG slightly underestimate VTEC values in 2018, when compared to PTEC. Additionally, the daily RMS values presented in Fig.9 indicate that there is a good agreement between the final daily GIMs (both BUAG and CODG) and PTEC, with an annual mean of RMS values of approximately 2 TECU.Meanwhile, note that the discrepancy between BUHG and PTEC is apparently larger almost every day in 2018.Nevertheless, most of the RMS values of differences between BUHG and PTEC are less than 3 TECU, except for a few days. The RMS values on these days (DOY 280, 283, 286, 308, and 309) are significantly larger due to the increasing level of geomagnetic activity mentioned earlier.
The hourly bias and RMS values of the differences between products (BUHG, BUAG, and CODG) and PTEC are presented in Fig. 10. The hourly bias values show that the differences between daily GIM products (BUAG and CODG) and PTEC are very stable during a 24-h period. The fluctuant hourly bias values between BUHG and PTEC indicate that the hourly GIMs product BUHG is not as stable as the daily GIM products BUAG and CODG. However, nearly all bias values are generally in the range of-1 TECU to-0.5 TECU.It means that all GIM products underestimate VTEC values on an hourly basis, when compared with PTEC.Additionally,the hourly RMS values of approximately 2 TECU indicate that daily GIMs product(BUAG and CODG)agree well with PTEC at every hour during a 24-h period. The consistency between BUHG and PTEC is relatively not that good, with the RMS values in the range of 2.5 TECU to 3 TECU.
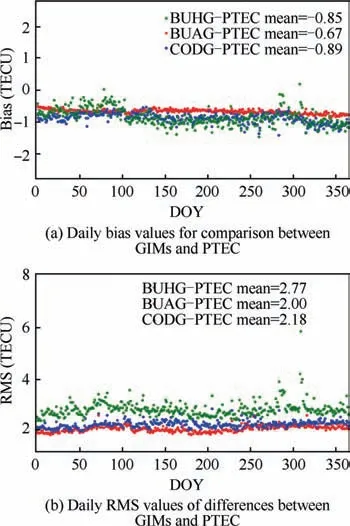
Fig. 9 Daily differences between GIM products (BUHG,BUAG, and CODG) and PPP-derived VTEC values in 2018.
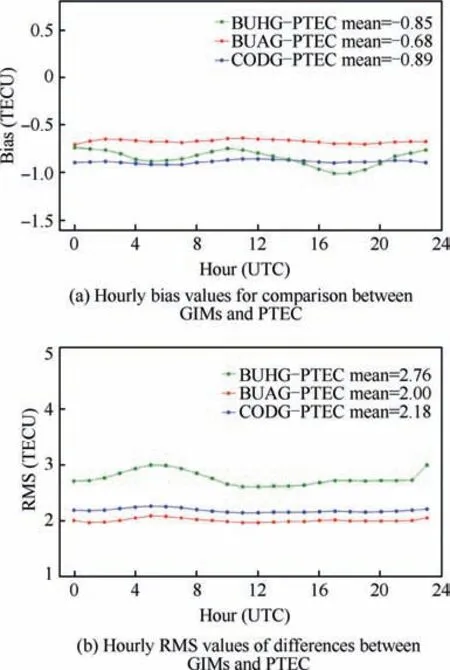
Fig.10 Hourly differences GIM products(BUHG,BUAG,and CODG) and PPP-derived VTEC values in 2018.
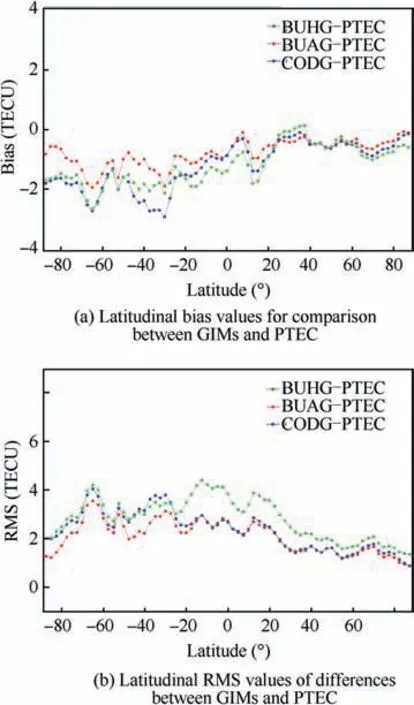
Fig. 11 Latitudinal differences GIM products (BUHG, BUAG,and CODG) and PPP-derived VTEC values in 2018.
Fig.11 presents the latitudinal bias and RMS of differences between GIM products and PTEC. Overall, GIM products underestimate VTEC values in nearly all latitudes when compared with PTEC. The fluctuant bias values indicate that the differences between GIM products and PTEC are smaller in middle and high latitudes of the Northern Hemisphere than those in the Southern Hemisphere. Among the three kinds of GIM products, there are minimal differences between BUAG and PTEC, especially in middle and high latitudes of the Southern Hemisphere. In northern middle latitudes, BUHG has nearly the same bias as BUAG and CODG, compared with PTEC.Additionally,the RMS values in Fig.11 show that there is nearly the same good agreement between daily GIM products (BUAG and CODG) and PTEC in low latitudes and middle and high latitudes of the Northern Hemisphere.BUAG have the best agreement with PTEC in the southern latitudes. When compared to daily GIM products, BUHG shows a larger discrepancy with PTEC, especially in low latitudes. However, there is still a relatively good agreement between BUHG and PTEC in middle and high latitudes of the Northern Hemisphere.
3.3. Comparison with JASON-3 VTEC data
As an external independent dataset mentioned in Section 2.3,JASON-3 VTEC is used to validate the performance of the near real-time GIMs over oceans. The comparison between daily GIMs (BUAG and CODG) and JTEC is also investigated to provide a reference. Figs. 12–14 show the differences in BUAG, CODG, and BUHG, respectively, when compared with JTEC.
As shown in Fig. 12, almost all the daily bias values are positive, which indicates that both hourly GIMs and daily GIMs mainly overestimate the VTEC values over oceans.Basically, when compared with JTEC, the daily differences in BUHG and CODG are similar. The differences between BUAG and JTEC are still relatively large in northern summer.The daily RMS values presented in Fig.12 show that there is a good agreement between GIMs and JTEC. CODG has the best agreement with JTEC, closely followed by BUAG, with the annual mean RMS value of approximately 3 TECU.Except for several days when the geomagnetic activity increases, BUHG basically has a similarly good agreement with JTEC, especially during northern summer.
Fig.13 presents the hourly bias and RMS values of the differences between GIMs(BUHG,BUAG,and CODG)and JTEC.The hourly bias values indicate that the differences between GIMs and JTEC are relatively stable on hourly basis.The hourly differences between CODG and JTEC are apparently smaller than those between BUAG and JTEC but have a similar trend.And the differences between BUHG and JTEC fall in between,with a slight fluctuation. Additionally, the hourly RMS values show that both BUAG and CODG agree with JTEC during a 24-h period. The hourly RMS values of differences between BUHG and JTEC are slightly larger than those between daily GIMs(BUAG and CODG)and JTEC.This indicates that there is not much of a discrepancy between BUHG and JTEC.
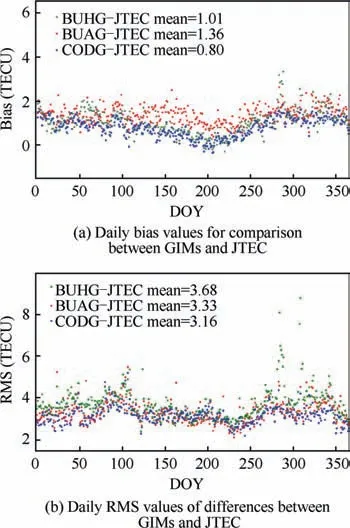
Fig. 12 Daily differences between GIM products (BUHG,BUAG, and CODG) and JASON-3 VTEC values in 2018.
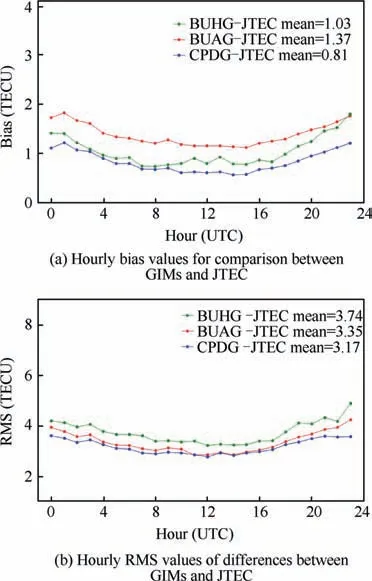
Fig. 13 Hourly differences between GIM products (BUHG,BUAG, and CODG) and JASON-3 VTEC values in 2018.
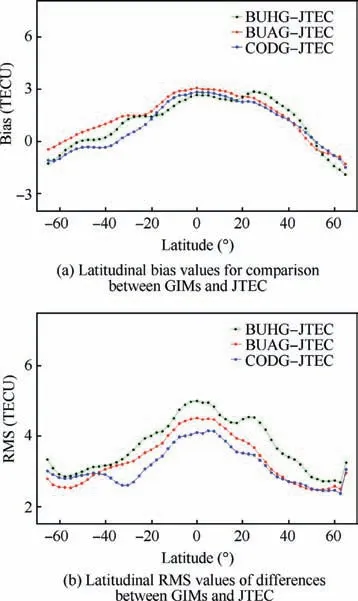
Fig.14 Latitudinal differences between GIM products(BUHG,BUAG, and CODG) and JASON-3 VTEC values in 2018.
As shown in Fig. 14, the bias values in low latitudes are obviously larger than those in middle and high latitudes.Both hourly GIMs and daily GIMs are larger than JASON-3 VTEC values, except in mid-high and high latitudes of the Northern Hemisphere and high latitudes of the Southern Hemisphere.The differences between GIMs and JTEC are small in northern latitudes, in contrast to significant differences in middle and high latitudes of the Southern Hemisphere. Moreover, RMS values show a similar trend, as presented in Fig. 14. When compared to JTEC, the daily GIMs (BUAG and CODG)show better consistency than the near real-time GIMs BUHG,and this behavior is more obvious in the low and middle latitudes of the Northern Hemisphere. Among the three kinds of GIMs, CODG agrees the best with JTEC, especially in lowmid latitudes. Overall, the discrepancy between GIMs and JTEC in low latitudes is apparently larger than that in midhigh latitudes.
Furthermore,the differences between GIMs and PTEC are basically smaller than those between GIMs and JTEC.One of the potential reasons for this might be the VTEC values derived by GNSS measurements that include the plasmaspheric electron content, which covers heights up to the GNSS satellites orbit at an altitude of approximately 20,000 km.This is in contrast to JASON VTEC,which covers heights from the bottom of ionosphere up to the JASON satellite orbit at an altitude of 1300 km. Another reason is that PTEC values are generally derived by the GNSS stations installed on land,and JTEC values are over oceans. At the same time, GIMs have lower accuracy over the oceans due to the limited GNSS measurements over the oceans,as well as in southern latitudes.
4. Conclusions
Near real-time modeling of global ionospheric VTEC is proposed and then performed by using hourly IGS data to provide stable hourly GIM products, which might be useful for future real-time applications. The fundamental methodology of near real-time modeling is proposed in Section 2.1. It is generally based on the spherical harmonics function. Since there are insufficient GNSS measurements, an initialization is performed using the priori information(including SH coefficients,DCBs of satellites and receivers,and covariance matrix),which can be provided by a daily model for the previous day. Then,the following hourly model would introduce the priori information from the model for the previous hour.
The near real-time GIM products BUHG have been generated since 2018 in a real operating environment.The final daily GIM products(including our daily GIM products BUAG and CODG from CODE)are collected for investigating the performance of BUHG. Also, other VTEC resources are introduced for comparison, which are derived from approximately 300 IGS stations based on the PPP technique. Additionally, independent VTEC measurements from JASON-3 are used to evaluate the performance of BUHG over the oceans. The comparative results indicate that there is a good agreement between BUHG and BUAG as well as CODG,with an annual mean of RMS values of 2 TECU.At the same time,most RMS values of the differences between BUHG and PPP-derived VTEC are less than 3 TECU.Also,there is not much of a discrepancy between BUHG and JASON-3 VTEC,with the mean RMS values of less than 4 TECU.Overall,the performance of near real-time GIM products BUHG is very close to that of the daily GIM products. Thus, the near real-time GIM products with low latency would have potential value in real-time applications. It is possible that the near real-time GIM products would be further improved with more available stations.However, it is still a great challenge to promote the performance of both near real-time GIMs and final daily GIMs during geomagnetic storms.
5. Data availability statement
A plot of the most recent hourly global TEC map can be accessed from the web link (http://ionosphere.cn/figure/gim_hourly.png). The hourly GIMs products BUHG are publicly available via FTP(ftp://pub.ionosphere.cn/hourly/). The daily GIMs products BUAG are also openly accessible through FTP(ftp://pub.ionosphere.cn/product/). The IGS CODG products were retrieved from the FTP (ftp://cddis.gsfc.nasa.gov/pub/gps/products/ionex/). The JASON TEC data from NASA/CNES were retrieved from the FTP (ftp://ftp.nodc.noaa.gov/pub/data.nodc/jason3/).
Declaration of Competing Interest
The authors declared that they have no conflicts of interest to this work. We declare that we do not have any commercial or associative interest that represents a conflict of interest in connection with the work submitted.
Acknowledgements
The authors would like to thank IGS for openly providing hourly GNSS observations,final precise orbits and clock messages, and NASA/CNES for JASON data that is helpful for evaluation of GIMs. We particularly thank Bundesamt fu¨r Kartographie und Geoda¨sie (BKG, Germany) for providing real-time GNSS broadcast ephemeris that made this work possible. This study has been funded by the National Natural Science Foundation of China (Nos. 41804026, 41804024 and 41931075).
 CHINESE JOURNAL OF AERONAUTICS2021年2期
- CHINESE JOURNAL OF AERONAUTICS的其它文章
- Recent active thermal management technologies for the development of energy-optimized aerospace vehicles in China
- Electrochemical machining of complex components of aero-engines: Developments, trends, and technological advances
- Recent progress of residual stress measurement methods: A review
- Micromanufacturing technologies of compact heat exchangers for hypersonic precooled airbreathing propulsion: A review
- Towards intelligent design optimization: Progress and challenge of design optimization theories and technologies for plastic forming
- A combined technique of Kalman filter, artificial neural network and fuzzy logic for gas turbines and signal fault isolation
