Numerical research on airfoil transition delay by alternative current dielectric barrier discharge actuation
Bei LIU, Hu LIANG,*, Zhonghu HAN, Yinghong LI, Fei LIU,Jingo CHI, Zhiwen DING
a Science and Technology on Plasma Dynamics Laboratory, Air Force Engineering University, Xian 710038, China
b Institute of Aerodynamic and Multidisciplinary Design Optimization, National Key Laboratory of Science and Technology on Aerodynamic Design and Research, School of Aeronautics, Northwestern Polytechnical University, Xi’an 710072, China
KEYWORDS Dielectric Barrier Discharge(DBD);Efficiency analysis;Linear stability analysis;Plasma flow control;Plasma transition delay
Abstract A Dielectric Barrier Discharge (DBD) plasma actuator can create a body force which locally accelerates the base flow leading to an attenuation of broadband disturbance to delay the transition. In this study, numerical simulation on an NLF0416 airfoil is conducted to investigate transition delay and drag reduction by a DBD plasma actuator. To simulate plasma’s effect more accurately,boundary-layer data is acquired from Reynolds Averaged Navier Stocks(RANS)equations instead of laminar boundary layer equations, although RANS equations need a much finer boundary-layer grid,and the linear stability analysis method is used to analyze the boundary layer and get the transition point.In this study,the influences of different actuation intensities and positions are investigated, and results show that if the actuation intensity is stronger and the actuation position is closer to the base transition point, more drag reduction can be obtained. However, the efficiency of plasma transition delay is really low.For example,when the actuation voltage is 16 kV,the actuation frequency is 1 kHz, and the main Mach number is 0.1, the saved power due to drag reduction is about 5.09 W, but the power consumed is about 32.61 W, and the efficiency is just 15.6%.
1. Introduction
Viscous drag is known to be the largest component of drag on ground and air vehicles. For a commercial air vehicle, the viscous drag may comprise upwards of 50% of the total drag.1On a heavy truck,the viscous drag represents 7% of the overall drag on the truck and 26% of the drag on any attached trailers.2For a high-speed rail, the viscous drag may be up to 70% of the total drag.3There is no doubt that huge economic and environmental benefits will be obtained if the viscous drags of these vehicles can be reduced.
Generally speaking, there are two ways to reduce the viscous drag. One is to reduce the wetted area of an aircraft,for example, blended wing body,4an advanced aircraft design technology. The other one is to delay the transition and enlarge the laminar flow area.5,6As everyone knows, the viscosity coefficient of laminar flow is much smaller than that of turbulent flow, so if the laminar flow area can be enlarged,the drag will be reduced. Some passive means involving distributed roughness elements and generation of streaky structures for beneficial modal interaction7and active flow control methods such as boundary-layer blowing and suction8and DBD9–11have been proven feasible to delay the transition and enlarge the laminar flow area.In this study,an active flow control strategy of affecting the Tollmien-Schlichting (TS)wave-dominated boundary-layer transition by means of DBD actuators is investigated.
DBD actuators offer a promising actuation concept for the control of unsteady flow instabilities.They consist of two electrodes separated by a dielectric layer.By applying an AC highvoltage signal between the two electrodes,a locally strong electric field develops,which in turn ionizes the surrounding air in the vicinity of the actuator. Through collisional processes, the ionized air (plasma) transfers a momentum to the flow, which can be used for control.12In addition to mechanical simplicity and robustness, a major advantage is their extremely fast response time. Typical response times of these actuators can reach up to several milliseconds due to the lack of mechanical parts.
DBD actuators have been proven effective in many aspects of flow control.13Extensive studies have been conducted in the aspect of plasma transition delay. Generally speaking, active wave cancellation and base flow modification are commonly considered to be two different kinds of mechanism for DBD plasma delaying transition.14–16When a DBD plasma actuator operates in a continuous mode, a quasi-steady momentum is added to the flow, directly acting on the mean velocity profile of the boundary layer, in such a way that the amplification of the disturbances is impeded and the transition can be delayed.For example, a DBD actuator was operated at a frequency of about 20 times higher than the unstable TS wave frequency,so that its effect on the flow could be described as a time-invariant body force distribution.17When a DBD plasma actuator operates in a non-continuous mode,an unsteady actuation created by the actuator is added to the base flow directly on the instabilities growth of TS waves, which leads to a low-disturbance level airflow.18In this study, the body force is considered to be quasi-steady, so transition delay is because of base flow modification. Recently, extensive studies on using high-order dynamic mode decomposition to analyze the stability of a boundary layer have been conducted,19,20but rarely on plasma transition control. Therefore, the method of linear stability analysis is selected in this study, although it is based on the hypothesis of a linear and parallel boundary layer.Many studies have used linear stability analysis to analyze the stability of a boundary layer modified by plasma actuation,17,21,22and it has been proven feasible in the study of plasma transition delay.
The fundamental purpose of delaying transition is to reduce the drag and improve the cruise efficiency,so if the energy consumed is more than obtained, then it will be of no practical use. Therefore, the efficiency analysis of control is really important and necessary. However, many studies on plasma delaying transition were conducted on a flat plate, while few studies were conducted on an airfoil, because they focused on the mechanism of transition delay rather than the efficiency of control. Therefore, in order to study the control effect of plasma transition delay on an airfoil and analyze the efficiency,numerical research on an NLF0416 airfoil is conducted by DBD plasma with different actuation intensities and positions in two conditions,in one of which the Mach number is 0.1 and the chord Reynolds number is 4×10⁶while in the other one the Mach number is 0.05 and the chord Reynolds number is also 4×10⁶.
2. Numerical method
2.1. Flow solver
PMNS2D, developed by the Institute of Aerodynamic and Multidisciplinary Design Optimization at Northwestern Polytechnical University, is used as the two-dimensional structural NS equations solver in this study. It’s actually a nondimensional solver, as the following standard:

The steps of flow simulation including transition prediction based on linear stability analysis are as follows:
Step 1.Conduct fixed transition simulation using PMNS2D until it is convergent,and the fixed transition point must be at the rear of the airfoil to ensure a big enough laminar area,because linear stability analysis is based on laminar boundary layer data.
Step 2. Extract boundary layer data from the Step 1, conduct linear stability analysis, and get the accurate transition point.
Step 3. Set the point obtained from the Step 2 as the new fixed transition point, and conduct fixed transition simulation again until it is convergent.
2.2. Validation of PMNS2D solver
The accuracy of linear stability analysis depends on the boundary layer data which is extracted from NS equations,so it’s very important and necessary to validate the boundary layer data. At first, three different sizes of grids are selected to verify the normal grid. All grids are C-grids as shown in Fig. 1. The far field is all 100 chord, the circumferential grid quantity of the airfoil is all 412, and the first layer grid thickness is all 10–6chord to ensure y plus less than 1. Variable U represents dimensionless velocity based on the main flow velocity and variable Y represents dimensionless boundary layer thickness.
The base flow has basically no difference in Fig. 2, and when the normal grid quantity is 256, the result seems like more accurate than that when the normal grid quantity is 216.
Then,three different sizes of grids are selected to verify the circumferential grid. All other parameters are the same as before except the quantity of the circumferential grid.
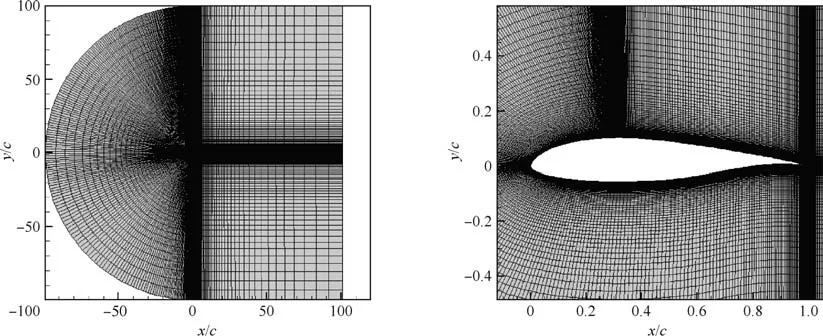
Fig. 1 Calculation grid of an NLF0416 airfoil.
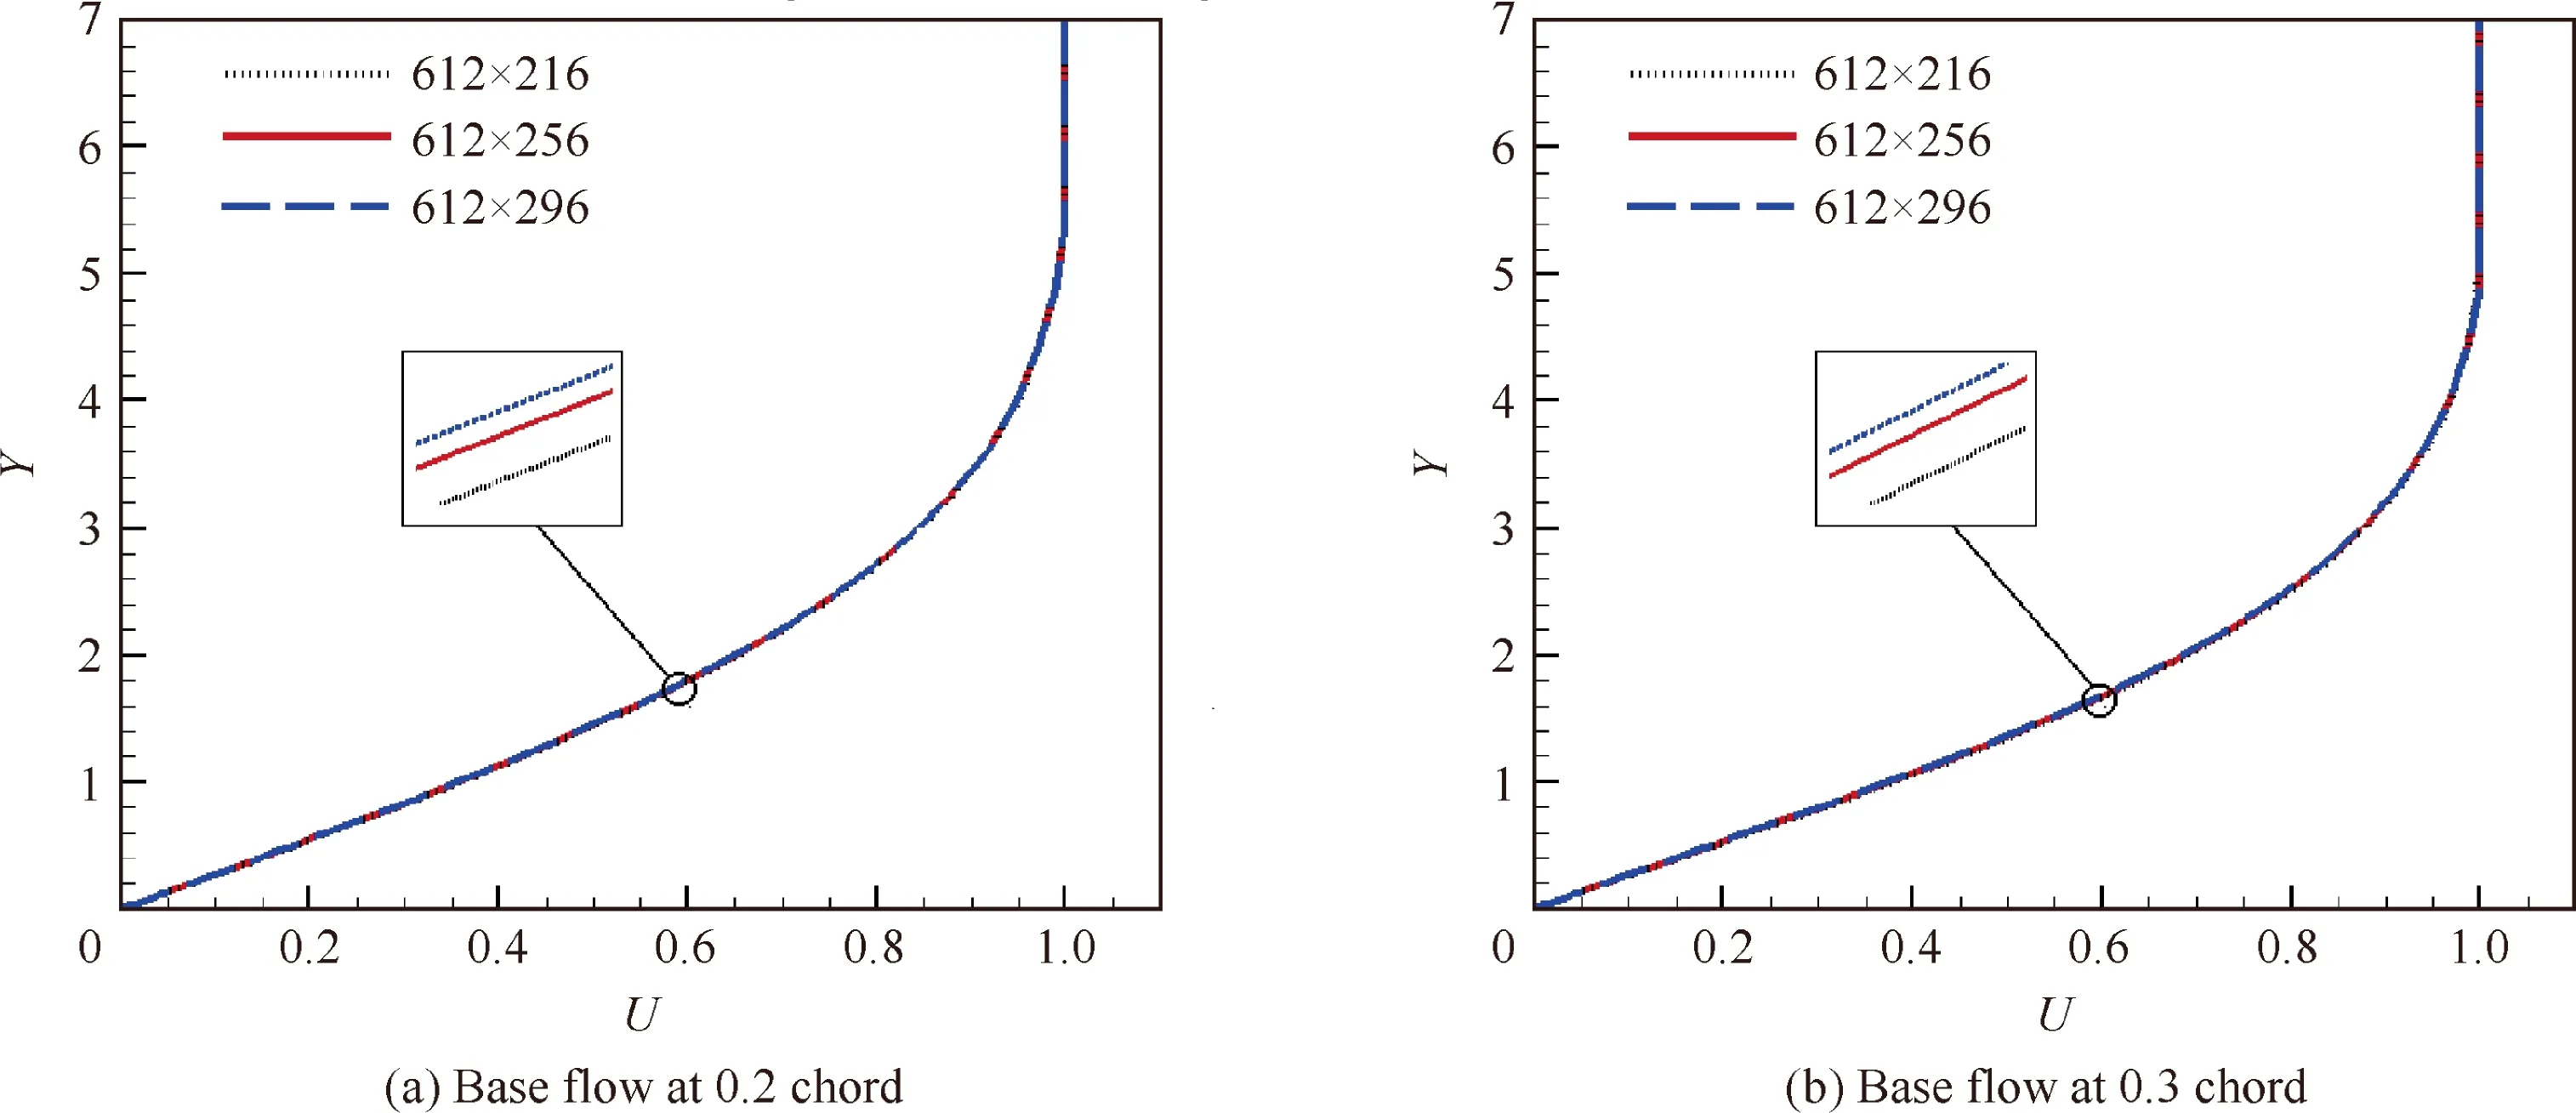
Fig. 2 Comparison of base flows on the upper surface with different normal grids.

Fig. 3 Comparison of base flows on the upper surface with different circumferential grids.
The base flow has also little difference in Fig. 3. Through the above study, the quantity of the normal grid is confirmed as 256, and the quantity of the circumferential grid is confirmed as 612.
At last,the boundary layer data from NS equations is compared with that from laminar boundary layer equations. The code used to solve laminar boundary layer equations is from Cabeci.23The total quantity of the grid is 612×256.

Fig. 4 Comparison of base flows on the upper surface using different equations.
There is a little difference between the results from NS equations and laminar boundary layer equations in Fig. 4.It’s because laminar boundary layer equations suppose that the pressure gradient along the normal direction equals zero,but NS equations do not. So to some extent, the boundary layer data from NS equations is more accurate.
For further testing, the free-transition experiment of an NLF0416 airfoil which was conducted in the NASA Langley laboratory’s low-turbulence wind tunnel is chosen as the Ref.24. In that experiment, the Mach number was 0.1, and the Reynolds number was 4×10⁶,so in our simulation,the calculation condition is set the same as that used in that experiment.Details are as follows in Table 1.

Table 1 Calculation condition.
The total quantity of the grid is 612×256.Because this grid aims to calculate plasma delaying transition,the grid is refined where a plasma actuator is as shown in Fig.1.The grid scale is 10–4chord in the refinement zone, which is actually 0.19 mm,and it is dense enough to simulate plasma’s effect. For the upper surface of the airfoil, the initial fixed transition point is set at 0.6 chord, while for the lower surface of the airfoil,the initial fixed transition point is set at 0.7 chord. Therefore,there is a big enough laminar area to conduct linear stability analysis.
From Fig. 5, it’s obvious that both transition prediction simulation and full turbulence simulation can calculate the lift coefficient well,but the latter fails to catch the drag coefficient and the former can also calculate the drag coefficient well as the lift coefficient is relatively small. Because the laminar viscous drag is much smaller than the turbulent viscous drag, if you don’t consider transition, the results especially the drag coefficient will have a big difference. In addition, the lift of laminar flow is a little bigger than that of turbulent flow, so the lift coefficient of transition prediction simulation is a little bigger than that of full turbulence simulation.
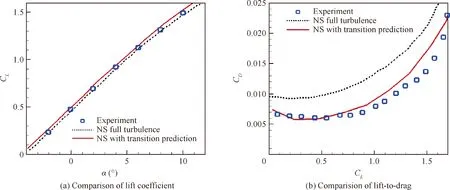
Fig. 5 Comparison between full turbulence simulation, transition prediction simulation and experiment.

Fig. 6 N factor evolution for discrete disturbance frequencies (f) with a transition threshold of NT =6 without DBD actuation when angle of attack is 0°.

Table 2 Transition point comparison between experiment and calculation.

Table 3 Parameters of plasma discharge.
Fig. 6 shows the disturbance growths on the upper and lower surfaces when the angle of attack α=0°, and the transition points of the upper and lower surfaces are at 0.356 chord and 0.54 chord, respectively. From Table 2, we can see that they are just between the laminar point and the turbulent point which were measured in the experiment, so the result of transition prediction is reliable.However,when the angle of attack becomes a little large, the linear stability analysis theory is often unable to predict transition accurately. Because the linear stability analysis theory assumes that the boundary layer is linear and parallel, it is no longer suitable when the angle of attack is large. In this research, the plasma delaying transition study has only been conducted at 0°, so linear stability analysis is reliable.
3. Plasma model
The body force induced by plasma actuation is considered to be steady, so the space distribution of the time-averaged force is the only thing that needs to focus on. Generally speaking,there are two ways to obtain the space distribution of the time-averaged body force. One is through a Particle Image Velocimetry(PIV)experiment,25but the boundary layer is very thin, so if the resolution of the PIV equipment is not high enough, it couldn’t get accurate boundary layer data. The other one is through numerical calculation, for example,Suzen’s method,26in which a two-equation model including a charge equation and a potential equation is solved.However,the two-equation model doesn’t consider the effect of the actuation frequency which has been proven able to influence the magnitude of the body force. Considering all the factors, an existing model which has been proposed by Soloviev and Krivtsov27is adopted in this study to obtain the space distribution of the time-averaged body force. This model has been made many comparisons with experiments and is demonstrated as follows:

Table 4 Results of plasma discharge with different voltages.
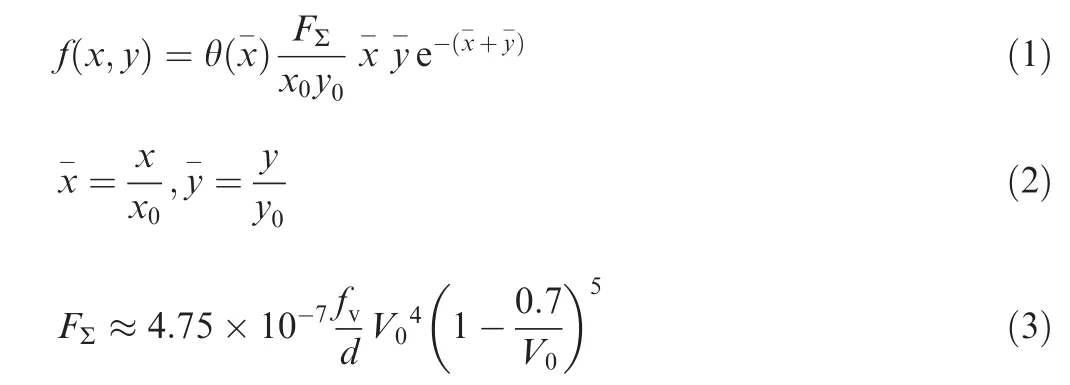
where x0,y0is the x and y coordinates of the force maximum point, θ(x-) is the Heaviside function, and FΣis the total force per unit electrode length (N/m) and can be estimated through Eq. (3) in which fvis the voltage frequency (kHz), V0is the voltage amplitude(kV),and d is the dielectric thickness (mm).
According to a reference article,28both coordinates of the body force maximum x0,y0are assumed to be proportional to the applied voltage amplitude V0, in which

Fig.7 Pressure coefficient and base flow at 0.3 chord and flow patterns with and without control when plasma actuation is imposed at 0.3 chord and main flow Ma=0.1.

Fig.8 N factor evolution for discrete disturbance frequencies with a transition threshold of NT =6 when DBD actuation is imposed at 0.1 chord and main flow Ma=0.1.

where upis the maximum plasma-induced velocity under a quiescent condition, and u∞is the flow velocity at the far field,namely 0.1 Mach number.
Parameters of the plasma discharge are displayed in Table 3.
Results of the plasma discharge are displayed in Table 4.
Because the PMNS2D solver is non-dimensional, the body force term must be non-dimensional the same as the standard,given by:

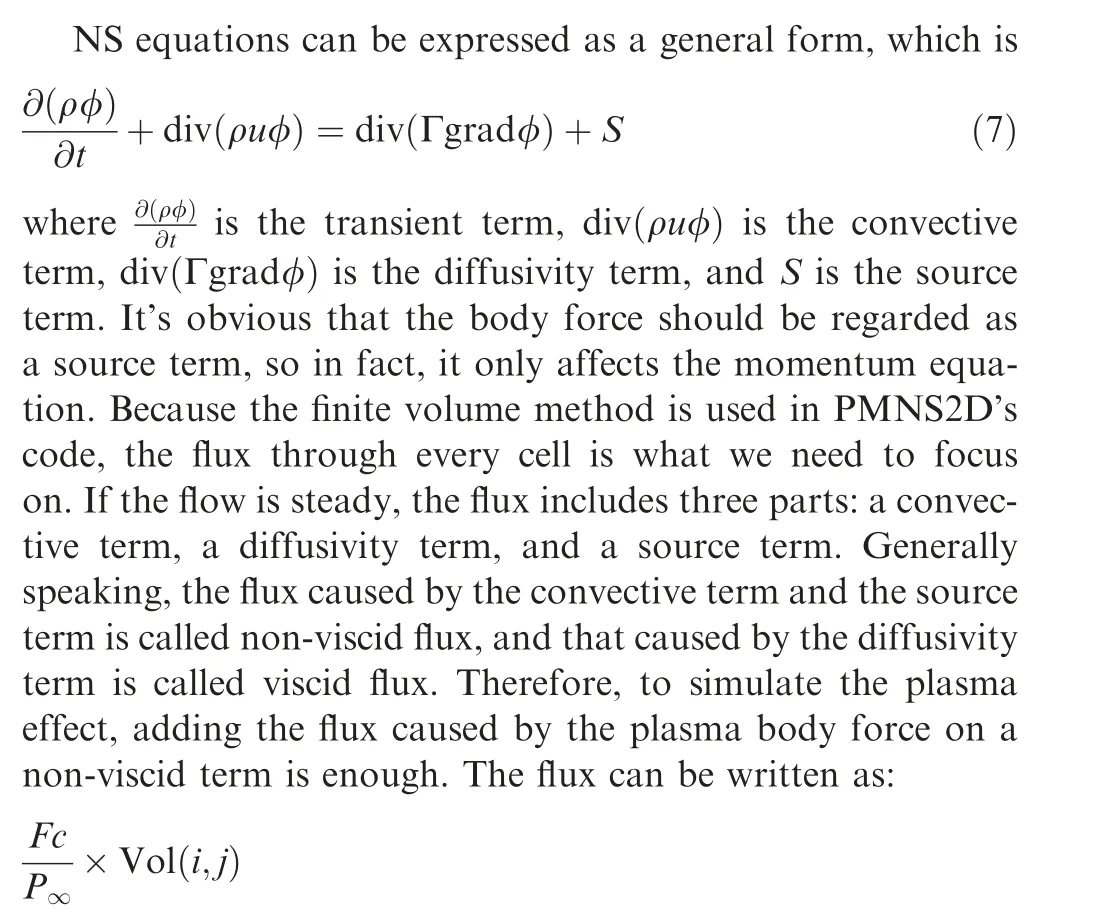
For two-dimension simulation,Vol(i,j)represents the nondimensional area of the cell whose label is (i,j).
When plasma actuation is imposed at 0.3 chord, the pressure coefficient and base flow at 0.3 chord and flow patterns with and without control are given as follows. Variable P in Fig. 7(c) and (d) represents dimensionless pressure based on P∞. Variable Vein Fig. 7(e) and (f) represents dimensionless velocity based on V∞.
From Fig. 7(a), the pressure coefficients obtained from experiment and calculation match well, and the dash line goes down abruptly at 0.3 chord. It suggests that the local static pressure rises up where plasma actuation is imposed so that a favorable pressure gradient is produced. From the comparison between the flow patterns of pressure with and without control in Fig.7(c)and(d),it’s clearer that the local static pressure rises up with plasma actuation. From Fig. 7(b), the base flow is accelerated and becomes more stable, and we can see the contrast of the outer boundary velocity distribution from the flow patterns of velocity in Fig. 7(e) and (f). Thus, a summary of the reason why transition can be delayed could be made here: plasma actuation produces a favorable pressure gradient leading to the boundary layer accelerating to become more stable.Actually,the influence of plasma is not significant based on the base flow comparison at 0.3 chord when the main flow Ma=0.1.The main reason is that the maximum plasmainduced velocity is too low in contrast to that of the main flow.Therefore, the condition in which the main flow Ma=0.05 is also studied afterwards,and it can be found that the base flow is changed much more.
4. Results
Because plasma actuation is imposed on the upper surface, in the following part,we only focus on the transition of the upper surface, and the results of the lower surface are not given.When the angle of attack of the NLF0416 airfoil is 0°, the Mach number is 0.1, and the Reynolds number is 4×10⁶,the transition point on the upper surface is at 0.356 chord from the calculation result in Fig.6(a).Meanwhile,it’s obvious that the point behind which the disturbance begins to grow is at 0.12 chord,so three different actuation positions are identified,which are 0.1 chord, 0.2 chord, and 0.3 chord, respectively.The point at 0.1 chord is in the front of the disturbance growth point(0.12 chord).This condition is expected to study whether plasma actuation could affect the zarf curve.The points at 0.2 chord and 0.3 chord are between the disturbance growth point and the transition point.These two conditions are expected to study whether plasma actuation could reduce the disturbance growth.Besides,three different actuation intensities which correspond to the results of plasma discharge in Table 4 are considered to study the effect of actuation intensity on the transition. Because different grids may cause some effects on calculation results,three grids corresponding to three different actuation position are adopted, and they are refined at 0.1 chord, 0.2 chord, and 0.3 chord, respectively. Results are as follows.
When the plasma actuation point is at 0.1 chord in Fig. 8,there is no big difference when the actuation intensity varies.Because disturbance is considered to be zero before the zarf line in the linear stability analysis theory, it can’t catch the effect of plasma actuation unless the actuation intensity is strong enough to influence the base flow inside the zarf line.In another word, before the zarf line, the flow itself is very stable, and if plasma actuation is imposed here, the flow couldn’t be much more stable.

Fig.9 N factor evolution for discrete disturbance frequencies with a transition threshold of NT =6 when DBD actuation is imposed at 0.2 chord and the main flow Ma=0.1.

Fig.10 N factor evolution for discrete disturbance frequencies with a transition threshold of NT =6 when DBD actuation is imposed at 0.3 chord and the main flow Ma=0.1.

Table 5 Summary of results when main flow Ma=0.1.
When the plasma actuation point is 0.2 chord in Fig.9,the intensity of disturbance is relatively small,and when the intensity of actuation is high enough(γ=0.12),the disturbances are completely eliminated, and the disturbance growth point becomes 0.22 chord from 0.12 chord. However, the transition point doesn’t change much because the disturbances grow very fast. On one hand, although plasma actuation can accelerate the boundary layer flow and improve the stability of the boundary layer, itself is a kind of disturbance which could increase the instability downstream. On the other hand, we can see that the adverse pressure becomes very high after the position at 0.2 chord from Fig. 7(a) so there is no doubt that the disturbance will grow very fast. It concludes that it’s almost useless to impose actuation at a position where the flow is in a favorable pressure gradient or the adverse pressure gradient is small.
When the plasma actuation point is at 0.3 chord in Fig.10,plasma actuation can reduce the amplitude of disturbances,and the higher the intensity of actuation is, the better the delaying effect is.When γ=0.12,the transition point has been delayed about 0.016 chord, i.e., it’s actually 30.4 mm. Unlike the condition in which plasma actuation is impose at 0.2 chord, the disturbances are so strong at 0.3 chord that they can’t be eliminated even when γ = 0.12. In fact, the condition in which the plasma actuation point is 0.35 chord is also conducted,but the control effect is similar to that in the 0.3 chord condition,and the principle to delay the transition is also similar to that in the 0.3 chord condition, so results are not given here. Table 5 gives a summary of the transition delay results when the main flow Ma=0.1.
When the Mach number is 0.1, the maximum plasmainduced velocity is relatively low in contrast to the main flow velocity.Thus,research has been conducted with a Mach number of 0.05,while the Reynolds number is still 4×10⁶and the angle of attack is still 0°. From the above study, it concludes that when the position of plasma actuation is close to the base transition point or at the position where the adverse pressure gradient is large, the effect of transition delay is better, so in this part, only two actuation positions have been studied.One is at the point of 0.3 chord, and the other one is at the point of 0.35 chord. Results are as follows.

Fig. 11 Base flows at 0.3 chord and 0.35 chord when plasma actuation is imposed at 0.3 chord and main flow Ma=0.05.

Fig.12 N factor evolution for discrete disturbance frequencies with a transition threshold of NT =6 when DBD actuation is imposed at 0.3 chord and the main flow Ma=0.05.
From Fig. 11(a), we can see that the effect of plasma actuation on the base flow is much stronger when the main flow Ma=0.05 than when the main flow is Ma=0.1. Even at 0.3 chord, the base flow has been modified a lot when plasma actuation is imposed at 0.3 chord, but it’s clear that the base flow close to the wall is accelerated more at 0.3 chord than at 0.3 chord, because there is a body force distribution near 0.3 chord, but not at 0.3 chord. Actually, the modification of the base flow at 0.3 chord is because of the inertia of the plasma actuation upstream.Although the base flow is modified a lot at 0.3 chord, it doesn’t become more stable, because the part close to the wall is basically not being accelerated.
Fig. 12 suggests that the effect of transition delay is obviously better when the Mach number is 0.05,and actually when γ equals 0.24,the disturbances whose frequencies are relatively high are eliminated.Therefore,it can be speculated that when γ is high enough, all disturbances can be eliminated. Nevertheless, there is no doubt that disturbances can emerge again just like the condition in which the Mach number is 0.1 and the actuation point is 0.2 chord.

Fig.13 N factor evolution for discrete disturbance frequencies with a transition threshold of NT =6 when DBD actuation is imposed at 0.35 chord and the main flow Ma=0.05.
Fig. 13 suggests that the effect of transition delay is better when the plasma actuation position is at 0.35 chord than when the plasma actuation position is at 0.3 chord. Because the disturbances at 0.35 chord are stronger than those at 0.3 chord, it becomes more difficult to eliminate the disturbances, and when γ equals 0.24, the transition point can be delayed about 0.064 chord, which is actually 243.2 mm.Table 6 gives a summary of the transition delay results when the main flow Ma=0.05.
5. Efficiency analysis
The main purpose of delaying transition is to reduce the viscous drag.From Fig.14,the point where the viscous drag coefficient begins to shoot up is delayed so that the viscous drag is reduced. In addition, it’s obvious that the viscous drag coefficient increases a little where plasma actuation is imposed.This is because the boundary layer is accelerated as a result of plasma actuation, and the shearing action of flow becomes stronger, so the viscous drag coefficient becomes larger, but on the other hand, the boundary flow becomes more stable,and the process from laminar flow to turbulent flow is delayed.
Through the above study, it’s obvious that the position where plasma is imposed has a big influence to the transition,so here the optimal position in the study is selected to conduct efficiency analysis. When the main flow Ma=0.1, it is at 0.3 chord,and when the main flow Ma=0.05,it is at 0.35 chord.We assume that the airfoil is excluded one meter along the span direction when calculating the dimensional drag. Details of calculating the saved power (ΔP) are as follows:

where S is the area of the wing,which is 1.9 m2when the Mach number is 0.1 and 3.8 m2when the Mach number is 0.05, ρ is 1.176 kg/m3,and ΔP is the saved power by reducing the drag.
The lift, drag, and viscous drag coefficients under the two conditions calculated through the PMNS2D solver and linear stability analysis theory are given in the tables below.
From Tables 7 and 8,we can see that plasma actuation can lead to a slight increase of the lift coefficient, because plasma actuation increases the circulation of the airfoil. Anyway, this influence is so small that it can be neglected when calculating efficiency. Although ΔCDis larger when the Mach number is 0.05 than when the Mach number is 0.1,ΔP is smaller because it is in proportion to the cube of velocity.

Fig. 14 Comparison of viscous drag coefficients between actuation condition and base condition.
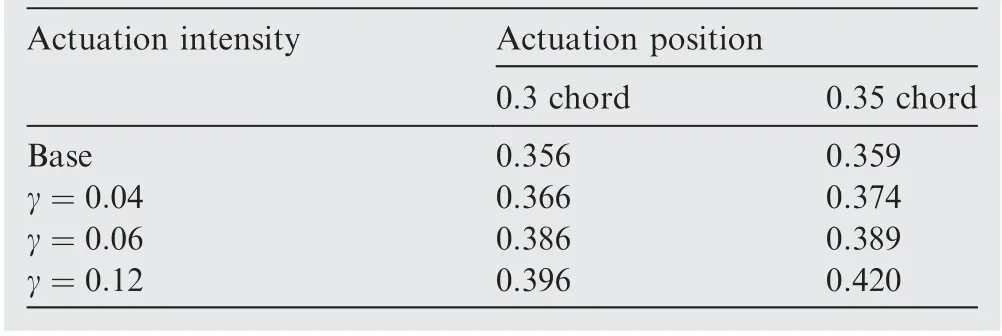
Table 6 Summary of results when main flow Ma=0.05.
The efficiency of plasma transition delay is given in Table 9,and Pdisis obtained from Table 4.
Although the effect of reducing drag is the worst when the actuation voltage is 8 kV, the efficiency is the highest, but the power saved is still less than the power consumed. This just suggests that at present,it is really inefficient to delay the transition by plasma actuation. With the voltage becoming higher and higher,the energy consuming on the ionizing air itself and releasing heat and light also becomes more and more.In addi-tion, not all the body force produced by plasma discharge is used to accelerate flow since wall friction forces exist. When the actuation voltage is 16 kV,the power consumed by plasma discharge is more than 30 W, but the saved power through reducing drag is about 5 W, so the efficiency is really low.

Table 9 Efficiency comparison when main flow Ma=0.1 and Ma=0.05.
6. Conclusions
There is a big difference with the position and intensity of plasma actuation when conducting a transition delay control.Some conclusions can be drawn as follows:

Table 7 Force coefficient comparison and saved power when main flow Ma=0.1 and plasma actuation is imposed at 0.3 chord.

Table 8 Force coefficient comparison and saved power when main flow Ma=0.05 and plasma actuation is imposed at 0.35 chord.
(1) Alternative current dielectric barrier discharge plasma actuation can produce a favorable pressure gradient leading to the boundary layer accelerating to become more stable. For an airfoil, the good position to impose a transition delay control should be close to the transition position or where the adverse pressure gradient is large.
(2) There is not much effect to actuate at a position where the flow itself is stable or in a favorable pressure gradient.On the contrary,it always has a good effect to actuate at a position where disturbances grow fast or the adverse pressure gradient is large.
(3) The stronger the actuation intensity in contrast to the main flow, the better the control effect is, and when the actuation intensity is strong enough,all disturbances can be eliminated, but they will emerge again with the flow traveling downstream owing to some unstable factors such as an adverse pressure gradient, noise, and so on.
(4) The efficiency of plasma delaying transition to reduce drag is very low because the ionizing air process itself consumes energy and discharge produces heat and light,but the meaningful part to transition delay is only that accelerates ions in the flow.
In the future study, on one hand, how to improve the efficiency of plasma discharge is the core, and on the other hand,how to obtain a better effect of plasma transition delay is also very important.
Acknowledgement
This work was supported by the National Numerical Wind Tunnel Project (No. NNW2018-ZT3B08).
 CHINESE JOURNAL OF AERONAUTICS2021年2期
- CHINESE JOURNAL OF AERONAUTICS的其它文章
- Recent active thermal management technologies for the development of energy-optimized aerospace vehicles in China
- Electrochemical machining of complex components of aero-engines: Developments, trends, and technological advances
- Recent progress of residual stress measurement methods: A review
- Micromanufacturing technologies of compact heat exchangers for hypersonic precooled airbreathing propulsion: A review
- Towards intelligent design optimization: Progress and challenge of design optimization theories and technologies for plastic forming
- A combined technique of Kalman filter, artificial neural network and fuzzy logic for gas turbines and signal fault isolation
