Progressive damage behaviors of woven composite laminates subjected to LVI, TAI and CAI
Zhengqiang CHENG, Junjiang XIONG
School of Transportation Science and Engineering, Beihang University, Beijing 100083, China
KEYWORDS Compression after impact;Low velocity impact;Progressive damage;Tension after impact;Woven composite laminates
Abstract This paper seeks to deal with progressive damage behaviors of woven composite laminates subjected to low-velocity impact (LVI), tension-after-impact (TAI) and compression-afterimpact (CAI). The LVI, TAI and CAI tests were conducted on woven carbon fibre lamina 3238A/CF3052 and woven glass fibre lamina 3238A/EW250F,and the time-dependent LVI contact force and deflection curves, static TAI and CAI load versus displacement curves were determined and discussed. A modified progressive damage model was presented for explicit dynamic LVI and implicit static TAI and CAI analysis by using basic material properties and geometrical dimensions, and progressive damage LVI, TAI and CAI behaviors of woven composite laminates were simulated, demonstrating a good correlation between simulations and experiments.
1. Introduction
Woven composite laminates are widely used in aerospace,transport and renewable energy industries due to their excellent shear strength, impact resistance and fracture toughness.1A main concern is the potentially significant dropping to static strength and fatigue life due to the LVI (low-velocity impact)events such as dropped maintenance tools.Reliable evaluation for the LVI effect on structural integrity remains a challenge to the industry,particularly for laminated woven composite components with complex failure mechanisms and interactions.
A significant amount of research has been conducted to investigate the LVI resistance, and TAI (tension-afterimpact) and CAI (compression-after-impact) properties of composite laminates. These works are classified and listed in Table 1 according to detailed issues. It has been reported that the LVI resistance,TAI and CAI properties of composite laminates are significantly affected by laminate type,2geometric configuration,3-6layer thickness,7-9stacking sequence,6,10-13impactor shape,14-16impact angle,17,18impact energy size,13,16,19-24environment temperature19,25-28and boundary conditions.29As a consequence,in order to assess failure limits and reliability during the design prediction stage of advanced composite structures, it is becoming increasingly important to fully understand the effects of the aforementioned factors on the damage mechanisms and mechanical properties of the LVI, TAI and CAI of composite laminates.
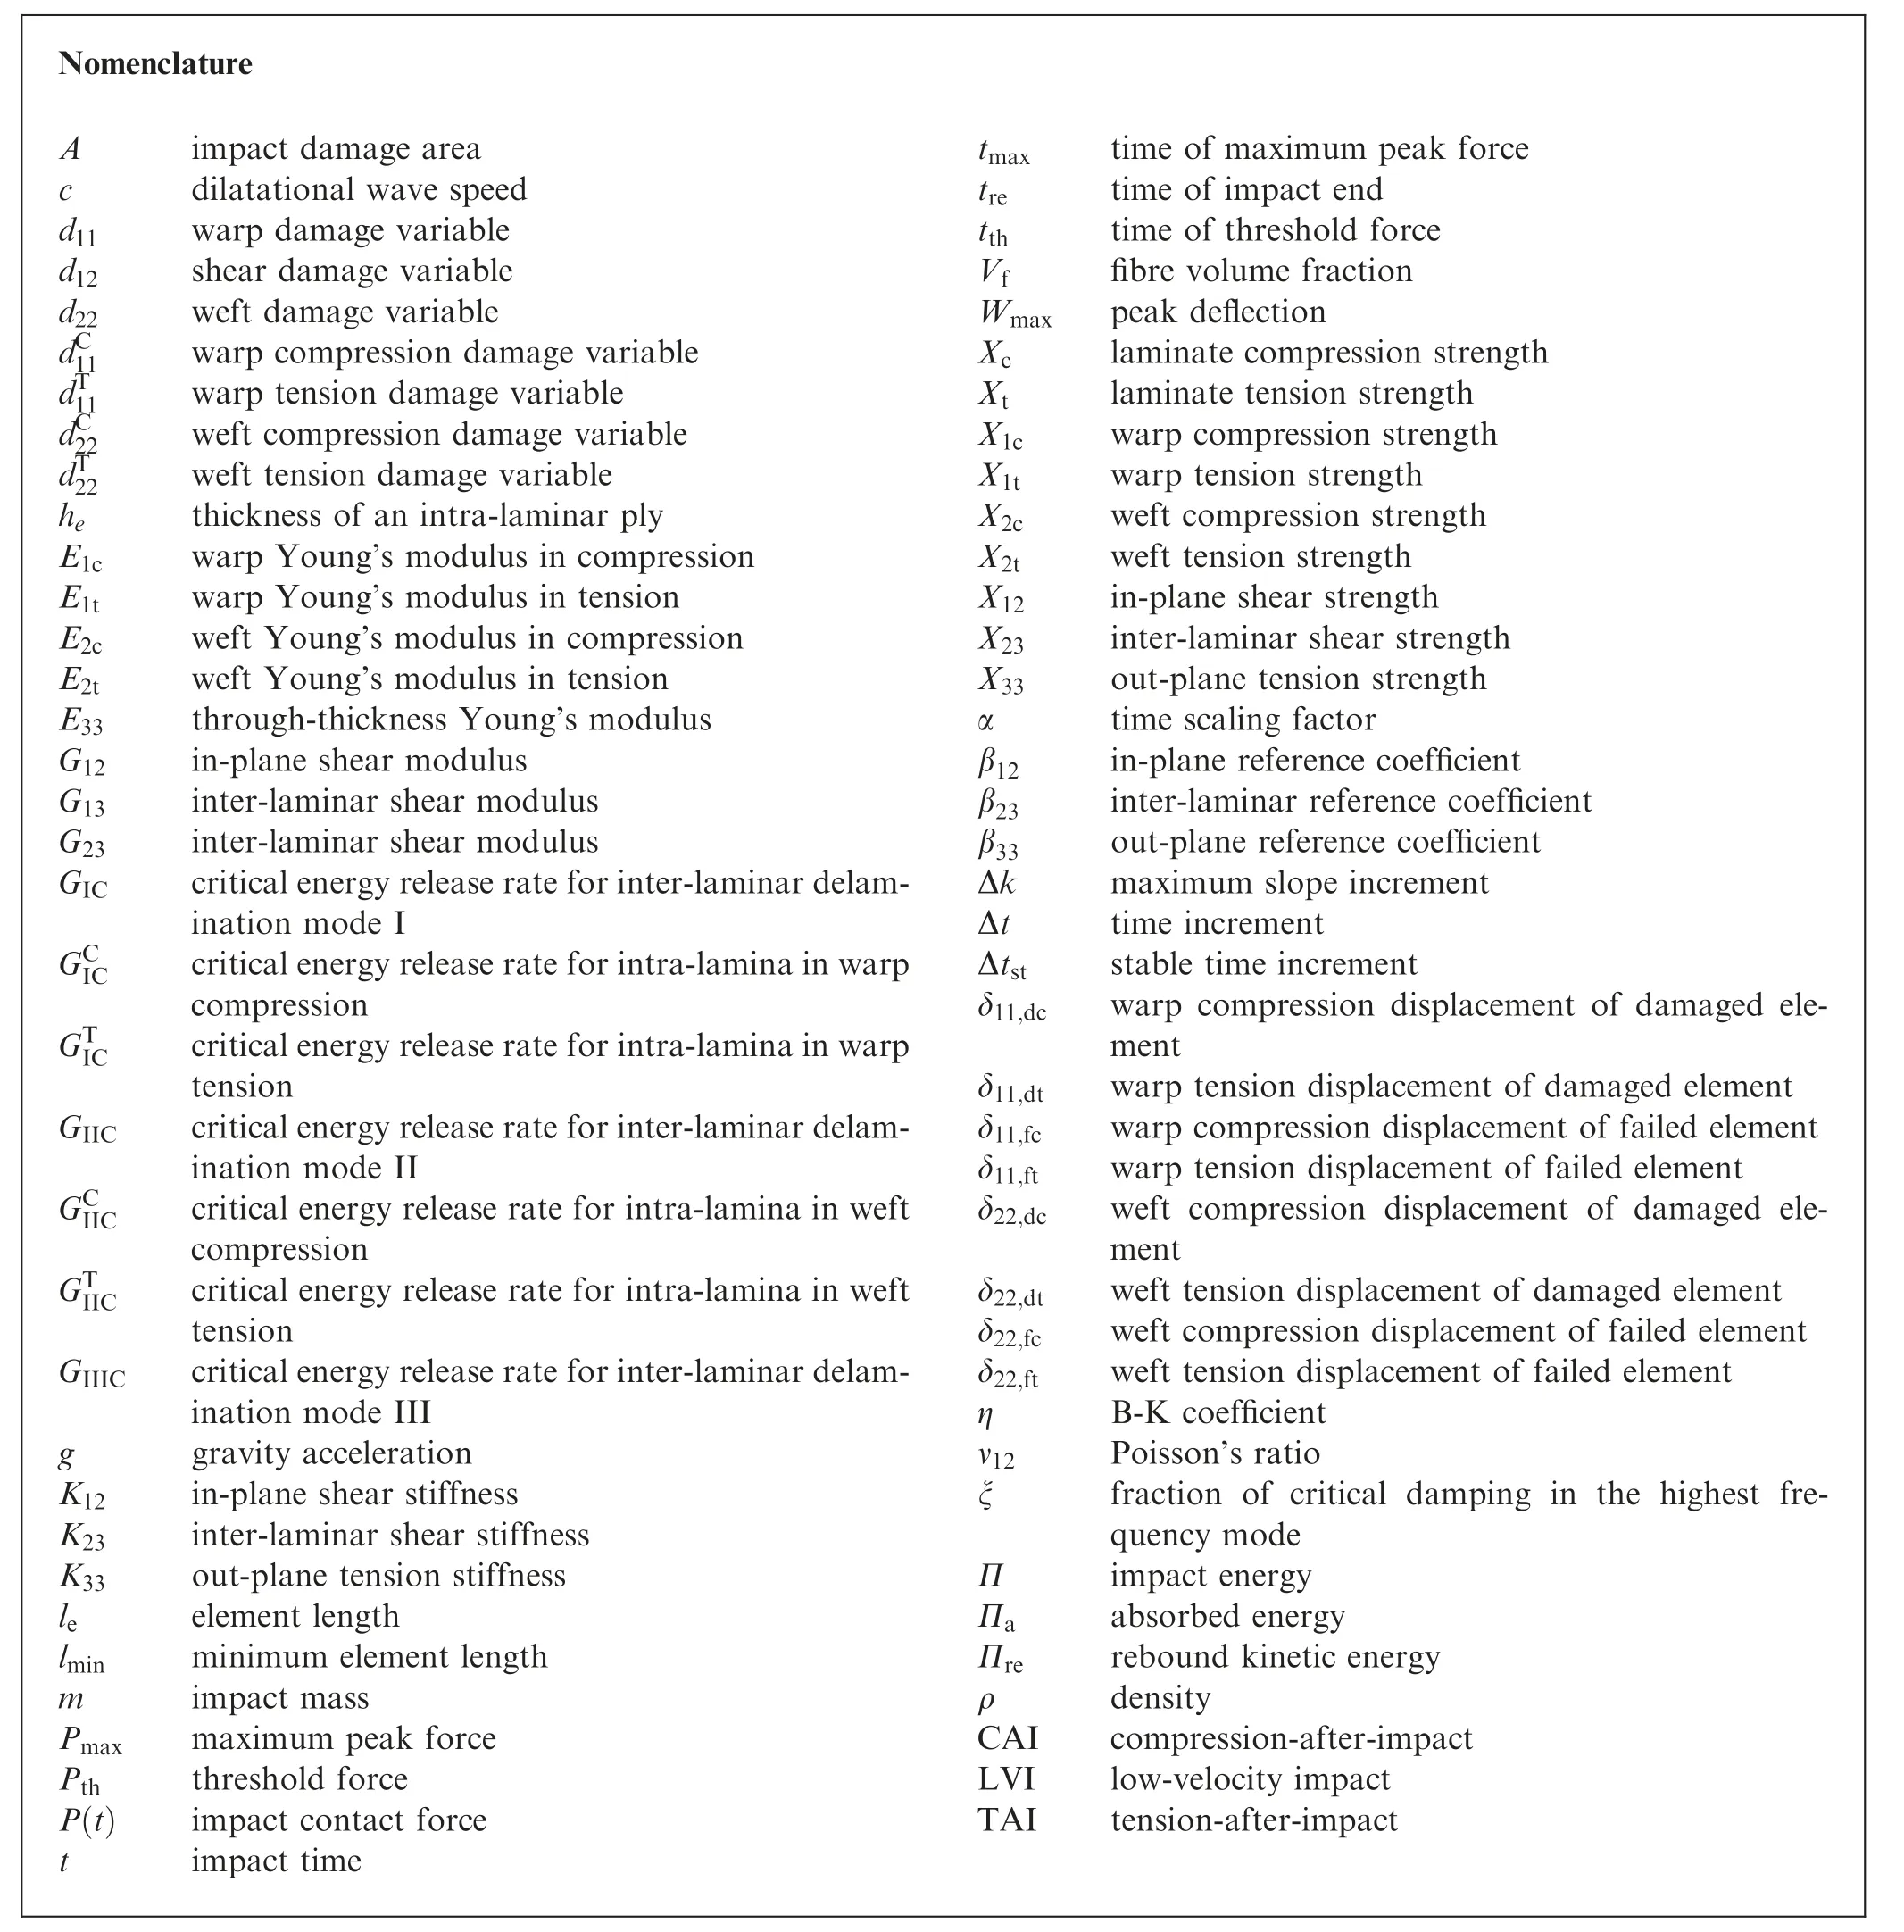
Nomenclature A impact damage area c dilatational wave speed d11 warp damage variable d12 shear damage variable d22 weft damage variable dC 11 warp compression damage variable dT 11 warp tension damage variable dC 22 weft compression damage variable dT 22 weft tension damage variable he thickness of an intra-laminar ply E1c warp Young’s modulus in compression E1t warp Young’s modulus in tension E2c weft Young’s modulus in compression E2t weft Young’s modulus in tension E33 through-thickness Young’s modulus G12 in-plane shear modulus G13 inter-laminar shear modulus G23 inter-laminar shear modulus GIC critical energy release rate for inter-laminar delamination mode I GCIC critical energy release rate for intra-lamina in warp compression GTI C critical energy release rate for intra-lamina in warp tension GIIC critical energy release rate for inter-laminar delamination mode II GCIIC critical energy release rate for intra-lamina in weft compression GTI IC critical energy release rate for intra-lamina in weft tension GIIIC critical energy release rate for inter-laminar delamination mode III g gravity acceleration K12 in-plane shear stiffness K23 inter-laminar shear stiffness K33 out-plane tension stiffness le element length lmin minimum element length m impact mass Pmax maximum peak force Pth threshold force P t( ) impact contact force t impact time tmax time of maximum peak force tre time of impact end tth time of threshold force Vf fibre volume fraction Wmax peak deflection Xc laminate compression strength Xt laminate tension strength X1c warp compression strength X1t warp tension strength X2c weft compression strength X2t weft tension strength X12 in-plane shear strength X23 inter-laminar shear strength X33 out-plane tension strength α time scaling factor β12 in-plane reference coefficient β23 inter-laminar reference coefficient β33 out-plane reference coefficient Δk maximum slope increment Δt time increment Δtst stable time increment δ11,dc warp compression displacement of damaged element δ11,dt warp tension displacement of damaged element δ11,fc warp compression displacement of failed element δ11,ft warp tension displacement of failed element δ22,dc weft compression displacement of damaged element δ22,dt weft tension displacement of damaged element δ22,fc weft compression displacement of failed element δ22,ft weft tension displacement of failed element η B-K coefficient ν12 Poisson’s ratio ξ fraction of critical damping in the highest frequency mode∏ impact energy∏a absorbed energy∏re rebound kinetic energy ρ density CAI compression-after-impact LVI low-velocity impact TAI tension-after-impact
A large amount of research is available dealing with the LVI response of composite laminates(e.g.,impact contact force and deflection, etc.) by using the variational principles of strain energy5,14or the kinetic equation.8,20,30,31Finite element (FE)analysis is also important for revealing the damage characteristics and failure mechanism of the LVI,3,4,10-13,29,32-35and for understanding the TAI and CAI properties of composite laminates.6,7,12,13,21-24,33-39In reality, the different physical progresses between the LVI and the TAI or CAI lead to the increase in the difficulty for simulating the TAI and CAI behaviors of post-impact composite laminate. In view of this, two simulation procedures (i.e., impact-induced damage approximation in the TAI or CAI models,and unified FE model from the LVI to the TAI or CAI process) have received extensive attention.
Yan et al.36approximated impact-induced damage within the sub-laminate to be circular delamination between plies,which size increases with the thickness. Rozylo et al.37gradiently reduced layer thickness to simplify the impact-induced damage region for simulating the CAI behavior.Craven et al.40introduced more complex delamination between plies and fibre breakages, but ignored the delamination propagation under compressive loading. Obviously, the aforementioned approximations are simple and practical but do not fully characterize complex mechanism of impact-induced damage. This has led to development of the second category of unified FE model.Gonzalez et al.22and Thorsson et al.39reported that the postimpact damage in the FE model for the LVI response could be imported to the FE model for the CAI response by means of the Restart and Import capabilities of Abaqus/Explicit. For this reason, unified FE model could be generated to simulate the LVI and TAI or CAI responses, without any artificial impact-induced damage approximation. Wang et al.12employed unified FE model to simulate the dynamic lowvelocity impact response and post-impact damage, and then to predict the quasi-static tensile strength. Liu et al.13, Tan et al.34, Mendes and Donadon38also implemented unified FE model to predict the CAI behavior. However, the aforementioned response solutions were executed by means of explicit dynamic analysis. In many circumstances, due to time and resource constraints, the explicit dynamic analysis on the TAI and CAI responses necessitates the greater displacement loading-rate or mass scaling, appreciably inducing the inertial effect and drastically decreasing calculation precision.Hence,a solution technique for assessing the aforementioned responses in engineering design is desirable.

Table 1 Summary of previous research on the LVI, TAI and CAI.
Moreover,although the LVI,TAI or CAI responses of unidirectional laminates have been comprehensively explored,the LVI behaviors of woven composite laminates have been scarcely reported and the related mechanism has not been systematically studied owing to the complex failure mechanisms and interactions.Thereby,a need exists for fully understanding the LVI, TAI and CAI responses of woven composite laminates.
This paper aims to experimentally and numerically investigate progressive damage LVI, TAI and CAI behaviors of woven composite laminates. The progressive damage LVI,TAI and CAI behaviors of woven carbon fibre lamina 3238A/CF3052 and woven glass fibre lamina 3238A/EW250F were determined. A modified progressive damage model was presented for explicit dynamic LVI and implicit static TAI and CAI analysis, and progressive damage LVI, TAI and CAI behaviors of woven composite laminates were simulated.Good agreement has been achieved between simulations and experiments.
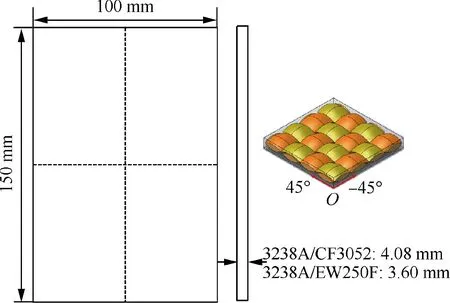
Fig. 1 Geometric geometry and schematic of specimen.
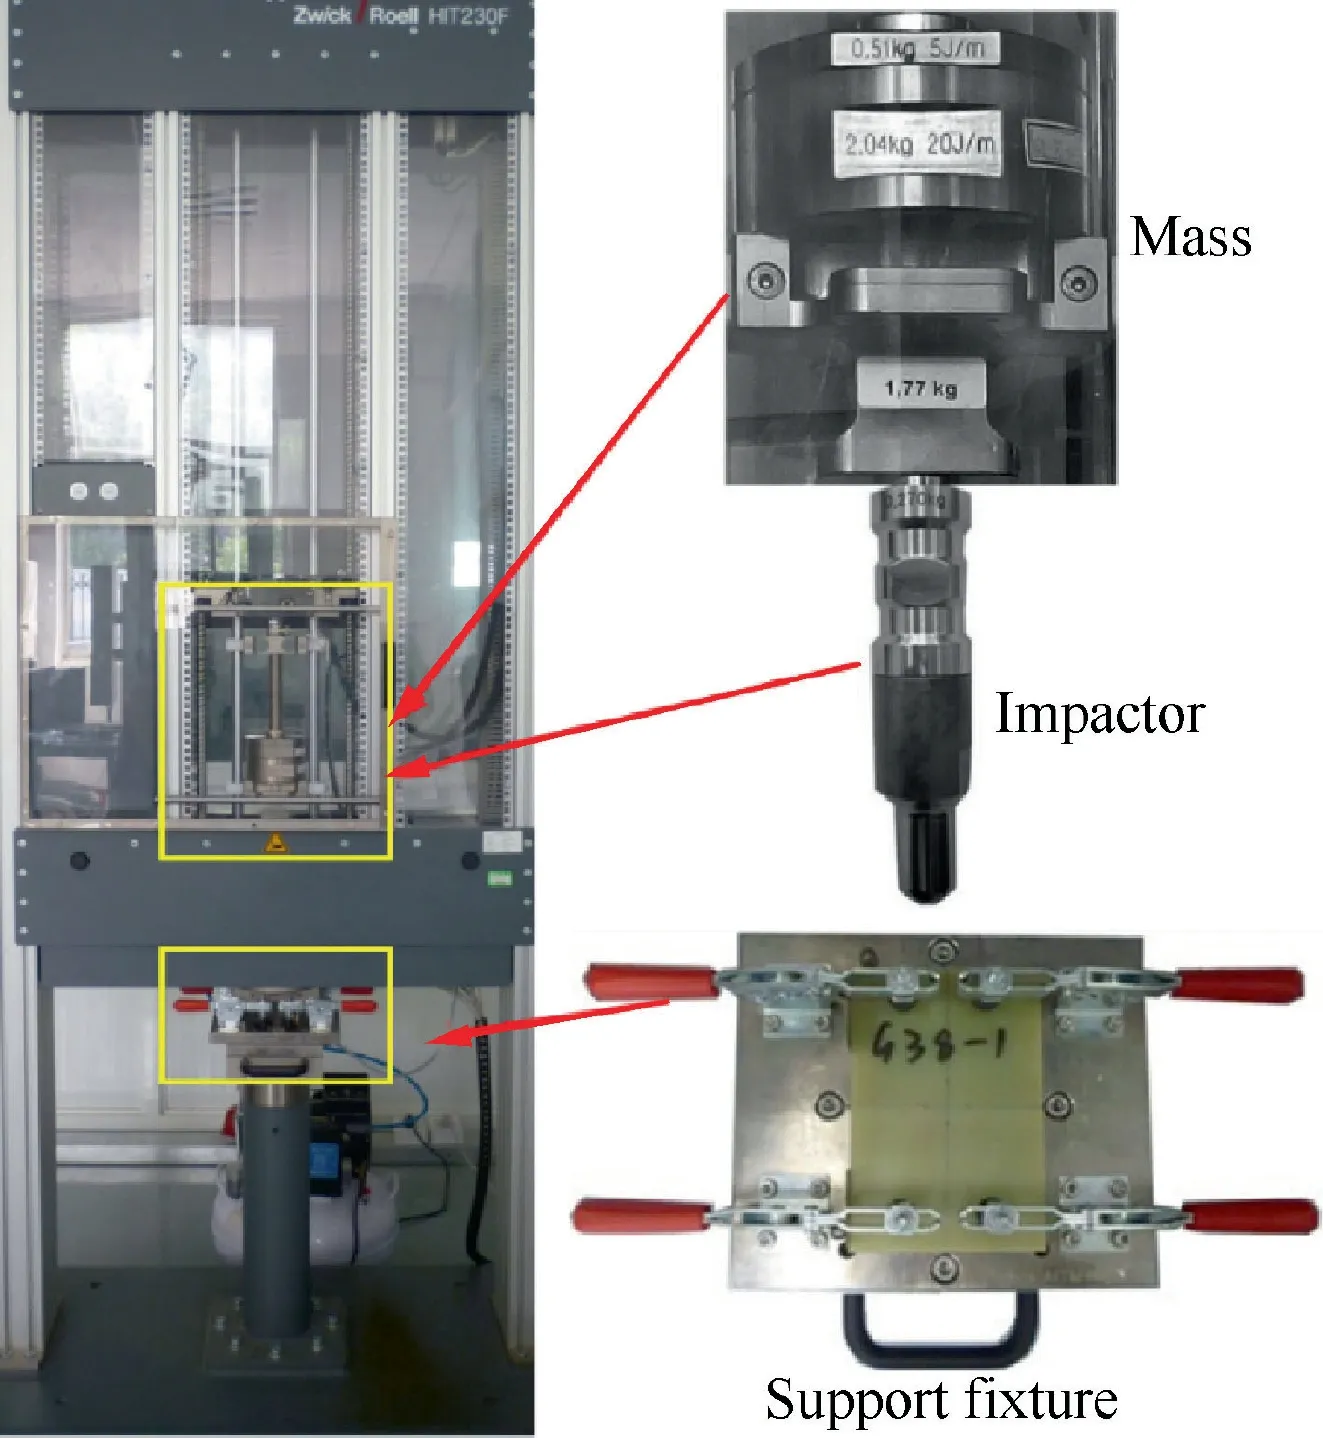
Fig. 2 HIT230F drop hammer impact tester.

Table 2 Mechanical properties of 3238A/CF3052 and 3238A/EW250F composites.41
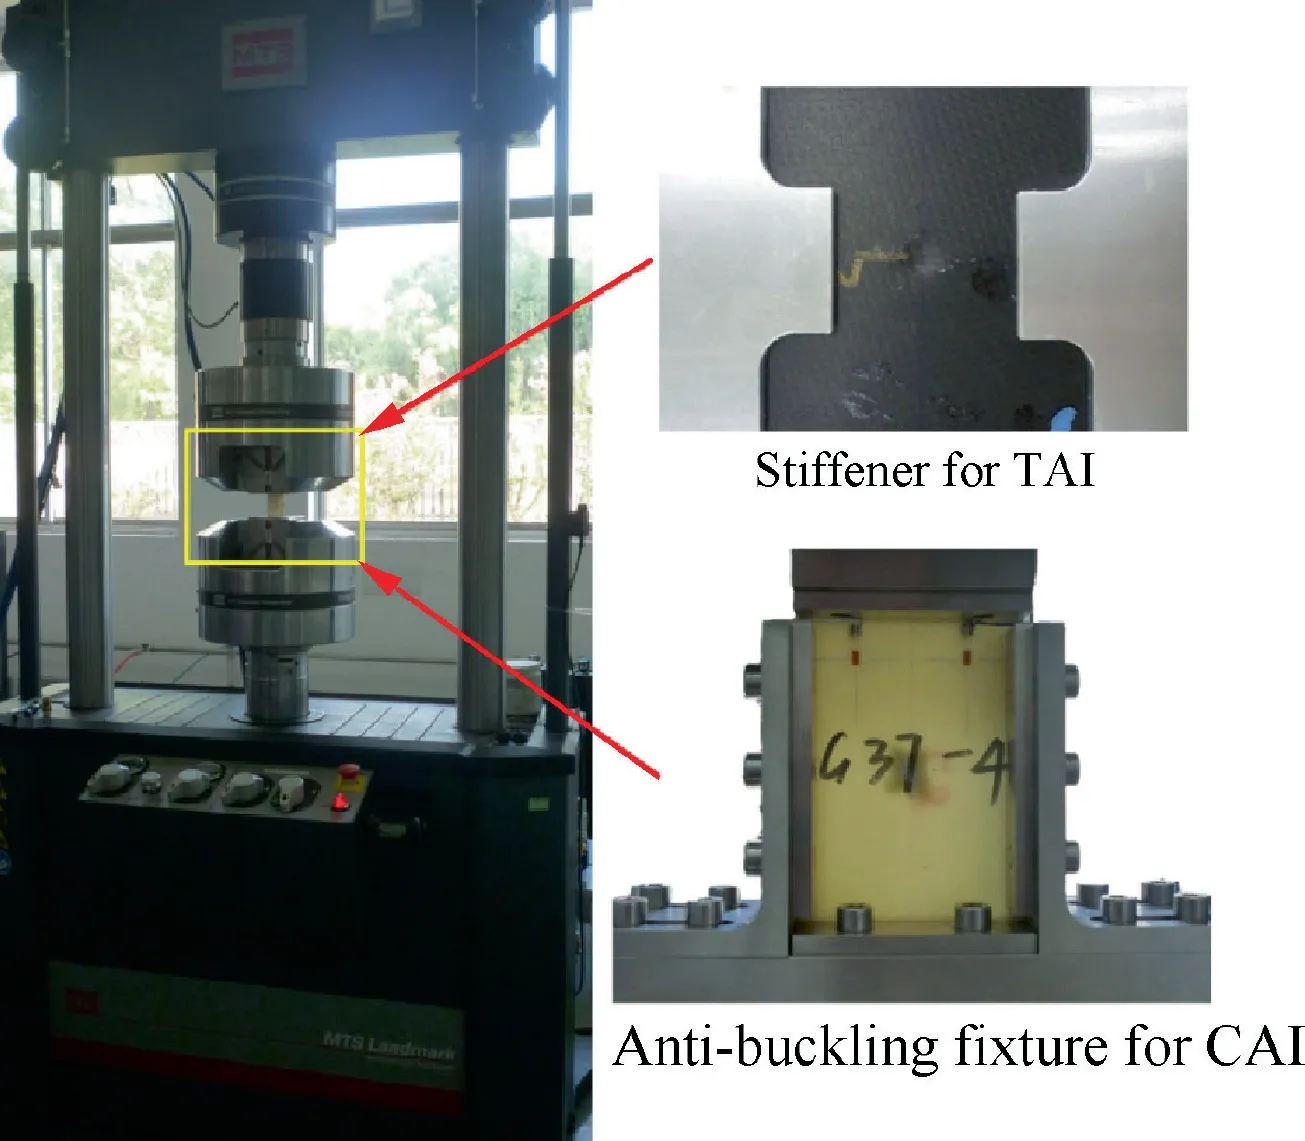
Fig. 3 TAI and CAI test setups.
2. Experimental procedures
2.1. Materials and specimens
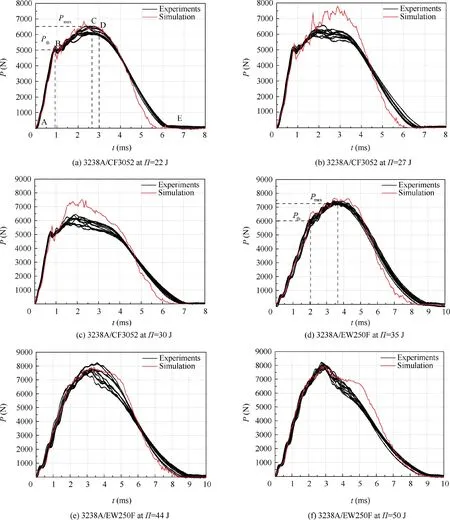
Fig. 4 Contact force versus time curves.
The test specimens were made of plain woven carbon fibre reinforced polymer 3238A/CF3052 and plain woven glass fibre reinforced polymer 3238A/EW250F,respectively. Table 2 presents the mechanical properties of the two materials.41Both the plain woven carbon fibre and the plain woven glass fibre laminate specimens have the same stacking sequence of[(45/-45)/(0/90)]3s. Fig. 1 shows the geometry and schematic of the specimen.The laminate plates were fabricated by a vacuum bag process under high temperature of 130°C and pressure of 0.5 MPa, and then cut by a water jet to the size of the specimen.
2.2. Test procedures
The LVI tests of woven composite laminates were carried out on a HIT230F drop hammer impact tester(shown in Fig.2)at room temperature and moisture, and the drop-hammer has a mass of 5.61 kg with a hemispherical steel nose of 16 mm diameter. According to ASTM D7136,42the specimen was firstly placed on the rigid base with a rectangular open hole of 75 mm×125 mm size, and the specimen center was then adjusted to align the impact location, after this, four corners of specimen were clamped by the support fixtures. Three sets of impact tests were conducted under three different levels of impact energy for each type of specimen,and at least ten specimens were employed for each level of impact energy tests.During tests, all specimens were struck by the free drophammer at a specific level of impact energy, which was controlled by adjusting the impact height of drop-hammer from the rigid fixture base.The impact characteristics including contact force versus time and contact force versus deflection curves were automatically recorded by the test system, and the impact damages were detected by the GE-Phasor-XS ultrasonic flaw detector.
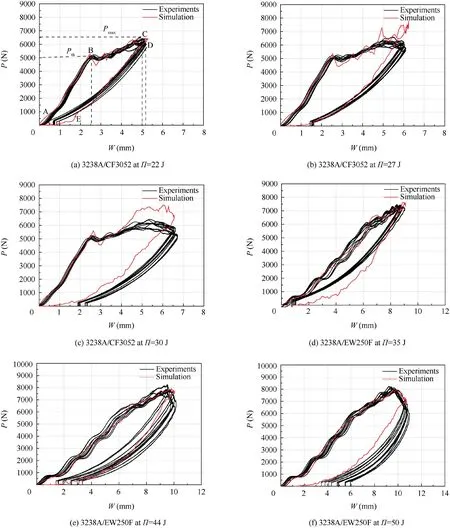
Fig. 5 Contact force versus deflection curves.
Again, according to ASTM D576643and ASTM D7137,44the TAI and CAI tests were conducted on MTS 370.50 machine (shown in Fig. 3) at room temperature and moisture at the loading-rates of 2 mm/min and 1.25 mm/min, respectively.At least three post-impact specimens were implemented for each type test and for each type of post-impact laminate,and load versus displacement curves automatically recorded by the test system.
3. Experimental results and discussion
3.1. LVI experimental results
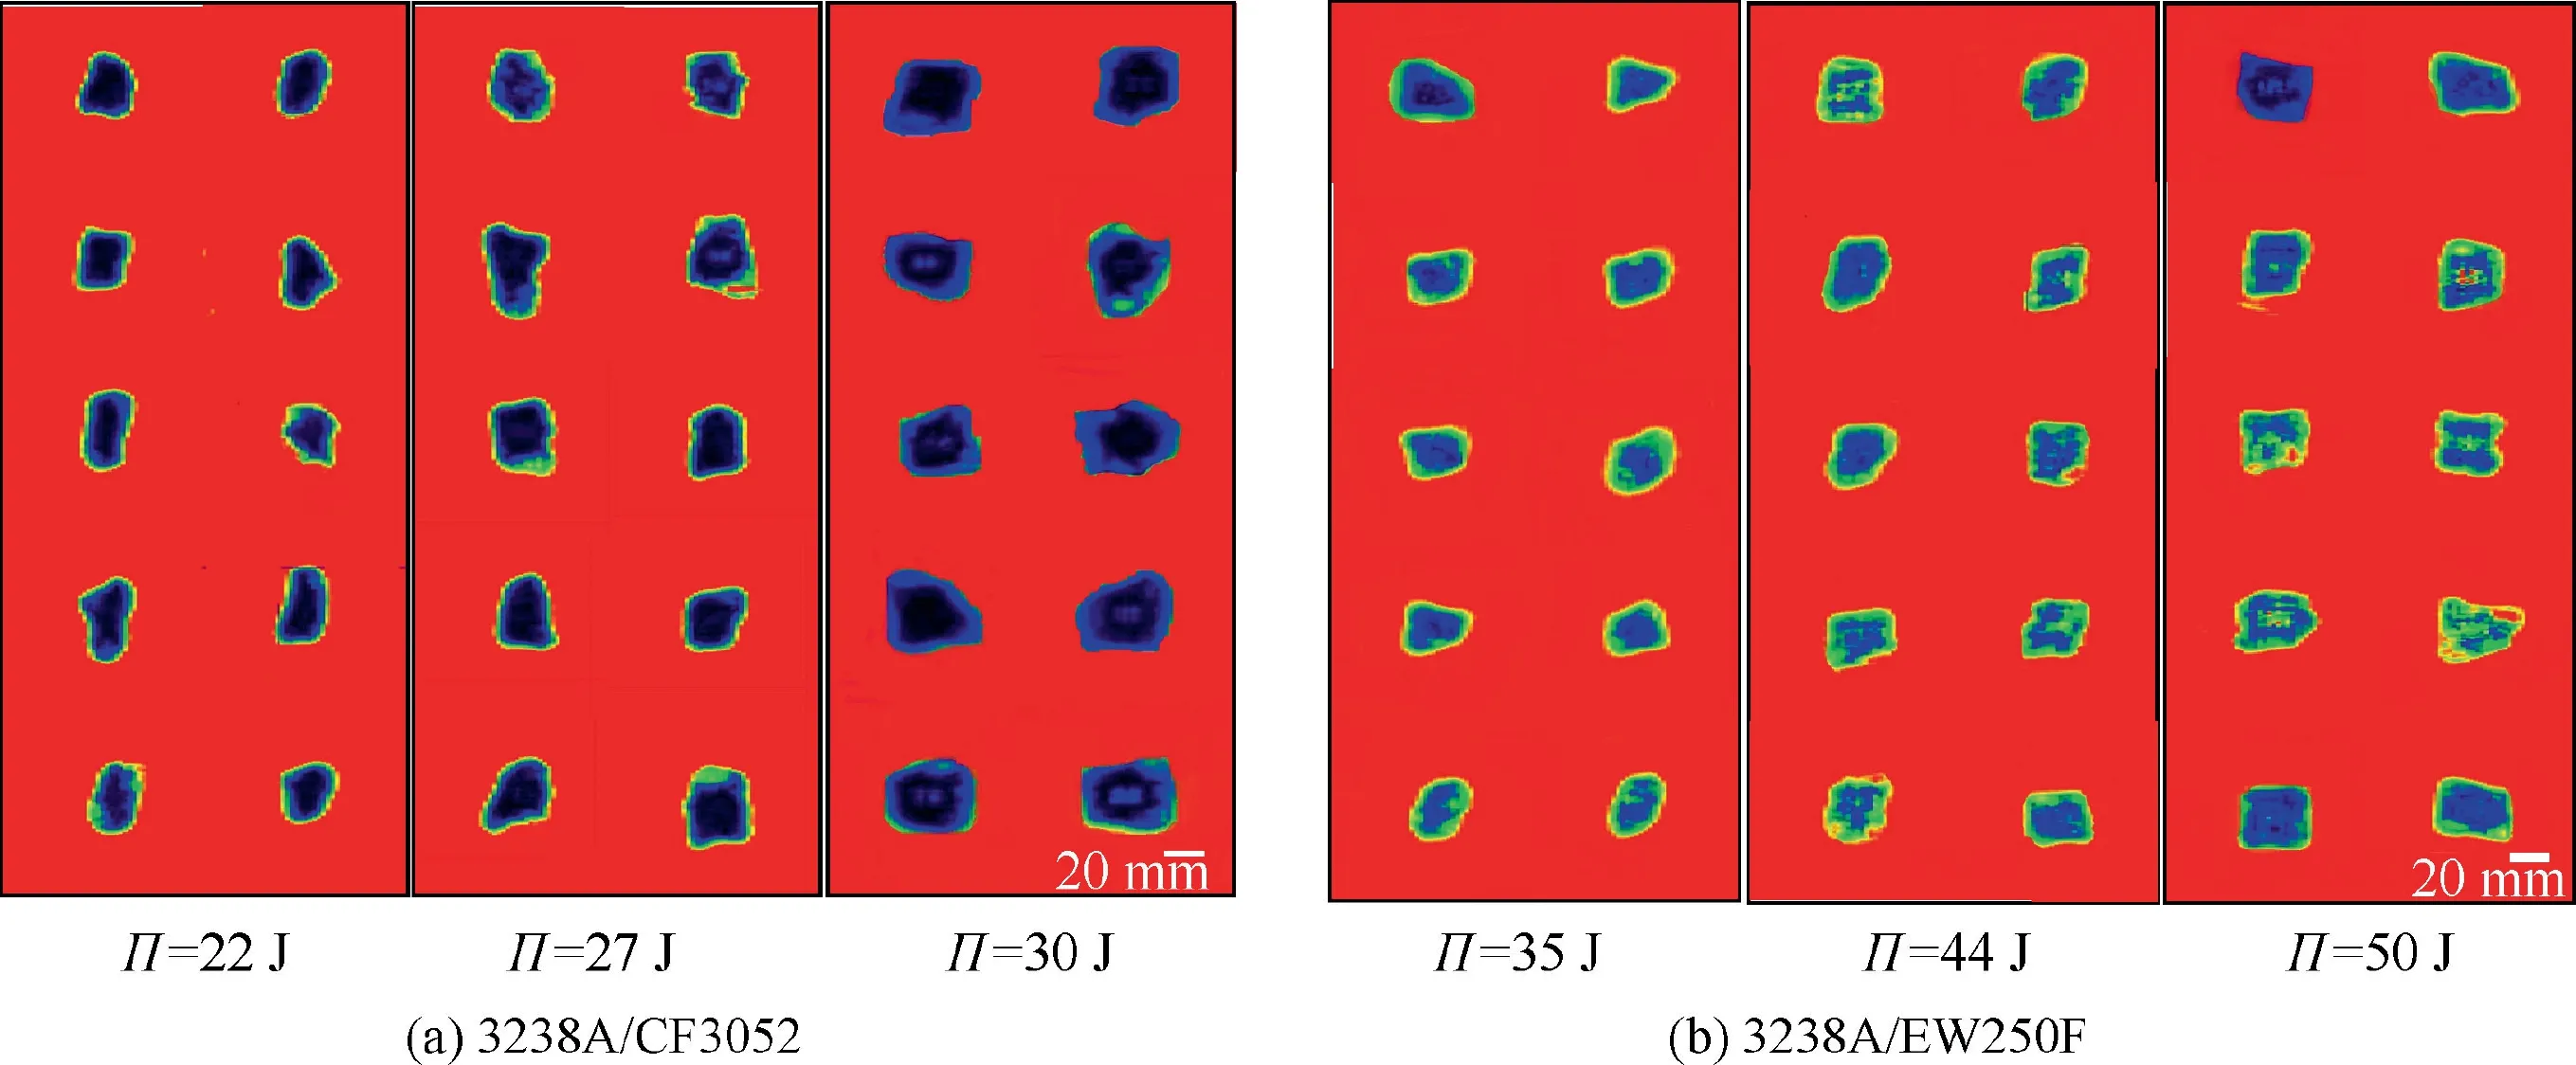
Fig. 6 Damage footprints detected by ultrasonic flaw detector.
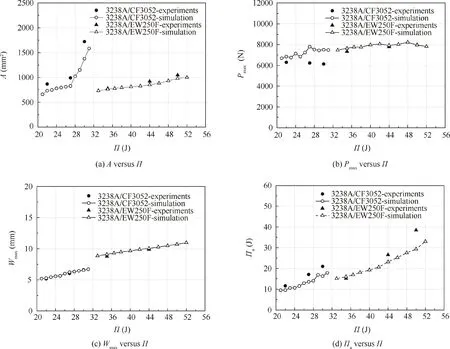
Fig. 7 Impact characteristics versus impact energy.

Table 3 Damage area and Threshold force.
From Figs. 4 and 5, it can be seen that there are three regions(i.e., regions A-B, B-C and C-E) on the contact force versus time curves for the LVI.The first region(or region A-B)is termed as the ‘‘approximately linear elastic regime”, in which contact force approximately linearly increases with time before a tiny kink(i.e.,point B).The kink is followed by the region BC,in which contact force continue to rise in a jumping manner up to the maximum peak force(i.e.,point C)at a lower rate as against in the elastic regime. After the maximum peak force,the third region or the final stage of impact process (or region C-E) begins, in which the laminates experience final deformation and bounce back until the end of impact. In approximately linear elastic regime A-B, an existence of several jumping values on the contact force versus time curves of woven carbon fibre lamina marks a minor difference between woven carbon fibre lamina 3238A/CF3052 on one side and woven glass fibre lamina 33238A/EW250F on the other. This is because the resin-cracking causes load drops on the contact force versus time curves.From literature,19the threshold force is defined as the contact force at kink point B, or

In the region B-C, with the increasing impact loading, the impact-induced damage propagation significantly reduces the laminate stiffness, notably reducing linear slope of contact force versus time curves. Nevertheless, the laminates still have carrying capacity and continue to carry impact load until the maximum peak force Pmaxas the impactor continuously perforates the laminate.In the final stage C-E,the impactor continues to invade the laminate until the maximum deflection Wmax(shown in Fig.5(a)),which corresponds to point D on the contact force versus time curve(see Fig.4(a)),and then rebounds,gradually decreasing the contact force.
Figs. 6 and 7(a), and Table 3 indicates that the damage footprints can be approximated to be circle and the damage areas on both types of post-impact laminates increase with the increasing level of impact energy. However, the impact damage area more significantly increases with the increase in impact energy for lamina 3238A/CF3052 than for lamina 3238A/EW250F (see Fig. 7(a)), this implies that lamina 3238A/CF3052 is more sensitive to impact than lamina 3238A/EW250F. The reason for this is that carbon fibre is more brittle than glass fibre, at the same impact energy, more carbon fibre breakages induce greater damage area in lamina 3238A/CF3052 than in lamina 3238A/EW250F.
From Fig.8,it is clear that circular impact dents appear on the font surface of both types of post-impact laminates (see Fig. 8(a) and (d)), while pyramidal or ridged impact damage patterns randomly emerge on the back surface (see Fig. 8(b),(c), (e) and(f)). This is likely due to the plastic hinge lines (including square boundaries and two diagonal lines or rectangle boundaries and five inside lines),around which four triangular areas rotate to induce the pyramidal pattern, or two triangle and two trapezoidal areas rotate to deduce the ridge pattern.
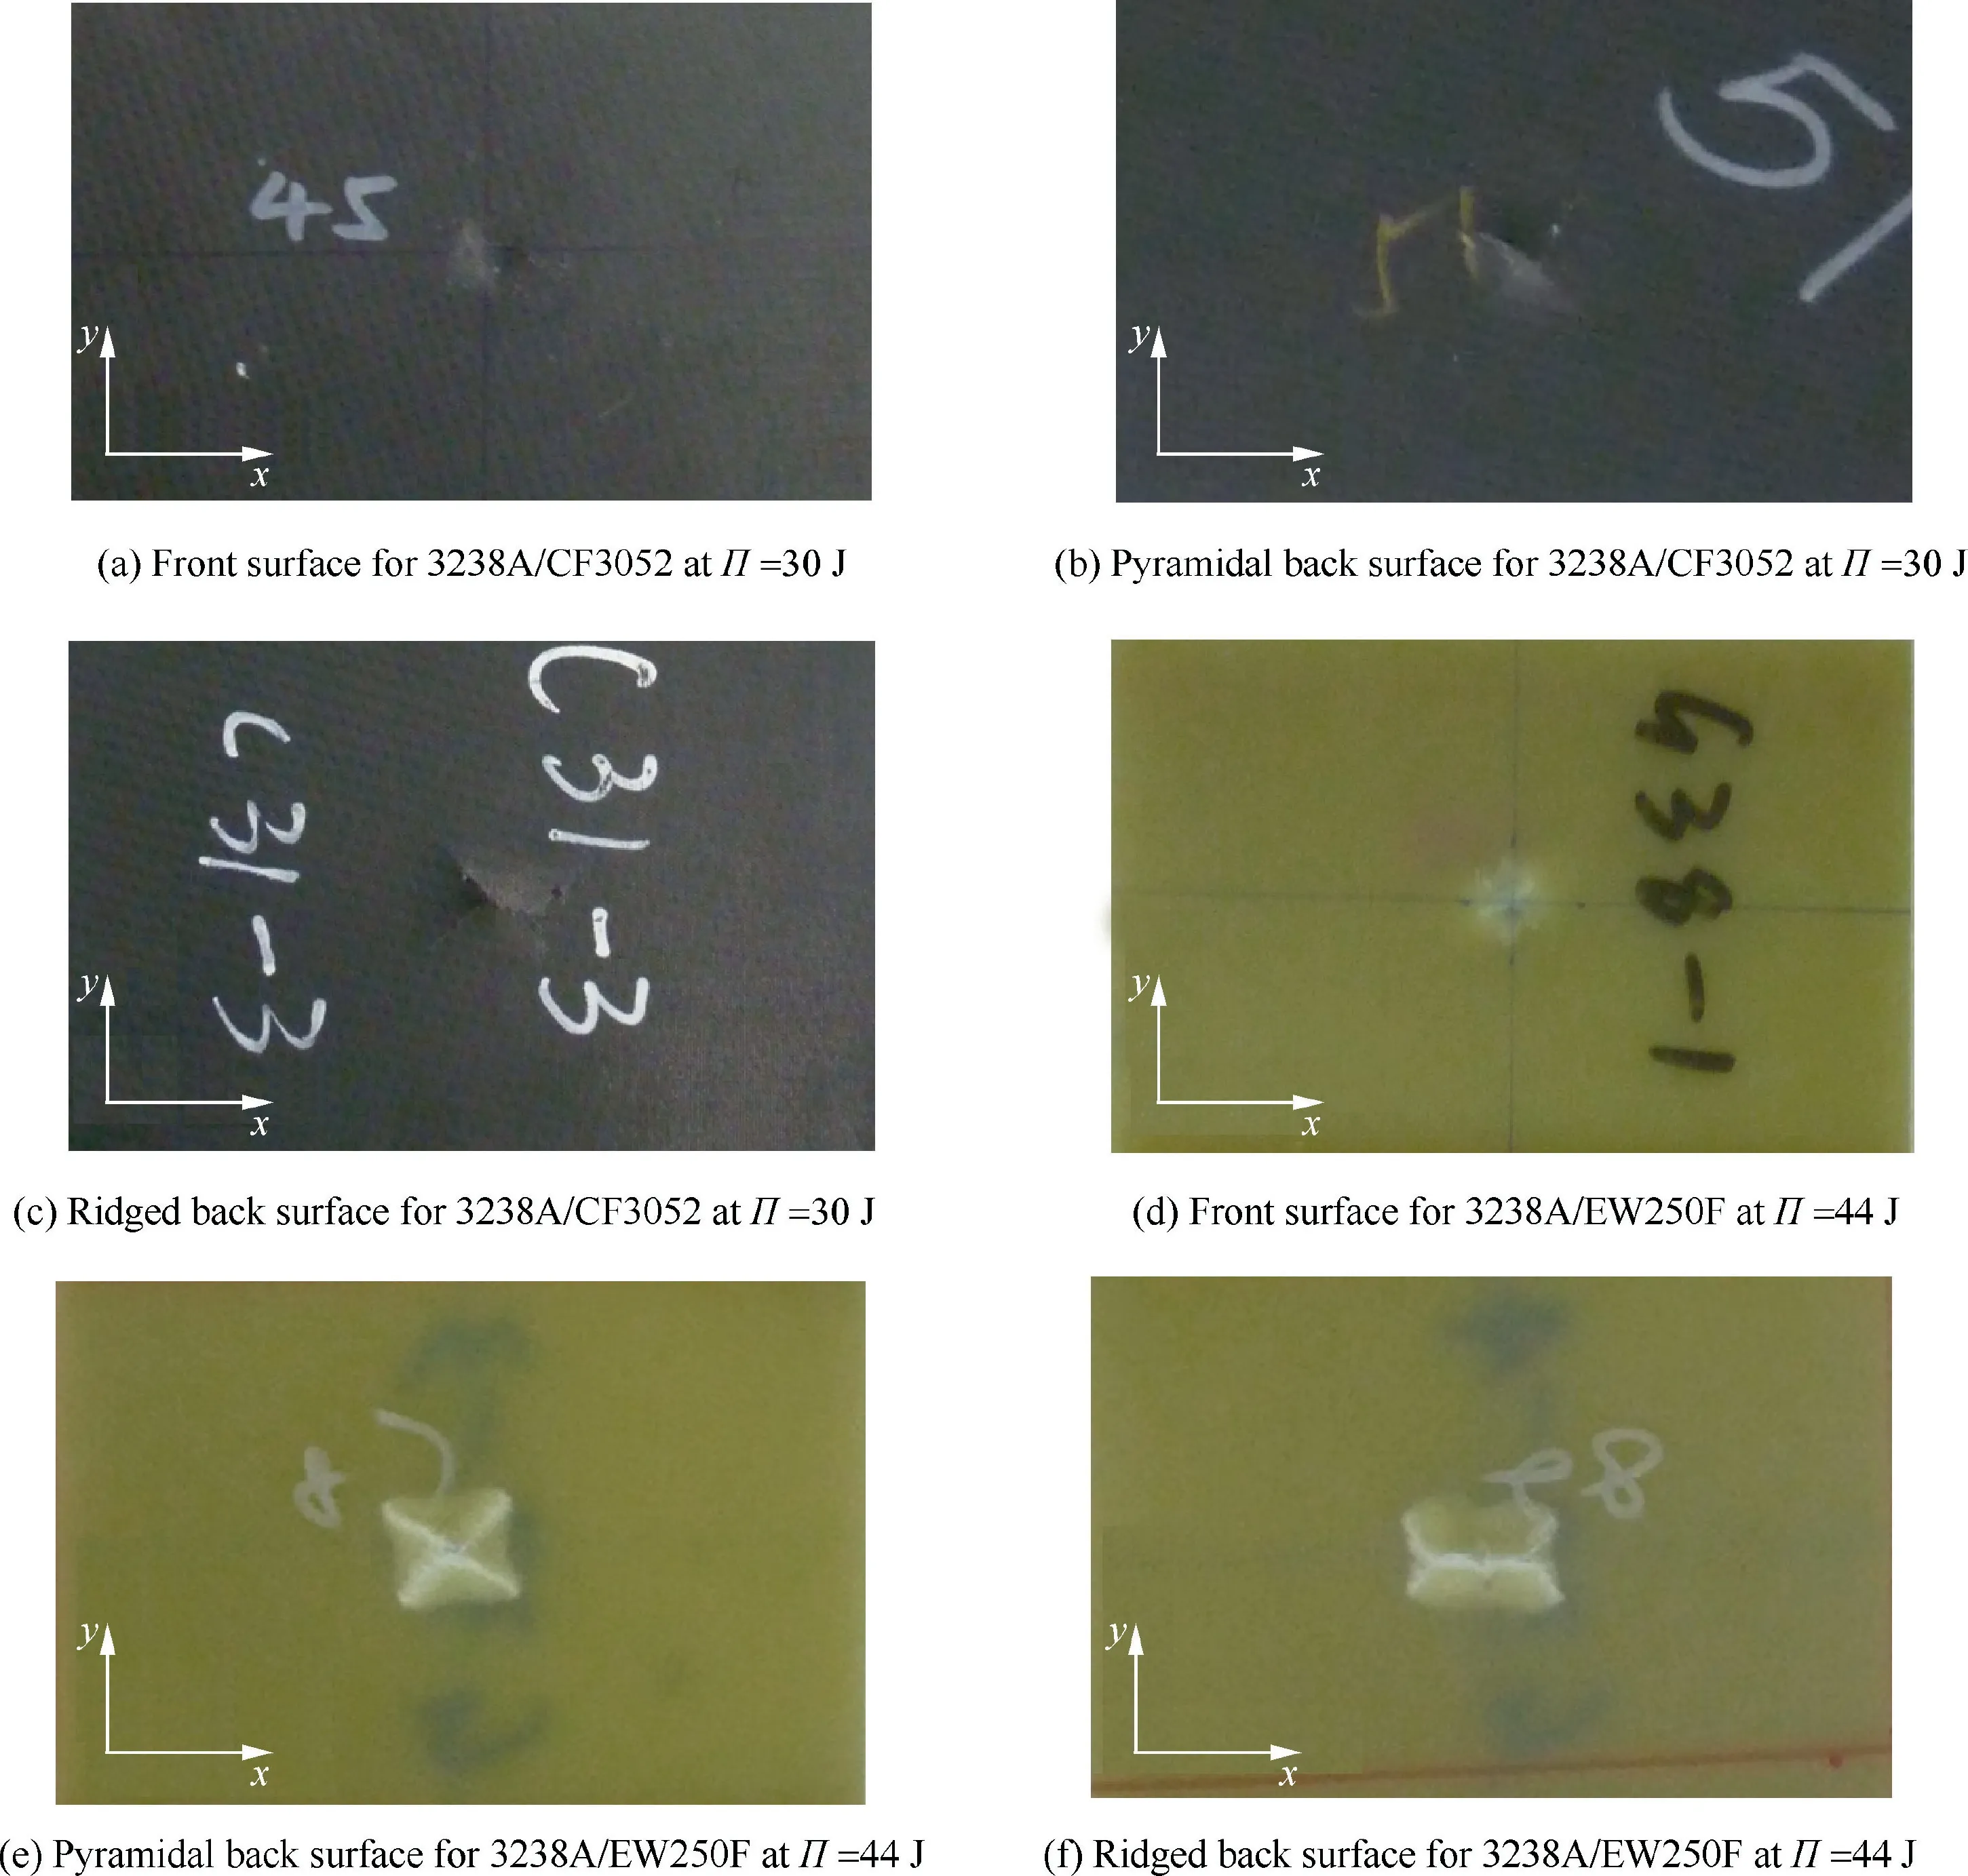
Fig. 8 Typical post-impact macroscopic damages.
In order to understand the LVI characteristics of composite laminates, from Figs. 4 and 5, the threshold force, maximum peak force and peak deflection are obtained to depict the impact damage resistance of composite laminates (shown in Fig.7(b)and(c),Tables 3 and 4).From Table 3,it can be seen that almost threshold forces for both types of laminates at different impact energies remain unchanged to be about 5089 N and 5962 N, respectively, implying that the threshold force is independent of impact energy.This result is in agreement with the previous work.34Conversely, with the increase in impact energy, the maximum peak force slowly increases for lamina 3238A/EW250F, but slightly reduces for lamina 3238A/CF3052 (see Fig. 6(b) and Table 4), implicating that the resistance against the invasion of impactor is better for lamina 3238A/EW250F than for lamina 3238A/CF3052. Unlike the threshold and maximum peak forces, almost peak deflections for both types of laminates linearly increase with the increase in impact energy, but the peak deflection is smaller for lamina 3238A/CF3052 than for lamina 3238A/EW250F at the same impact energy (see Fig. 7(c) and Table 4). This is probably due to the larger stiffness for lamina 3238A/CF3052 than for lamina 3238A/EW250F.
In order to identify the absorbed energy,the heat generated by the friction during the impact process is generally ignored,so the absorbed energy by the laminate is

From Eqs. (3) and (4) and experimental data shown in Fig. 4, the absorbed energies are calculated (shown in Fig. 7(d)and Table 5).From Fig.7(d)and Table 5,it is obvious that the absorbed energies and absorbed energy ratios for both types of laminates increase with the increase in impact energy,illustrating that the dissipated energy increases with the impact damage initiation and propagation (such as fibre-breakage,matrix-cracking, fibre/matrix debonding and inter-laminar delamination). At the same impact energy, the absorbed energy ratio is less for lamina 3238A/EW250F than for lamina 3238A/CF3052. This is due to the less stiffness for lamina 3238A/EW250F than for lamina 3238A/CF3052.
3.2. TAI and CAI experimental results
From Fig.9(a)and(b),it is apparent that the tensile load versus displacement curves for both types of post-impact laminates are similar and first approximate linear, and the tensile stiffness decreases slightly with the increasing load. Static tensile strengths for both types of post-impact laminates decrease with the increase in impact energy. From Fig. 9(c) and (d), it can be shown that like static tensile strength, static compressive strengths for both types of post-impact laminates also decrease with the increase in impact energy. Unlike the tensile load versus displacement curves types of post-impact laminates, the compressive load versus displacement curves forboth types of post-impact laminates are different from each other.That is,the compressive load versus displacement curves for post-impact lamina 3238A/CF3052 are linear (see Fig. 9(c)), whereas those for post-impact lamina 3238A/EW250F seem bilinear(see Fig.9(d)).Much larger compressive stiffness for lamina 3238A/CF3052 than for lamina 3238A/EW250F is the primary reason for the difference between compressive load versus displacement curves of both types of laminates.In reality, during the CAI tests, no buckling occurred on lamina 3238A/CF3052. Conversely, the global buckling was observed near the impact dent zone on lamina 3238A/EW250F to cause smaller linear slope on load versus displacement curve, even if anti-buckling device was employed for the CAI tests. Moreover, all linear-loss points appear within the range from 30 to 40 kN. This result agrees with the work in prior literature.6

Table 4 Maximum peak force and peak deflection.
From Fig. 10, it is obvious that in the TAI and CAI tests,fibre breakages of both types of laminates first appeared near the impact-induced damage region due to the local stress concentration, and then propagated perpendicular to the loading direction from the impact dent until final failure of the zones B, D, F and H far. This result is consistent with the previous work.45
From the ultimate loads in the TAI and CAI tests (shown in Fig. 9), the residual strengths are obtained (shown in Fig. 11(a) and Table 6), and the residual strength ratios are then calculated (shown in Fig. 11(b)). From Fig. 11 and Table 6, it is evident the residual strengths for both types of post-impact laminates decrease with the increase in impact energy (see Fig. 11(a) and Table 6), whereas the residual strength decrease more clearly with the increase in impact energy for lamina 3238A/CF3052 than for lamina 3238A/EW250F (see Fig. 11(b)), demonstrating that lamina 3238A/CF3052 are more sensitive to impact energy on the TAI and CAI properties than lamina 3238A/EW250F.This is probably due to the different damage mechanisms between the two types of materials under static loading. Actually, more severe stiffness mismatch (or more drastic strain gradient) between the reinforcement and the matrix exits in woven carbon fibre lamina 3238A/CF3052 than in woven glass fibre lamina 3238A/EW250F because both types of laminates have the same matrix material. As a result of more severe stiffness mismatch in carbon fibre laminate,the stress concentration around the impact damage of carbon fibre laminate is more appreciable than that of glass fibre laminate, causing greater static strength reduction, and more matrix related damages (such as fibrebreakage, matrix-cracking, fibre/matrix debonding, splitting and delamination) in 3238A/CF3052 than in 3238A/EW250F under static loading. It goes without saying that carbon fibre composites is more sensitive to impact damage (or impact energy) on static strength than glass fibre composites.
4. Progressive damage analysis
4.1. Progressive damage model
Since the interaction between longitudinal, transverse and through-thickness strengths of composites has been considered, the Tsai-Wu rule46though has been proven to be more effective and apt in failure prediction of composites as compared to the maximum stress or strain criterion, but not in predicting individual failure mode.The Hashin rule47seems more appropriate in isolating individual failure mode. However, the Hashin rule is not suitable for identifying the delamination mode. Actually, the cohesive zone model and maximum stress criterion have been generally used for isolating delamination mode. For this reason, a mixed failure rule incorporating the Hashin criterion and cohesive zone model is employed to identify the individual failure mode such as matrix,fibre and delamination in this work(listed in Table 7).
In order to define the progressive degradation of material properties, the damage mechanics method based on stiffness reduction seems simple but effective, here the reduction of stiffness is dependent on the individual failure mode. In other words,once element failure is reached,the stiffness matrix C of the material is degraded according to the damage mechanics methodology. Then, the degraded material properties corresponding to failure modes are assigned to the failed element in the FE model before the new iterative calculations in this work.
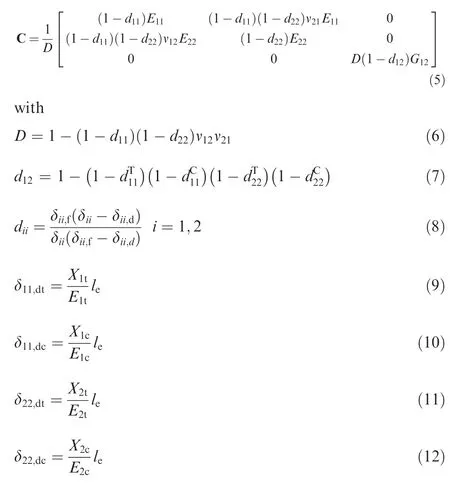
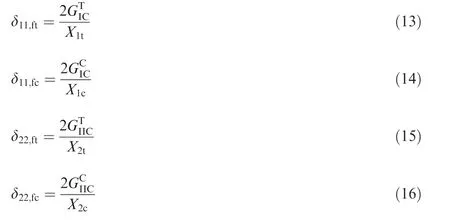
In progressive damage simulation, except for the failure mode of inter-laminar debonding which is characterized by the cohesive zone model, all failure modes are attributed to material degradation. Fig. 12 gives the schematic flowchart of progressive damage analysis incorporating explicit dynamic LVI and implicit static TAI and CAI simulations in Abaqus code. The LVI process on woven composite laminates in this work is a typical transient dynamic event with about ten milliseconds, which meets the characteristics and conditions of the explicit dynamic analysis. Consequently,explicit dynamic analysis is apt for the LVI process (see Fig. 12). In explicit dynamic LVI simulation by using ABAQUS code, the nodal velocity and acceleration are determined from the nodal displacements at the current and previous times by means of central difference method (instead of differential method), and the nodal displacement at the next time is predicted based on the kinetic equation and from the nodal velocity and acceleration. Accordingly,the stress and strain of the element are calculated from the geometric and physical equations. Obviously, in explicit dynamic LVI simulation, structural response at the next time is related to ones at the current and previous times. In order to perform stable explicit dynamic LVI simulation, the step time (i.e., total time) for whole impact response process is always divided into many shorter time increments or intervals, and the time increment Δt cannot be longer than the maximum stable time increment Δtst, which can be expressed as34

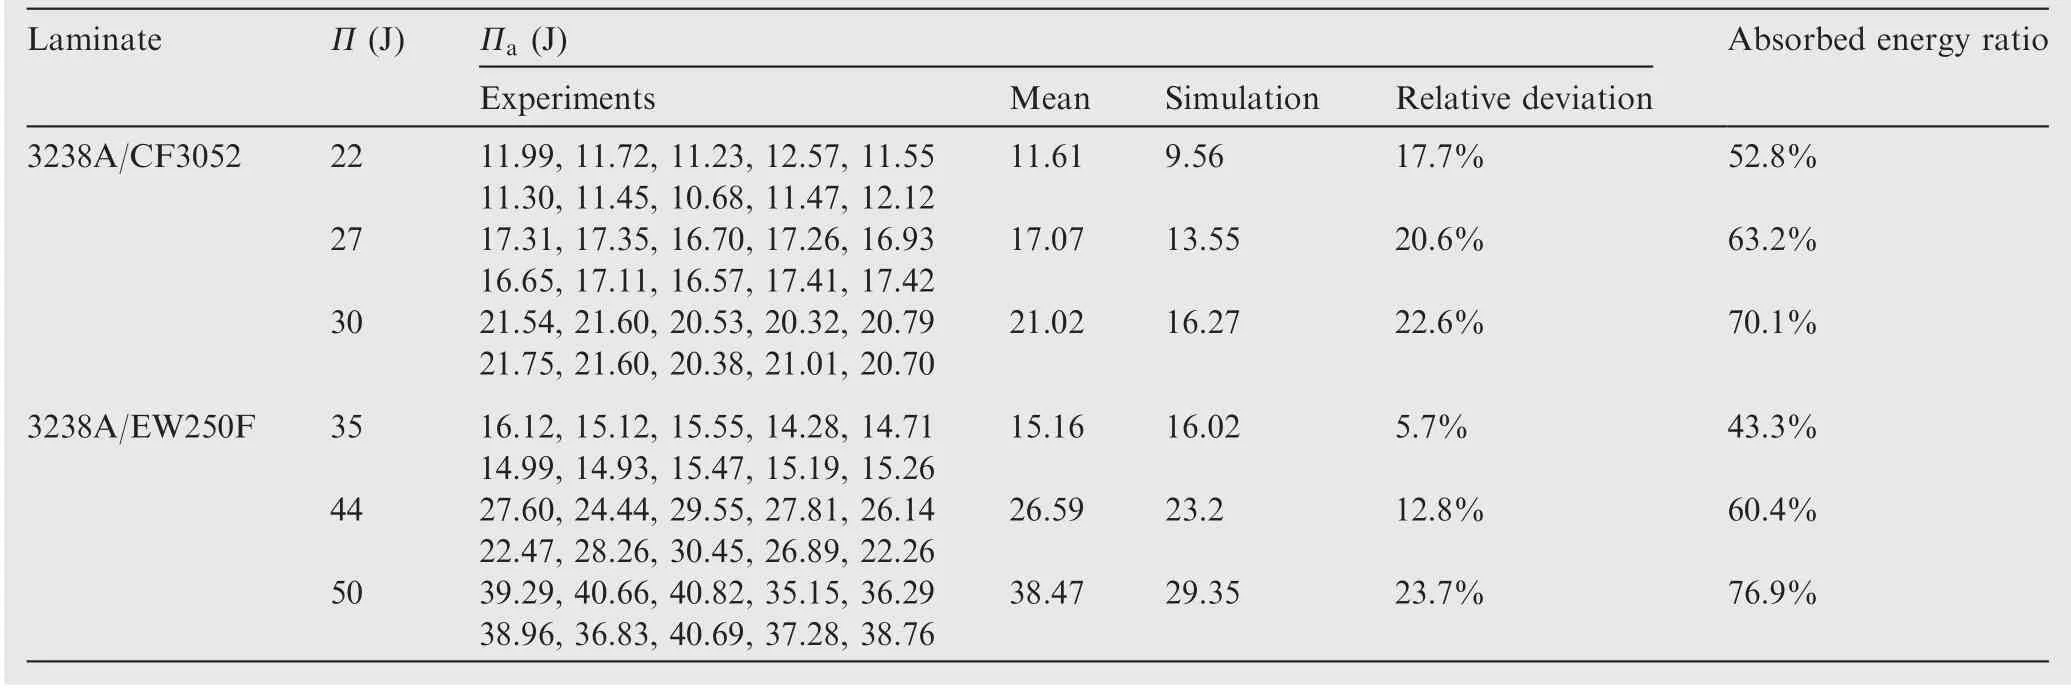
Table 5 Absorbed energy.
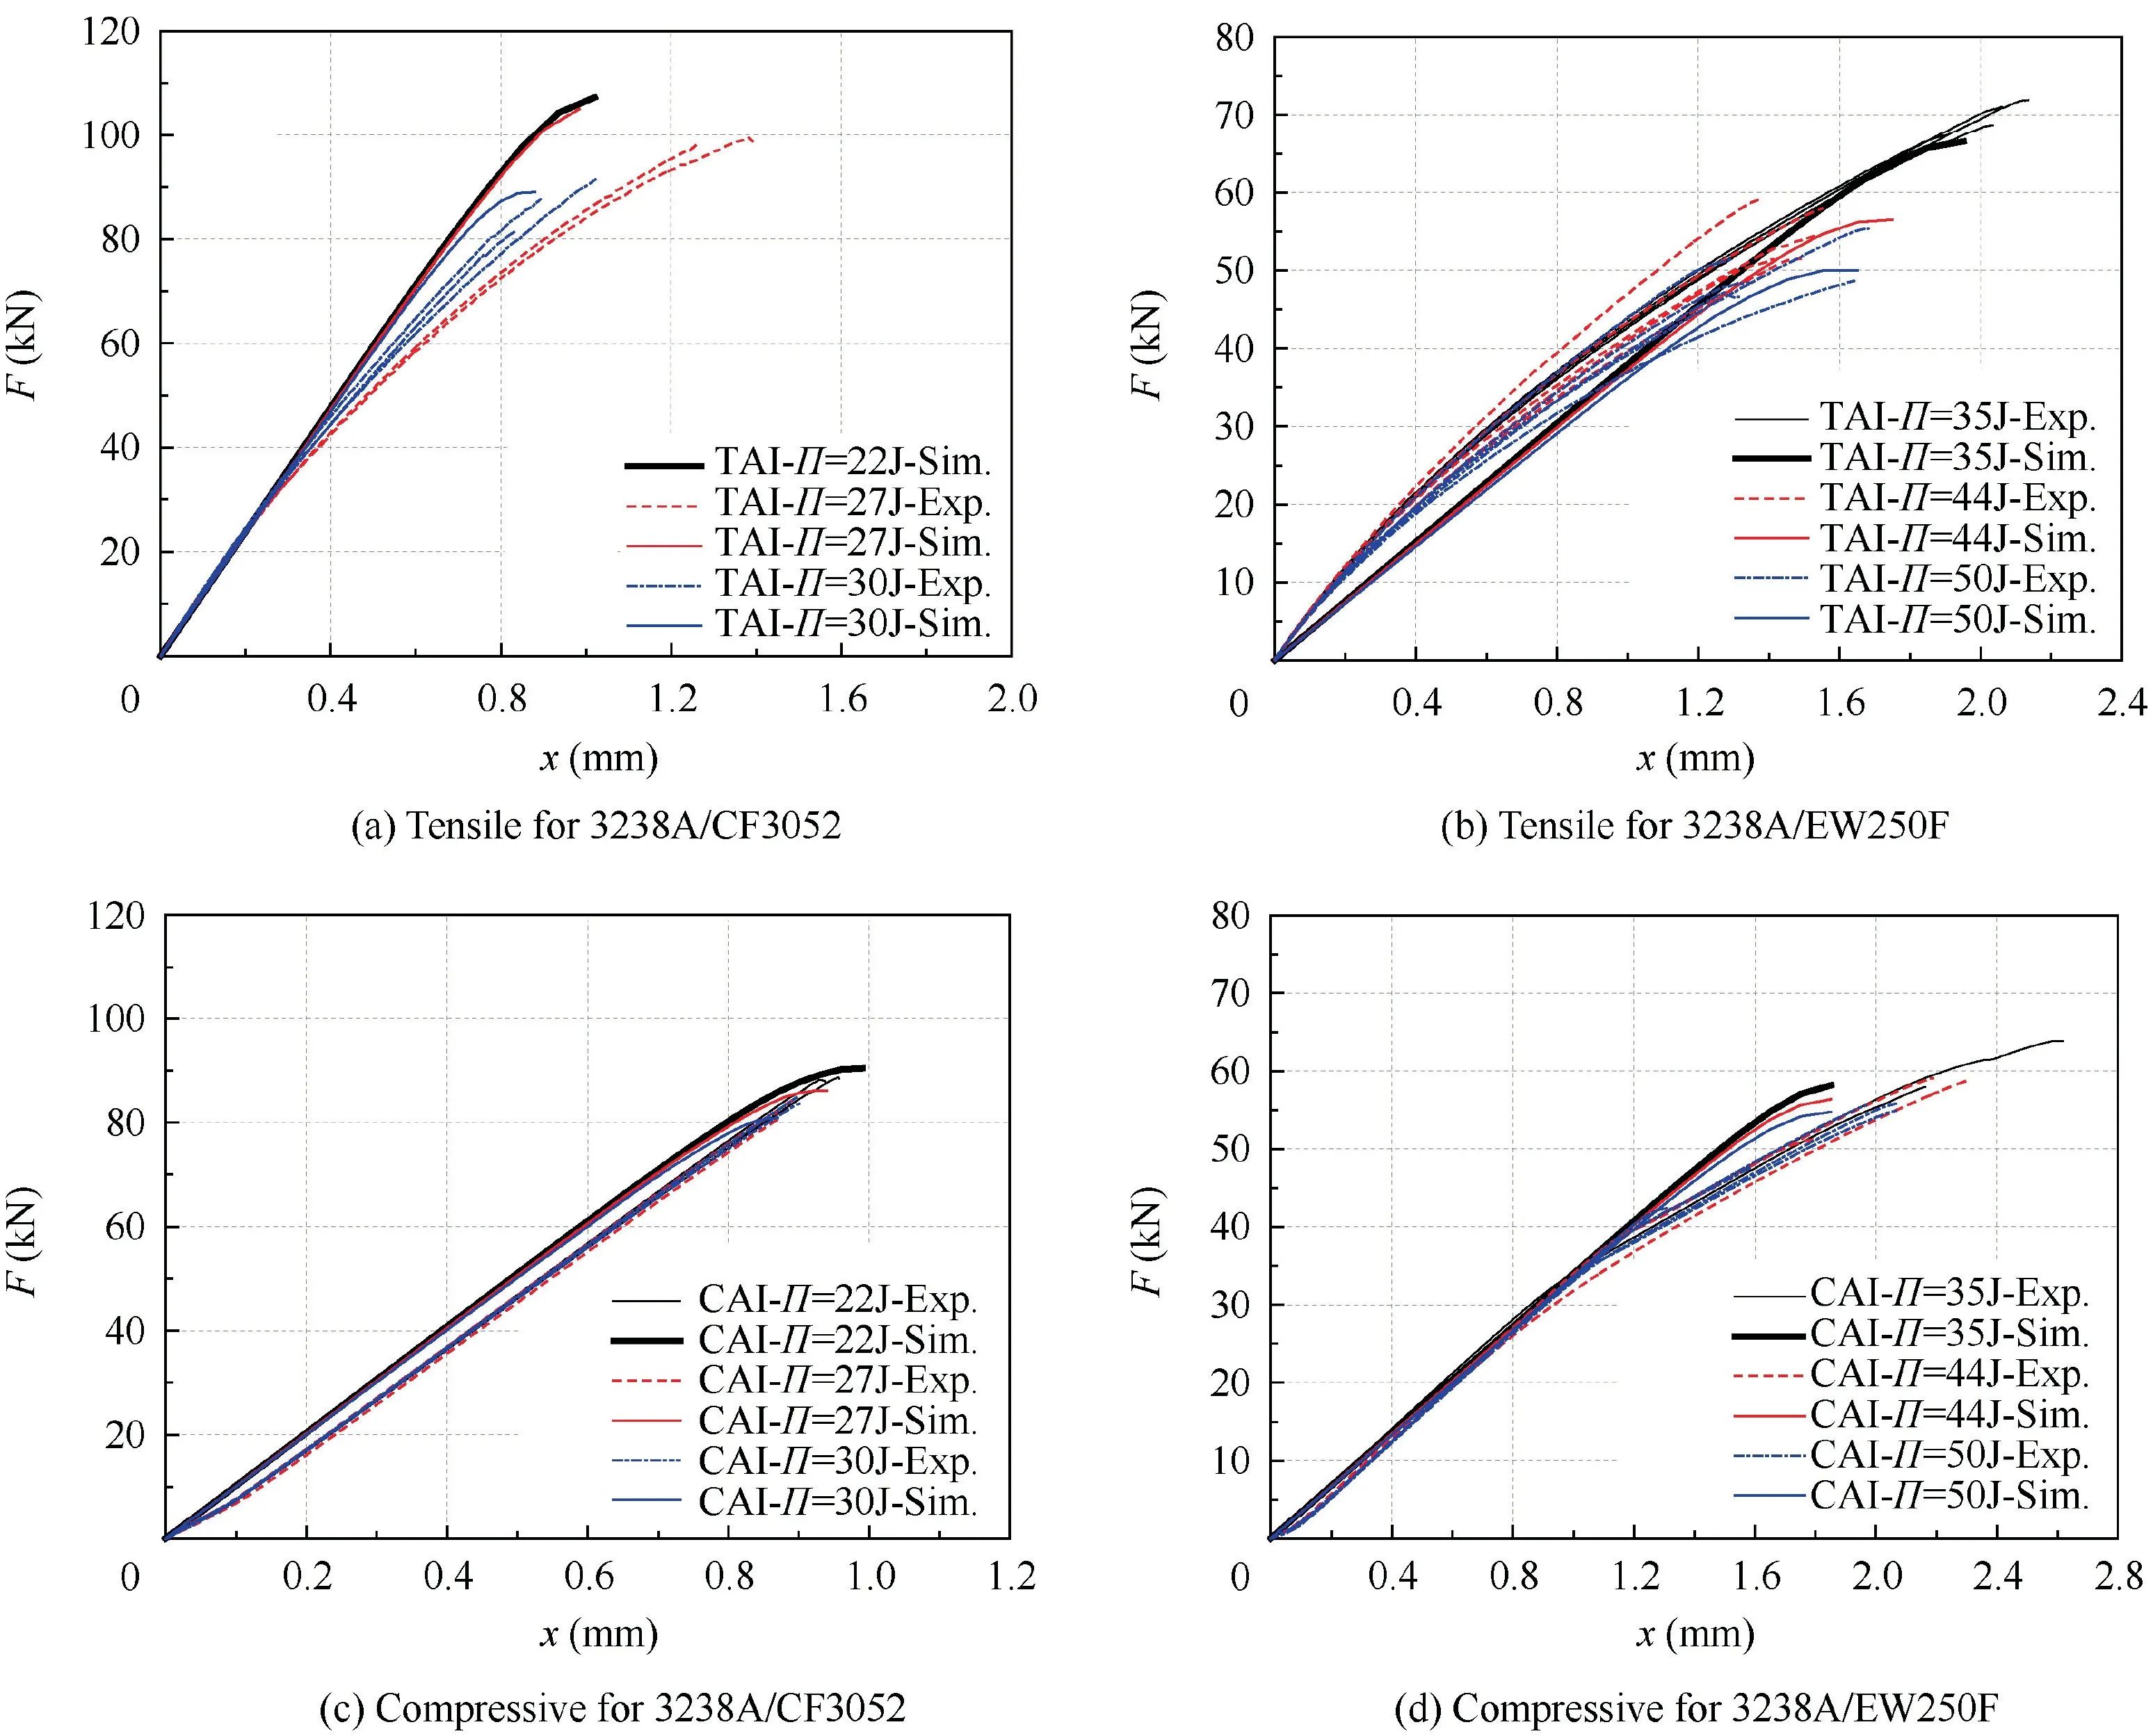
Fig. 9 Tensile and compressive load versus displacement curves.
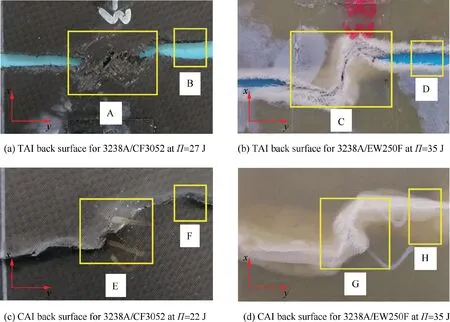
Fig. 10 Typical macroscopic tension and compression failures.

Fig. 11 Residual strength and residual strength ratio versus impact energy.
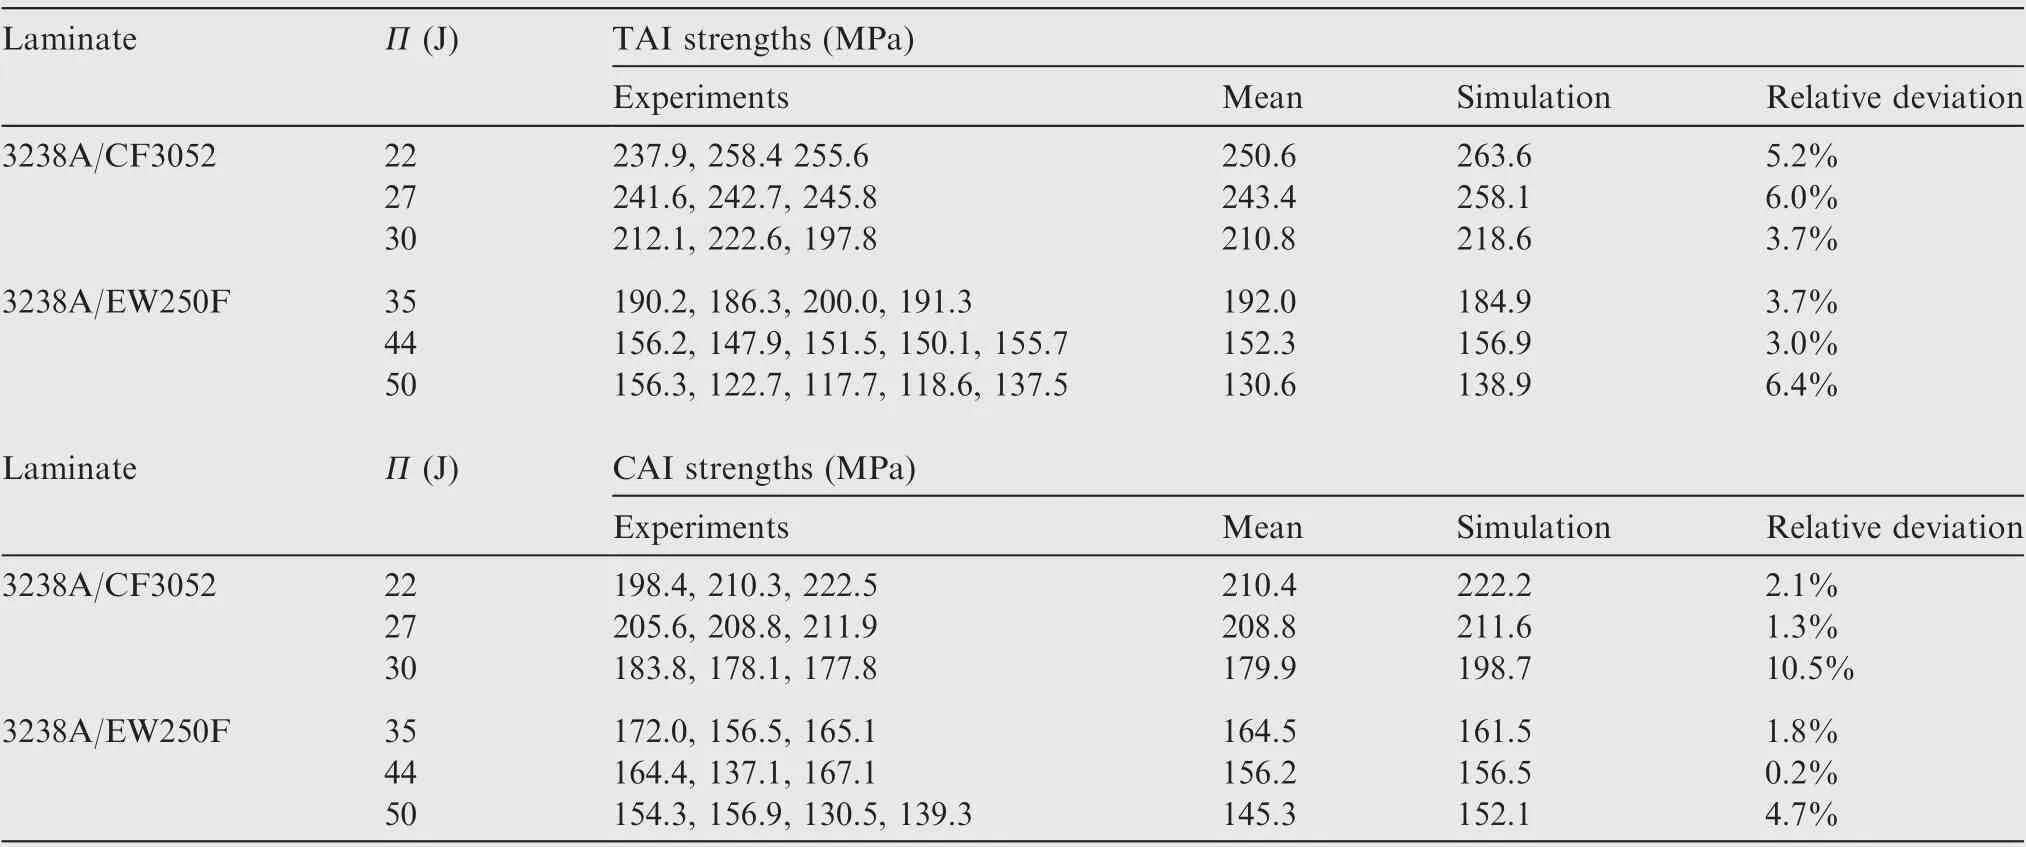
Table 6 TAI and CAI strengths of composite laminates.

Table 7 Mixed failure rule.
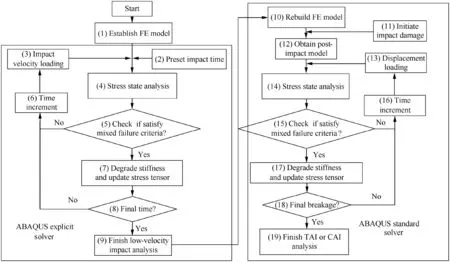
Fig. 12 Scheme flowchart of progressive damage analysis.
Unlike the LVI response, the TAI and CAI responses of composite laminate are the quasi-static process. It stands to reason that the implicit static calculation is effective and proper to simulate the TAI and CAI behaviors of composite laminate (see Fig. 12), and the implicit static TAI and CAI algorithms are written in the subroutine USDFLD of Abaqus code by using Fortran languages, in which the nodal displacement,and the stress and strain of element at the next time can be calculated from the nodal displacement, velocity and acceleration at the current time and the load vector at the next time by using the kinetic equation. Furthermore, in order to precisely solve the TAI and CAI responses,the implicit static simulation necessitates a large number of repeated iterations with longer time increment to save computation time. Otherwise, it takes a large amount of time due to the extremely small stable time increment constraint if explicit dynamic analysis is employed for simulating the TAI and CAI behaviors of composite laminate.12
During explicit dynamic LVI analysis,for each iterative calculation,the stiffness matrix for each element is degraded from its individual failure mode based on the material property degradation model (i.e., Eqs. (5)-(16)) and the stress state for each element is then updated for further identifying the failure by using the mixed failure rule until the end of impact time.Otherwise,it is necessary to continue to increase impact velocity and to add new time increments for new iterative calculation until the end of impact time. On the other hand, during implicit static TAI and CAI analysis,the impact-induced damage is first initialized by transmitting the damage variables to degrade the material properties of elements (see step (11) in Fig.12).After this,using the same method as during the above explicit dynamic LVI analysis, for each iterative calculation,the stiffness for each element is degraded from its individual failure mode based on the material property degradation model(i.e.,Eqs.(5)-(16))and the stress state for each element is then updated for further identifying the failure by using the mixed failure rule until final failure of laminate,otherwise,it is essential to continue to increase the level of static load and to add new time increments for new iterative calculation until final failure of laminate.
4.2. LVI numerical results
In order to conduct simulation to verify the experimental results, the woven laminate shown in Fig. 1 is selected to be modeled,and the local coordinate systems are set up to ensure each woven layer with correct 3D orientation, i.e., to keep three axial directions x, y and z of the coordinate system consistent with the three normal stresses (or the warp, weft and through-thickness directions) of each woven layer (see Fig. 13). Fig. 13 illustrates the definitions of three axial directions 1-3 of the coordinate system.That is,the coordinate axes x, y and z denote the warp, weft and through-thickness directions of the laminate respectively. Based on the definitions of three normal stresses, one has the definitions of three shear stress components. Continuous shell element SC8R is employed to model each layer of woven laminate(i.e.,one element on one layer in the through-thickness direction), and the number of elements is 31608.And 3D element C3D8R is used to model rigid base with a rectangular open hole,and the number of elements is 4378.In addition,rigid element R3D4 is used to model the hemispherical impactor, and the number of elements is 341. In order to availably model the inter-laminar delamination failure process under the LVI, cohesive element COH3D8 is embedded in the middle of adjacent layers with a thickness of 0.01 mm,and the total number of such elements is 28974. Thus, a 3D FE model of woven composite laminate(shown in Fig. 13) is generated by ABAQUS code to model the LVI response in association with relevant material properties listed in Tables 2, 848and 9. The loading and boundary conditions in the LVI tests are defined as the clamped and pin supports along four sides of the laminate model and along interior and exterior sides of the rigid base, and the inertial mass and impact velocity at the top of impactor for modelling the specific impact energy (see Fig. 13(b)). It is noteworthy though that in Table 9, the penalty stiffnesses are determined as follows49
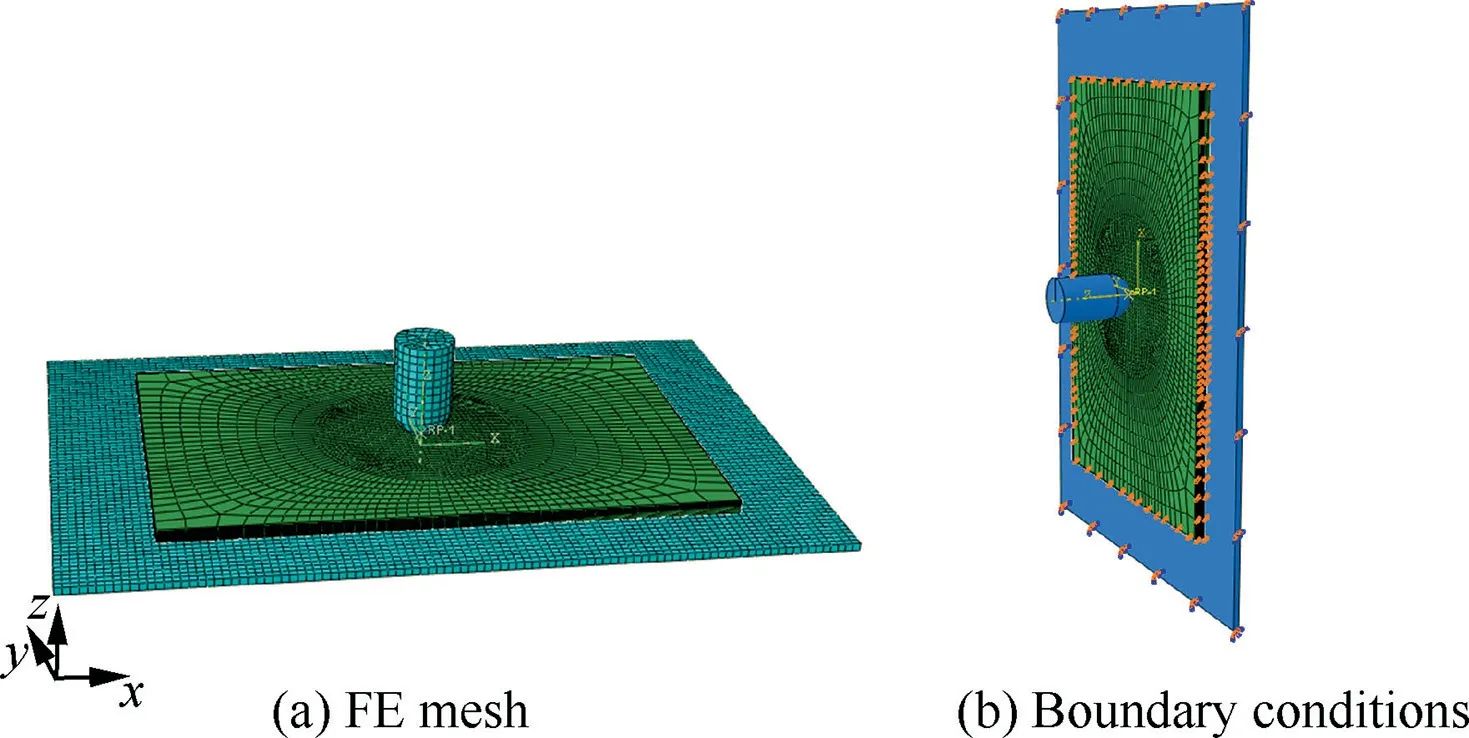
Fig. 13 LVI FE model of woven composite laminate.
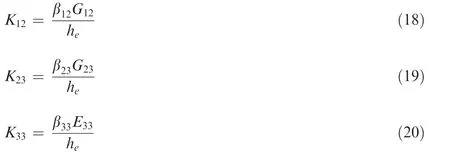
In general, the reference coefficient β12, β23and β33are greater than 50, and E33≈0.1E2t.49As a result of the effect of mesh refinement in impact indent area on the minimum ele-ment length lmin, a stable time increment Δtstis argued to be about 6.9×10⁻⁵ms. The computational details are listed in Table 10.It takes about 1.5 h to run the LVI for impact duration of 10 ms.

Table 8 Intra-laminar critical energy release rate for composites.48

Table 9 Material properties of cohesive element.

Table 10 Computational details for the LVI and TAI and CAI.

Fig. 14 Numerical LVI damage for lamina 3238A/CF3052 at ∏=27 J.
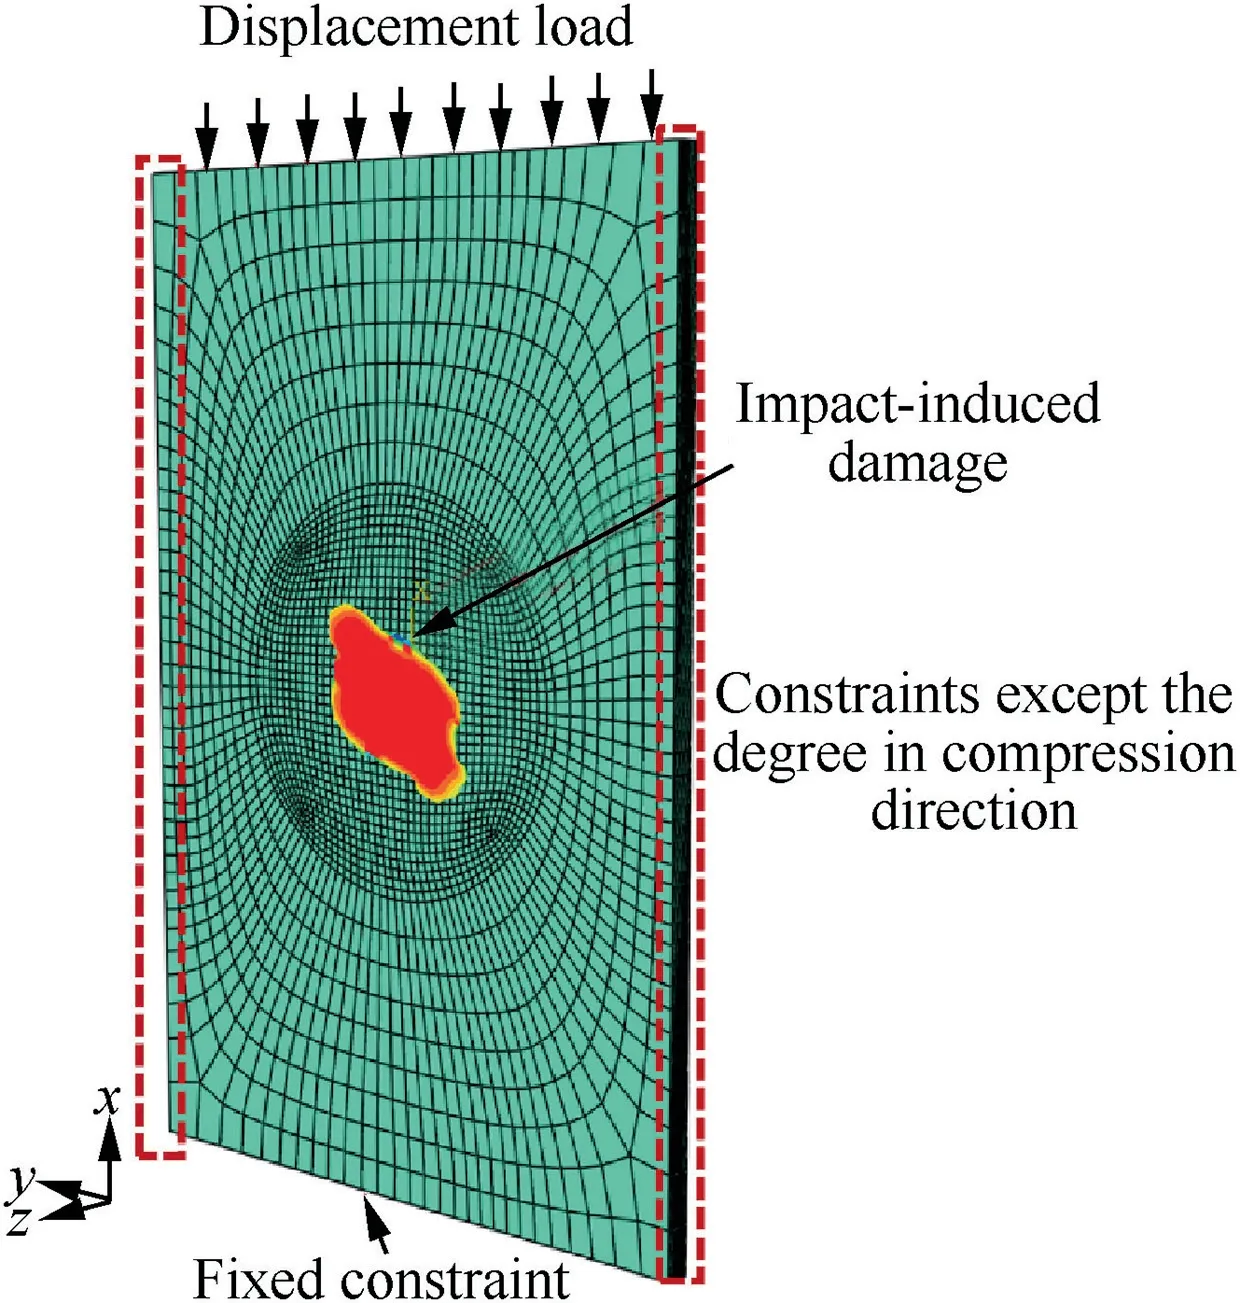
Fig. 15 FE model for TAI and CAI modelling.
Fig.14 shows the simulated results for LVI damage of lamina 3238A/CF3052 at 27 J. From Fig. 14, it can be seen that the LVI damage footprints for intra-laminar failures of warp and weft fibres and for inter-laminar delamination at the top four layers, these inter-layers can be deemed as the circle pattern. In addition, the majority of intra-laminar damage are located at the top and bottom layers, whereas the maximum delamination damage occurs in the middle inter-laminate.From the simulations (shown in Figs. 4, 5 and 7 and Tables 3-5),it is apparent that the simulations are in good agreement with the experiments. The maximum relative deviations between simulations and experiments on impact damage area,threshold force, maximum peak force, peak deflection and absorbed energy are respectively 19.9%, 9.8%, 25.0%, 3.5%and 22.6% for lamina 3238A/CF3052, whereas those are separately 7.5%, 13.5%, 4.2%, 3.9% and 23.7% for lamina 3238A/EW250F. Consequently, it is argued that the explicit dynamic LVI analysis based on the aforementioned progressive damage model can effectively simulate progressive damage LVI process and accurately predict the LVI behaviors for woven composite laminates.
4.3. TAI and CAI numerical results
In light of the aforementioned simulations of progressive damage LVI process, the FE model can be obtained for modelling progressive damage TAI and CAI behaviors of woven composite laminate (shown in Fig. 15), and the numbers of SC8R and COH3D8 elements are 31,608 and 28,974, respectively. The bottom of laminate is fully fixed and tensile force is applied on the top of laminate by tensile displacement loading in the TAI behavior analysis. In contrast, in the CAI behavior analysis, the bottom of laminate is also fully fixed and two sides of laminate are simply supported to model the boundary constraint of anti-buckling device, and compressive force is applied on the top of laminate by compressive displacement loading.The relevant properties of material and cohesive element are respectively listed in Tables 2, 8 and 9, and it just costs about 0.5 hours to simulate the TAI or CAI process(see Table 10).
Fig. 9 and Table 6 show the tensile and compressive load versus displacement curves for post-impact woven composite laminates using implicit static progressive damage analysis,and almost predictions correlate well with the experiments.The maximum relative deviation between simulations and experiments is 6.0% for lamina 3238A/CF3052 on the TAI strength, but 3.7% for lamina 3238A/EW250F. On the other hand, the maximum relative deviation between simulations and experiments is 10.5% for lamina 3238A/CF3052 on the CAI strength, but 4.7% for lamina 3238A/EW250F. Needless to say, implicit static TAI or CAI analysis based on progressive damage model is argued to availably simulate progressive damage TAI and CAI process and accurately predict progressive damage TAI and CAI behaviors of woven composite laminates. Noticeably, there is a certain difference between the predicted and experimental curves for the TAI on lamina 3238A/EW250F(shown in Fig.9(b))and for the CAI on lamina 3238A/CF3052 (shown in Fig. 9(c)). The primary reasons are likely those: i) the woven glass fibre laminate subjected to tension always occurs the nonlinear characteristic. However, only global linear elastic load versus displacement relationship can be modelled in the FE model, causing the variation of predictions from the experiments.ii)The clearance between the CAI fixture and the specimen often leads to a stiffness loss of laminates during the CAI tests. Nevertheless, the ideal constraints is generally applied in the FE model,resulting to the higher predicted stiffness than the experimental results.

Fig. 16 Numerical CAI damage for lamina 3238A/CF3052 at ∏=22 J.
Fig. 16 presents the numerical CAI damage footprints for lamina 3238A/CF3052 at 22 J. From Fig. 16, it can be observed that fibre breakage in each intra-laminate and inter-laminar delamination in each inter-laminate usually propagate perpendicular to the loading direction from impact-induced damage region to both edges of laminate.This result correlate well with experimental observation(see Fig.10(c)).
From the above LVI, TAI and CAI modelling, it is argued that the modified progressive damage model presented in this paper is a valid and rational basis for explicit dynamic LVI analysis and implicit static TAI and CAI analysis of woven composite laminates. Using the modified model, progressive damage LVI, TAI and CAI behaviors of woven composite laminates could be predicted only using basic material properties and geometrical dimensions.
5. Conclusions
This work presents experimental and numerical study on progressive damage LVI, TAI and CAI behaviors of woven composite laminates. Significant conclusions from the study are three-fold:
(1) Three regions exist on the contact force versus time curves for the LVI. Almost peak deflections, circular damage areas, absorbed energies and absorbed energy ratios for both types of laminates increase with the increase in impact energy, while the threshold force is independent of the level of impact energy;and the maximum peak force slowly increases for woven glass fibre lamina 3238A/EW250F, but slightly reduces for woven carbon fibre lamina 3238A/CF3052 with the increase in impact energy.
(2) The TAI and CAI strengths for both types of laminates decrease with the increase in impact energy. And the TAI and CAI properties more clearly decrease while the impact damage area more significantly increases with the increase in impact energy for woven carbon fibre lamina 3238A/CF3052 than for woven glass fibre lamina 3238A/EW250F,demonstrating that woven carbon fibre lamina 3238A/CF3052 are more sensitive to impact energy than woven glass fibre lamina 3238A/EW250F.
(3) A modified progressive damage model is presented for explicit dynamic LVI analysis and implicit static TAI and CAI analysis. The progressive damage LVI, TAI and CAI behaviors of woven composite laminates are simulated based on the new model and only using basic material properties and geometrical dimensions. Good agreements have been achieved between predictions and experiments, demonstrating the effective usage of proposed model.
Acknowledgements
This project was supported by the National Natural Science Foundation of China (No. 51875021).
 CHINESE JOURNAL OF AERONAUTICS2020年10期
- CHINESE JOURNAL OF AERONAUTICS的其它文章
- A novel surrogate modeling strategy of the mechanical properties of 3D braided composites
- A user-friendly yield criterion for metals exhibiting tension-compression asymmetry
- Aerodynamic characteristics of morphing wing with flexible leading-edge
- High cycle fatigue failure with radial cracks in gears of aero-engines
- Motion equations of hemispherical resonator and analysis of frequency split caused by slight mass non-uniformity
- Light weight optimization of stratospheric airship envelope based on reliability analysis
