A fault diagnosis model based on weighted extension neural network for turbo-generator sets on small samples with noise
Tihun WANG, Jiyun WANG, Yong WU, Xin SHENG
a College of Mechanical and Electrical Engineering, Nanjing University of Aeronautics and Astronautics, Nanjing 210016, China
b Department of Business Strategy and Innovation, Griffith University, Gold Coast Campus, QLD 4222, Australia
c School of Business, Jiangsu Open University, Nanjing 210036, China
KEYWORDS Fault diagnosis;Samples with noise;Small samples learning;Turbo-generator sets;Weighted Extension Neural Network
Abstract In data-driven fault diagnosis for turbo-generator sets, the fault samples are usually expensive to obtain,and inevitably with noise,which will both lead to an unsatisfying identification performance of diagnosis models. To address these issues, this paper proposes a fault diagnosis model for turbo-generator sets based on Weighted Extension Neural Network (W-ENN). WENN is a novel neural network which has three types of connection weights and an improved correlation function. The performance of the proposed model is validated against Extension Neural Network(ENN),Support Vector Machine(SVM),Relevance Vector Machine(RVM)and Extreme Learning Machine (ELM) based models. The results indicate that, on noisy small sample sets, the proposed model is superior to the other models in terms of higher identification accuracy with fewer samples and strong noise-tolerant ability. The findings of this study may serve as a powerful fault diagnosis model for turbo-generator sets on noisy small sample sets.
1. Introduction
Turbo-generator set is a key equipment of power system,which will cause huge economic loss once it breaks down.Much study in recent years has focused on data-driven machinery fault diagnosis methods, such as Neural Networks(NN),1,2Support Vector Machines (SVM),3-7Extension Neural Networks (ENN),8,9and Deep Learning (DL),10,11which are widely used promising methods for fault diagnosis.Models based on these methods are trained on a large amount of operating data of turbo-generator sets off-line, before they are applied for diagnosis on-line. In practical industrial fields,however, it is difficult or expensive to collect massive labeled fault data, which will cause the small sample fault diagnosis problem.12And as a result, the performances of these models could be unsatisfying because of the limited fault data mixing with too many normal samples (the imbalanced data). Therefore, there has been a considerable interest in establishing small sample fault diagnosis models of turbo-generator sets.
Small sample fault diagnosis problem refers to how to train a machine learning model that can effectively identify these faults under the condition that only a few fault training samples of the target are given.13The difficulty lies in the fact that the information of the fault data set is not enough to describe all the features of the fault, so it is necessary to find a way to maximize the information of the small sample fault dataset.14The main efforts to address the problem could be divided into two aspects on preprocessing techniques and classification algorithms for small samples learning.15
Preprocessing techniques include resampling methods and feature selection and extraction methods. To rebalance the sample space, over-sampling methods, under-sampling methods and hybrid methods are often employed as three main resampling methods. For example, Liu et al.16applied undersampling methods to rebalance the data set, and trained an optional Support Vector Machine as the classifier for blast furnace fault diagnosis. Based on Extreme Learning Machine(ELM), Mao et al.17proposed a confident oversampling and under-sampling process to establish the online sequential prediction model for bearing fault diagnosis. And the Synthesis Minority Oversampling Technique (SMOTE),18an optimized sampling technique was applied in induction motors fault diagnosis based on the Adaptive Boosting Algorithm (AdaBoost).However, over-sampling could lead to over fitting and influence expanding of noise data by just copying fault samples,whilst under-sampling could cause information loss by removing normal samples.For feature selection and extraction methods, Jin et al.19adopted unsupervised learning algorithms to reduce the dimensions of the dataset,which was 13 dimensions representing different health conditions of machines, and introduced a weighted local and global regressive mapping algorithm for machine fault diagnosis.
Classification algorithms for small samples learning attempt to build a classifier that can provide a better solution for small sample fault diagnosis problems. And three main methods of this are introduced below:ensemble methods,algorithmic classifier modifications and deep learning. Classifier ensembles by bagging and boosting have become a popular solution method for small sample fault diagnosis problems.For example, Liu and Li20proposed Fisher criterion feature selection for Easy Ensemble to solve the small samples problem in bearing fault diagnosis.Moreover,Santos et al.21found that a Rotation Forest ensemble of C4.4 decision trees, modifying the training phase of the classifier with a cost-sensitive approach,was the most suitable prediction model for gearbox fault diagnosis. For algorithmic classifier modifications, many effective attempts have been made to improve the learning ability of existing classification algorithms.Duan et al.22developed a machinery fault diagnosis model based on Support Vector Data Description(SVDD),which was formulated with Binary Tree for multi-classification problems. Yi et al.23and Chen and Yan24also proposed fault diagnosis models based on improved Support Vector Machine (SVM). And for deep learning,the representative methods are Generative Adversarial Networks (GAN) and transfer learning. Combined GAN and Stacked Denoising Autoencoders (SDAE), Wang et al.25enhanced the quality of generation samples and the ability of planetary gearbox fault diagnosis. Chen et al.26extended the Least Square Support Vector Machine(LSSVM)to implement a transfer learning strategy, and achieved a better diagnostic performance on bearing fault diagnosis of insufficient labeled samples. Wu et al.27and Zheng et al.28also utilized transfer learning to small sample machinery fault diagnosis.
However,the obtained small sample fault data could inevitably contain noise, making the limited information it gives more confusing, and hardly any attention has been paid to the noise-tolerant ability of small sample fault diagnosis models of turbo-generator sets. Thus, a further question arises when considering small sample fault diagnosis mixed with noise:can we build a diagnosis model for turbo-generator sets which could handle the problem of noisy small sample sets at the same time?Aiming at the above issues,this paper proposes a new fault diagnosis model based on weighted extension neural network(W-ENN).Four comparative experiments are carried out in order to assess the diagnosis performances of the proposed model against Extension Neural Network (ENN),Support Vector Machine (SVM), Relevance Vector Machine(RVM)and Extreme Learning Machine(ELM)based models.It could be inferred from the results that W-ENN based model outperforms the other models in terms of higher diagnosis accuracy with fewer samples and more stable noise-tolerant ability on noisy small sample sets.
Compared with the previous work about fault diagnosis on noisy small sample sets, the main contributions of this paper rest on two folds:
1) Extending the theory of ENN, a novel neural network(W-ENN)is developed,which has three types of connection weights and an improved correlation function to better describe the distance between samples.
2) A new fault diagnosis model for turbo-generator sets is proposed based on W-ENN, which could achieve a better performance on small sample fault diagnosis with noise, manifesting in higher diagnosis accuracy with fewer samples and a strong noise-tolerant ability.
The remainder of the paper is organized as follows. The ENN and developed W-ENN are presented in Section 2. In Section 3, the proposed fault diagnosis model for turbogenerator sets is discussed in detail. Section 4 demonstrates the effectiveness of the proposed model experimentally through comparisons with the other 4 models. Finally, Section 5 concludes this paper.
2. Weighted extension neural network
Weighted extension neural network(W-ENN)is a novel neural network based on extension neural network(ENN). ENN29is a neural network with a fixed number of neurons,two connection weights and the learning rate as the only one hyperparameter. By adding a new connection weight and redesigning the correlation function to describe the distance between samples,W-ENN is developed based on ENN,which also has a fixed number of neurons and one hyper-parameter,but three types of connection weights and a new distance evaluation function.
2.1. Structure of weighted extension neural network
2.1.1. Structure of ENN
The extension neural network is a combination of neural network and extension theory. The extension theory gives a new way to describe matters,namely,matter-element models.More importantly, it provides a novel way to measure the distance between a point and an interval, which is Extension Distance(ED). ENN utilizes ED instead of Euclidean distance to measure the similarities among the recognized data and the cluster domains and get the classification results finally.
The structure of ENN is a network with only two layers of double weights,which is shown in Fig.1.The total number of input nodes, n, stands for the number of data features, and likewise, the number of output nodes, nc, is determined by the number of classification results. There are two connection weights between input nodes and output nodes, which are the upper and lower bounds of features in matter-element models.During the training process,only one output node is activated at a time to indicate the classification result.
2.1.2. Structure of W-ENN
W-ENN is improved on the basis of the extension neural network. It has three layers with three connection weights, which is shown in Fig. 2. Between input nodes and hidden-layer nodes, there are two connection weights, which are the upper and lower bounds of features in matter-element models. For hidden-layer nodes and output nodes, there is only one connection weight,which is the weights of features calculated from training data. In all, W-ENN has n input nodes, nchidden nodes and only one output node,where n is the number of features, ncis the number of classification results.
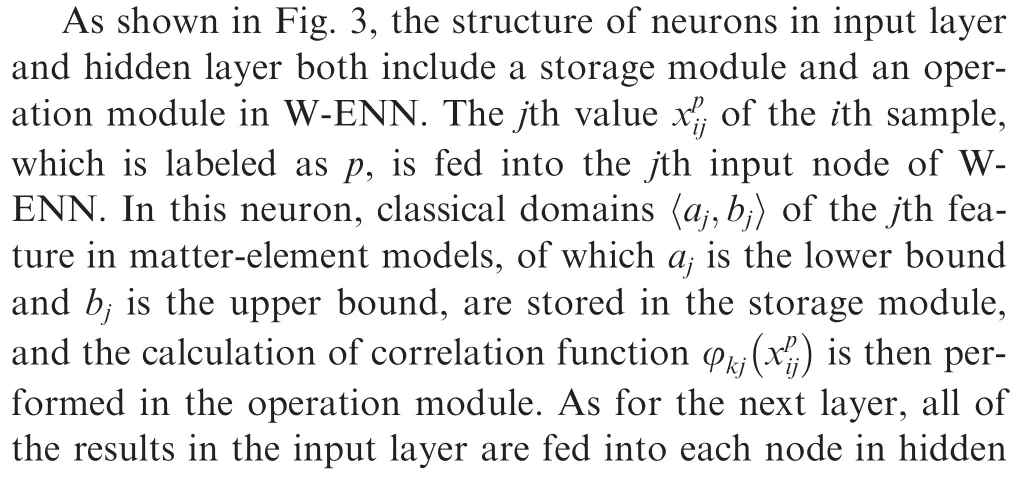
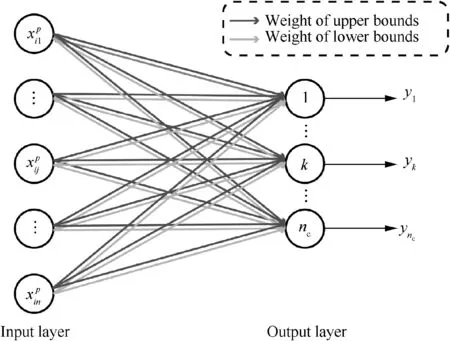
Fig. 1 Structure of extension neural network (ENN).
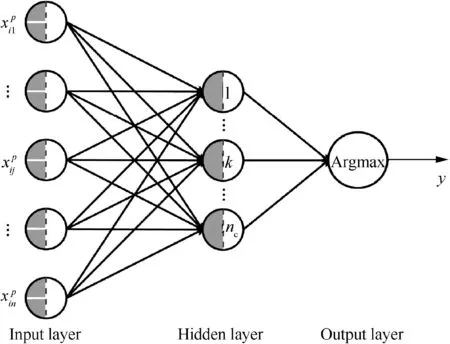
Fig. 2 Structure of weighted extension neural network (WENN).

2.2. Improved comprehensive correlation function
By measuring the distances between a sample and matterelement models to get the final classification,in ENN,correlation function ED is designated based on extension distance in extension theory.However,ED ignores the different weights of features in practice, which could eventually lead to classification errors.In this paper,a comprehensive correlation function is developed to address the shortcoming of ED in ENN.

where bkjand akjrepresent the upper and lower bound of the jth feature’s classical domain in matter-element model Mkrespectively, and zkjis the feature center of the domain.
In other words,ED measures the distance between a sample and all of the classical domains in a matter-element model,and shows high sensitivity to different distances, which is graphically presented as Fig.4.However,by considering the features equally important, it ignores the influence of different feature weights on the correlation degree.As a result,ED in ENN just adds up all the modified extension distances equally, which could lead to erroneous classifications.
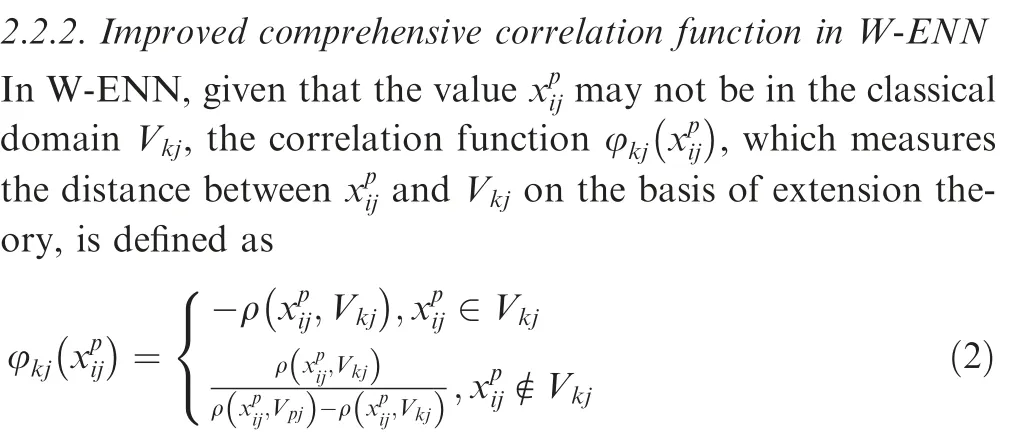
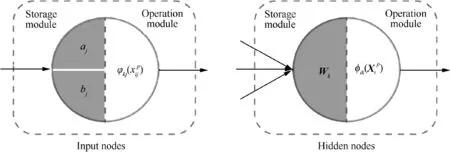
Fig. 3 Structures of input nodes and hidden-layer nodes in W-ENN.
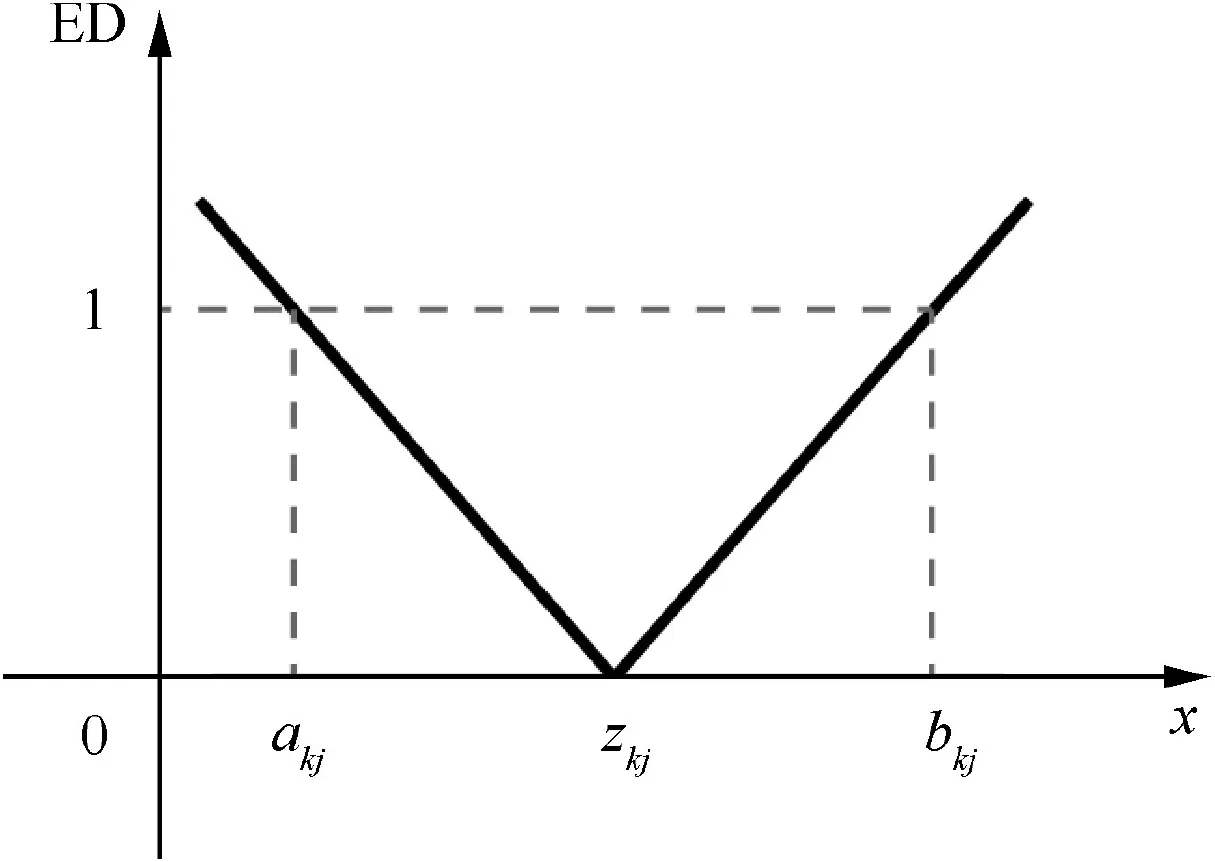
Fig. 4 Image of correlation function ED.
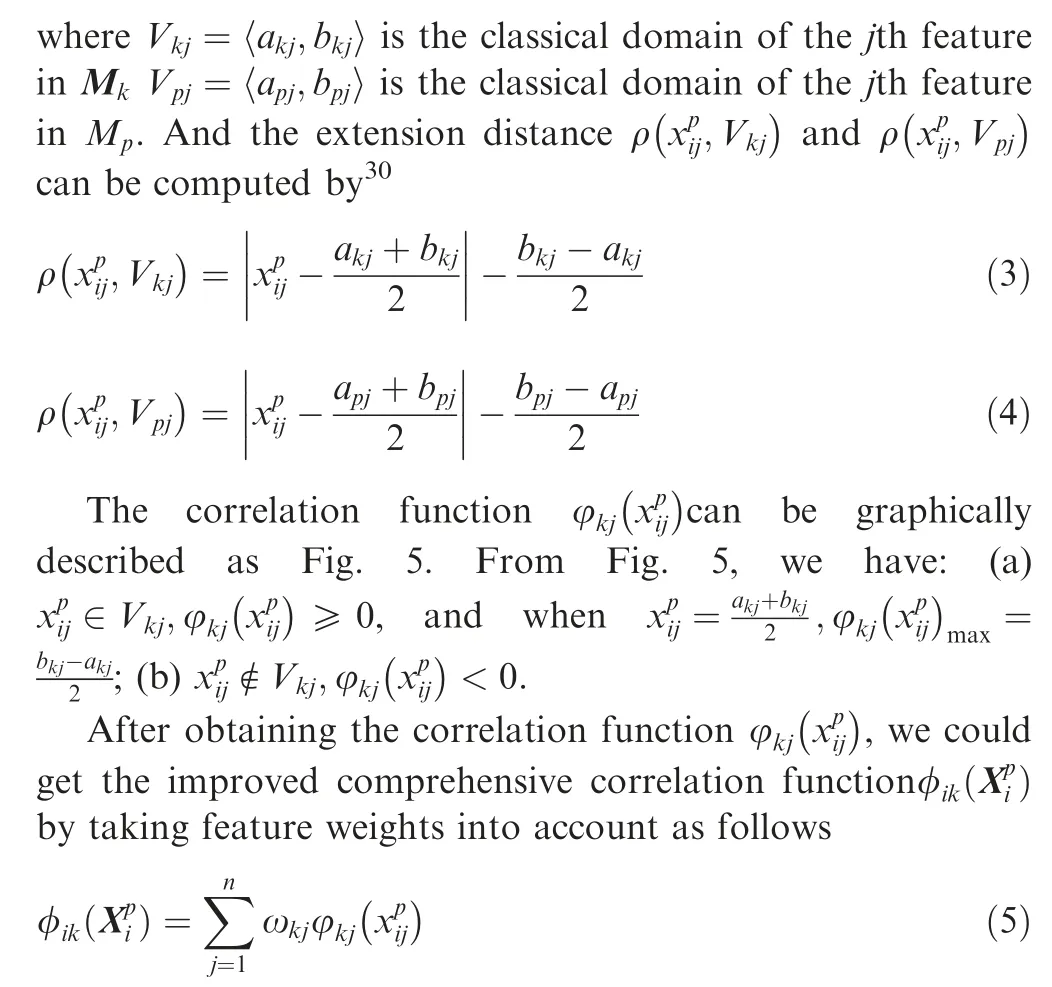
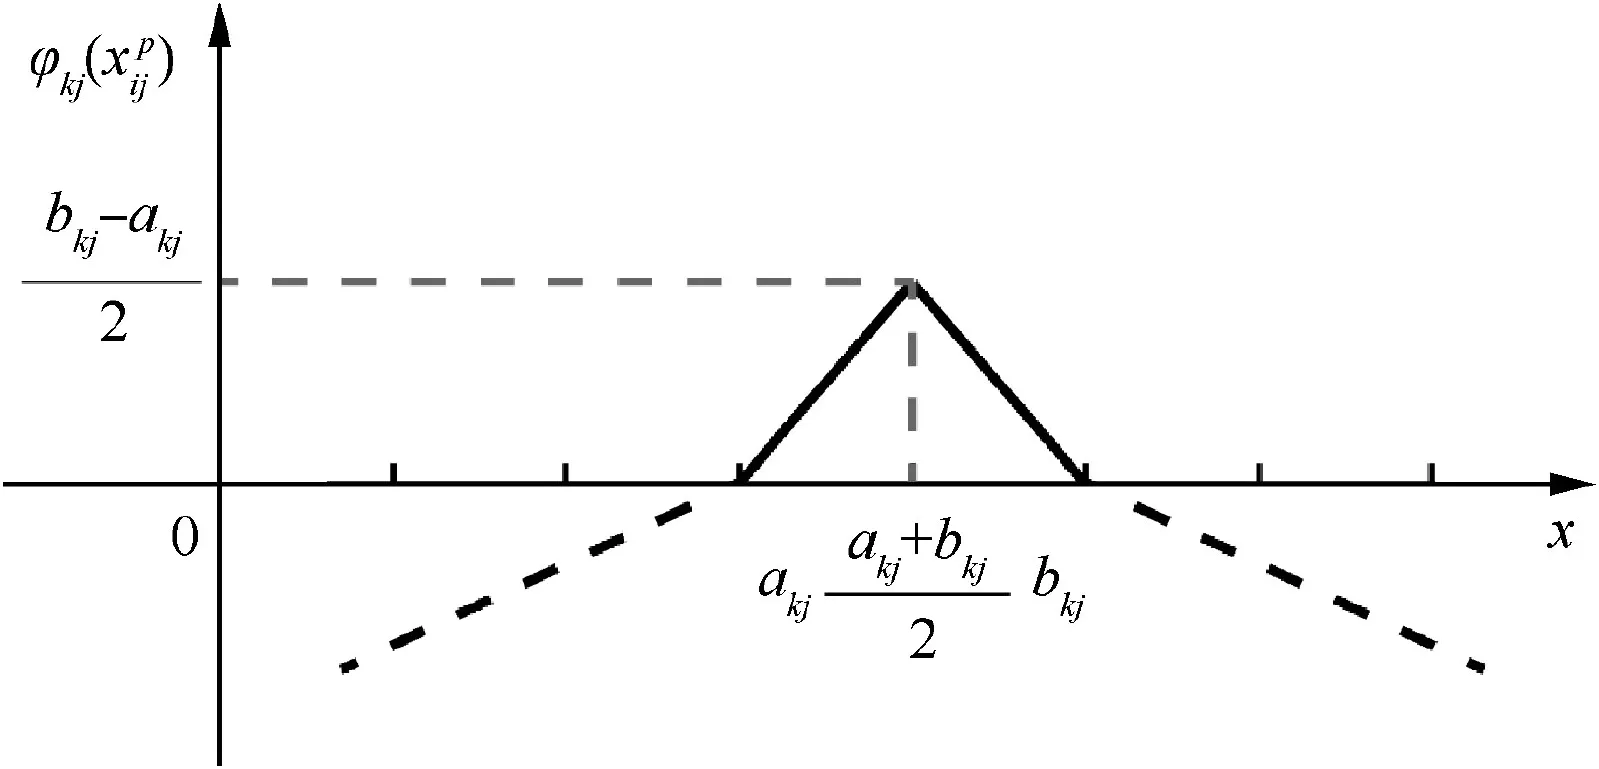
Fig. 5 Image of correlation function

2.3. Learning algorithm of W-ENN
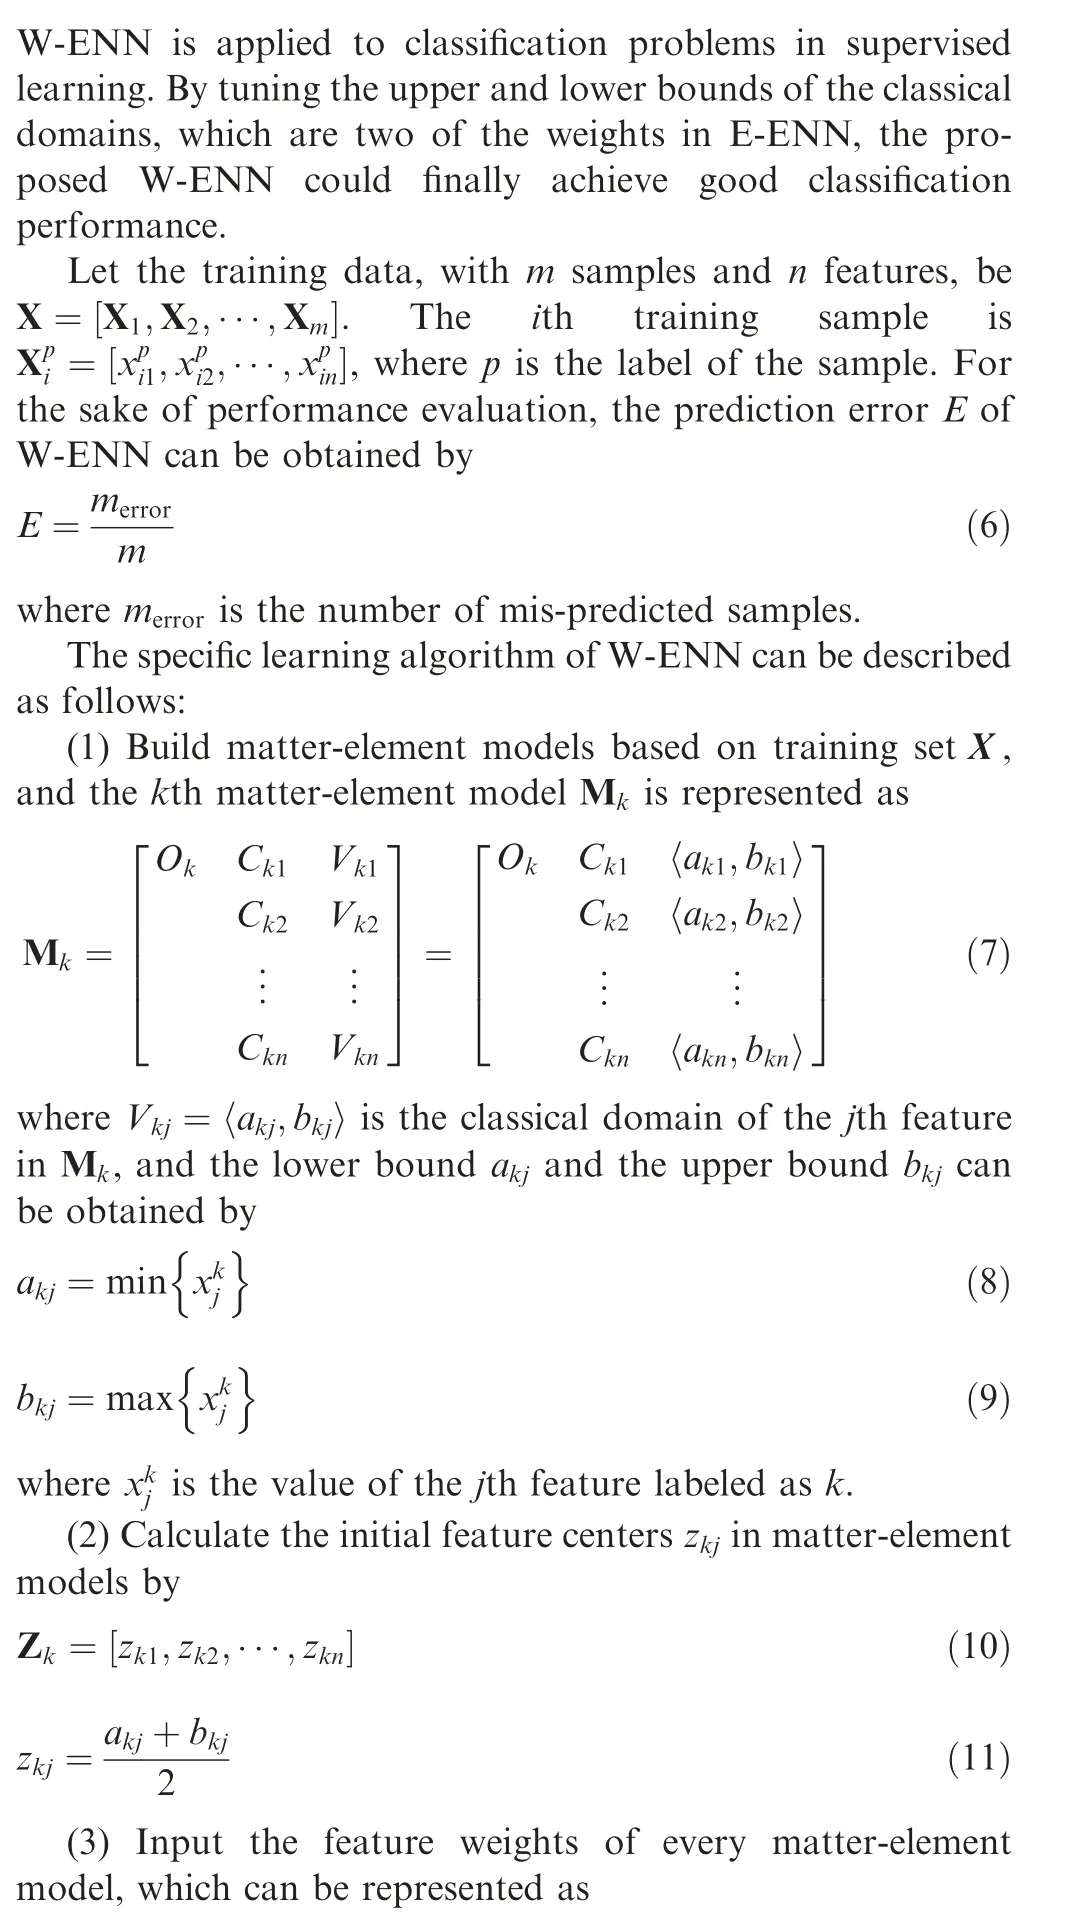
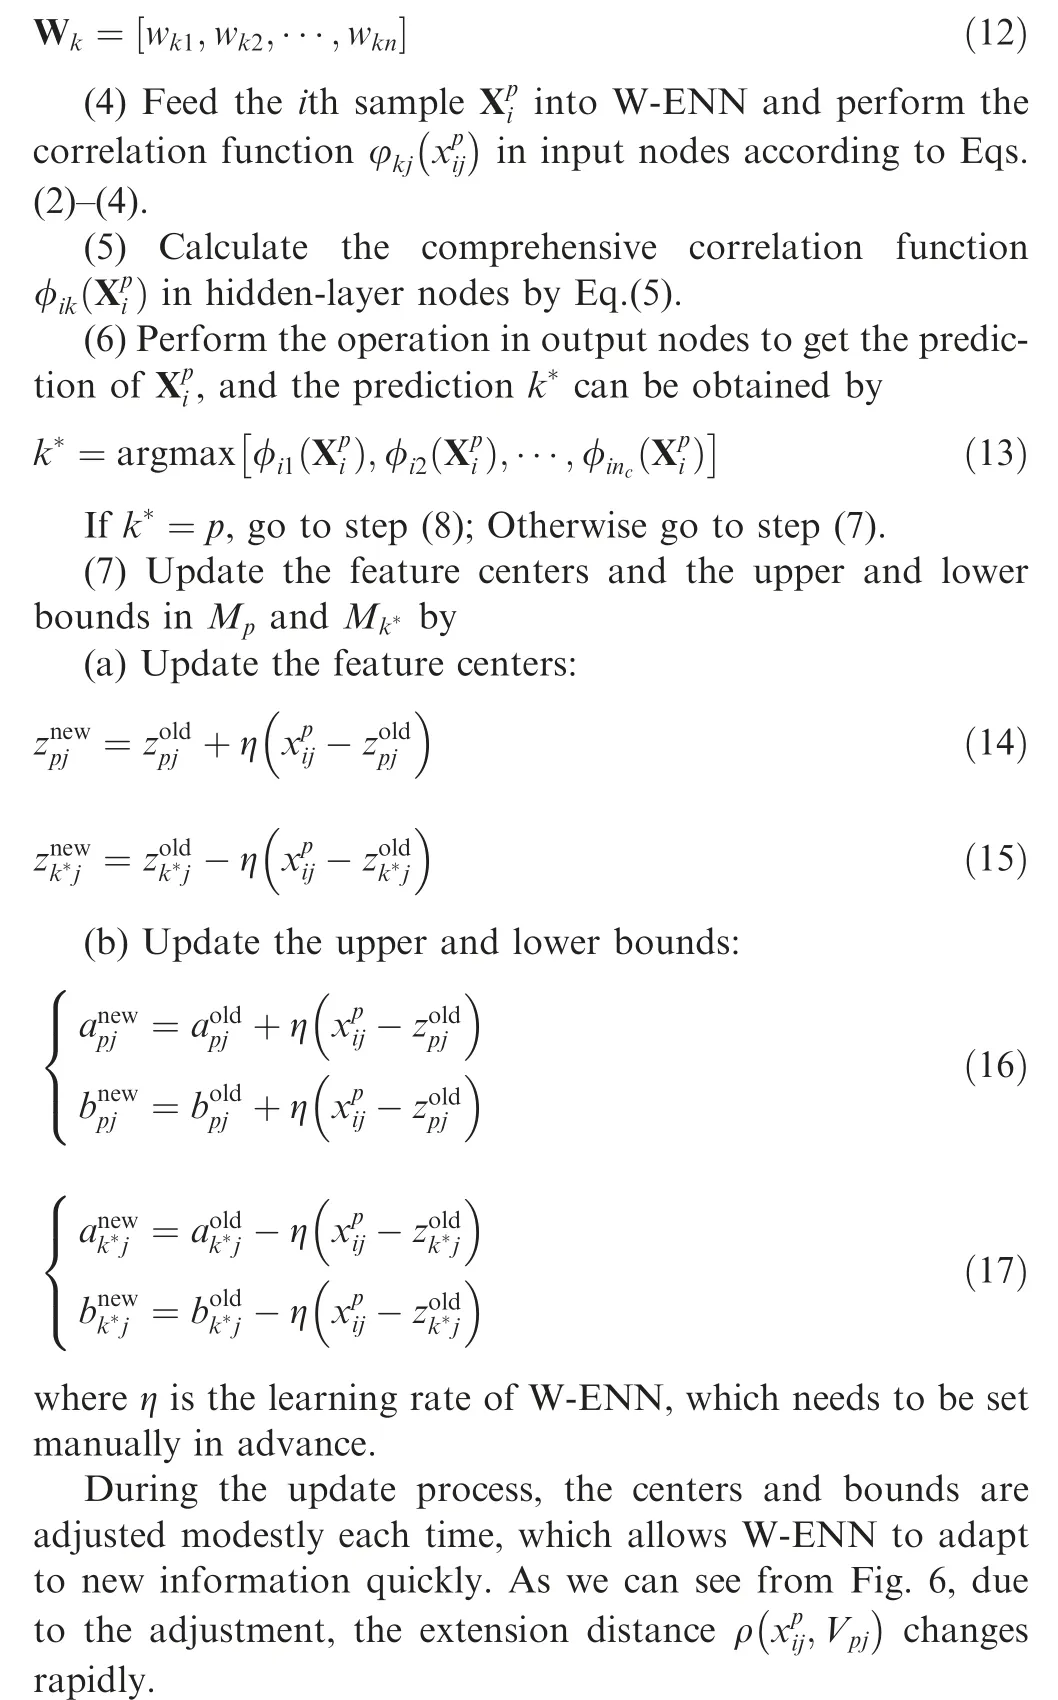
(9)Estimate whether the learning process has converged or the prediction error E has arrived at the pre-set value. If so,terminate the training. If not, return to Step (4) and go into next training epoch.
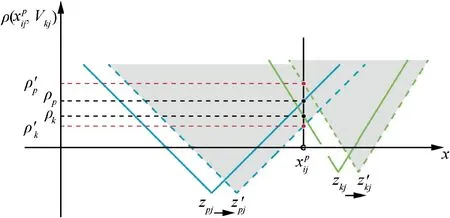
Fig.6 Change of with centers and bounds adjustment during update process.
3. Proposed fault diagnosis model of turbo-generator sets based on W-ENN
3.1. Feature selection
Due to the good ability to describe common faults of turbogenerator sets, the vibration frequency, which can be directly obtained from the monitoring system, plays an important role in fault diagnosis of turbo-generator sets. Based on the vibration frequency of turbo-generator sets, many attempts have been made to design fault features, such as time-domain features and frequency-domain features, and feature selection methods, such as Empirical Mode Decomposition (EMD),Local Mean Decomposition(LMD)and Wavelet Transformation (WT). Among which, Fast Fourier Transform (FFT)31is one of the most widely used and well-established methods for turbo-generator sets fault diagnosis.When a fault occurs,new frequency components may appear and a change of the convergence of frequency spectrum may take place.And the ratio of the maximum amplitudes μ(xi) at 9 different frequency domains, which are A: (0.01-0.39) f1, B: (0.40-0.49) f1, C:0.50 f1, D: (0.50-0.99) f1, E: 1.00 f1, F: 2 f1, G: (3-5) f1, H:odd f1, I: >5 f1, where f1is the rotational frequency of the turbo-generator sets and odd f1is the odd numbers of the rotational frequency, is the most used features for its easy accessibility and good descriptive ability of fault conditions.It should be noted that, the feature is susceptible to noise, especially for small sample fault diagnosis, which may result in a poor performance on some mature classifiers.For the purpose of highlighting the diagnostic capability of the proposed model on small samples with noise, the feature is selected as the input feature of the model.
The ratio of the maximum amplitudes μ( xi) is defined as

where xiis the maximum amplitude at the ith frequency domain,n is the total number of the frequency domains,which equals to 9 in this paper.
3.2. Weight calculation based on extremum entropy method
To ensure the objectivity and credibility of weights, entropy method is widely used to calculate feature weights with complete data,including normalized translational entropy method(NTEM), extremum entropy method (EEM), linear proportional entropy method(LPEM),vector gauge entropy method(VGEM) and efficacy coefficient entropy method (ECEM).32By avoiding value 0 in calculation process, EEM is applied to get feature weights in this paper, which has been proven to be a better improved entropy method through preliminary experiments. In EEM, the original data is converted into the dimensionless form by extremum method,and entropy method is used to evaluate feature weights.
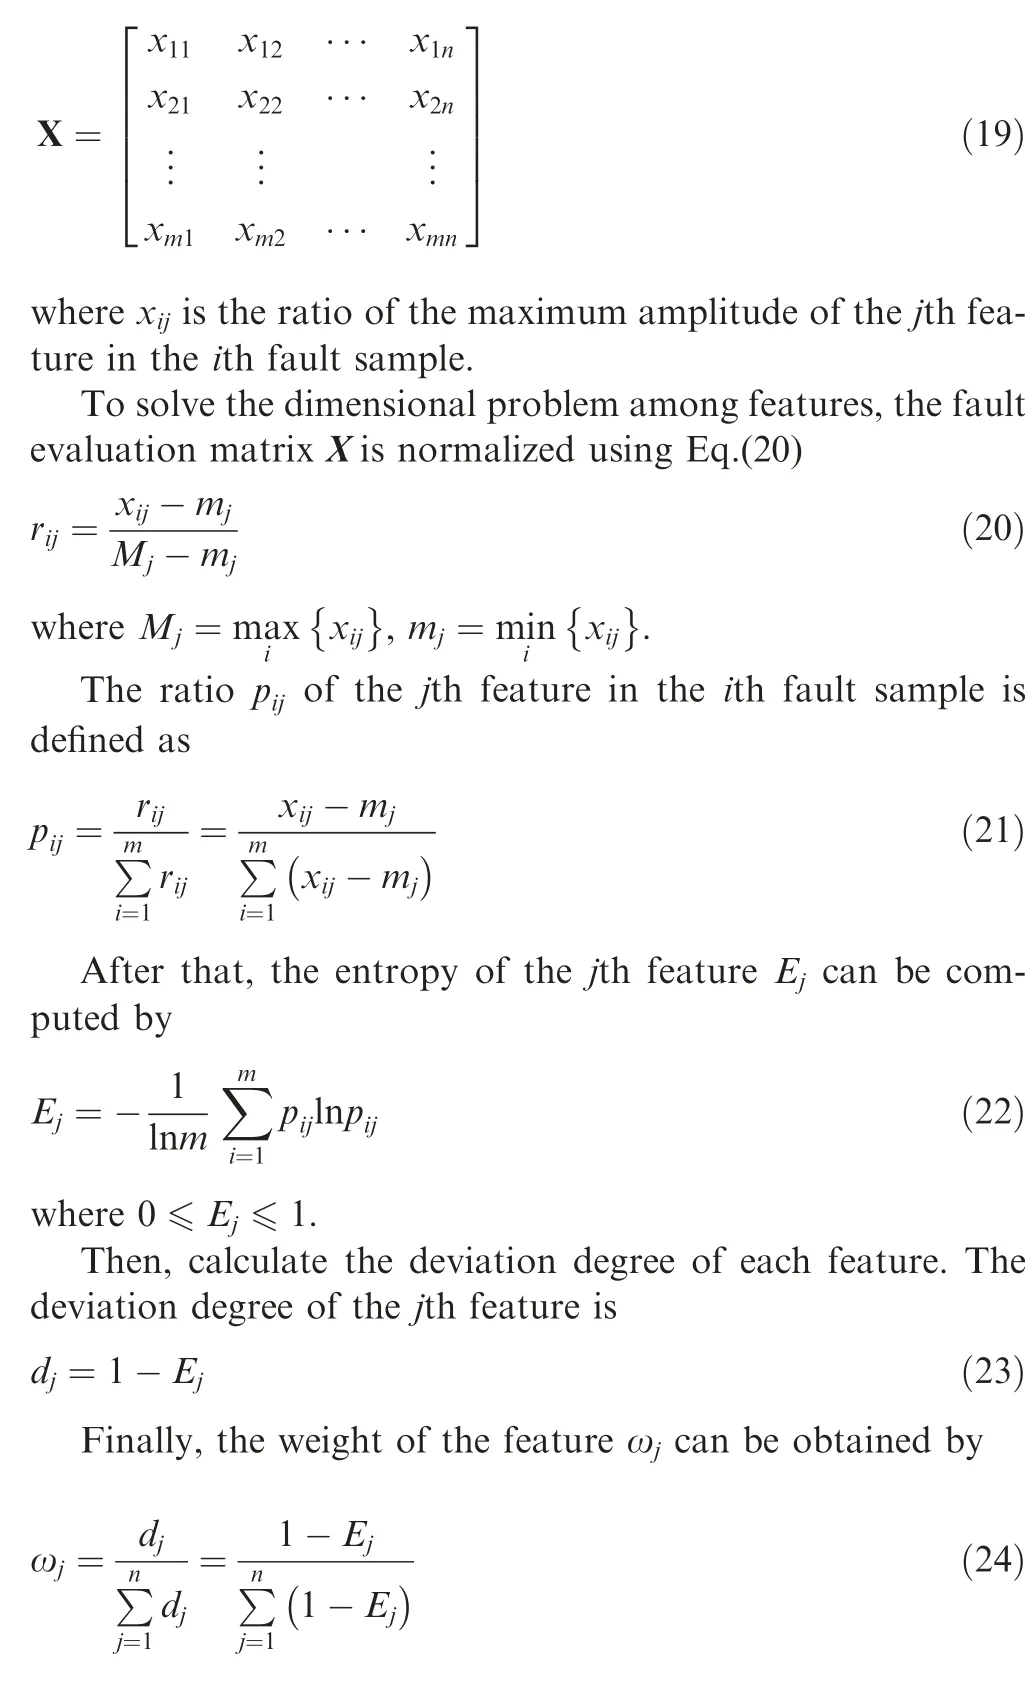
In EEM, for a fault evaluation matrix X,which is composed of m fault samples with n input features, can be described as
3.3. Proposed fault diagnosis model of turbo-generator sets
An overview of the proposed fault diagnosis model of turbogenerator sets is presented in Fig. 7, which works as follows:
In Cupid and Psyche43, Venus is jealous of Psyche s beauty and tries to have her married to the ugliest creature, but her son Cupid falls in love with Psyche and marries her instead.Return to place in story.
(1) The vibration signals of turbo-generator sets under different conditions are obtained by accelerometers.
(2) Extract features from the raw signals. Fast Fourier Transformation (FFT) is applied to get frequency spectrum from raw signals, and the ratio of the maximum amplitudes μ(xi) at 9 frequency domains is adopted to characterize the fault samples by Eq. (18).
(3) The training set, composing of the fault samples with 9 features, is segmented according to fault categories for weights calculation and fault matter-element models construction. EEM is then utilized to get the features weights according to Eqs. (19)-(24).
(4) Build the fault matter-element models by Eqs. (7)-(9)and set-up the W-ENN.The training set is then fed into the constructed W-ENN to train the fault diagnosis model using the learning algorithm in Section 2.3.
(5) Save the final weight vectors of the trained W-ENN,including the updated upper and lower bounds of 9 frequency domains in different fault matter-element models, and the weights calculated by EEM.
(6) New fault samples of turbo-generator set with the same 9 features described are input into the trained W-ENN,and the fault diagnosis is fulfilled automatically.
4. Experimental verification
Since the objective of this paper was to establish a fault diagnosis model for turbo-generator sets on noisy small sample sets, the effectiveness of the proposed W-ENN algorithm and W-ENN based model was investigated experimentally in this part, including an experiment on UCI datasets to test the performance of the proposed W-ENN algorithm,an experiment of a detailed diagnosis process of the proposed model,an experiment of effect of sample size on diagnostic models and a noise-tolerant ability experiment.
4.1. Experiment on UCI dataset
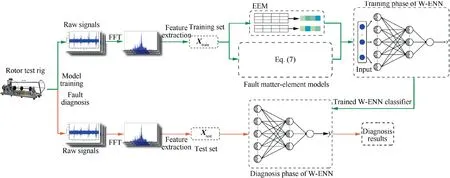
Fig. 7 Flowchart of the proposed fault diagnosis model based on W-ENN.
In order to verify the superiority of the proposed W-ENN algorithm, a comparative experiment was conducted between W-ENN and ENN by analyzing accuracy, training epochs,training time and test time on different data sizes.The detailed information about the UCI datasets we used here are shown in Table 1.
During the experiment, the training samples and test samples were chosen randomly with the scale of 15, 30, 45 and 60 each time for 10-fold cross-validation. The learning rate was set preliminarily as 0.1. Each experiment was performed randomly for 50 times to obtain the average accuracy,average training epochs,average training time and average test time. These four targets of different data sizes on ENN and W-ENN are reported in Table 2, with the average accuracy and average training epochs graphically presented in Fig. 8.
In general,the average accuracy,training time and test time of both algorithms kept rising with the increase of data sizes,and the average accuracy increased sharply when the numbers of samples varying from 15 to 30.But for the average training epochs, it went up firstly and then down, which suggests a proper data size may contribute to the minimum training epochs of W-ENN and ENN. Comparing Table 2 and Fig.8,it is obvious that a significant improvement of the average accuracy between W-ENN and ENN was obtained in all data sizes.Furthermore,W-ENN could get almost 100%accuracy with only 15 training samples, while ENN showing the accuracy of just 80%or so on the same data size,implying that 15 samples may be enough to train an effective W-ENN.Because of the additional weight calculation process in W-ENN, the average test time of W-ENN showed only a little longer than that of ENN. It should be noted that, learning rate can significantly influence the training epochs,training time and test time, which will be discussed further in Section 4.2.3.
4.2.2. Weights of W-ENN calculation
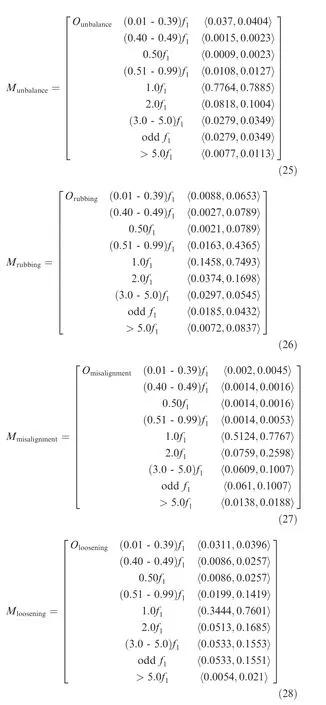
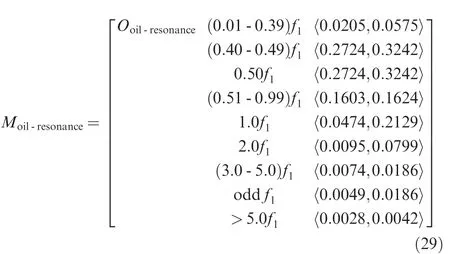
According to the training data, 5 fault matter-element models of turbo-generator sets were constructed, which is shown in Eqs. (25)-(29). To check the overlaps in classical domains,the original classical domains of 9 features in 5 fault type are presented graphically in Fig.9.As can be seen,there are more or less overlaps among classical domains presented as grey areas in Fig. 9, which could make an influence on the convergence speed and final predictions of the network.
4.2. Diagnosis process of W-ENN based model
With the intention of evaluating the diagnosis performance of the proposed model on limited data, ENN based model was constructed together with W-ENN based model, which also shows good potential in handling diagnosis problem on limited data.The results of the two models were compared in this part.
4.2.1. Experimental data
The fault data was obtained from the rotor test rig.33After FFT and normalization processing,12 fault samples in 5 categories were selected as the training data, and 5 samples as the test data. Five typical fault types of turbo-generator sets,including unbalance, rubbing, misalignment, loosening and oil-resonance, were mapped to [0, 1, 2, 3, 4] respectively. The 5 training samples and 5 test samples are shown in detail in Table 3 and Table 4.

Table 1 Detailed information about UCI datasets.
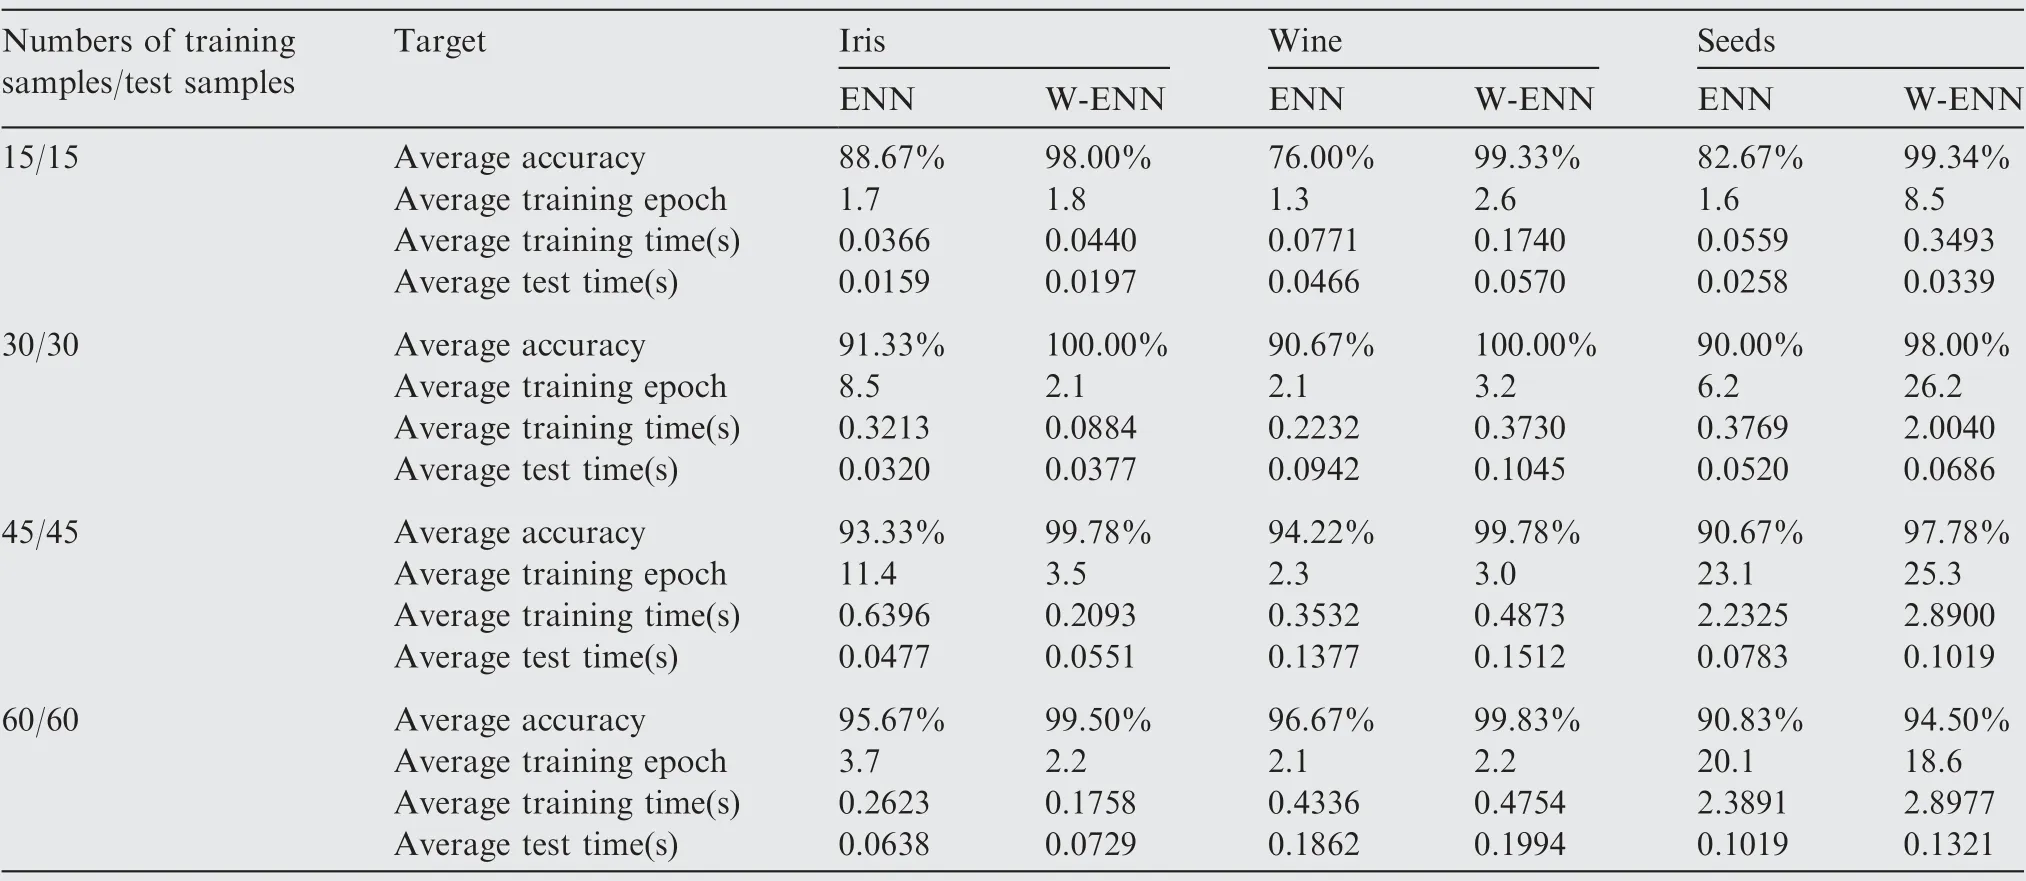
Table 2 Results of 10-fold cross-validation on different data sizes of W-ENN and ENN.
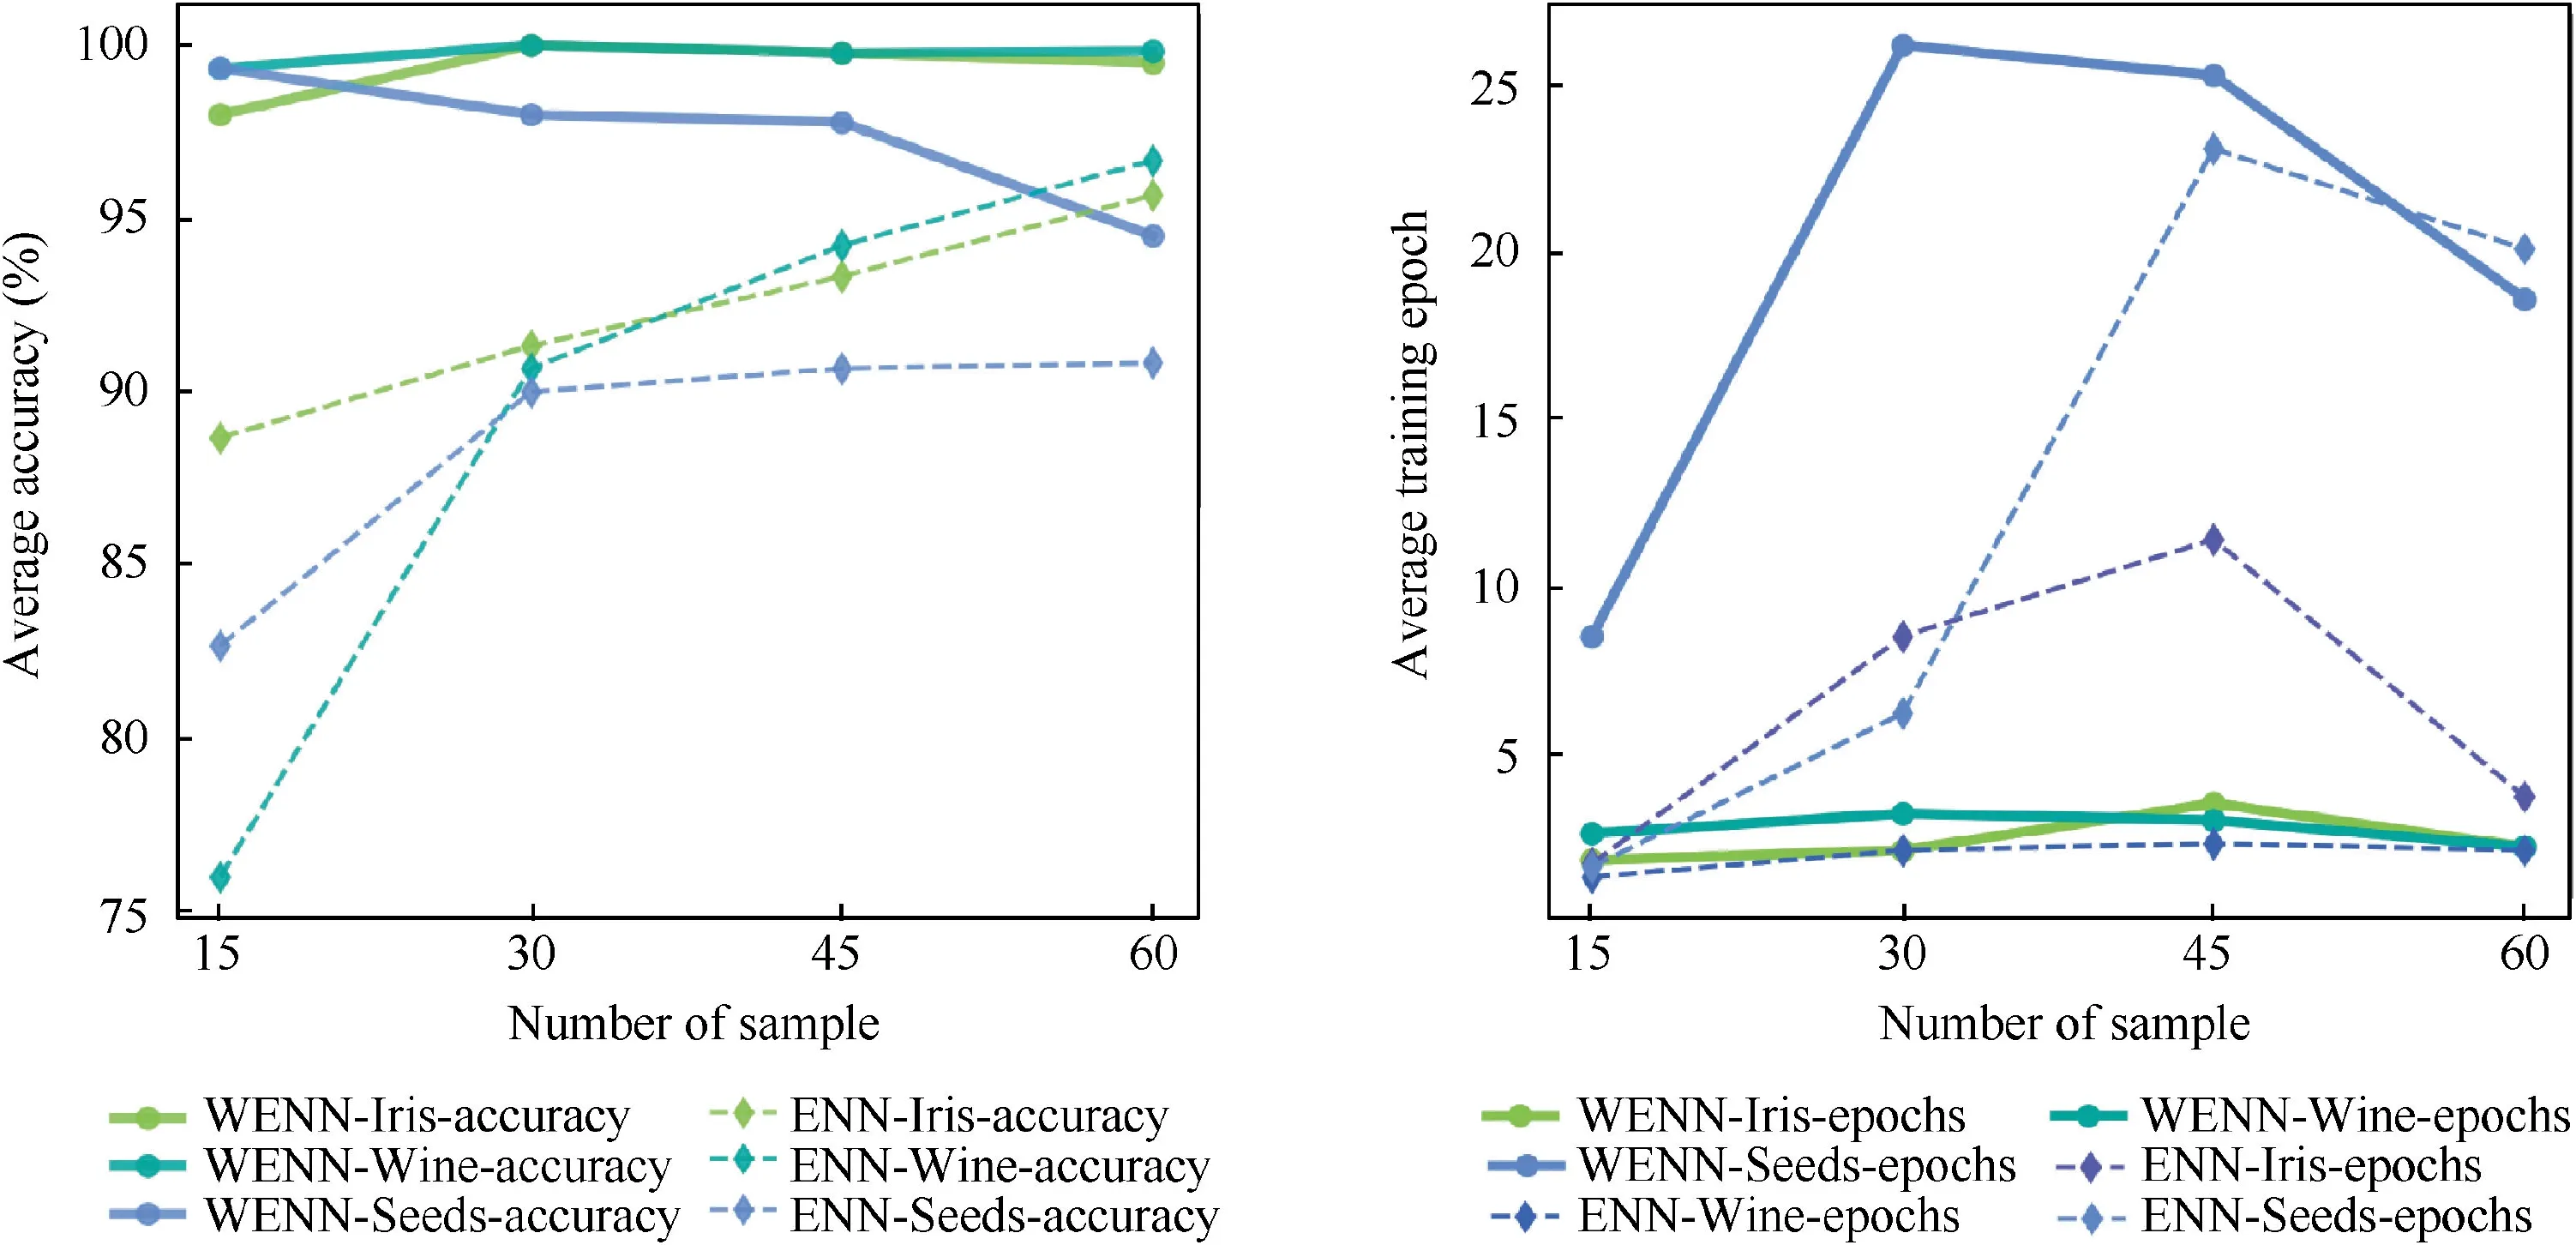
Fig. 8 Average accuracy and training epoch on different data sizes of W-ENN and ENN.

Table 3 Training data of turbo-generator sets.

Table 4 Test data of turbo-generator sets.
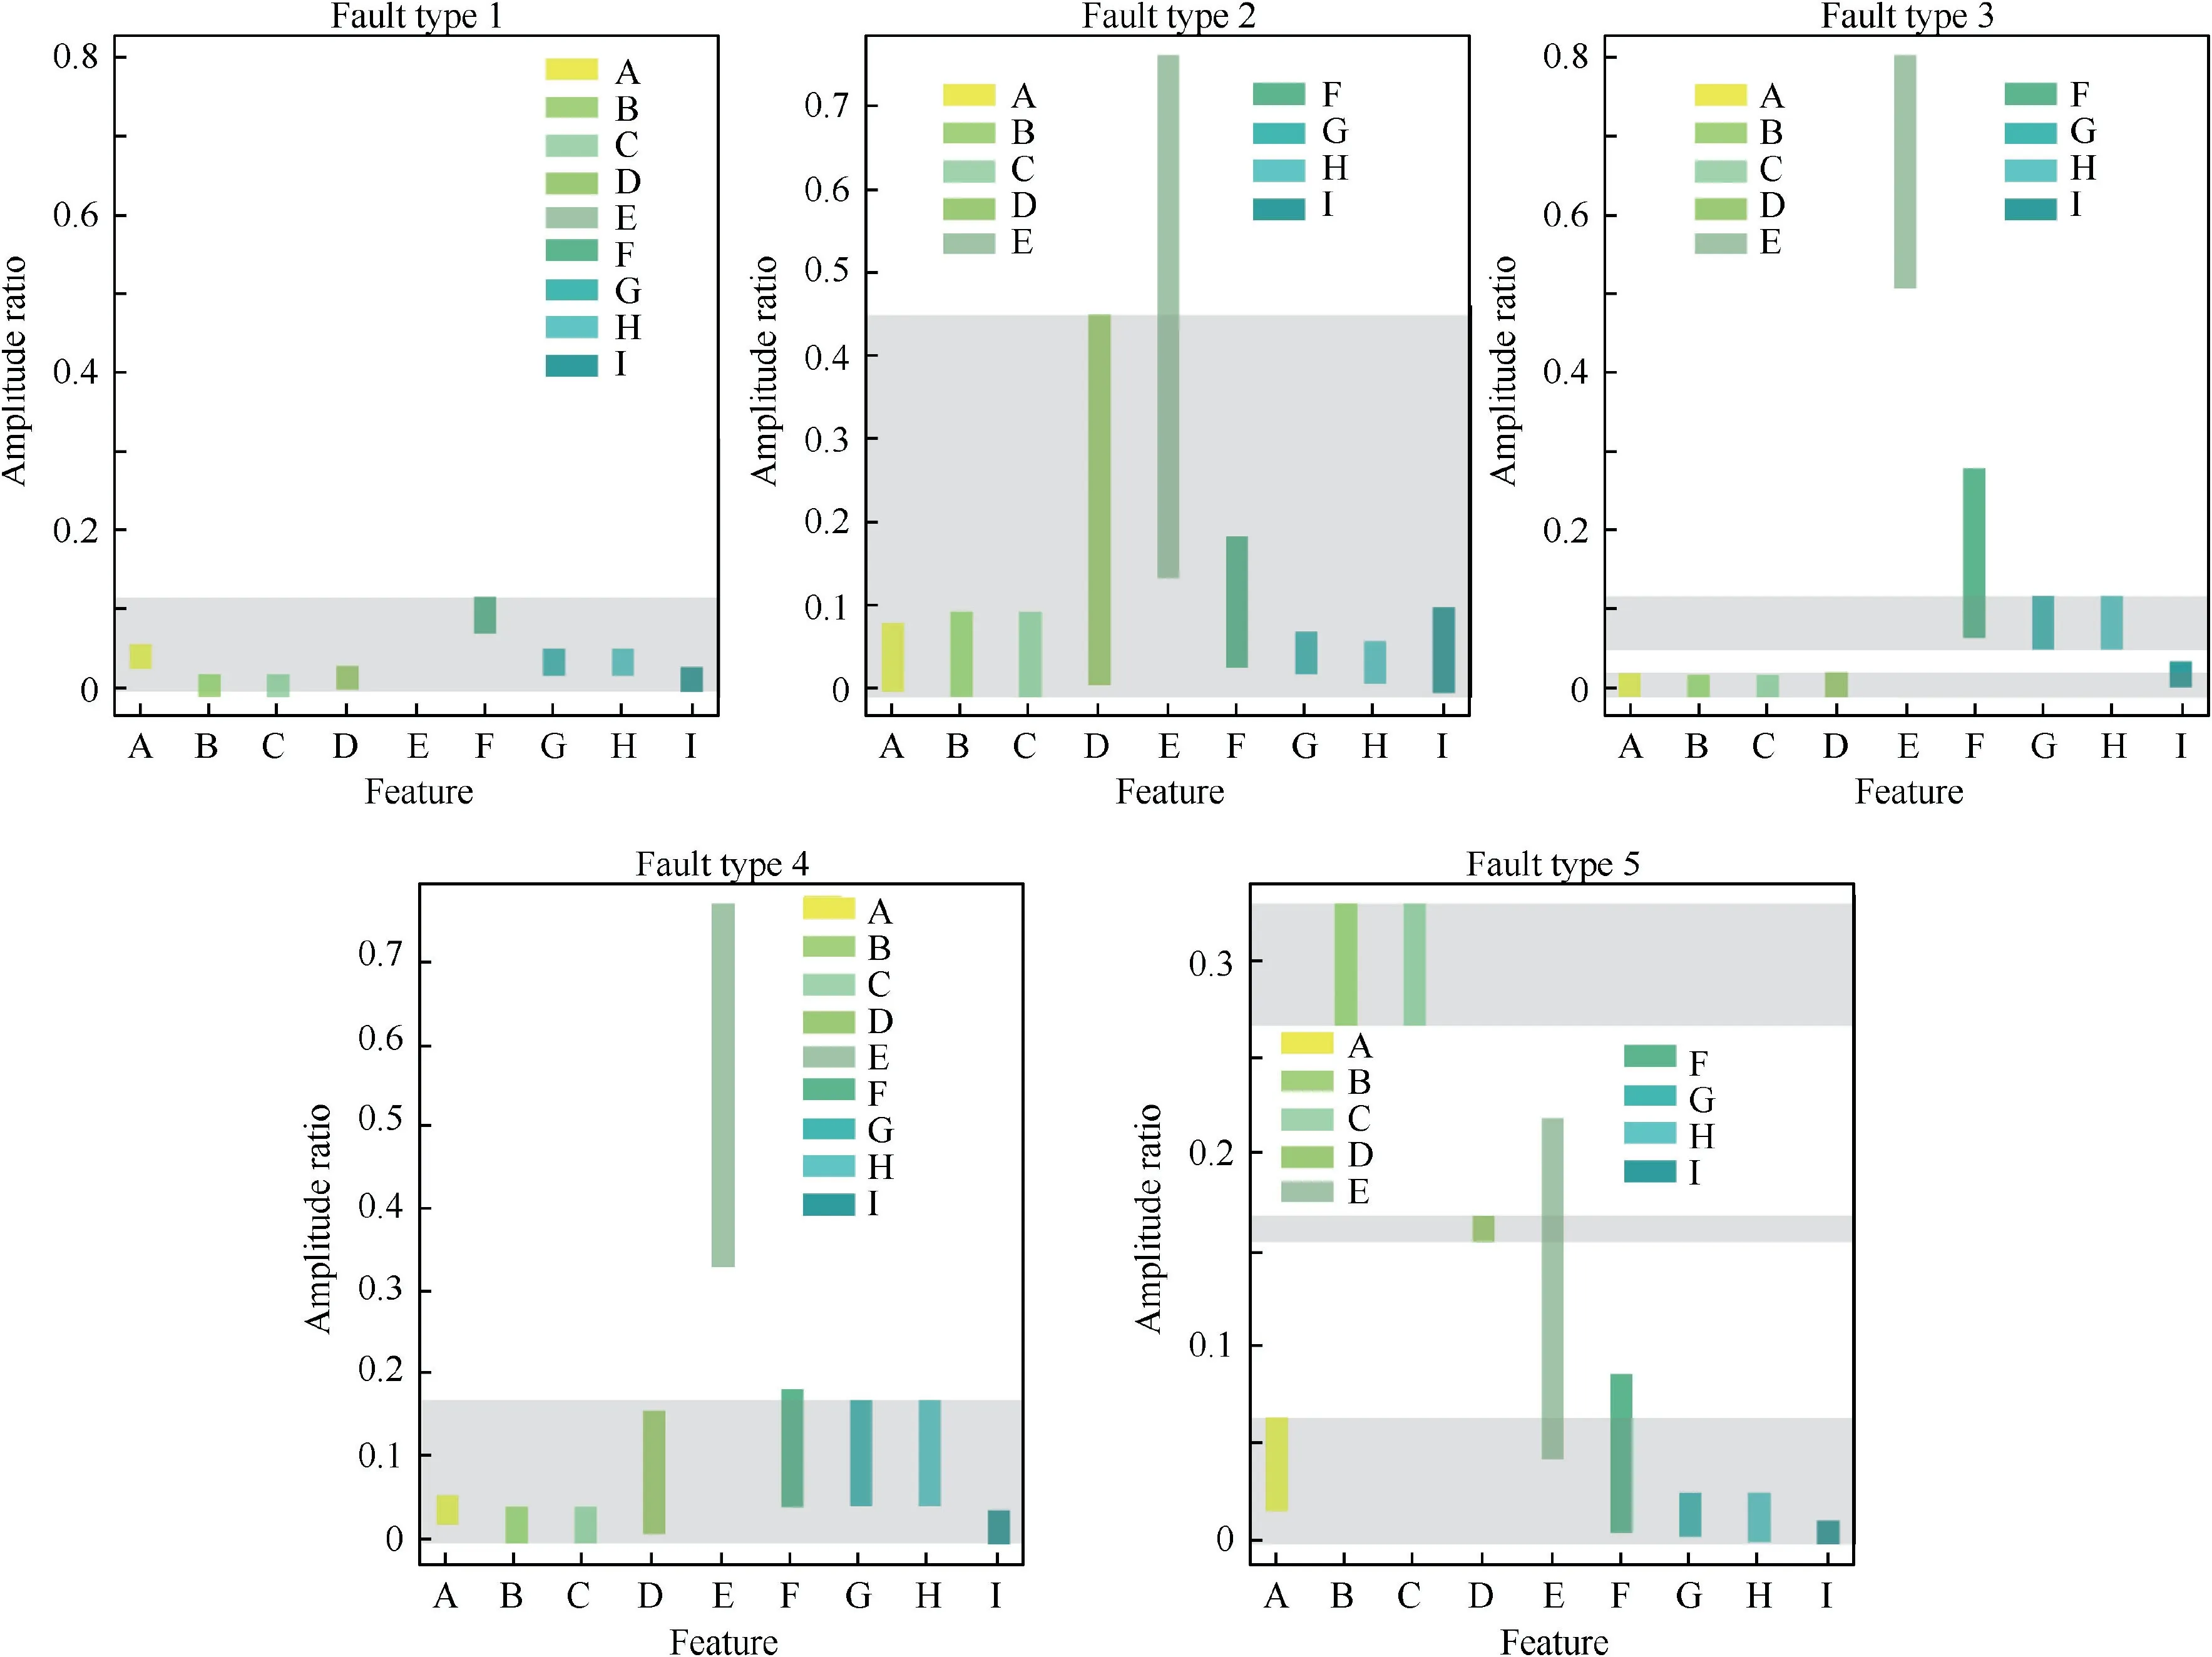
Fig. 9 Overlaps in original classical domains
Another weight of the network,the weights of fault features calculated by Eqs.(19)-(24),are shown in Fig.10.In this case,the darker the color is, the more important the feature is.
4.2.3. Learning rate selection
After obtaining connection weights of W-ENN,the best learning rate η was selected in this part. A series of learning rate η ranging from 0.01 to 0.2 was put into the network in order,and training epochs,training time,diagnosis time,and diagnosis accuracy rate were recorded each time.
On the case that all the test samples were diagnosed correctly, the changes of the training epochs, training time and diagnosis time varying with η are shown as detailed in Fig. 11. According to Fig. 11, the training epochs declined from 29 epochs to 2 epochs distinctly; and the training time also declined with the increasing η; but the diagnosis time almost remained the same because of the limited test samples.To keep these 3 targets at a lower level, we chose 0.19 as the best learning rate in this experiment Table 5.
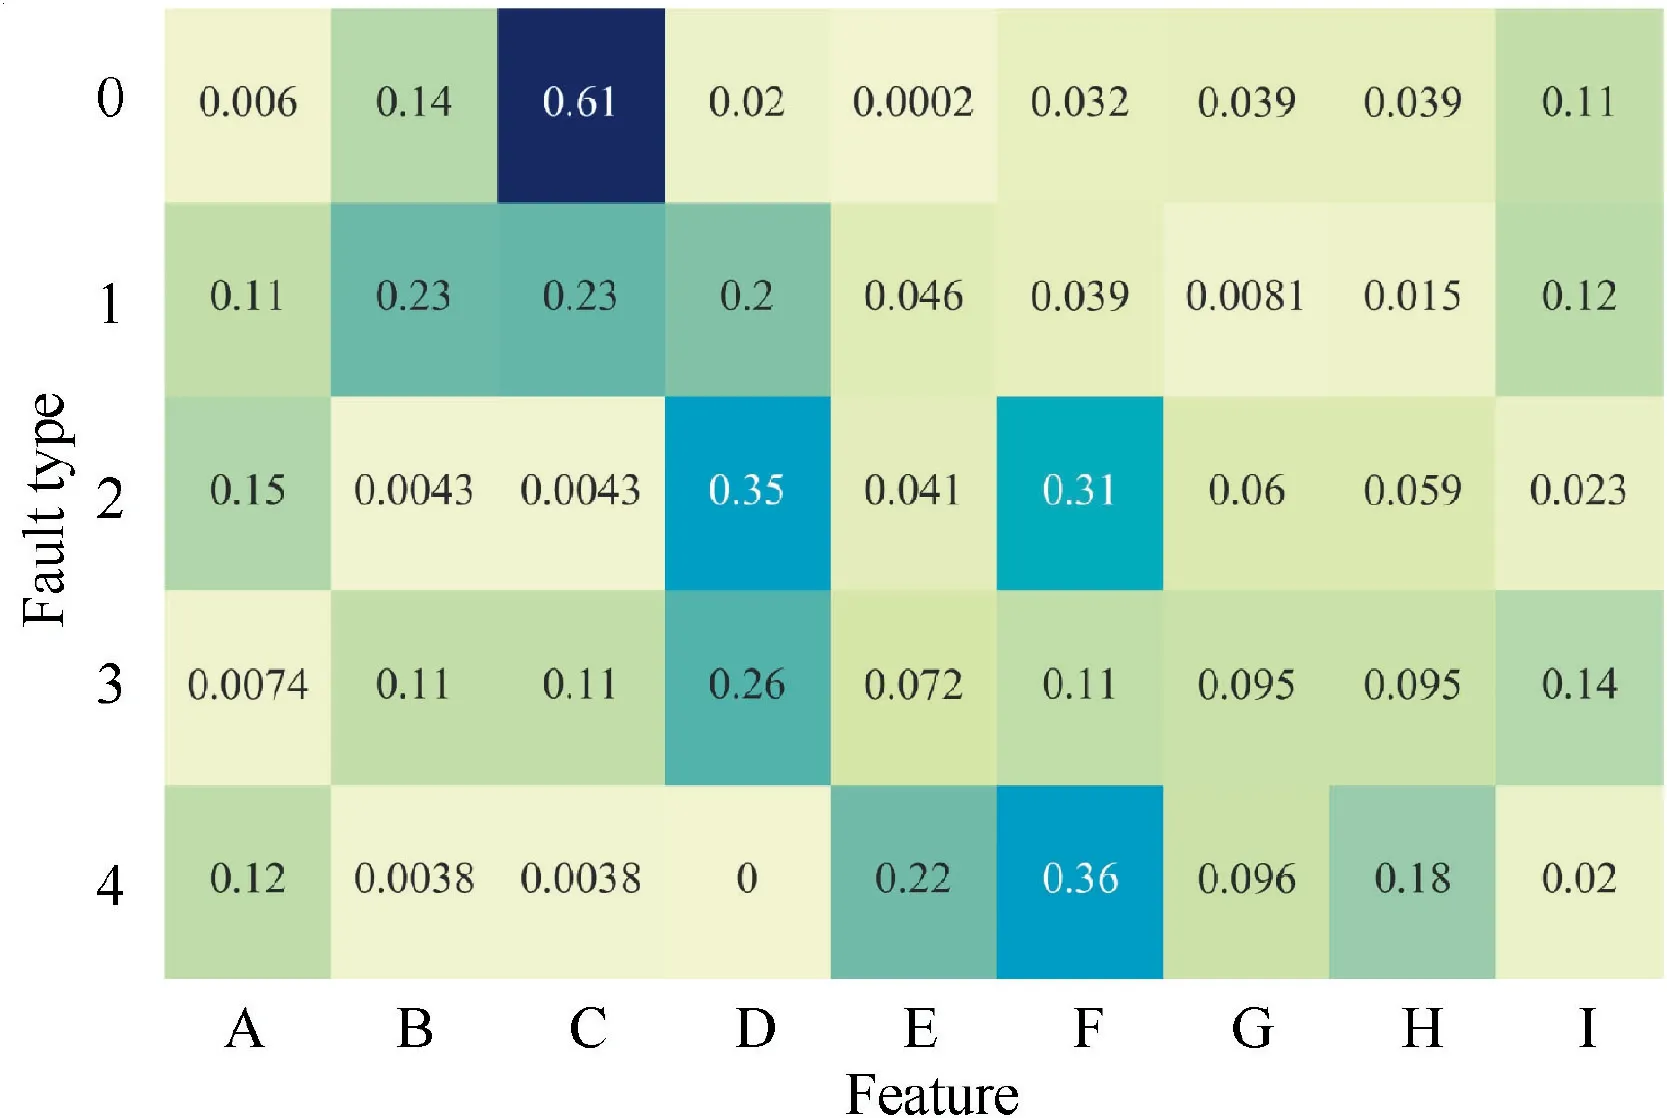
Fig. 10 Weights of fault feature.
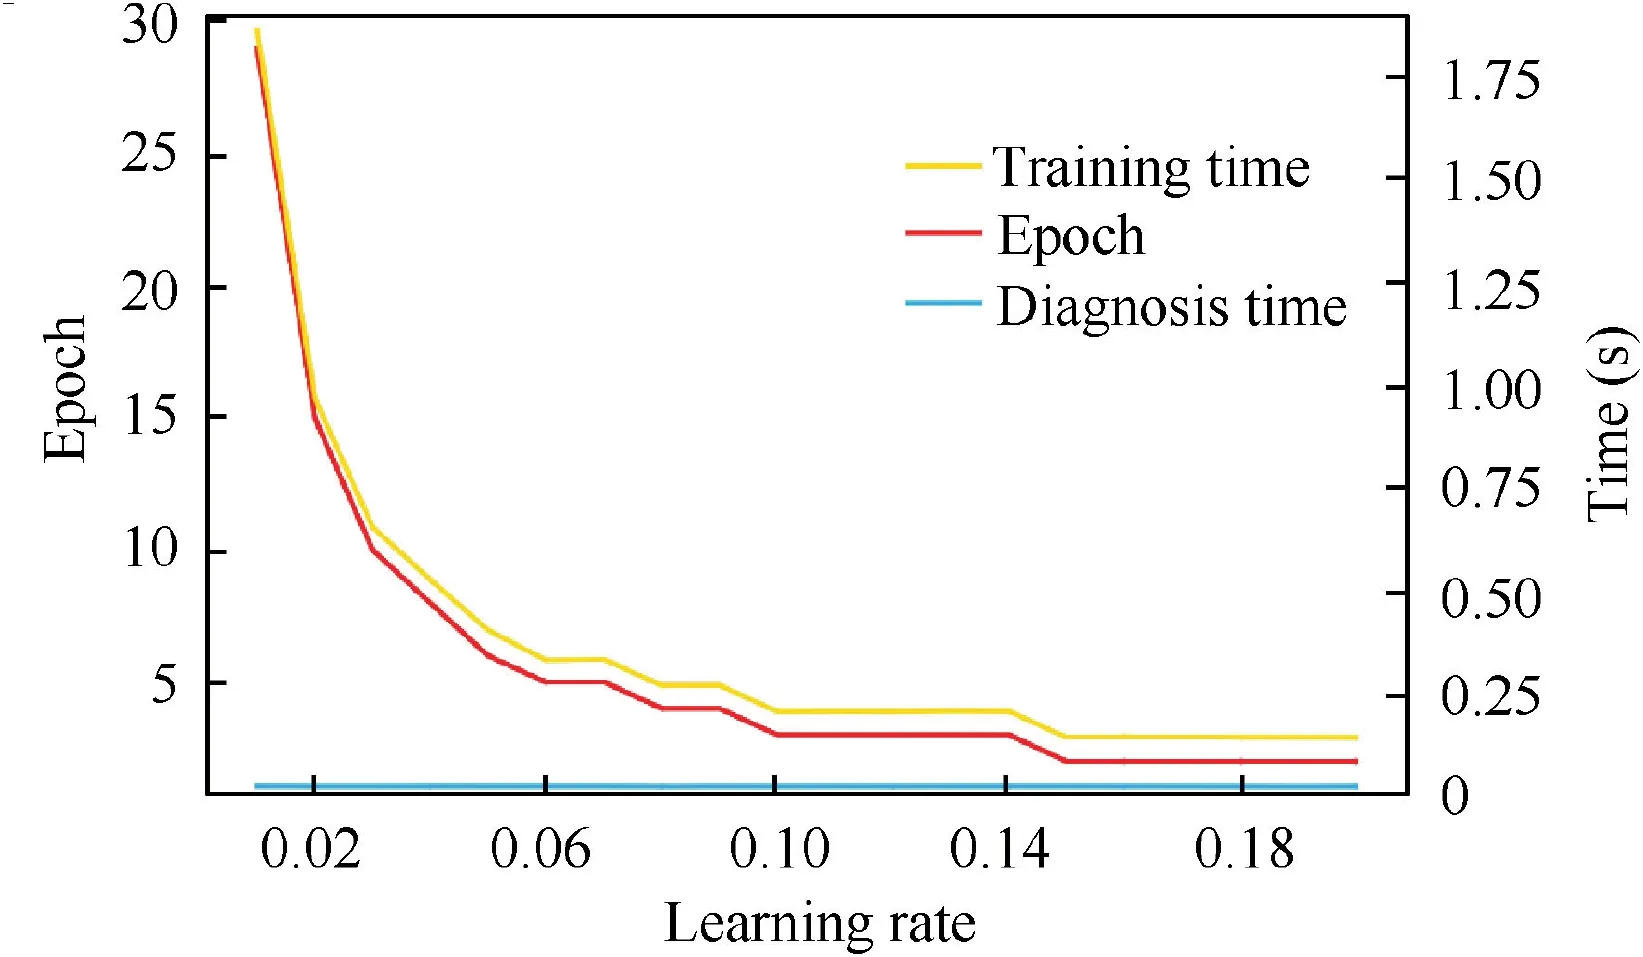
Fig. 11 Changes of training epoch, training time and diagnosis time varying with η.
4.2.4. Results and analysis
(1) Training phase
This part aimed to evaluate the performance of the fault diagnosis model based on W-ENN by comparing it with the performance of ENN.The network of W-ENN and ENN were constructed on the basis of the obtained weights above, and then, 12 training samples were fed into the networks respectively.
The training phases of the two models are presented in Fig. 12 and Fig. 13, with the results summarized in Table 6.Comparing Fig. 12 and Fig. 13, it is noticeable that W-ENN based model converges faster than ENN based model, with one converged in 2 epochs while another converged in 3 epochs. At the same time, the training time of W-ENN based model is also less than the other model (Table 6).
To further investigate the change of the feature centers during the training phase, a typical illustration of feature A in fault type 1 can be seen in Fig. 14. It can be observed that,in W-ENN, the gradient is larger than that of in ENN, which contributes to the higher convergence speed of W-ENN.However, due to the constraints of the feature weights in W-ENN,the update directions turn to be opposite.
(2) Diagnosis phase
In diagnosis phase, 5 test samples in Table 4 were fed into the trained models, and the diagnostic results are listed in detail in Table 7. Ascribing to the overlaps in classical domains,the identification rate of ENN based model was only 40%,which implies the model could not identify fault patterns effectively based on the original correlation function. Meanwhile, a significant improvement in identification rate and diagnosis time can be found in W-ENN based model, with higher identification rate of 100% and (marginally) less diagnosis time.
Generally speaking, we found evidence to suggest that, the new connection weight and the improved correlation function added in W-ENN, may contribute to a higher convergence speed and less training time during training phase, and a higher identification accuracy and less diagnosis time during diagnosis phase.
4.3. Effect of sample size on diagnostic models
In order to compare the proposed model with some popular algorithms commonly used for fault diagnosis of small samples, which are ENN, SVM, RVM34and ELM, and evaluate the effect of sample size on models’performances,a comparative experiment was conducted in this part.By highlighting the superiorities of the algorithms, the ratio of the maximum amplitudes at 9 frequency domains were taken as the input features as before. The typical 8 fault conditions of the samples included unbalance, misalignment, oil-resonance, rubbing,loose bearing blocks,torsional vibration of bearing,steam vortex and eccentricity of bearing to journal.35The scale of 16,24,32,40,48,56,64,72 and 80 samples were selected by stratified random sampling each time to train the models,and leave-oneout method was used for cross validation;each experiment was performed randomly for 50 times to obtain the average fault diagnosis accuracy of each model.For the SVM based models,the kernel functions were set as RBF, and grid searches were performed on C and gamma to determine their optimal combinations in each model. Comparing with SVM based models,RVM based models did not require complex parameter selection to avoid over fitting.And after several attempts,the optimal number of hidden layer nodes for ELM based models was set as 20. The results are illustrated in Fig. 15.
As can be seen in Fig.15,the diagnosis accuracies of all the models kept rising with the increase of the sample size generally. When there were only 16 samples, the accuracies of all models were less than 50%;and when the sample size reached 56, the accuracies turned to higher than 95%. A striking outcome is that the accuracy of the proposed model scored far above than other models when the sample size ranged from 16 to 48; and the accuracy of it reached 95% with only24 samples, which was much higher than the next best SVM based model (scored 73.75%); furthermore, the proposed model was the first model to get 100% accuracy when there were 40 samples.

Table 5 Results of ENN and W-ENN in training phase.
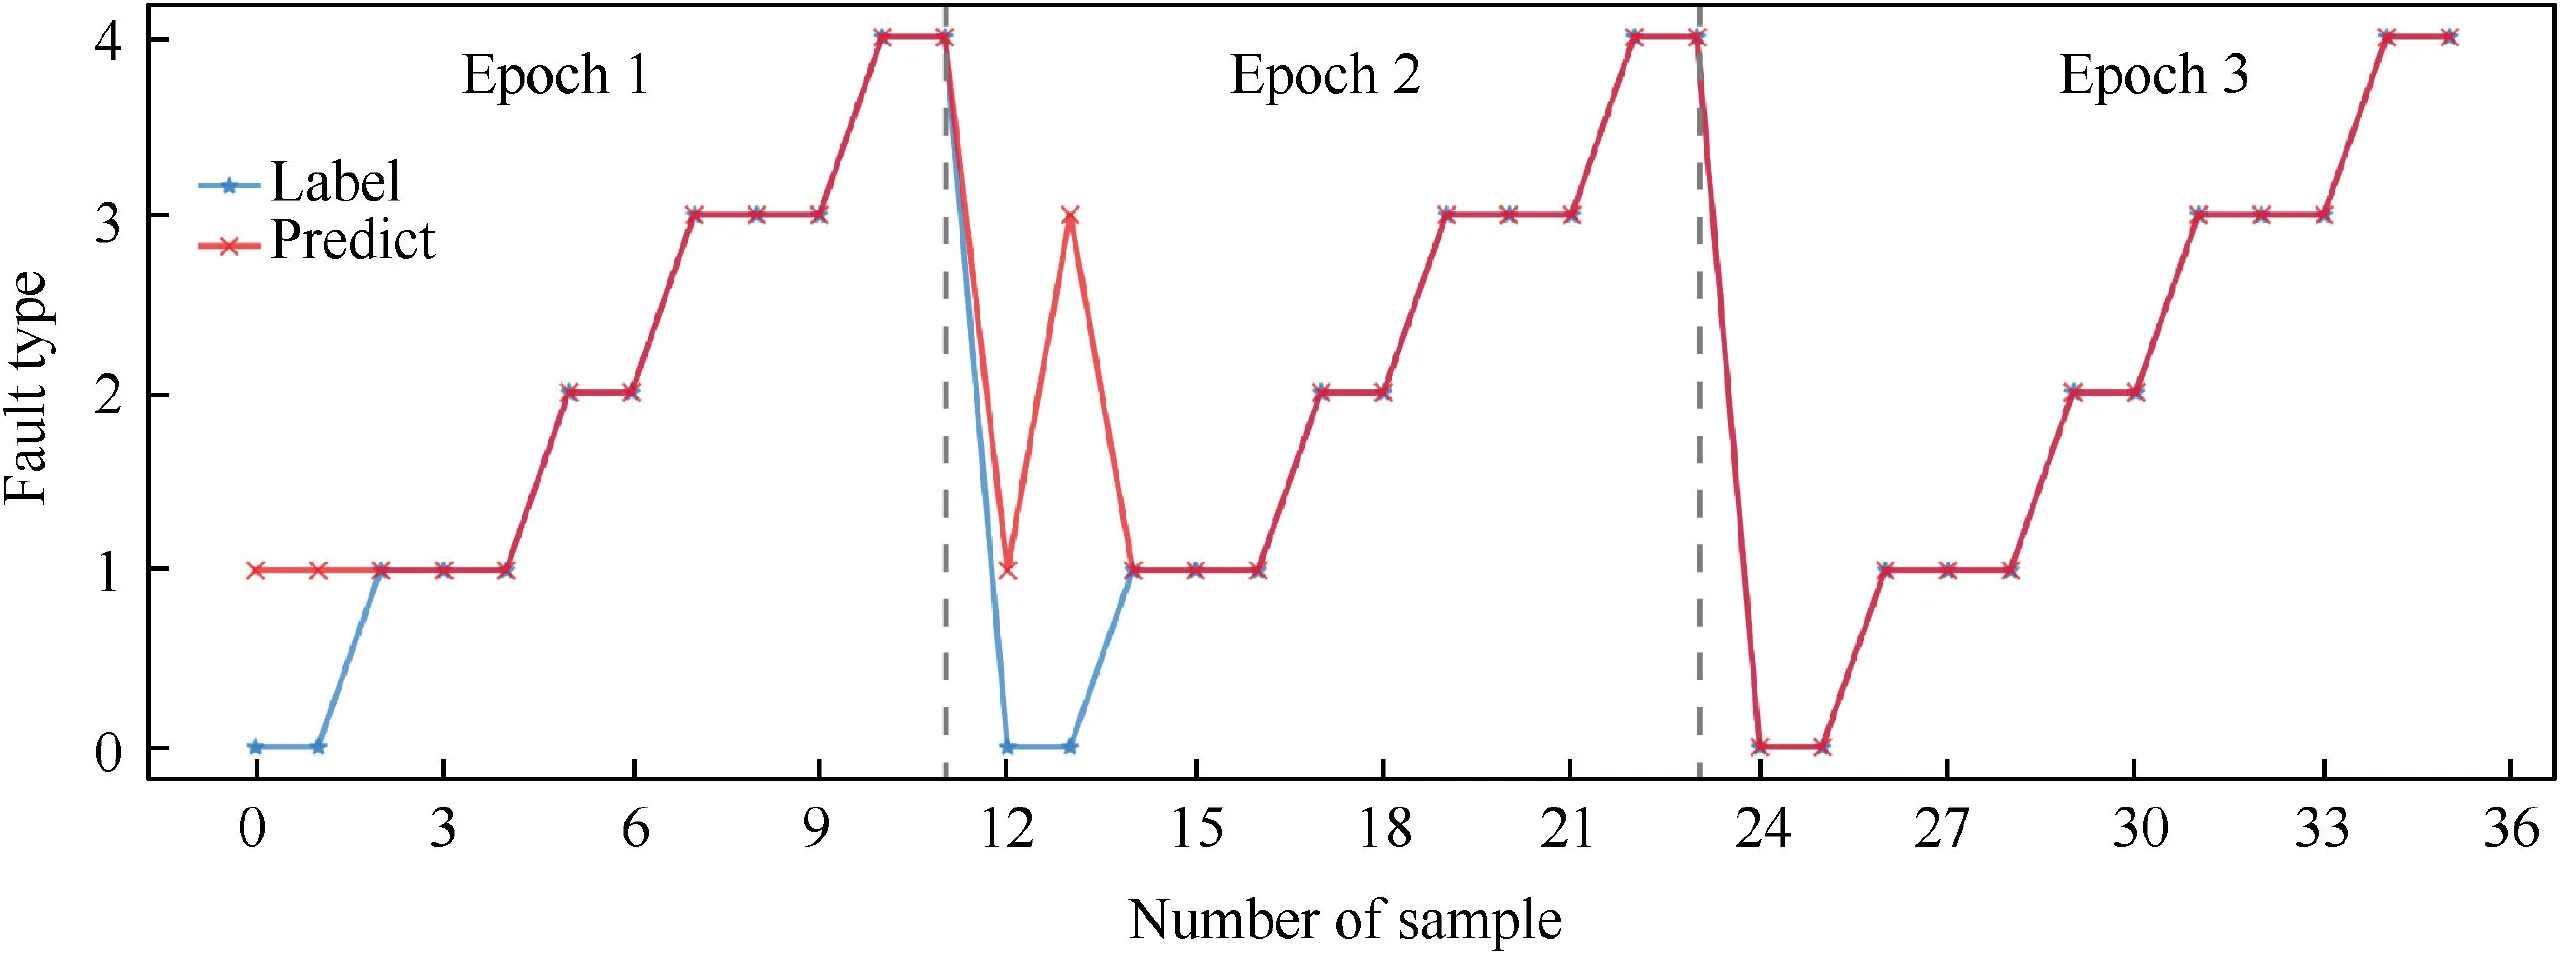
Fig. 12 Training phase of ENN.
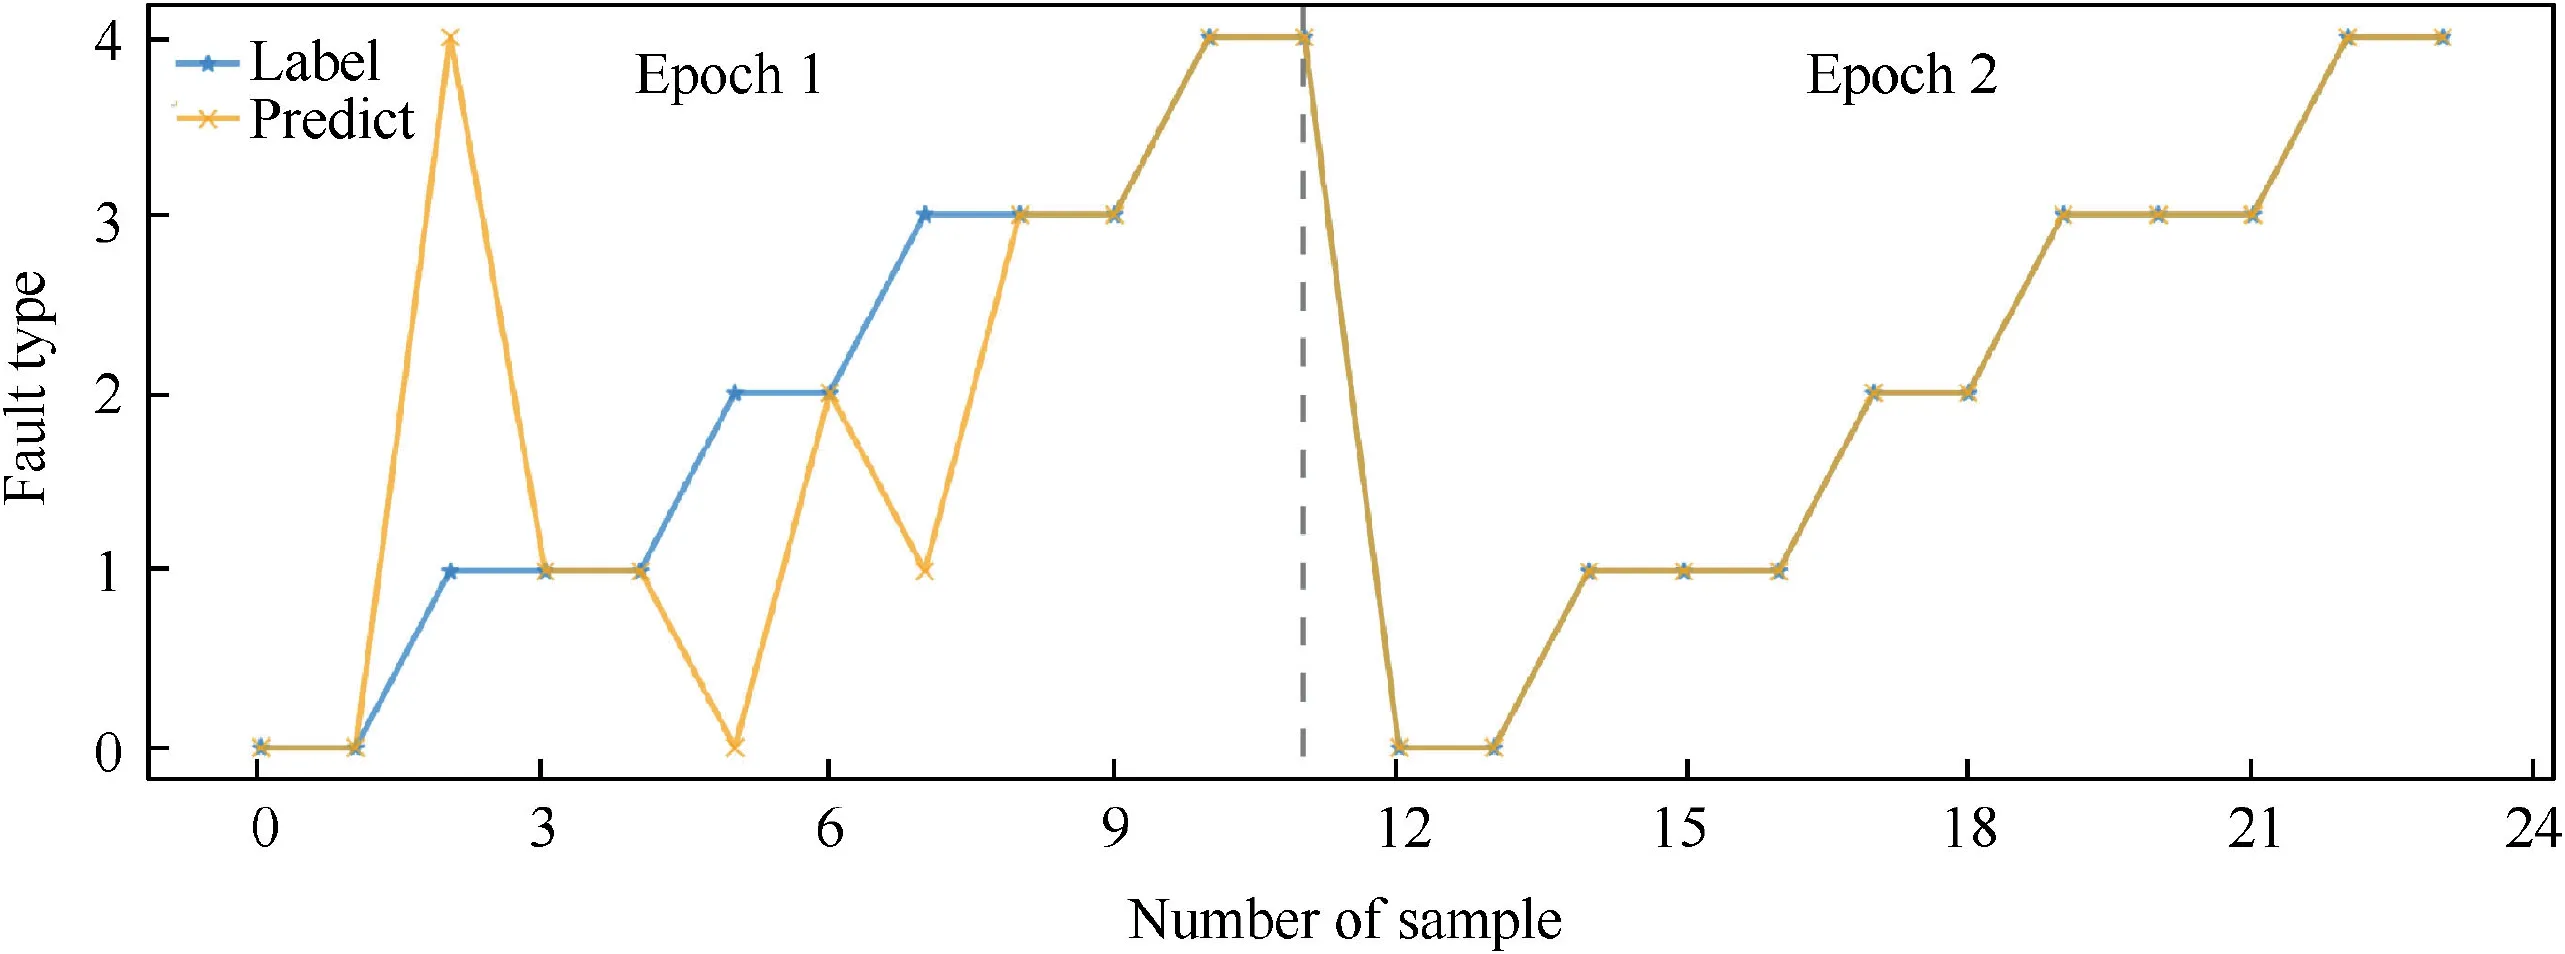
Fig. 13 Training phase of W-ENN.

Table 6 Results of ENN and W-ENN in diagnosis phase.
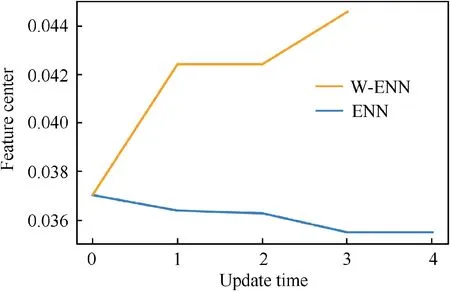
Fig.14 Change of the feature center of feature A in fault Type 1.
It is evident from the overall results that,the more samples,the better the diagnostic performance of the model.For limited fault samples diagnosis, ascribing to the good ability to learn the features’ boundary information fully and quickly on small samples, the W-ENN based model proposed in this paper achieves a better diagnosis performance.
4.4. Effect of noise on diagnostic models
In fault diagnosis, since the appearance of noise in input data is inevitable, the effect of noise in diagnosis was investigated experimentally among the 5 models above in previous Section 4.2, including the W-ENN based model, the ENN based model, the SVM based model, the RVM based model and the ELM based model. The specific parameter settings of the models were consistent with the settings above. To ensure a better diagnosis performance of all the 5 models, 48 samples in 4.2 were selected by stratified random sampling each time with ±0% to ±30% random uniformly distributed noise added in this experiment. Leave-one-out method was used for cross validation. And by obtaining the average fault diagnosis accuracy of the models, each experiment was performed randomly for 50 times. The detailed results are shown in Table 7.
It is apparent that,in addition to the model presented in his paper, the accuracy of the other models decreased with the increasing noise percentages,which is in line with the previouswork.36However,as can be seen,the proposed W-ENN model gave satisfactory results under different degrees of noise,which scored 99.29%on average. In general,SVM based model performed relatively better than other models, while ENN based model had a little poor performance at all noise levels. This could be due to, during the diagnosis process, when using the amplitudes of frequency domains as the input fault features,the SVM and RVM based models seek the optimal decision boundary to give the predictions by solving the maximum margin hyper-plane of the samples, while the W-ENN and ENN based models give the predictions by learning the boundary information of the features.Because of the noise sensitivity of the upper and lower bounds of features, the W-ENN and ENN based models tend to be more sensitive to noise in theory. But in fact, with the adjustment of features’ weights, WENN based model achieves a better noise-tolerant ability at all noise levels.

Table 7 Average diagnosis accuracy of models on various noise percentages.
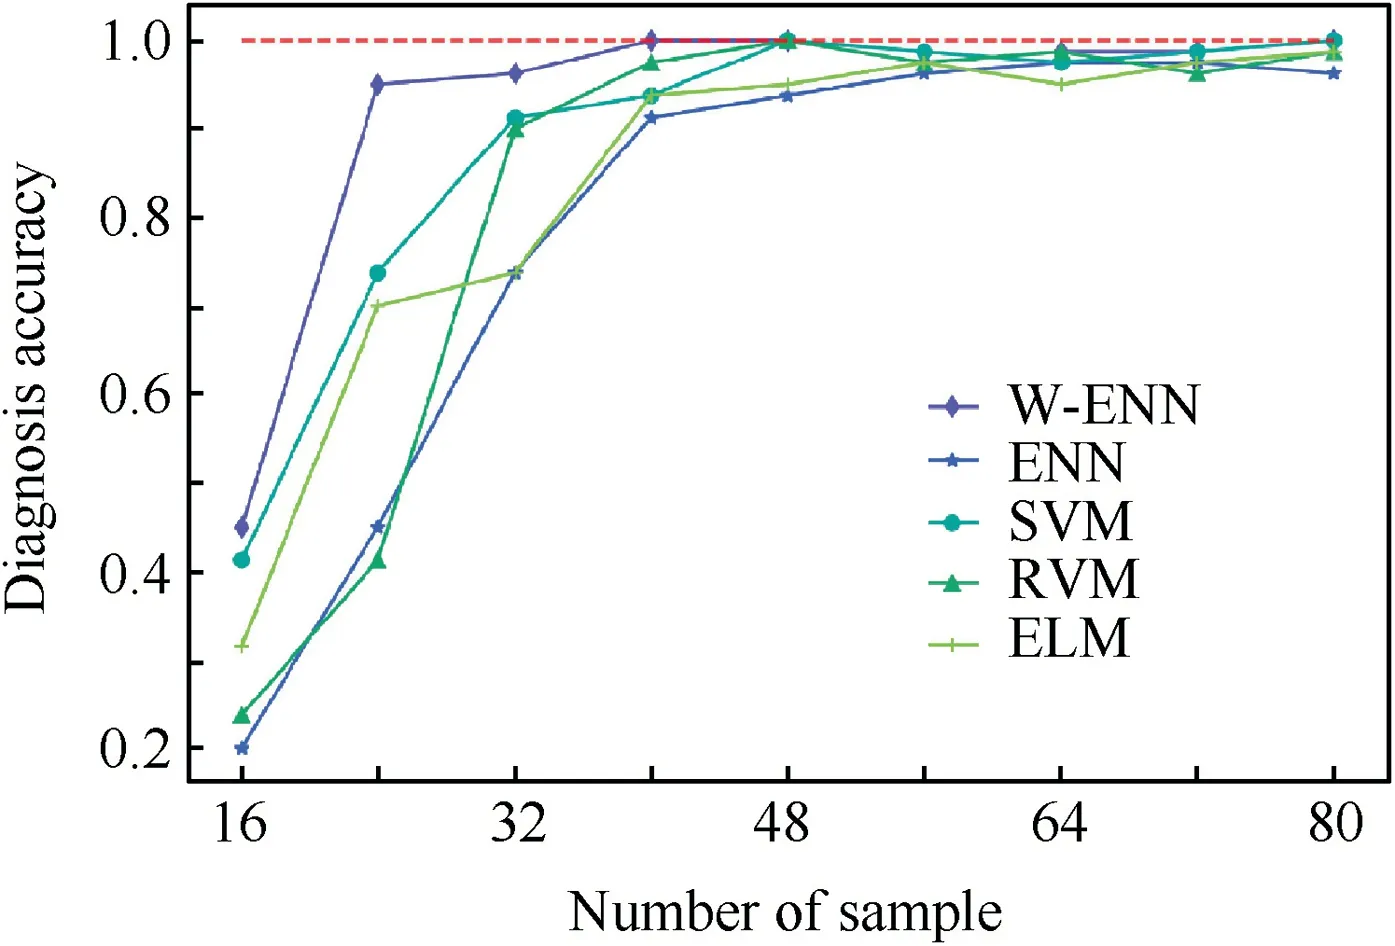
Fig. 15 Effect of sample size on diagnostic models’performances.
Generally speaking, in small sample fault diagnosis, the higher the noise ratio, the worse the diagnosis accuracy of the model. However, we found evidence to suggest that noise may make a slight influence on diagnosis ability of the proposed W-ENN based model, which means, W-ENN based model has good potential in noise tolerance.
5. Conclusions
(1) A novel neural network, weighted extension neural network (W-ENN), is designed and introduced first. For the sake of optimizing the membership degree of the neural network, W-ENN is improved by adding a new connection weight, which is the feature weights calculated from training data, and re-designing the correlation function to better describe the distance between samples.
(2) In an attempt to address the problem of small sample fault diagnosis with noise for turbo-generator sets, a new fault diagnosis model is proposed based on WENN. Surprising outcomes of comparative experiments show that the proposed model outperforms other models in terms of higher identification rate with fewer samples and more stable noise-tolerant ability on small sample fault diagnosis.
Declaration of Competing Interest
The authors declare that they have no known competing financial interests or personal relationships that could have appeared to influence the work reported in this paper.
Acknowledgements
This research was supported by the National Natural Science Foundation of China (No.51775272, No.51005114); The Fundamental Research Funds for the Central Universities, China(No. NS2014050).
Appendix A. Supplementary data
Supplementary data to this article can be found online at https://doi.org/10.1016/j.cja.2020.06.024.
 CHINESE JOURNAL OF AERONAUTICS2020年10期
- CHINESE JOURNAL OF AERONAUTICS的其它文章
- A novel surrogate modeling strategy of the mechanical properties of 3D braided composites
- A user-friendly yield criterion for metals exhibiting tension-compression asymmetry
- Aerodynamic characteristics of morphing wing with flexible leading-edge
- High cycle fatigue failure with radial cracks in gears of aero-engines
- Motion equations of hemispherical resonator and analysis of frequency split caused by slight mass non-uniformity
- Light weight optimization of stratospheric airship envelope based on reliability analysis
