Optimum design and experiment of composite leaf spring landing gear for electric aircraft
Donghui LI, Zhenwei FAN, Yewei ZHANG, Jian ZANG,Fengtian YANG,*
a Shenyang Aircraft Design & Research Institute, Shenyang 110035, China
b Design Department, Liaoning General Aviation Academy, Shenyang 110136, China
c College of Aerospace Engineering, Shenyang Aerospace University, Shenyang 110136, China
KEYWORDS Composite materials;Genetic algorithm;Laminate optimization;Landing gear;Static experiment
Abstract The composite leaf spring landing gear of an electric aircraft is optimized. With the strength and workability as constraints and the minimum structural weight as an objective, the two-stage optimization of the leaf spring landing gear with glass fiber unidirectional prepreg is carried out using a genetic algorithm, namely, the optimization of continuous thickness of layup, and the optimization of the layup sequence and discrete thickness. In the optimization process, the ground loads are calculated according to the structural stiffness of each chromosome,thus the stiffness constraints are relaxed, and the optimization results are compared with those using stiffness constraints.The static experiment verification reveals that the numerical simulation and experimental results are consistent, that is, the optimized leaf spring meets the strength requirements. The results show that the leaf spring landing gear based on two-stage optimization method achieves the objective of weight reduction.
1. Introduction
With environmentally friendly aviation technology as the development concept, electric aircraft will become the major direction of general aviation development.1At present, the types of manned electric aircraft are primarily divided into single-seat ultra-light aircraft and two-seater light sport aircraft.Furthermore,the maximum flight time of electric aircraft does not exceed 1.5 h, and the maximum range is less than 350 km.A certain gap still exists compared with the same level of oil-powered aircraft.Yang et al.found that the chief factors affecting the range of an electric aircraft include battery energy density, lift drag ratio, battery quality, and propulsion system efficiency.2When the total weight of the aircraft is fixed,increasing the battery weight can improve the flight range.However, the aircraft still demands higher requirements for structural design and weight control.
The RX1E-A two-seater electric aircraft has a flight time of 2 h. About 95% of the aircraft structure is made of carbon fiber and glass fiber3The main landing gear is composed of glass fiber leaf spring, and it has a simple structure and involves easy maintenance. During landing, the landing gear absorbs energy, and the ground load is related to the stiffness of the leaf spring.Therefore,the leaf spring landing gear must satisfy the requirements of strength and stiffness simultaneously during the design.
Shaikh and Rajmane studied the composite leaf spring with equal thickness in detail, and compared it with the steel leaf spring.They found that the composite leaf spring has low stiffness and light weight.4Xue et al. performed dynamic simulation of the composite leaf spring on Unmanned Aerial Vehicles (UAVs).5,6Venkatesan and Helmen optimized the design of lightweight automobile leaf springs and analyzed their performance. Compared with traditional leaf springs,the optimized springs could decrease 85% of their weight.7
Although the above studies involve static strength design and dynamic analysis of leaf springs, their results are mostly applicable to UAVs and automotive industries. Furthermore,studies on the laminate optimization of leaf springs are rare,and the strength determination methods are mostly limited to the ultimate strength criteria. Static mechanics design is the forerunner of landing gear design. Composite layers are designed according to static strength loads. The landing gear must meet the static strength requirements. In the airworthiness verification, the static strength experiment of the landing gear is the key point.In this paper,the ground loads based on leaf stiffness and the Puck criterion which distinguishes failure modes are adopted to optimize the layers of leaf spring landing gear of an RX1E-A two-seater electric aircraft. The optimization is performed in multi-stage and multi-condition in accordance with the strength requirements of different failure materials, and the optimization results are verified by static experiment.

Fig. 1 RX1E-A two-seater electric aircraft.
2. Design of leaf spring landing gear
2.1. Structure of leaf spring landing gear
The aircraft and the structure of the leaf spring landing gear are shown in Fig. 1 and Fig. 2 respectively. The leaf spring is connected with the fuselage through two points. The landing gear is positioned by the aluminum alloy block on the outer side. The inner part is connected with the fuselage through bolts. The outer part resists the torsional load transmitted by the landing gear, whereas the inner part resists the pulling force from the outside. The material of the leaf spring is glass fiber unidirectional belt prepreg,which is formed via the autoclaving. The structure is simple and inexpensive. It is widely used in all kinds of general aircraft and UAVs.8,9
2.2. Material properties
Glass fiber unidirectional belt prepreg has low modulus and high toughness.These characteristics are helpful for the energy absorption of landing gear. The selection of the design value must minimize the probability of structural damage caused by material deviation. The leaf spring landing gear exhibits a single transmission force structure, and structural integrity may be lost after damage.Therefore,the strength design value should satisfy the probability of 99%and confidence of 95%.10The material properties are determined by component-level experiments. The average values of modulus and Poisson’s ratio in each direction are adopted.The strength values in each direction are used as the A-Basis value.The material properties are given in Table 1.

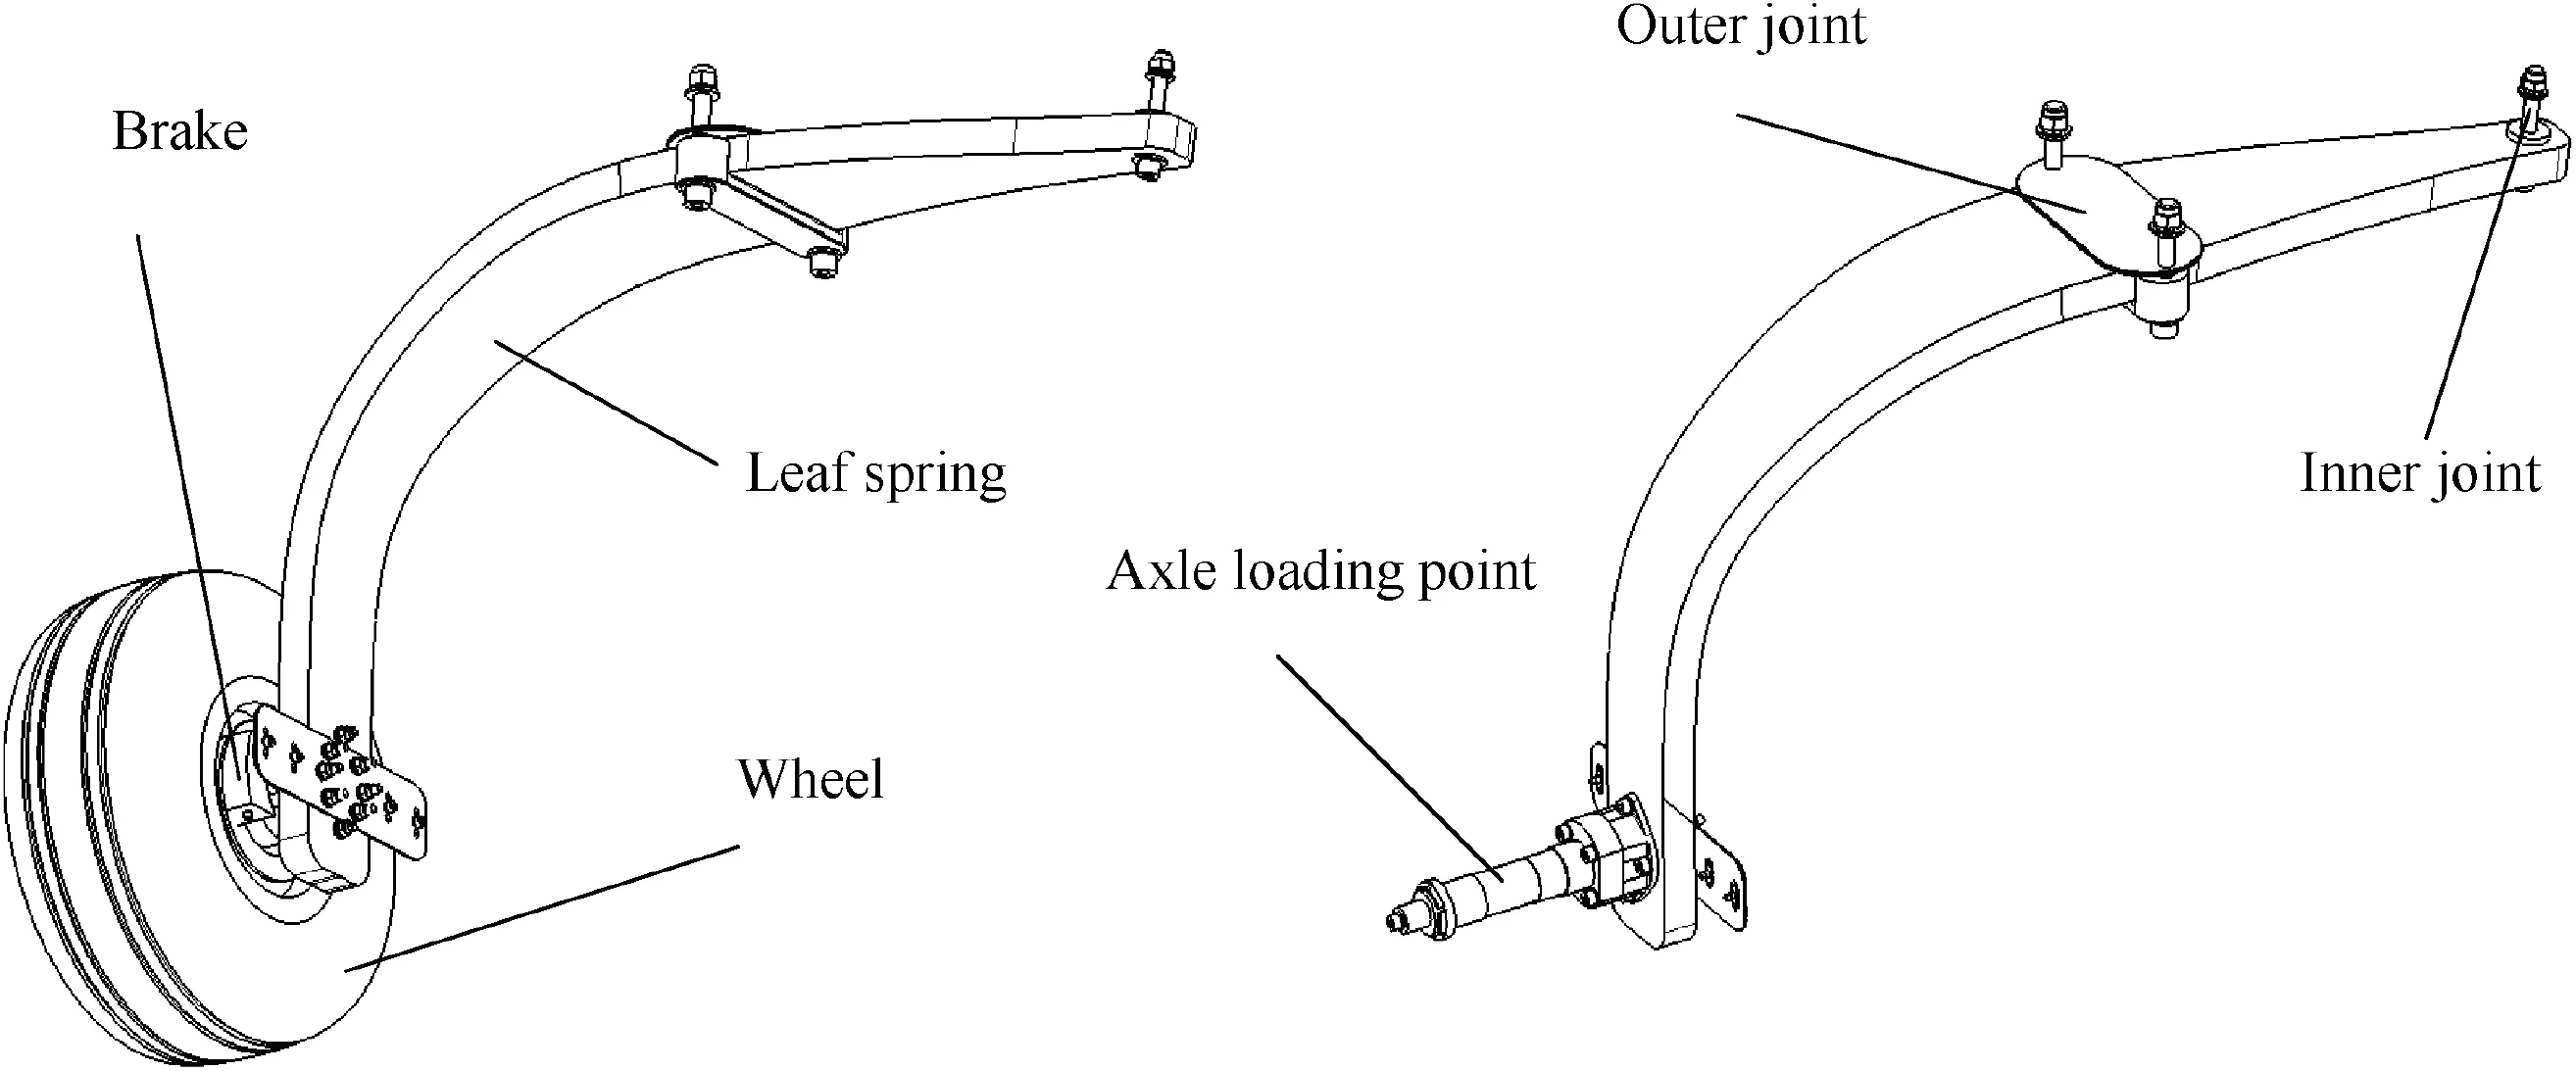
Fig. 2 Leaf spring landing gear.

Table 1 Properties of glass fiber prepreg materials.
3. Optimum design of leaf spring landing gear
3.1. Optimum design method
The optimum design of leaf springs involves two stages: the first stage is the continuous thickness optimization of the layer,whereas the second stage is the optimization of the angle of the layer and the discrete thickness of the layer. The first stage[±45°/0°/±45°/90°...m...±45°/0°/±45°/90°]s is the sequence of layers, m is the repetition number, the thickness of each layer is the design variable, the population is created by real coding,the ground load is calculated based on the corresponding stiffness of each chromosome, the design constraints contain the strength and workability, and the design objective is the minimum weight.The optimum result is a continuous thickness of each layer, and it is compared with the actual thickness of a single layer of prepreg. At this time, the thickness of the layer is 0.
After the first stage optimization,the thickness of some layers is 0. When those layers are removed, the thickness of the same-direction angle overlay may be more than the process constraint. In the first stage, the process constraint can only determine whether the thickness of the single layer exceeds the given maximum thickness, the failure process constraints caused by thickness superposition of the same direction are neglected,and the thickness is a continuous value,so the layup must be optimized in the second stage.
In the second stage, the number of layers in each design area in the first stage is used as input,and the angle and thickness of each layer are design variables. The population is created based on the discrete coding. The chromosome is divided into two parts: the front part is the layer angle gene, and the back part is layer thickness. Layer angle codes are as follows:0° is 00, 45° is 01, -45° is 10, 90° is 11. Thickness is coded in the binary system, and the accuracy is single-layer thickness.Strength and workability are used as design constraints, and the optimization objective is the lowest weight. The optimization process is shown in Fig. 3.
3.2. Strength constraint
In the optimum design of composite materials,the strength criterion must be carefully selected.At present,the strength criterion of composite materials can be divided into two categories.The first criteria do not distinguish failure modes, and examples are ultimate strength criterion11(such as maximumstress criterion and maximum-strain criterion), Tsai-Hill12,Hoffman13and Tsai-Wu14.The second criteria distinguish failure modes,and examples are Hashin15,Puck16,and LaRC0317.The Puck failure criterion can reasonably simulate the failure mechanism between fibers; the theoretical prediction results agree well with the experimental results18. Therefore, we use the Puck failure criterion as the strength criterion in the design of leaf spring landing gear.
The Puck criterion distinguishes two failure modes: fiber and inter-fiber failure. In addition to fiber tension and compression failure modes,inter-fiber failure modes include Mode A, Mode B, and Mode C16, which are shown in Fig. 4.
Fiber tensile failure mode damage parameter efftis as follows:
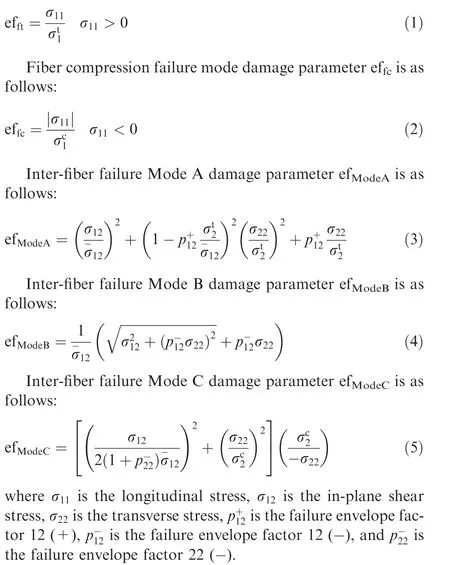
Strength constraints require that no matrix failure occurs under limit loads and no fiber failure occurs under ultimate loads.19In the Puck failure criterion, tensile and compressive failure of fibers can directly lead to structural failure.In Mode A failure, the fracture surfaces are separated from each other,and the modulus decreases in macro-scale without delamination failure. In Mode B failure, the fracture surfaces are squeezed together. Mode B produces a weaker effect on modulus than Mode A. In Mode C failure, the fracture plane is inclined. Delamination may occur between the failure layer and the adjacent layer. Therefore, Modes A and B can occur between the limiting load and the ultimate load, whereas fiber tension and compression failure and Mode C are not allowed to occur within this region. The strength constraints are as follows:
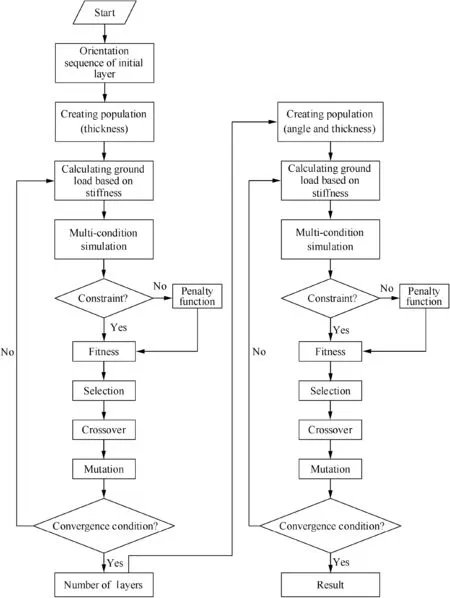
Fig. 3 Optimization flowchart.

3.3. Manufacturing constraints

Fig. 4 Puck criterion failure mode.
To prevent the Poisson’s ratio of leaf springs from being unreasonably large, the proportion of the angle of each layer is between 8% and 67%. To avoid rapid crack propagation,the number of continuous layers should not exceed four layers.The drop-off height is the thickness of a single layer.In consideration of the local impact during use,the outer surface is laid with glass fiber woven in the direction of ±45°.
3.4. Ground load and condition
RX1E-A aircraft is a light sport aircraft that follows the ASTM 2245-14 standard specification20.Total shock absorber travel includes landing gear deformation and wheel tire deformation. The stiffness of the leaf landing gear is as follows:

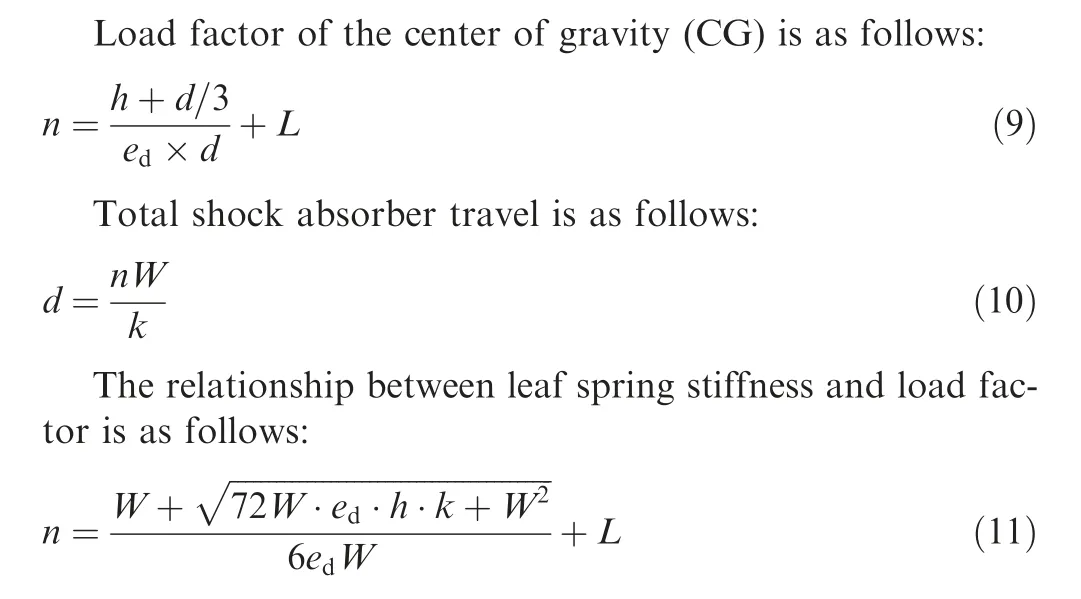
where ktis the stiffness of wheel tire, ksis the stiffness of leaf spring,W is the weight of aircraft,S is the area of wing,h is the drop height, edis the shock efficiency, L is the ratio of the assumed wing lift to the airplane weight,and n is the load factor of the CG.
The conditions of aircraft ground load are shown in Table 2.The factor of safety is 1.5.
In Table 2, a is the distance of CG to front wheel, d is the distance of front to main wheel, and K is the ratio of vertical load to backward load.
3.5. Numerical simulation analysis
The first stage of the optimization process of leaf spring is shown in Fig. 5. After 180 generations, the structure weight is 3.48 kg,the ground load is 8289.118 N,and the displacement of the wheel axle is 189.2 mm. The second stage of the optimization process is shown in Fig. 6. After 150 generations,the structure weight is 3.8 kg, the ground load is 9439.633 N,and the displacement of the wheel axle is 169.6 mm.
In this method,the ground load of the optimized leaf spring is smaller than that of the given stiffness constraints. The thickness of the layup is more concentrated at the outer connection points connected with the fuselage. The maximum thickness of the layup is 3.2 mm and is less than that of the original one, and the thickness of the layup is optimized between the inner and outer connection points. The thickness distribution is shown in Fig. 7. Fig. 7 (a) shows the original thickness distribution of leaf spring. Fig. 7 (b) shows the optimized thickness distribution.Under the above comparison,the weight of the original laminated leaf spring is 4.9 kg, the optimized mass is 3.8 kg, and the weight reduction is 22.4%. The comparison data of the two leaf springs are shown in Table 3.
The maximum strain of leaf spring in each direction under the limit load of each condition is shown in Table 4. The calculation results show that the level landing with nose wheel just clear of ground condition has the largest strain in all directions, which is the most dangerous condition. This study focuses on the analysis of the calculation results of this condition.
The damage coefficient of leaf spring structure based on the Puck failure criterion is shown in Fig. 8. Fig. 8 (a) shows the damage parameter of Mode A under limit load condition.The maximum damage parameter is at the leading edge of the outer connection point of the leaf spring, and the value is 0.9841<1.Fig.8(b)shows the damage parameter of Mode B under limit load condition. The maximum damage parameter is at the rear edge of the outer connection point of the leaf spring, and the value is 0.6494<1. Fig. 8 (c) shows the damage parameter of Mode C under ultimate load condition. The maximum damage parameter is at the leading edge of the outer connection point of the leaf spring, and the value is 0.9451<1. Fig. 8 (d) shows the damage parameter of fiber tensile strength under ultimate load condition. The maximum damage parameter is at the leading edge of the outer connection point of the leaf spring, and the value is 0.9166<1.Fig. 8 (e) shows the damage parameter of fiber compressionstrength under ultimate load condition.The maximum damage parameter is at the rear edge of the outer connection point of the leaf spring,and the value is 0.9814<1.The above damage parameter shows that the leaf spring meets the strength requirement.

Table 2 Aircraft ground load conditions.

Fig. 5 The first stage of optimization process.

Fig. 6 The second stage of optimization process.
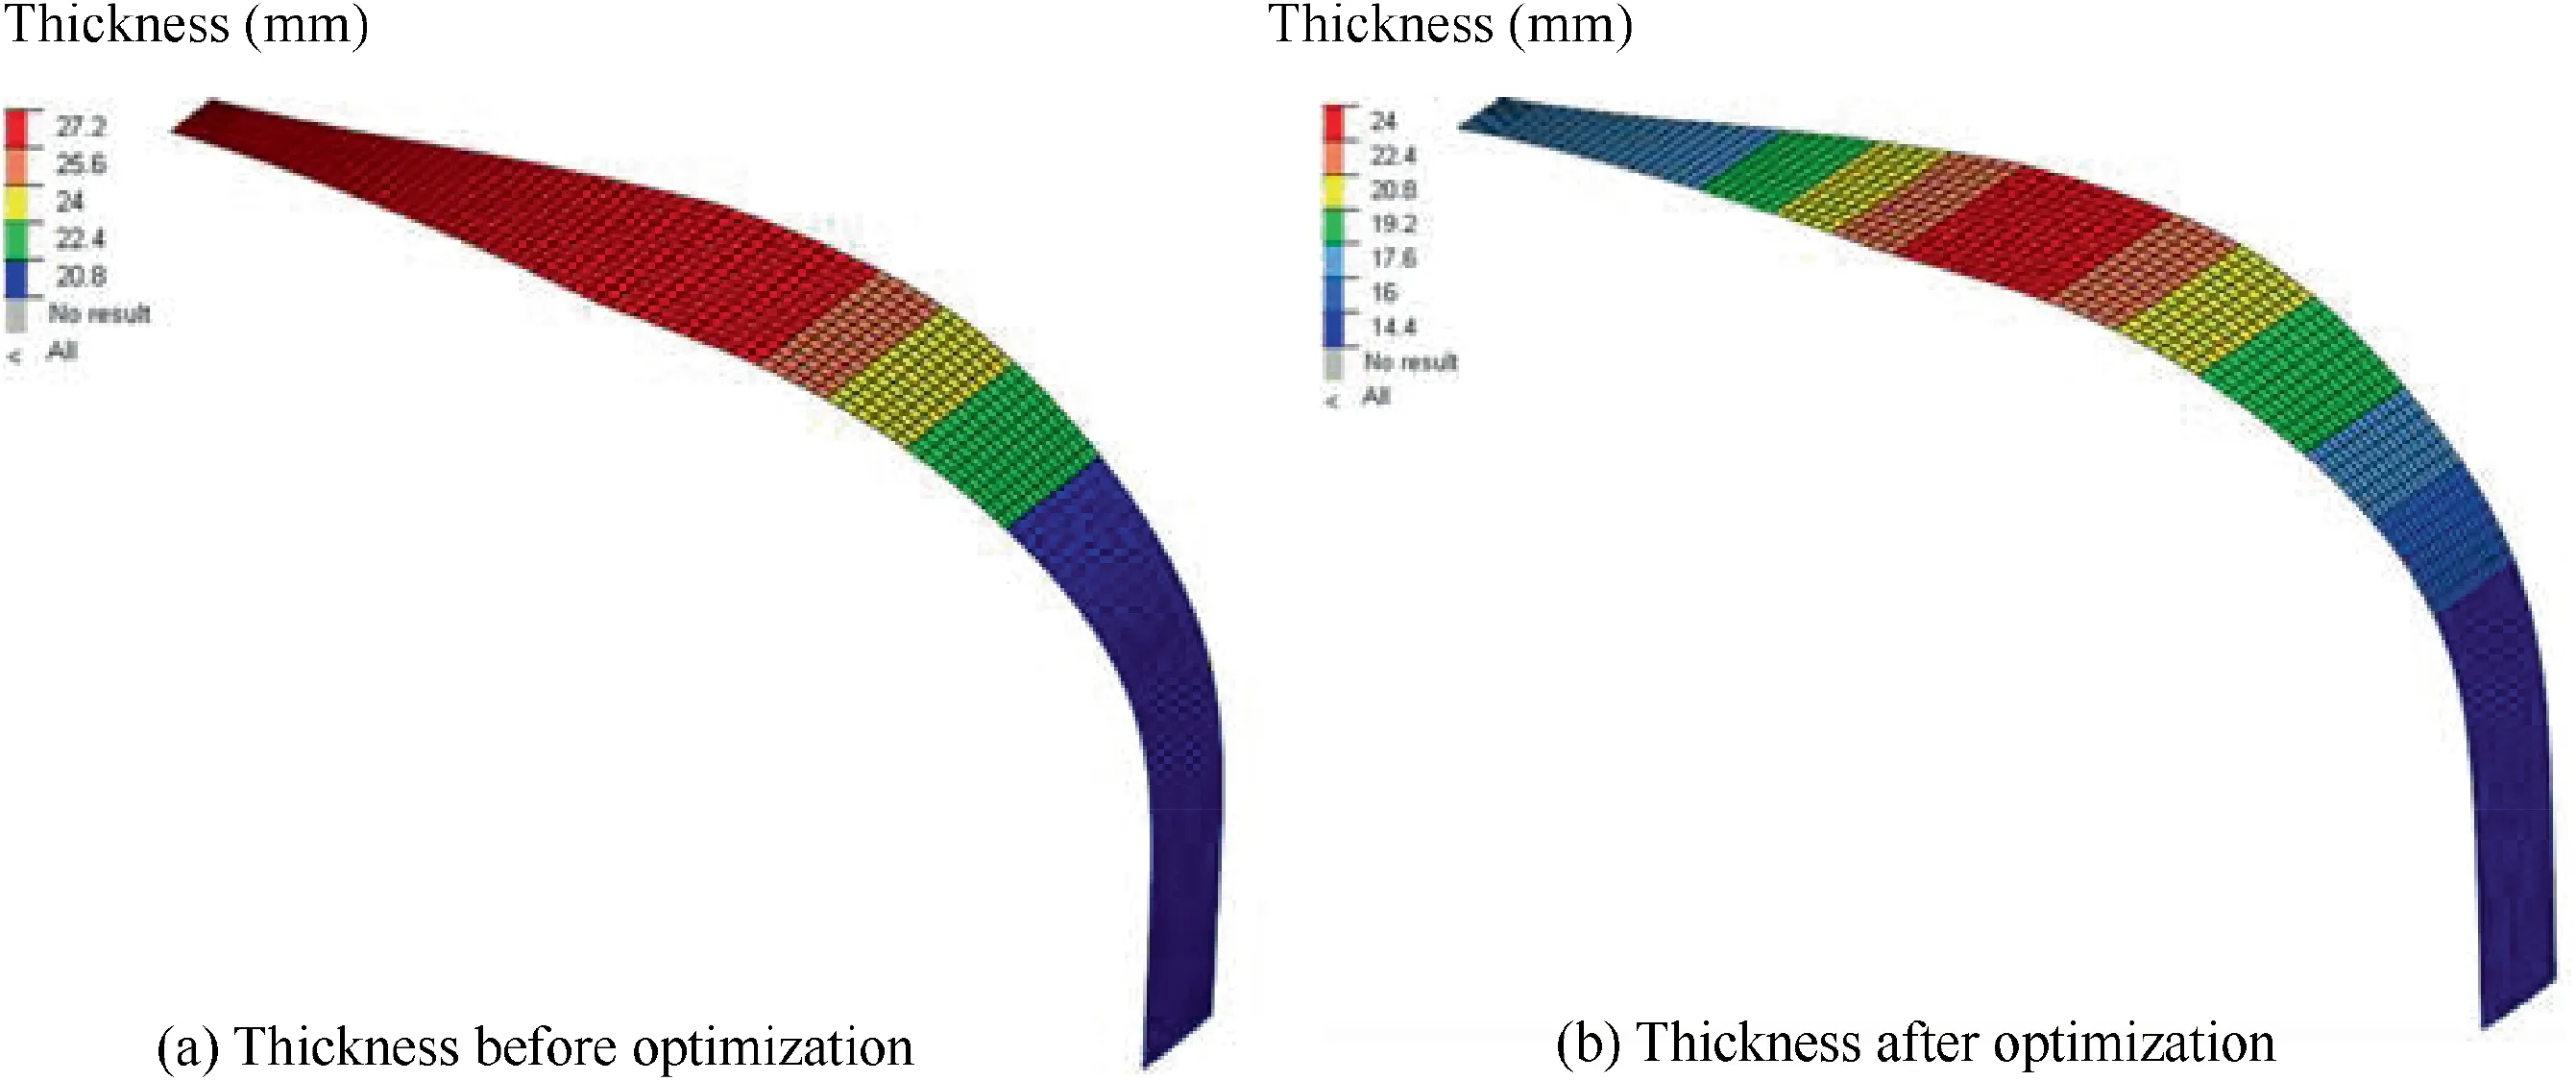
Fig. 7 Comparison of thickness before and after optimization.

Table 3 Comparative data.
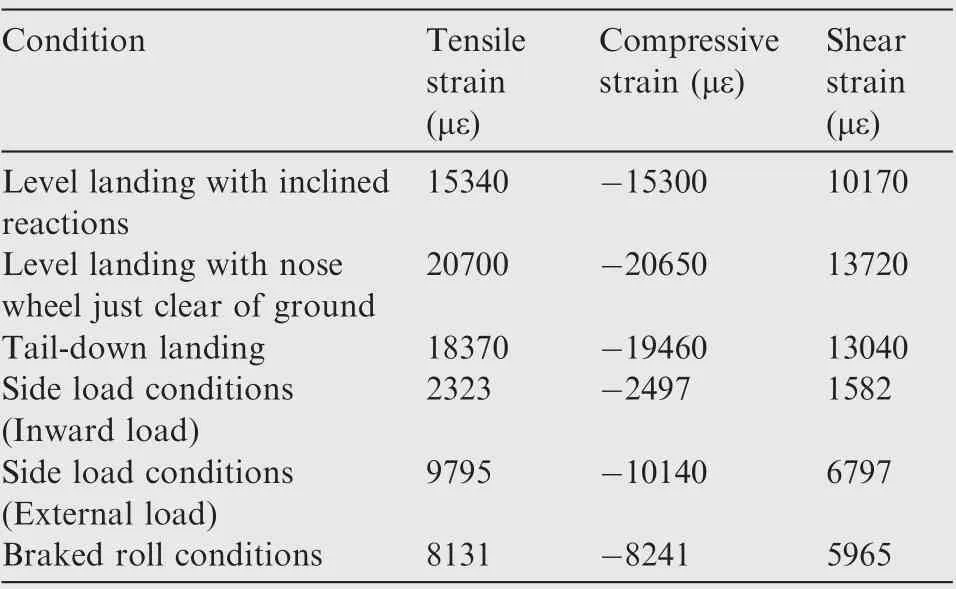
Table 4 Maximum strain of each working condition.
The deformations in limit load of the leaf spring are shown in Fig.9.Fig.9(a)shows the total deformation with the maximum deformation of 287.6 mm. Fig. 9 (b) shows the Xdirection deformation with a maximum deformation of 43.61 mm. Fig. 9 (c) shows the Y-direction deformation with a maximum deformation of 169.6 mm. Fig. 9 (d) shows the Z-direction deformation with a maximum deformation of 270 mm. The Y-direction deformation of the loading point is 169.6 mm, which satisfies the rigidity design requirements of the leaf spring.

Fig. 8 Puck criterion damage parameter.
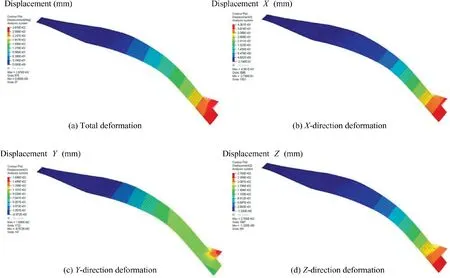
Fig. 9 Deformation of leaf spring under limit load.
4. Experimental verification
4.1. Strength experiment scheme
In accordance with the above theoretical analysis, the level landing with nose wheel just clear of ground condition is selected as the maximum load condition. The experiment is divided into two stages. First, we conduct the static strength verification experiment to increase the load to the ultimate load. The purpose of this step is to verify whether the leaf spring meets the stiffness and strength requirements and to record the 3D displacement of the axle loading point and the strain of the leaf spring.A total of 12 strain gauges are pasted on the inner and outer surfaces of the leaf spring, as shown in Fig.10.Second,the failure experiment is conducted after static strength verification. Continuous loading is provided until the leaf spring is damaged. In this manner, we can determine the ultimate strength load of the leaf spring.
The experiment loading scheme is shown in Fig. 11. The loading frame and wheel axle loading points are connected with the crane.Unloading and loading are operated by the lifting and descending of the crane. To simulate the vertical and backward loads, we load sand bags of corresponding weight into the loading frame 11 times until the ultimate load is achieved. The initial load is 30% ultimate load. Subsequently,10%ultimate load is added each time until 67%ultimate load that reaches the limit load. When the load reaches the limit load,the structure is completely unloaded after 30 s of continuous loading to check whether the structure presents irreversible deformation. After being reloaded to the limit load,the load is continued at 5%ultimate load until 100%ultimate load. The static strength verification stage experiment is completed after 3 s under the ultimate load. After 100% ultimate load, the failure experiment continues loading with 5% ultimate load each time until the leaf spring is damaged.
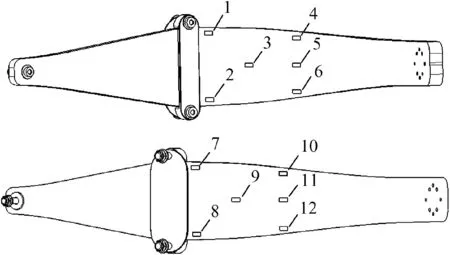
Fig. 10 Strain gauge distribution.
4.2. Static strength verification experiment
During the process from no-load to limit load, no abnormal noise occurs in the leaf spring structure. This occurrence is maintained for 30 s under limit load, and the structure does not break down. After unloading all the loads, we determine that the structure does not have irrecoverable deformation in accordance with the displacement before and after unloading.We reload until the ultimate load is reached. No damage occurs to the structure after the loading state is maintained for 3 s under ultimate load. The deformation of leaf spring under ultimate load is shown in Fig. 12.
4.3. Static strength failure experiment and failure analysis
When loaded to 115% ultimate load, the structure of leaf spring is seriously damaged.The tensile failure of fibers occurs at the inner surface and outer joints of the leaf springs.At the same time, delamination failure occurs at the layer 10. The delamination failure location is the same as the simulation result of Mode C. The delamination of specimen and simulation result are shown in Fig. 13.
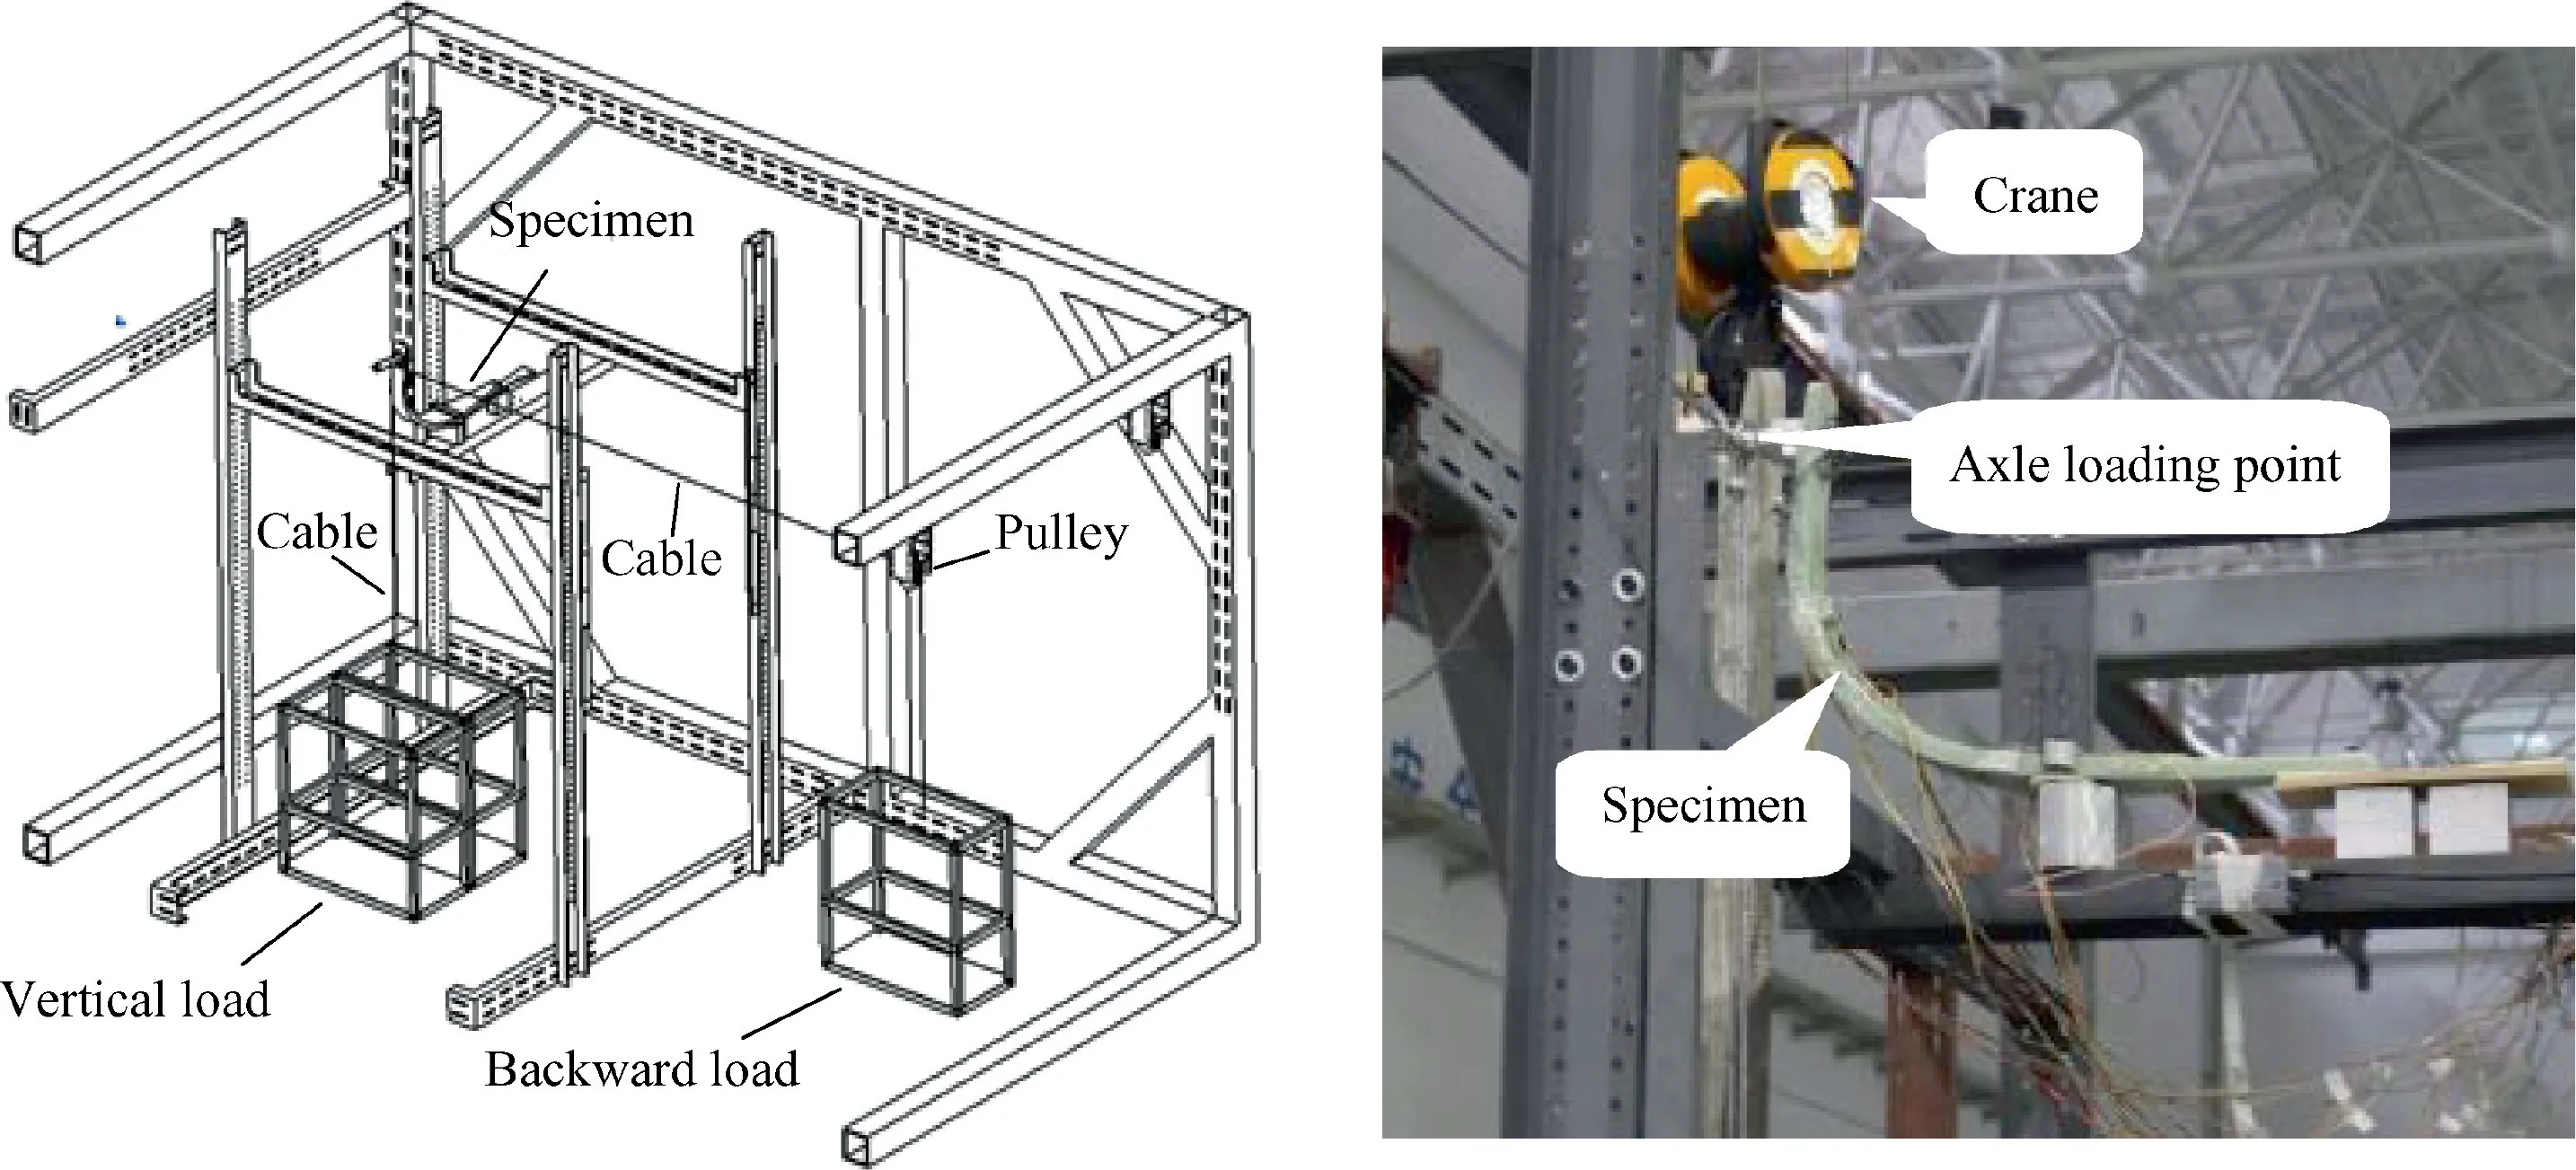
Fig. 11 Experiment loading scheme.
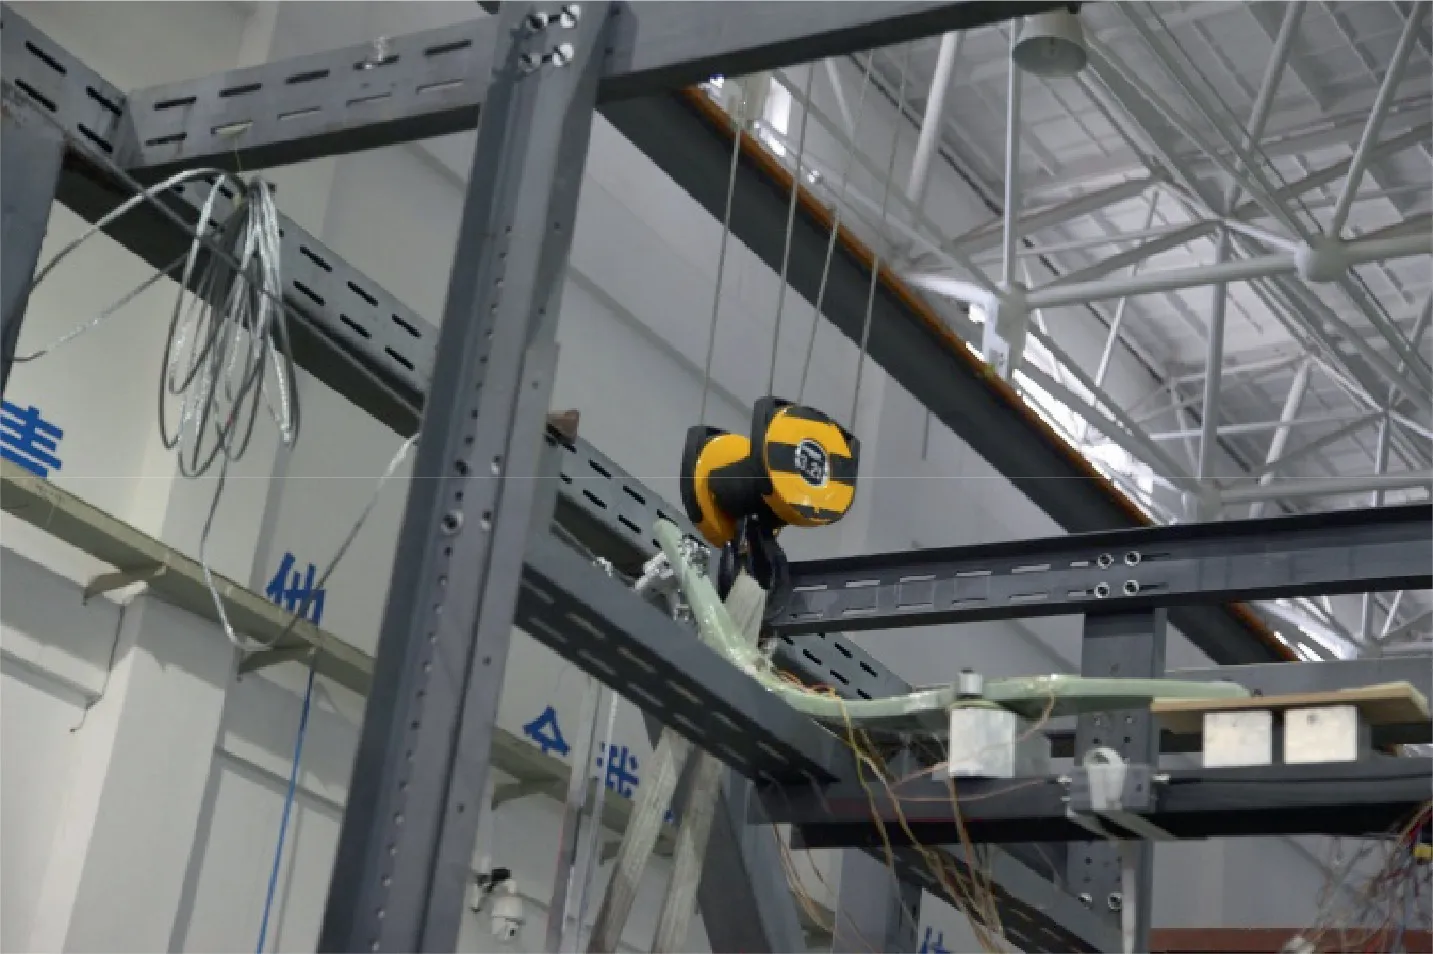
Fig. 12 Deformation of leaf spring under ultimate load.

Fig. 13 Leaf spring delamination failure.
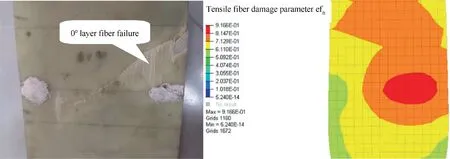
Fig. 14 Inner surface fiber failure at 0° layer of leaf spring.
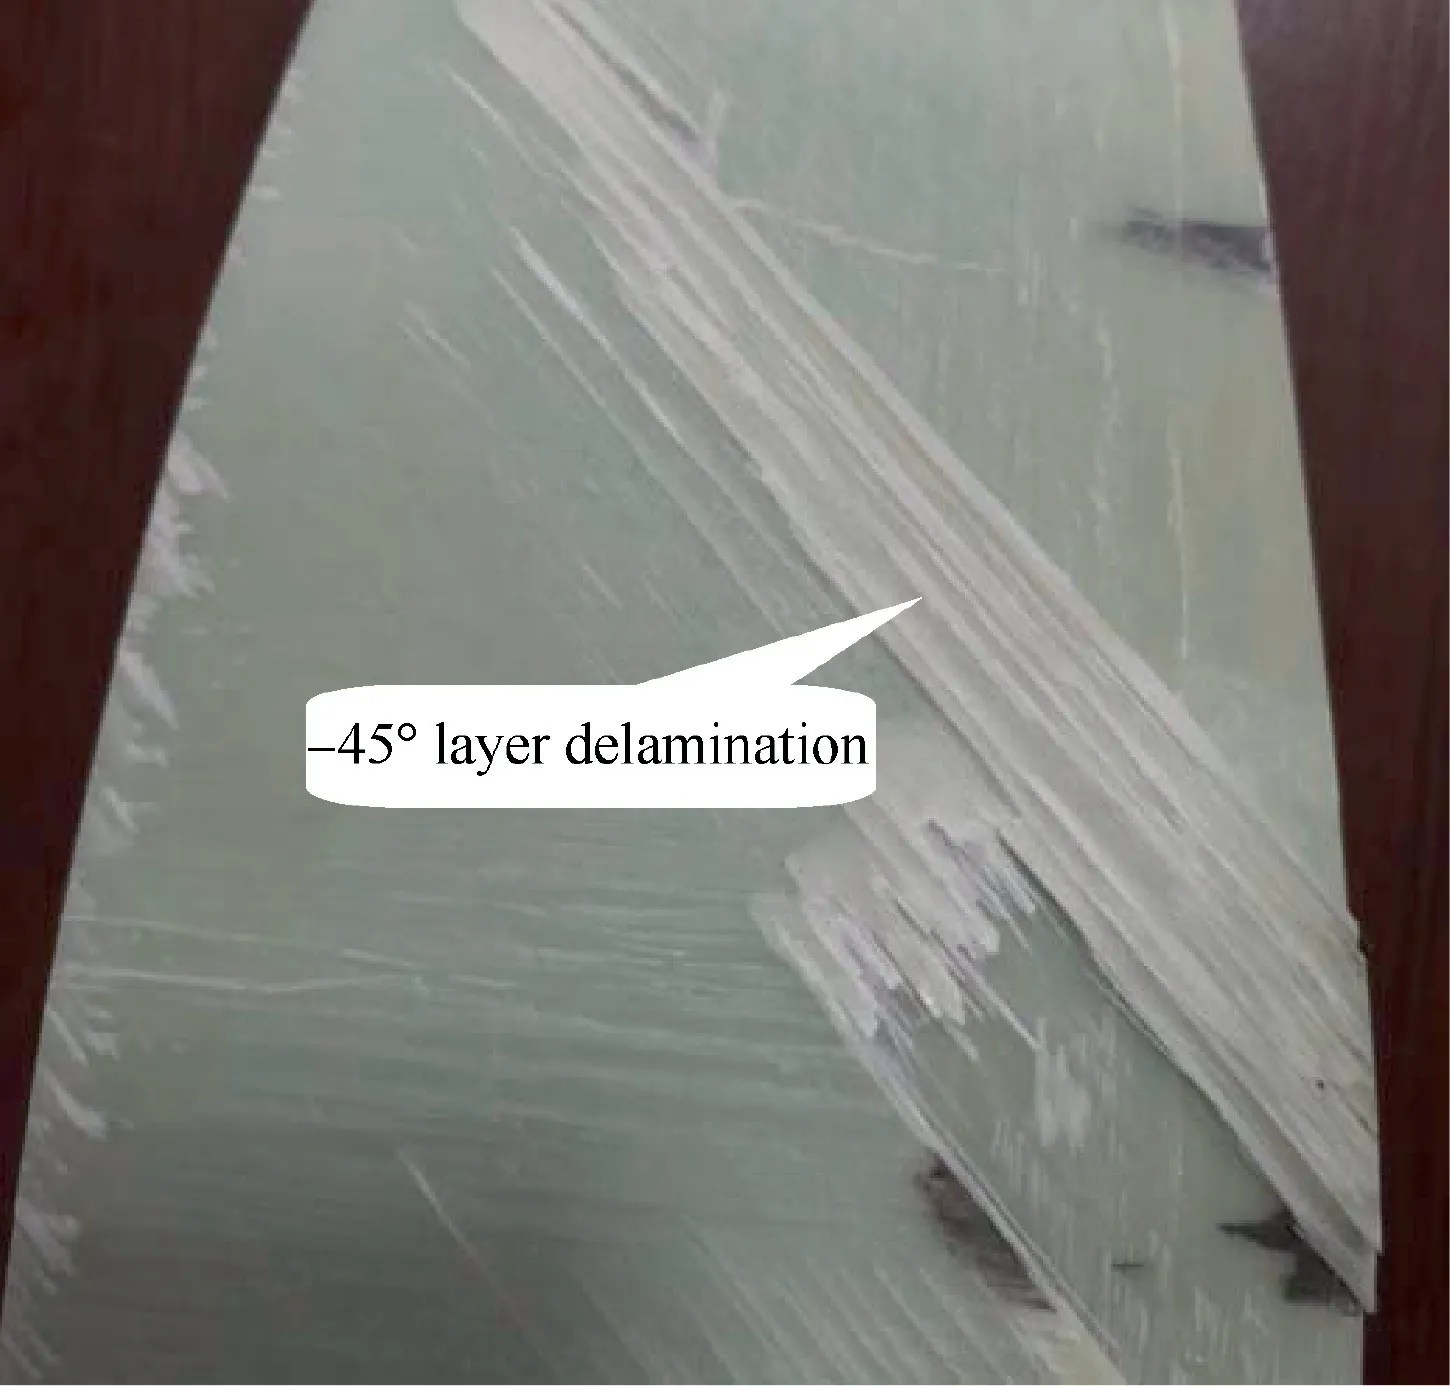
Fig. 15 Delamination at-45° layer of leaf spring.
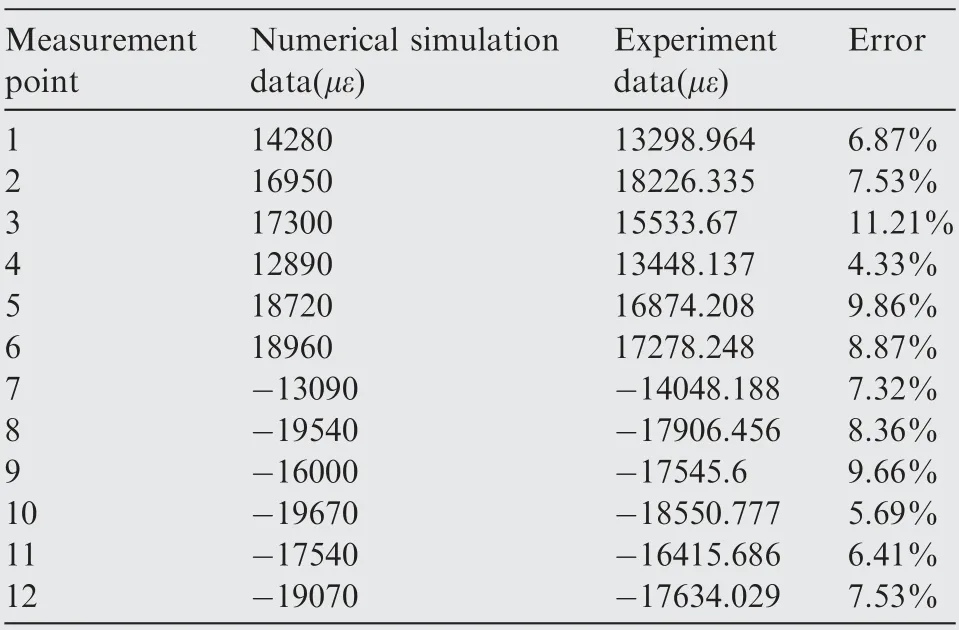
Table 5 Comparison of strain data.
The inner surface of the leaf spring is tensioned under failure load. The leading edge of the leaf spring bears more tension than the rear edge, because of the simultaneous action of vertical and backward loads.As a result,fiber failure occurs in the direction of the 0° layer at the leading edge of the outer connection point of the leaf spring. This occurrence is consistent with the maximum position of the theoretical analysis of the fiber tensile damage coefficient.The inner surface fiber failure of the leaf spring and simulation result are shown in Fig.14.After the experiment,we separate the layers,as shown in Fig. 15. Delamination occurs at the layer 10, where the direction is -45°. During the leaf spring experiment, the axle loading point of the wheel bears backward loads, and torsion occurs along the leaf spring.The-45°layer bears compressive stress in the direction of the fiber under torsion. The fracture surface between the fibers is inclined. Moreover, the failure location is consistent with the maximum damage coefficient of mode C failure in the theoretical analysis. In conclusion,the simulation model can predict the failure position and failure mode of leaf springs well. The relative error of strength between the experiment and theory is 14.4%.

Fig.16 Displacement curve of axle loading point.
4.4. Analysis of experiment data
Comparisons of strain data under ultimate load are shown in Table 5. The maximum tensile strain is 18960 (με), and the minimum compressive strain is -19070 (με). Compared with the simulation results, the maximum error is 11.21%. The Xdirection, Y-direction, and Z-direction displacement of the axle loading point are presented in Fig. 16. The transverse coordinate is the percentage of ultimate load, the longitudinal coordinate is the displacement of loading point, the solid line is the experiment data, and the dashed line is the simulation data. The maximum error of simulation results is 9.76%. The measured Y-direction displacement is 177 mm under limit load (load of 67%). The simulation results show that the Y-direction displacement is 169.6 mm, and the error is 4.18%. In conclusion, the simulation results can predict the strain at each point and the displacement of the axle loading point of the leaf spring. The error is acceptable, and the leaf spring meets the design requirements of stiffness and strength.
1) The optimization of the composite landing gear considers the change in ground load due to the change in stiffness. Compared with specified leaf spring displacement,this method can achieve the optimized results when the strength and stiffness of leaf spring reach the limit state at the same time.
2) The error between the numerical simulation and the measured Y-direction displacement of the axle loading point is 4.18%, which shows good agreement. The leaf spring landing gear meets the rigid design requirements.The error between the numerical simulation and the measured strain is 9.76%. The leaf spring is damaged when the ultimate load is 115%. And the error of numerical simulation is 14.4%. The location and form of failure are consistent with the theory. The results show that the results of simulation optimization can accurately predict the structural strength.
3) The goal of weight reduction is achieved while meeting the design requirements of strength and stiffness is ensured. The weight of the original landing gear structure is 4.9 kg, the optimized weight is 3.8 kg, and the weight reduction is 22.4%.
Acknowledgement
This work is supported by the Natural Science Foundation of Liaoning (No. 20180550824).
 CHINESE JOURNAL OF AERONAUTICS2020年10期
- CHINESE JOURNAL OF AERONAUTICS的其它文章
- A novel surrogate modeling strategy of the mechanical properties of 3D braided composites
- A user-friendly yield criterion for metals exhibiting tension-compression asymmetry
- Aerodynamic characteristics of morphing wing with flexible leading-edge
- High cycle fatigue failure with radial cracks in gears of aero-engines
- Motion equations of hemispherical resonator and analysis of frequency split caused by slight mass non-uniformity
- Light weight optimization of stratospheric airship envelope based on reliability analysis
