Closed-loop flow control of an ultra-compact serpentine inlet based on nondimensional model
Xingya DA, Jianchao FAN
High Speed Aerodynamics Institute, China Aerodynamics Research and Development Center, Mianyang 621000, China
KEYWORDS Closed-loop flow control;Flow distortion;Nondimensional feedback;PI control;Serpentine inlet
Abstract Ultra-compact serpentine inlet faces serve inlet-engine compatibility issues due to flow distortion. To ensure inlet-engine compatibility over a wide range of Mach number, novel active flow control techniques with the ability of being opened or adjusted as needed draw many attentions in recent years. In this paper, a feedback control system was developed based on the method of microjet blowing. The proposed system includes a pressure adjusting valve to adjust the control effort, a dynamic pressure sensor to sense the inlet distortion intensity, a signal processing instrument to calculate the Root-Mean-Squared(RMS)pressure,and a controller to implement feedback control. To achieve high quality closed-loop controls at dynamic conditions, a novel nondimensional feedback method was developed. The advantage of this nondimensional method was validated at both off-design and arbitrarily changing Mach number conditions. With a sectional PI control law, the RMS control error reduced more than 56% at arbitrary changing conditions.Works in this paper also showed that the dynamics of this nondimensional system can be simplified as a stable second-order overdamped system.
1. Introduction
Although serpentine inlet has found its ways in both military and civil aircrafts for decades, requirement of reducing inlet length still exists in the aviation industry.1,2The length of inlet often dictates the size, mass and consequently the payload capacity of the vehicle. However, reducing inlet length poses a great challenge of flow separation induced distortion, which leads to the loss of engine stability margin or even engine surge. To ensure acceptable inlet performance, the flow needs to be controlled through relieving or even suppressing the internal flow separation.
Passive flow control devices always have fixed shapes.3They work well at a single design point,but inevitably become less effective or even introduce extra losses at off-design conditions.4One frequently encountered off-design condition is the change of inlet mass flow rate, which can be expressed as a function of inlet throat Mach number. Such off-design condition is encountered when the engine power setting or the flight speed changes. The process of changing engine power setting or flight speed also results in dynamic changing of inlet work condition. For such cases, feedback control based on active flow control devices is more favorable.
In contrast to passive controls, active control devices may be tailored to provide near optimum performance at all conditions. Typical active flow control methods are microjet blowing,5-7parallel blowing,8blowing and suction,9and pulsed blowing10,11. Among these methods, continuous microjet blowing has been approved to be a highly efficient way.Works of Hamstra,5Rabe,6and Da7et al. showed its advantages of higher controllable Mach number and lower energy consumption. This method, also known as jet-type vortex generator,requires less than 1% of the inlet airflow rate to achieve 75%reduction in distortion intensity.6Since the control effectiveness depends on the adjustable blowing rate, the system can be tailored as needed, making it feasible to execute feedback controls at off-design conditions.
As referred to microjet based feedback control for serpentine inlet, only Anderson developed a feedback system.12His main contribution is the development of a non-intrusive sensing technique that uses dynamic pressure sensors to provide distortion intensity feedback in the automated system. Such sensing technique is also used in external flow control applications.13In Anderson’s work, four microphone sensors were used. Their measurements were reduced to RMS pressures,and finally a response model, which relates the control effort to the distortion intensity, was established based on these RMS pressures. This system was especially designed at throat Mach number 0.55, at which design condition, the system has the ability of being activated immediately after receiving an open command. While this system was only designed at fixed Mach number, feedback control still needs to be further explored at off-design and dynamic conditions.
This paper, aiming to alleviate the flow distortion at offdesign and dynamic conditions, presents a novel nondimensional feedback control method. In this method, the pressure of the microjet plenum was sent back into the control system and only one dynamic pressure sensor was used.These two pressure measurements were used to construct a nondimensional response model. By doing so, the system became less sensible to Mach number changes and thus,had better performance at off-design and dynamic conditions.
2. Microjets configuration
Microjet flow control usually contains tens of millimeter-level jets.As a blowing-type method,each microjet creates a streamwise vortex to transfer the high-momentum fluid of the main flow to the near-wall zones.14,15This process enhances the resistance of boundary-layer flows to the adverse pressure gradient generated by the diffusing and curved duct.Since serpentine inlet naturally produces streamwise vorticities,16microjets can be configured to create inverse vorticities such that the natural secondary flow can be compensated while still enhancing flow mixing.As a result,the control effectiveness improves significantly. Such configurations are also called secondary flow control method.
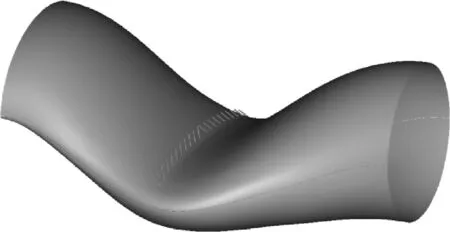
Fig. 1 Control affecters.
Fig. 1 shows such designed microjets for an ultra-compact serpentine inlet. This inlet had two S-ducts in order to keep a light-sight blockage of the engine face. As compared with the inlet studied by Rabe6and Anderson,12this inlet was shorter and more curved. The length and longitudinal offset of the first S-duct were 1.1D and 0.7D respectively, where D is the outlet diameter.The second S-duct had a length and offset of 1.4D and-0.4D respectively. The cross-section with maximum longitudinal offset located at x/L=0.44, where L is the inlet length.This inlet faced a severe problem of flow separation in the second bend. The flow separated immediately downstream the entrance of the second S-duct, as can be seen in Fig. 2.
To compensate the natural vortices, these microjets were configured into two sets,which orient in inverse directions with respect to the center plane,as shown in Fig.1.The diameter of each microjet is only 0.8%of the outlet diameter.The blowing homogeneity was assured through using a large surrounding plenum and checked through examining the outlet total pressure. Since this inlet was to be used in a subsonic blended wing-body aircraft cruising at Mach number 0.6, the designed throat Mach number is set to be 0.5.
Tests in a direct-connected inlet facility were previously conducted to validate the control effectiveness. The test inlet had an outlet diameter of 250 mm, and thus, the diameter of each microjet hole is only 2 mm. Results showed that the separation at the upper surface can be suppressed at throat Mach number 0.5 and below.7Only 0.65%of the inlet mass flow rate was needed at throat Mach number 0.5. The distortion contours with and without flow control at this condition is shown in Fig.3,where Ptrepresents the total pressure and Pt0the free stream total pressure.Significant improvement on the pressure distribution can be found in the upper region where the pressure deficiency was located in the non-control case. The average circumferential distortion intensity for this condition was reduced from 0.046 to 0.012.Definition of the average circumferential will be given in Section 4.4 and details can be found in Ref. 6.
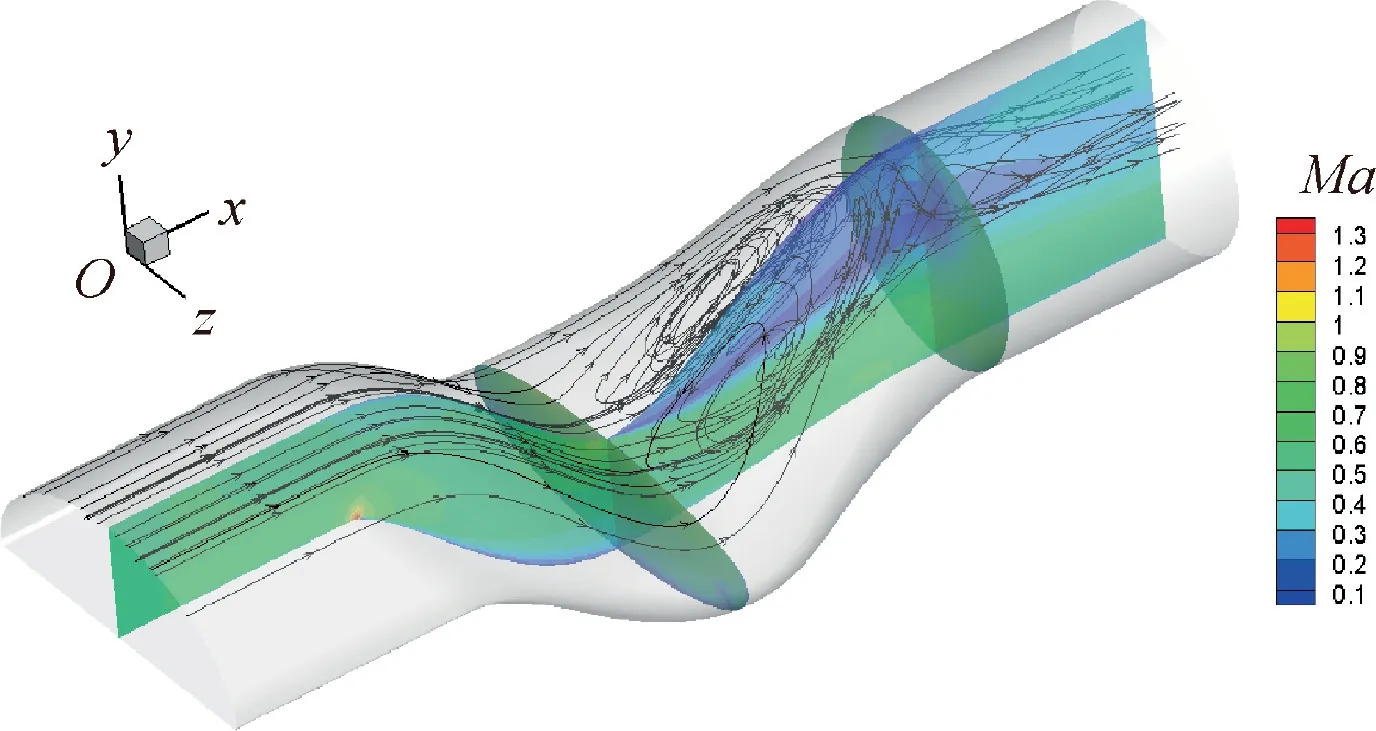
Fig. 2 Internal flow separation.
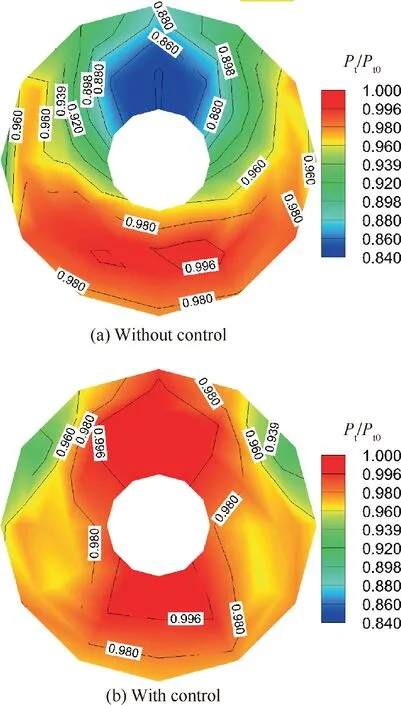
Fig. 3 Distortion contours at throat Mach number 0.5.7
3. Feedback control system
3.1. Control system structure
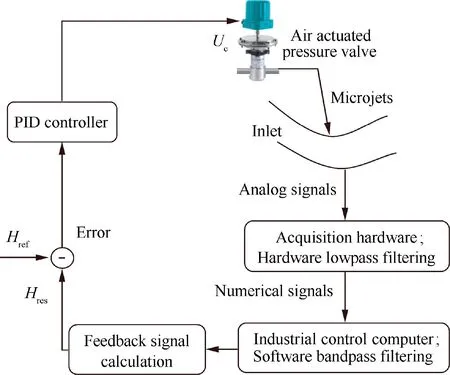
Fig. 4 Block diagram of feedback system.
Following Anderson’s work,12the control system used a similar non-intrusive sensing technique. The system structure was close to that of Anderson, as shown in Fig. 4, where Ucis the electric control voltage, Hresis the response signal of the control system and Hrefis the reference of the response signal.Several parts were necessary in such system, including a pressure regulator, a data acquisition and processing device, an observer for control effectiveness, and a feedback controller.Instead of developing new hardware, some lab equipment was used. For instance, the system used an air actuated pressure regulator, which was controlled by a pressure controller through receiving an external analog electric voltage signal Uc.The observer was complemented digitally rather than using hardware. The feedback controller was a typical programmable industry proportional and integral controller, for which the control effort is the summation of a proportional term and an integral term about the error between the control reference Hrefand response Hres. Here, the control effort indicates the energy injected to the flow,which can be represented by the blowing rate or directly by the analog electric voltage of the pressure controller. The control response is the real-time output of the observer, while the reference is the system setpoint representing the expected control condition. In short,the work mechanism of the system was to update the voltage of the pressure controller based on the error between the real-time observe and the expectation.
In order to achieve good control qualities at off-design conditions, two advancements were made as compared to Anderson’s system structure. First, the system used only one highfrequency dynamic pressure sensor which was flush-mounted at 36° of the outlet, namely, the ninth sensor in Fig. 5. From the perspective of practical engineering application, reducing the usage of dynamic sensors helps to improve the reliability of the control system. This sensor was selected from fifteen locations along the top centerline and at the outlet, as can be shown in Fig. 5. Prior test showed that the placement of the ninth sensor coincides with the regions of controllability by the control system and is the nearest to the center of the right-side vortex core. It was also found that these fifteen RMS pressures have similar characteristics with respect to the control effort,as can be seen from Fig.6,which means that the choice of sensor is equivalent. In Fig. 6, Cmfis the mass blowing rate and Δprmsis the RMS pressure.
Fig.7 shows the RMS pressure of the ninth sensor at different throat Mach numbers Mathand blowing rates Cmf. At throat Mach number 0.5, the RMS pressure decreased with the increase of control effort. Tremendous decrease occurred at blowing rate between 0.62% and 0.64%. Then the RMS pressure slightly increased until the blowing rate exceeded 0.8%.After that point,negative effect on the flow disturbance was found. This phenomenon is similar to a study conducted by Kwong and Dowling who concluded that steady injection could cause unsteady oscillation in the flow to become larger.17The distortion contour between blowing rate 0.64%and 0.8%was the same with that in Fig. 3, indicating that this RMS pressure was highly related to the distortion intensity and can be used to represent the control effectiveness. At other throat Mach numbers, there also existed a transition point where the optimum control point located and after which the RMS pressure remained almost unchanged.
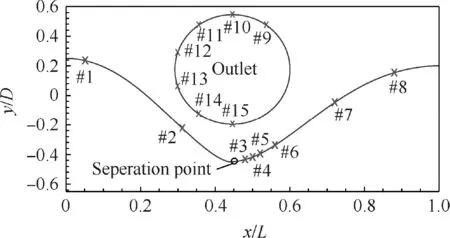
Fig. 5 Distribution of RMS pressure sensors.
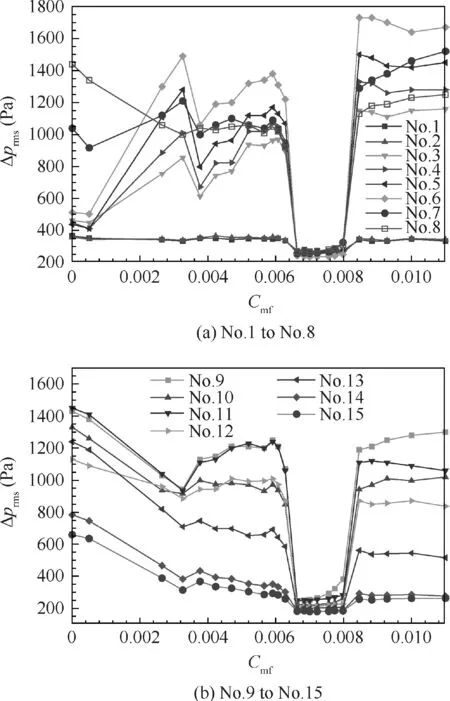
Fig. 6 RMS pressures at throat Mach number 0.5.
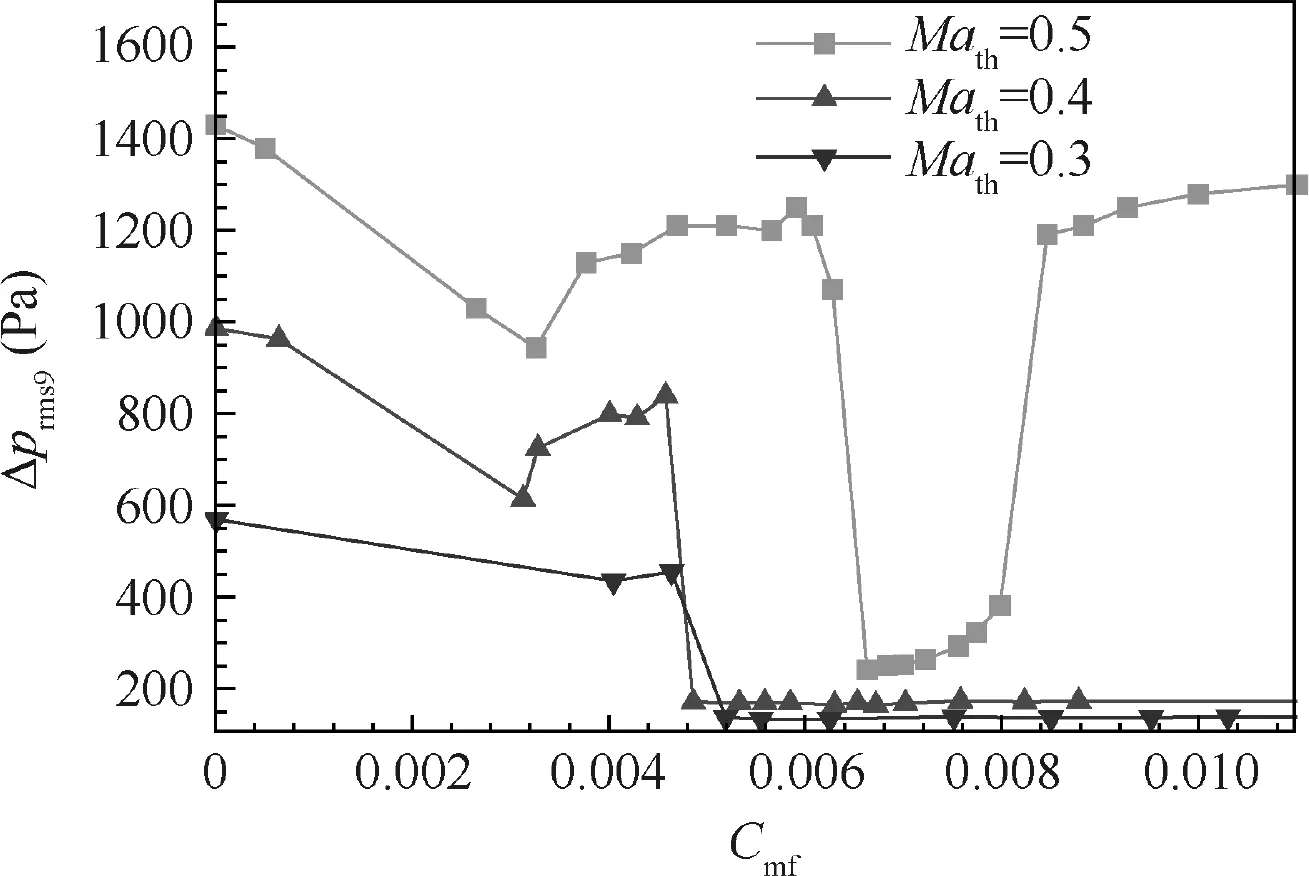
Fig. 7 RMS pressures of sensor 9 at different throat Mach numbers.
The second advancement was that the pressure of the microjet was sent back into the control system to nondimensionalize the response model. From Fig. 7, one can see that the optimal control effort located at different blowing rates for different throat Mach numbers. If the RMS pressure at throat Mach number 0.5 was used as the distortion observer,the system should not work well at other throat Mach numbers. Directly using the RMS pressure as the feedback also faced two control issues.The first was the poor system dynamics caused by the steep slope near the optimum control points and the nearly unchanged features after the optimum control points.The second was the difficulties in designing the control law as a result of the poor system dynamics. Monotonical response is favorable to the control law design. The introduction of the microjet pressure worked with such function which will be further discussed in the next section.
3.2. Nondimensional response model
With the attempt to produce monotonic response and make it insensible to the throat Mach number, the pressure of the microjet was used to nondimensionalize the RMS pressure.A pressure transducer was mounted in the surrounding plenum to measure the total pressure Pjof the microjet. This pressure is also a metric of the control effort. Hence, the observer becomes as

Fig. 8 shows the steady response to the voltage Ucof the pressure controller. The response decreased rapidly and then became slowly. The slowly decreasing stages corresponded to the conditions of separation suppressing. In these suppressing stages, the RMS pressure became smooth such that the increase of Pjwill result in a slow decrease of Hres. Monotonically decreasing response made the design of the PI compensator much easier. An interesting improvement can be seen from the upper right figure that the response at different throat Mach numbers overlapped between 0.66 and 0.76. In other words,a setpoint of reference between 0.66 and 0.76 was valid for all Mach numbers. This further made the control system simpler at different conditions. In this paper, an intermediate value of 0.7 was chosen as the setpoint of reference for all Mach numbers.
3.3. System dynamics
Before designing the control law, the system dynamics should be determined first. The widely used step response technique was used.Step voltage signal of 0.2 V was set to excite the pressure controller. This voltage is corresponded to the optimum control point of throat Mach number 0.5.The system response is shown in Fig.9.A 0.5 s time lag of the response was shown for this system.This lag was caused by the inflation process of the controller. The valve did not work until a threshold pressure was reached. The time lag had no effect on the system dynamics after the valve starts working. Therefore, it was neglected from the dynamics modelling.
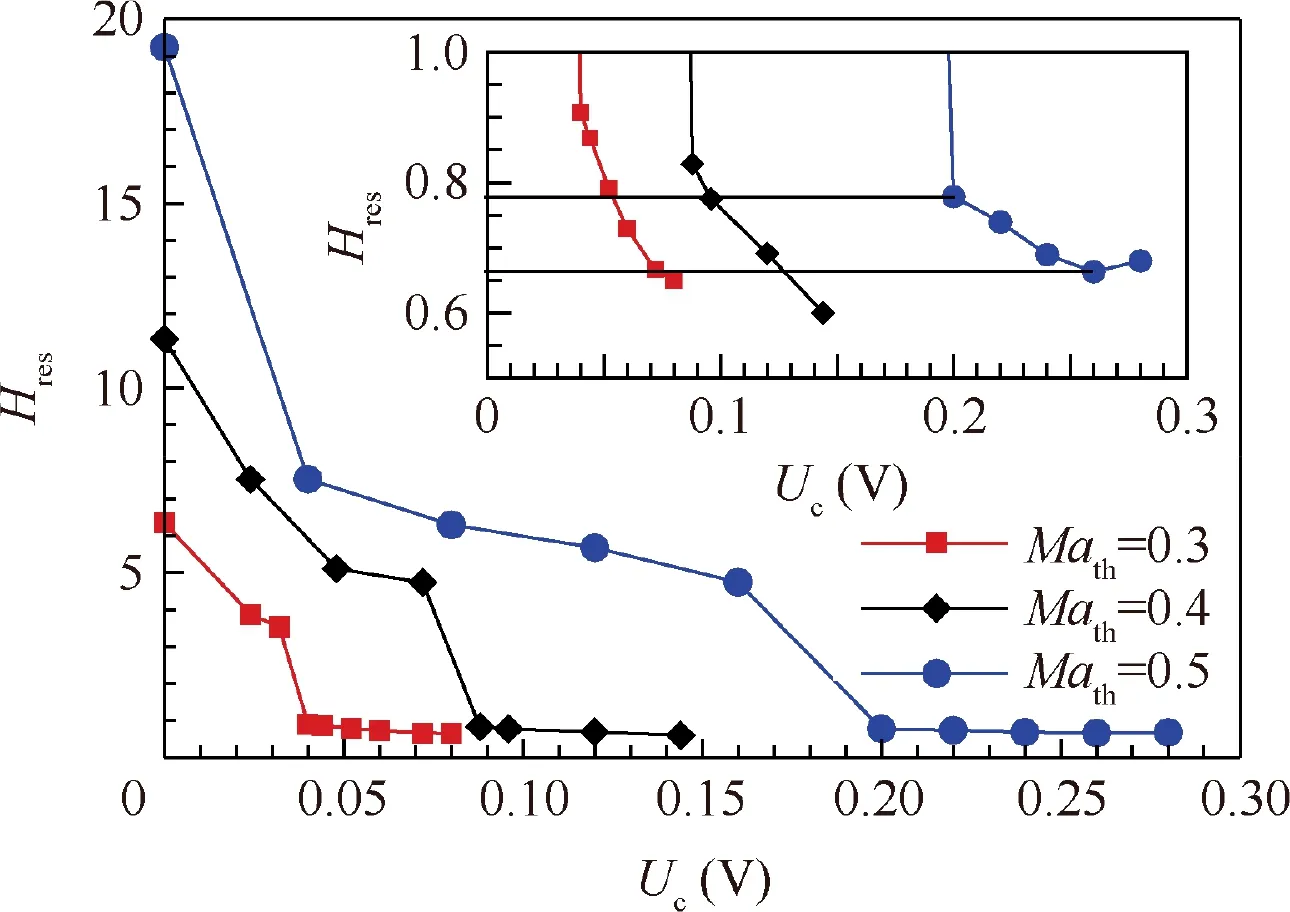
Fig. 8 Steady-state system response.
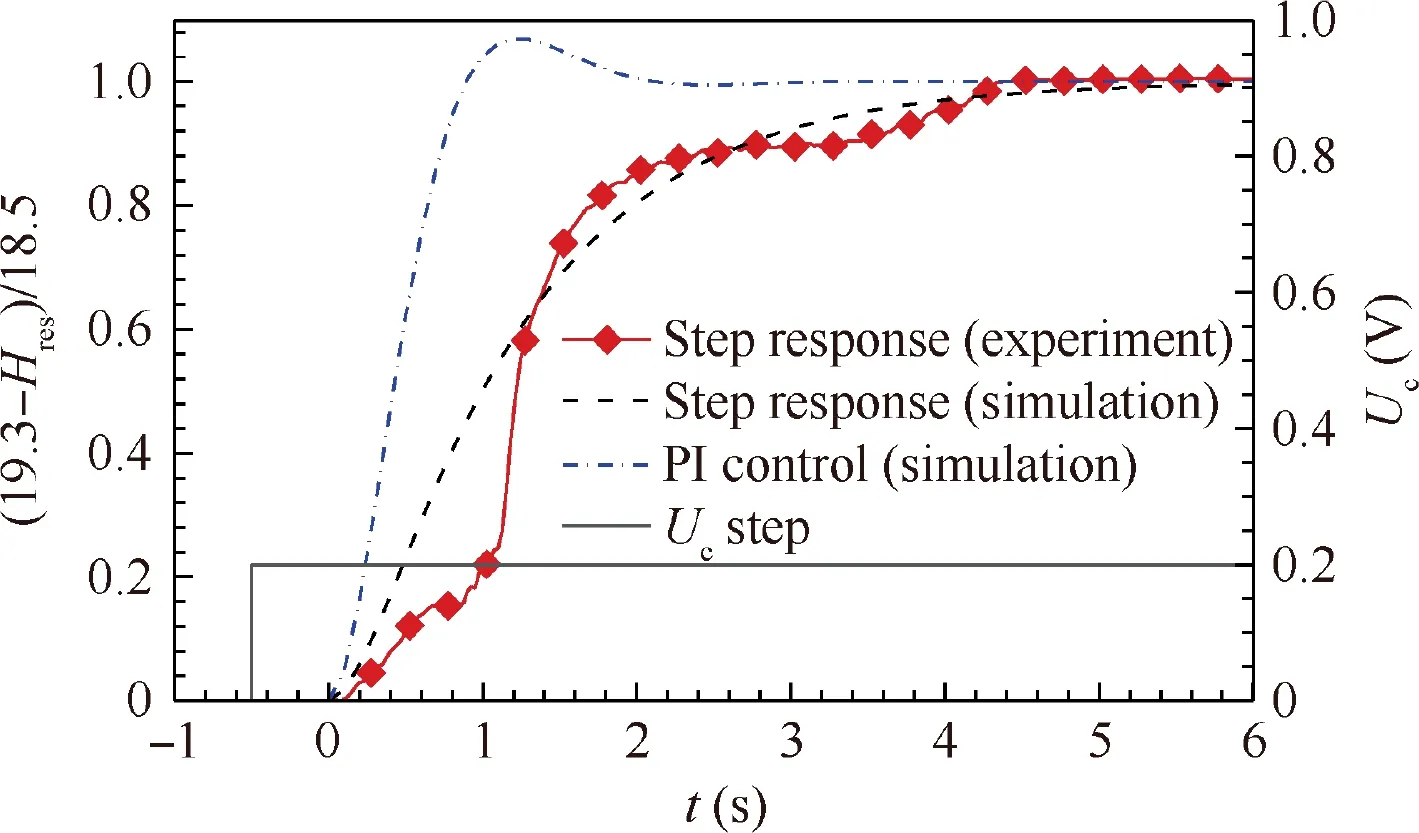
Fig. 9 Stepping response to control effort.
Although the step response curve was somehow irregular,to simplify it as an overdamped second-order system was still a good choice.The transfer function of this system was identified and approximated as
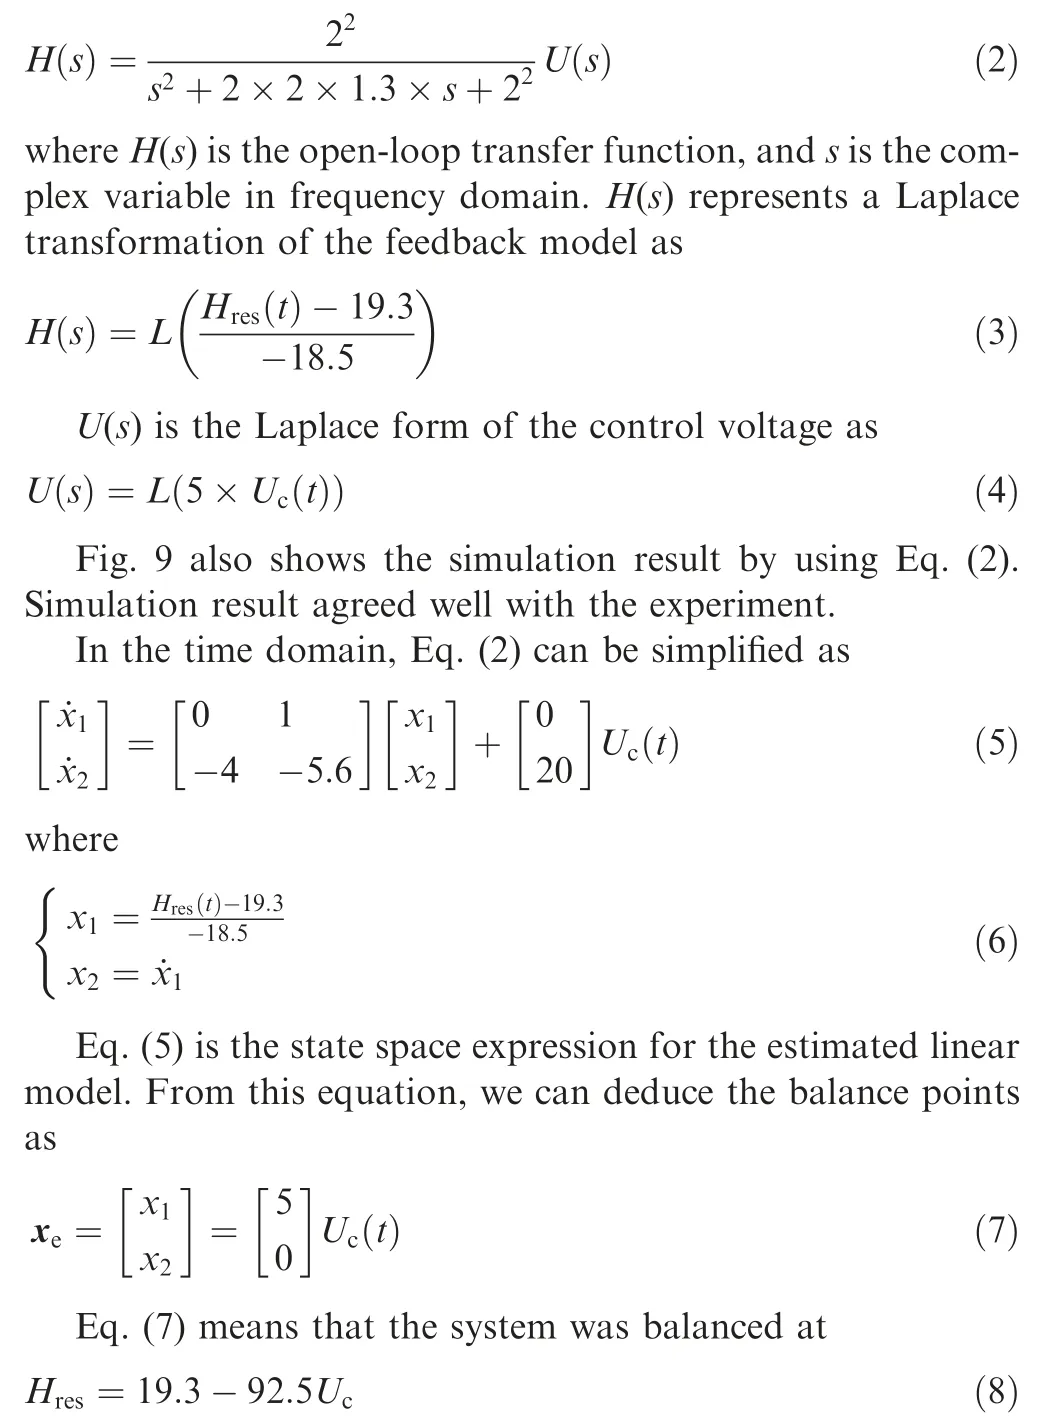
This was exactly the steady response of this system.The stability of this second-order system might be determined from the polar points that were-4.26 and-0.94 respectively.The two points had negative real parts, indicating it was a stable system.
3.4. PI controller
A basic PID control law in the continuous domain can be expressed as
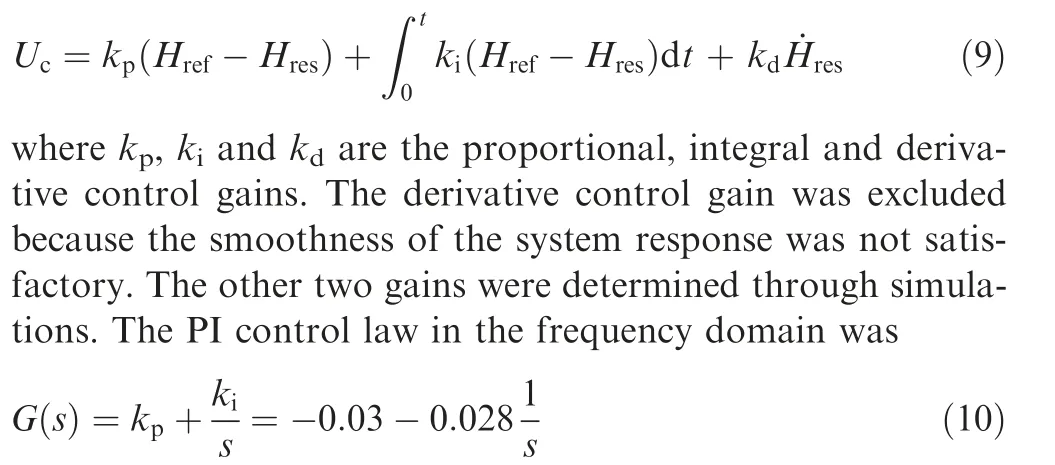
where G(s)is the transfer function of the PI compensator.The relationship between control voltage and control error can be easily deduced by taking Eq.(4)into Eq.(3).Fig.9 also shows the closed-loop simulation result. The response time of this control system was about 0.82 s and the rise time from 0.1 to 0.9 was about 0.75 s. Fig. 10 shows the Bode diagram of this control system. As can be seen, the gain curve decreased with frequency and crossed 0 dB at about 1.9 rad/s. The corresponding phase angle at 0 dB was about 24°. While the phase curve never reached-180°, the gain margin was infinite and the corresponding phase margin was about 66°.The Bode diagram shows that this system was far from the unstable point and had a good stability.
4. Results and discussion
4.1. Results at fixed conditions
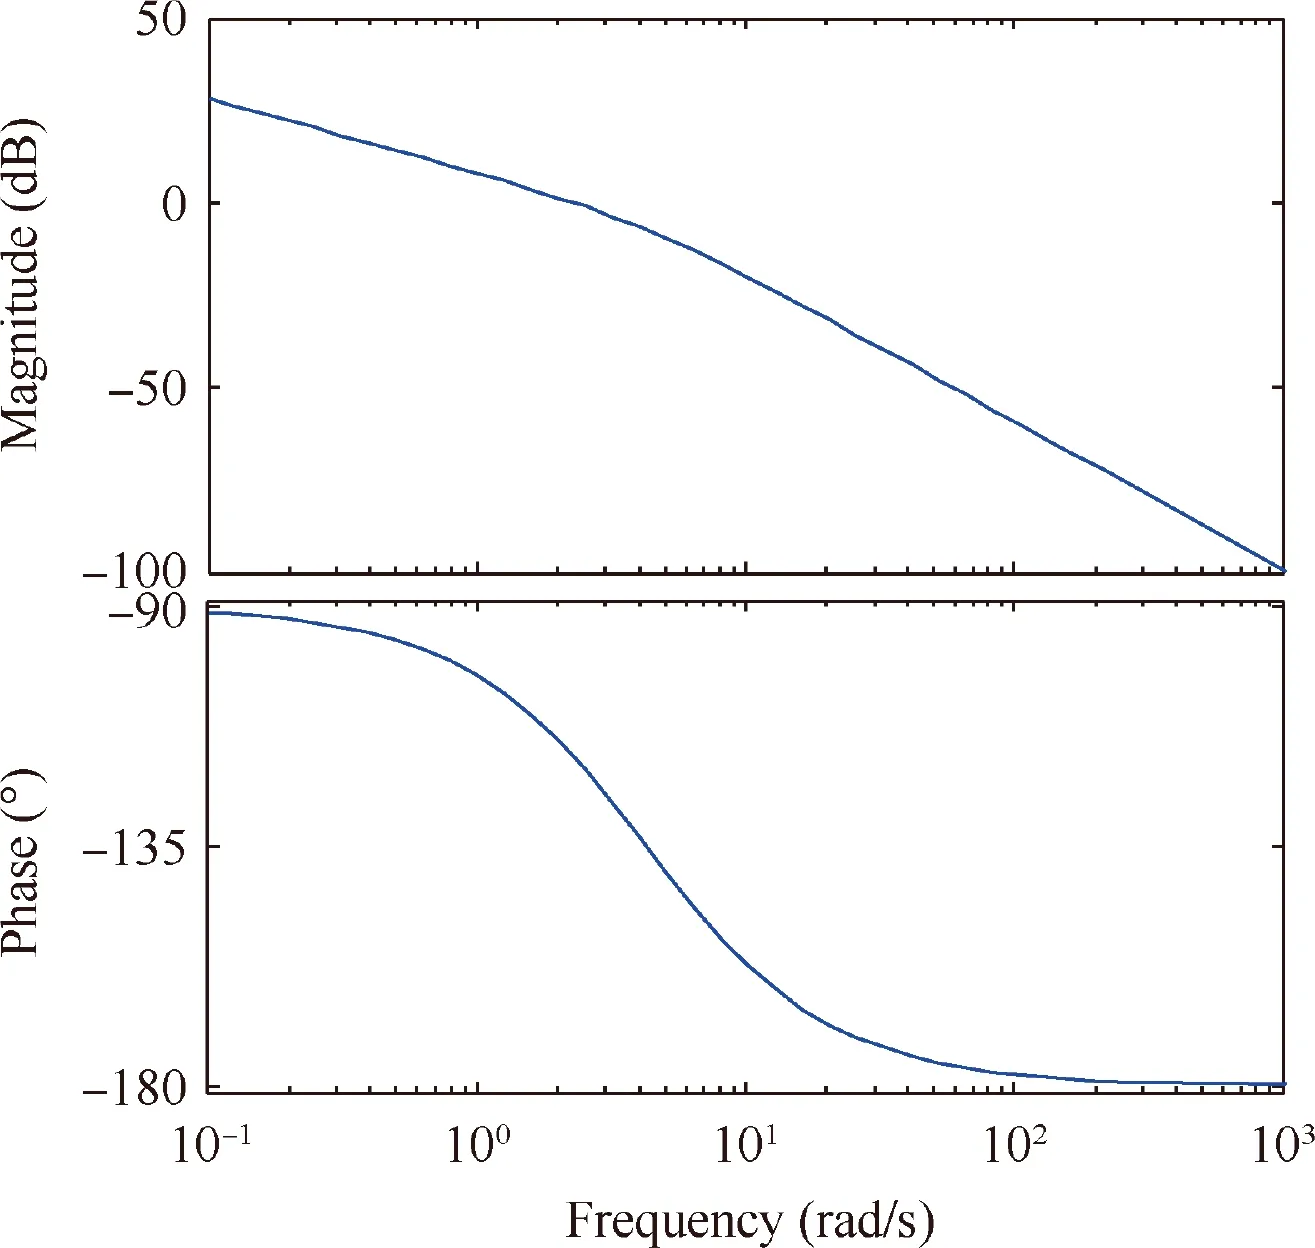
Fig. 10 Bode diagram of control system.
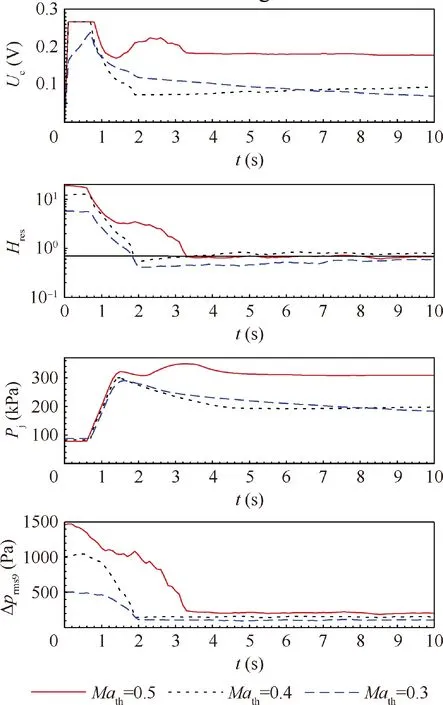
Fig. 11 Test results at fixed throat Mach numbers.
Fig.11 shows the closed-loop test results at fixed throat Mach numbers. In Fig. 11, Hresis displayed in log scale. At throat Mach number 0.5, Ucand Pjreached their final values simultaneously with RMS pressure, indicating this PI controller was suitable for this design condition. From Fig. 9 and 11,significant difference was found for this Mach number. The settling time for the closed-loop control test at throat Mach number 0.5 was about 2.8 s,which was larger than the simulation result, but still lower than the open-loop test result of about 4.4 s.This means that the gains for this system were relatively small.
The system took a much longer time to reach its final value at throat Mach number 0.3. This slowly convergent process was due to the control voltage overshoot. During the 0.5 s delay time, the PI controller yielded an output of about
The integral voltage reached 0.074 V. This term continued to increase until Hresequaled Hrefat t=1.8 s. From the top figure we can find that the integral voltage was 0.132 V at t=1.8 s since the first term became zero.The integral voltage was much higher than the final value of about 0.07 V. This means large overshoot existed at this condition. After t=1.8 s, the system entered into a stage in which the error between Hresand Hrefwas less than 0.3. As the two PI gains were very small,the control system slowly updated the control voltage.The time needed to correct the control voltage can be estimated as

This value agrees with the data in Fig. 11. Thus, the cause for the long convergent time was determined to the overshoot and the small PI gains at small errors.
4.2. Results at varying conditions
Fig. 12 shows the closed-loop control at varying conditions.The initial throat Mach number was 0.49. The control system was turned on at about t=10 s.The Mach number increased slightly since the separated flow,which blocked the main flow,was suppressed.At t=35 s,the Mach number decreased from 0.51 to 0.32 in about 6 s.The changing rate was close to that of Anderson.12The PI controller sensed this variation and kept Hresin the desired level. However, the controller took almost 20 s to reach the final value. This slow convergence process was also caused by the small PI gains as mentioned in the previous section.At t=68 s,the system encountered a speed-upand-down change.During the speed-up process,Hresreached a maximum value of 1.0 and the corresponding control error reached 0.3. This means that the control system could not adjust the control effort in time. Due to the small PI gains,the control effort in this small error region was too small to follow the system change.It was also shown that,although the Mach number decreased to 0.28, the control system still worked well.
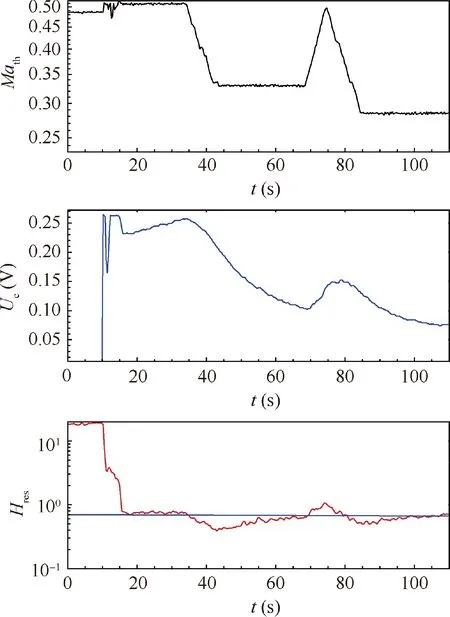
Fig. 12 Test results at varying Mach number conditions.
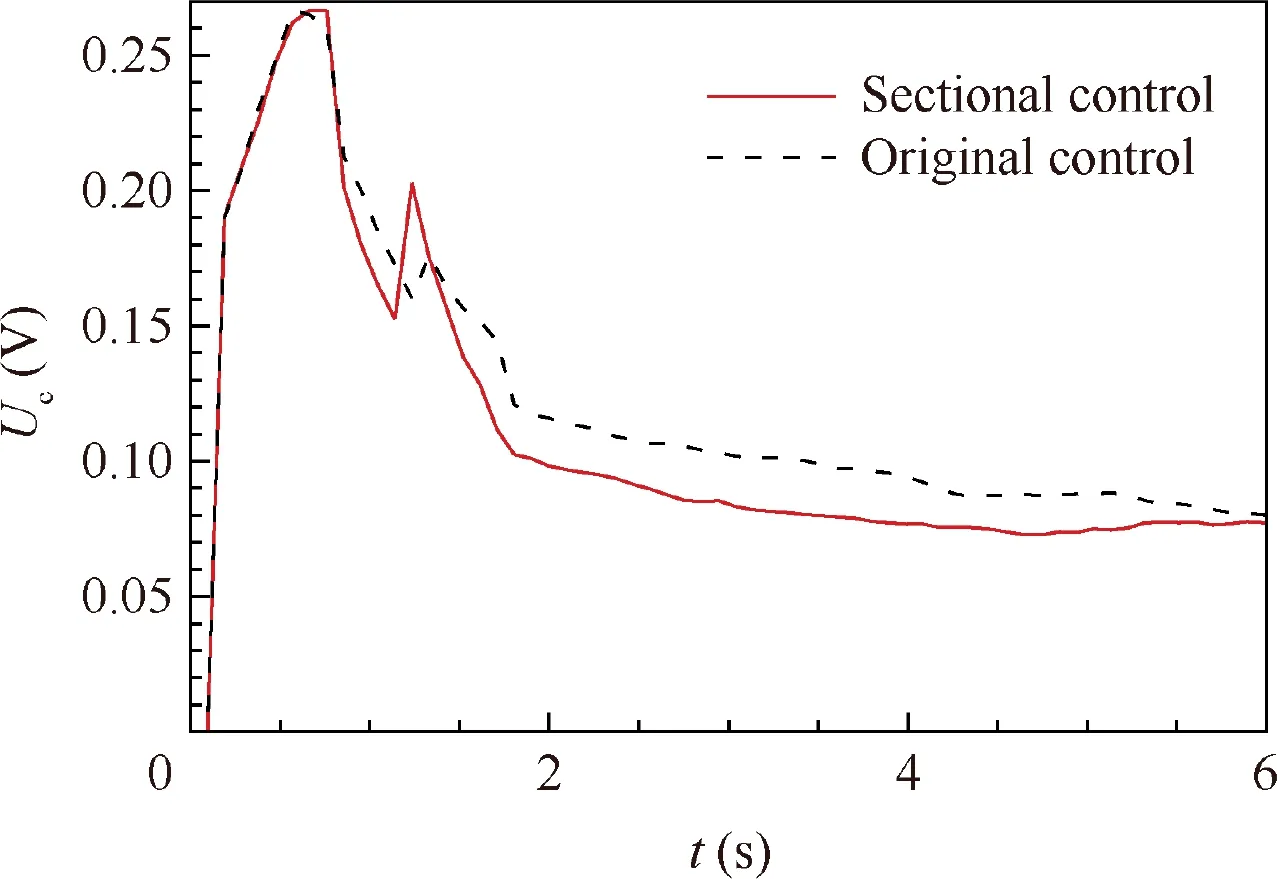
Fig. 13 Sectional PI control result at throat Mach number 0.3.
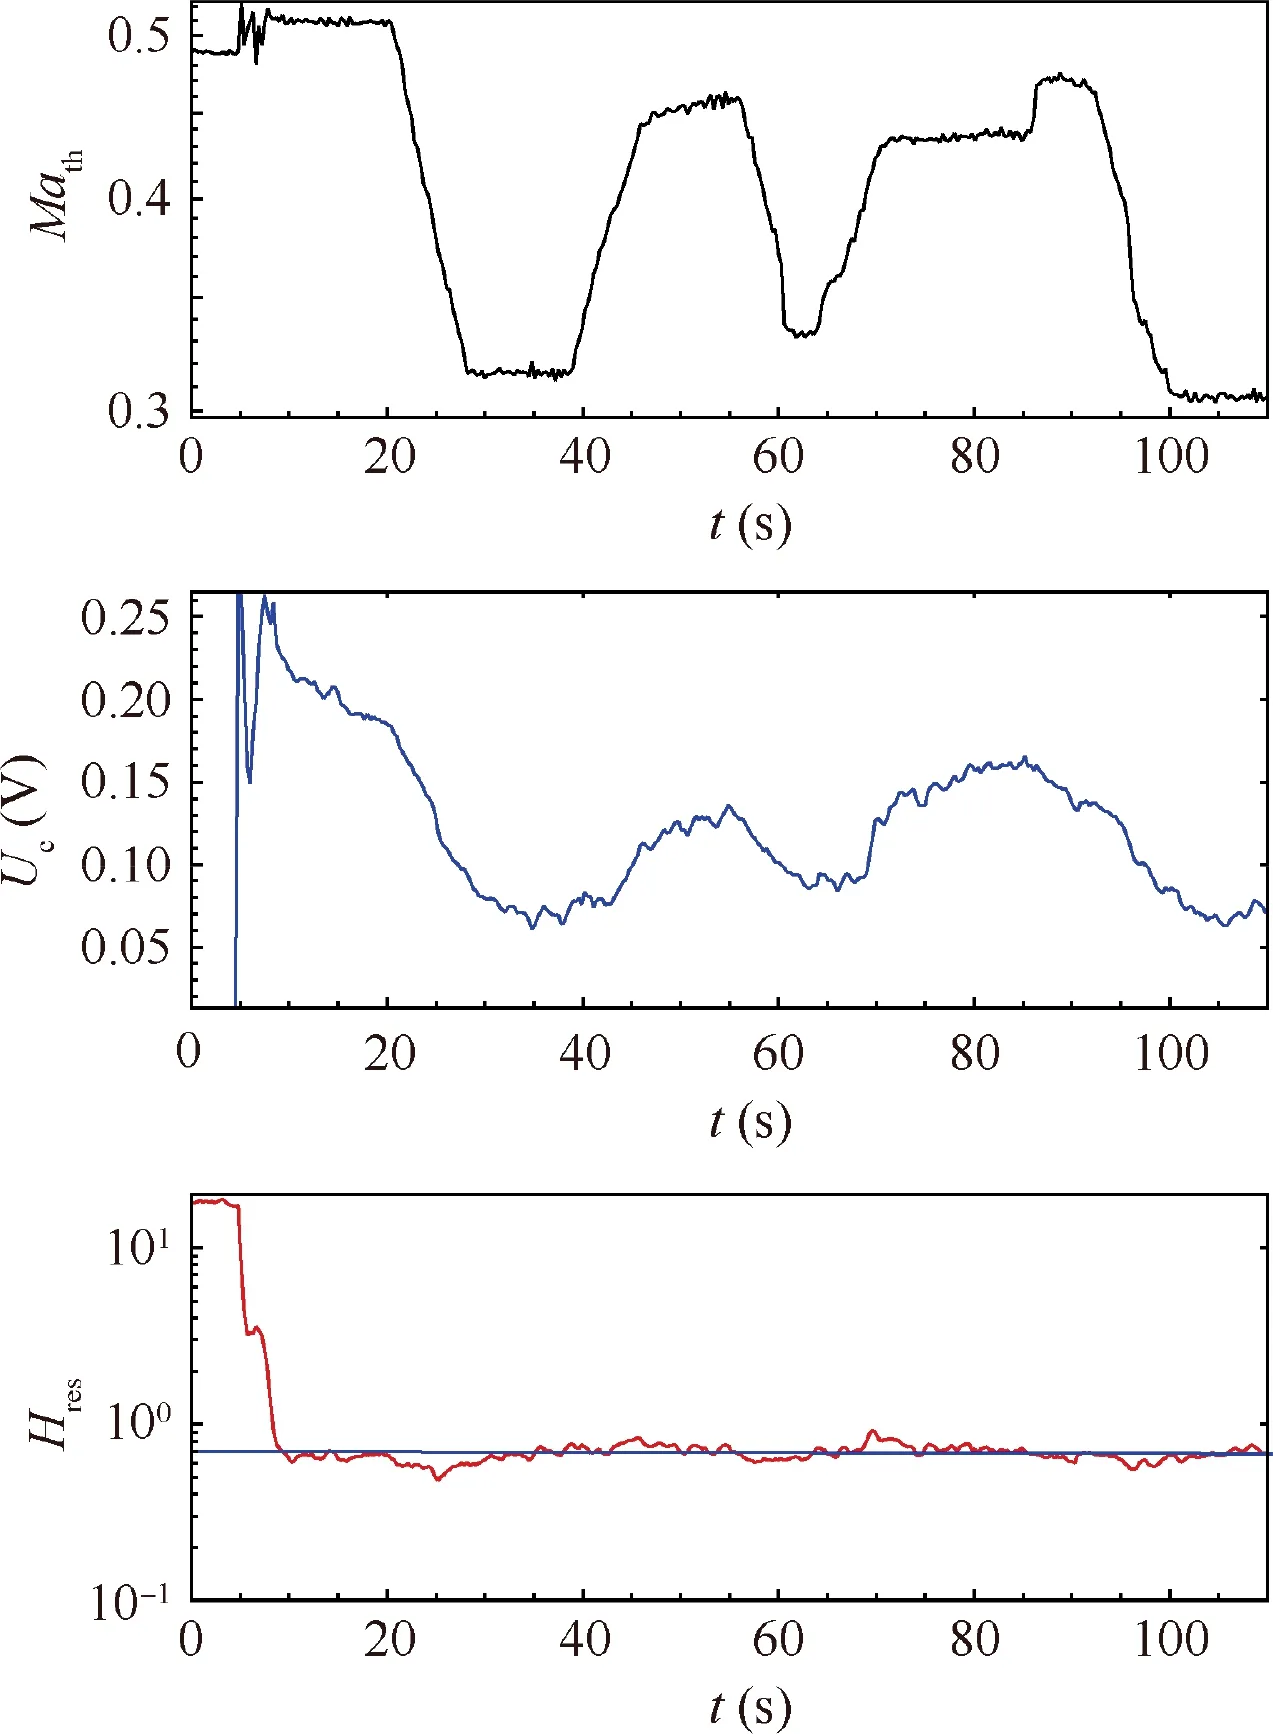
Fig. 14 Sectional PI control result at arbitrarily changing condition.
4.3. Sectional PI controller
Previous section shows that necessary improvement was needed at low throat Mach number. After recognizing the source of this problem, a sectional control strategy was applied:
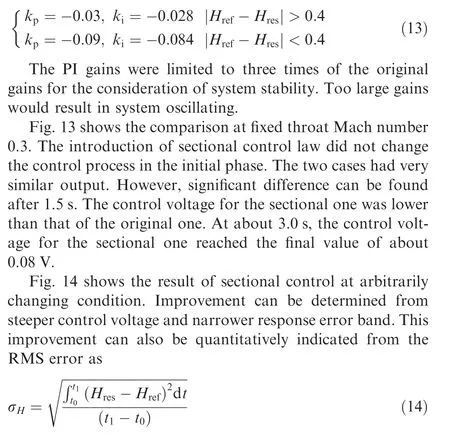
For both cases, σHwas evaluated from t0=20 s to t1=80 s. The results were 0.16 and 0.07 respectively. For the sectional control case, the accuracy improved more than 56%.
4.4. Pressure distortion
Fig.15 shows the circumferential distortion intensity evaluated for the sectional control case. The DPCP index was evaluated from ARP-1420 standard18which can be defined as:

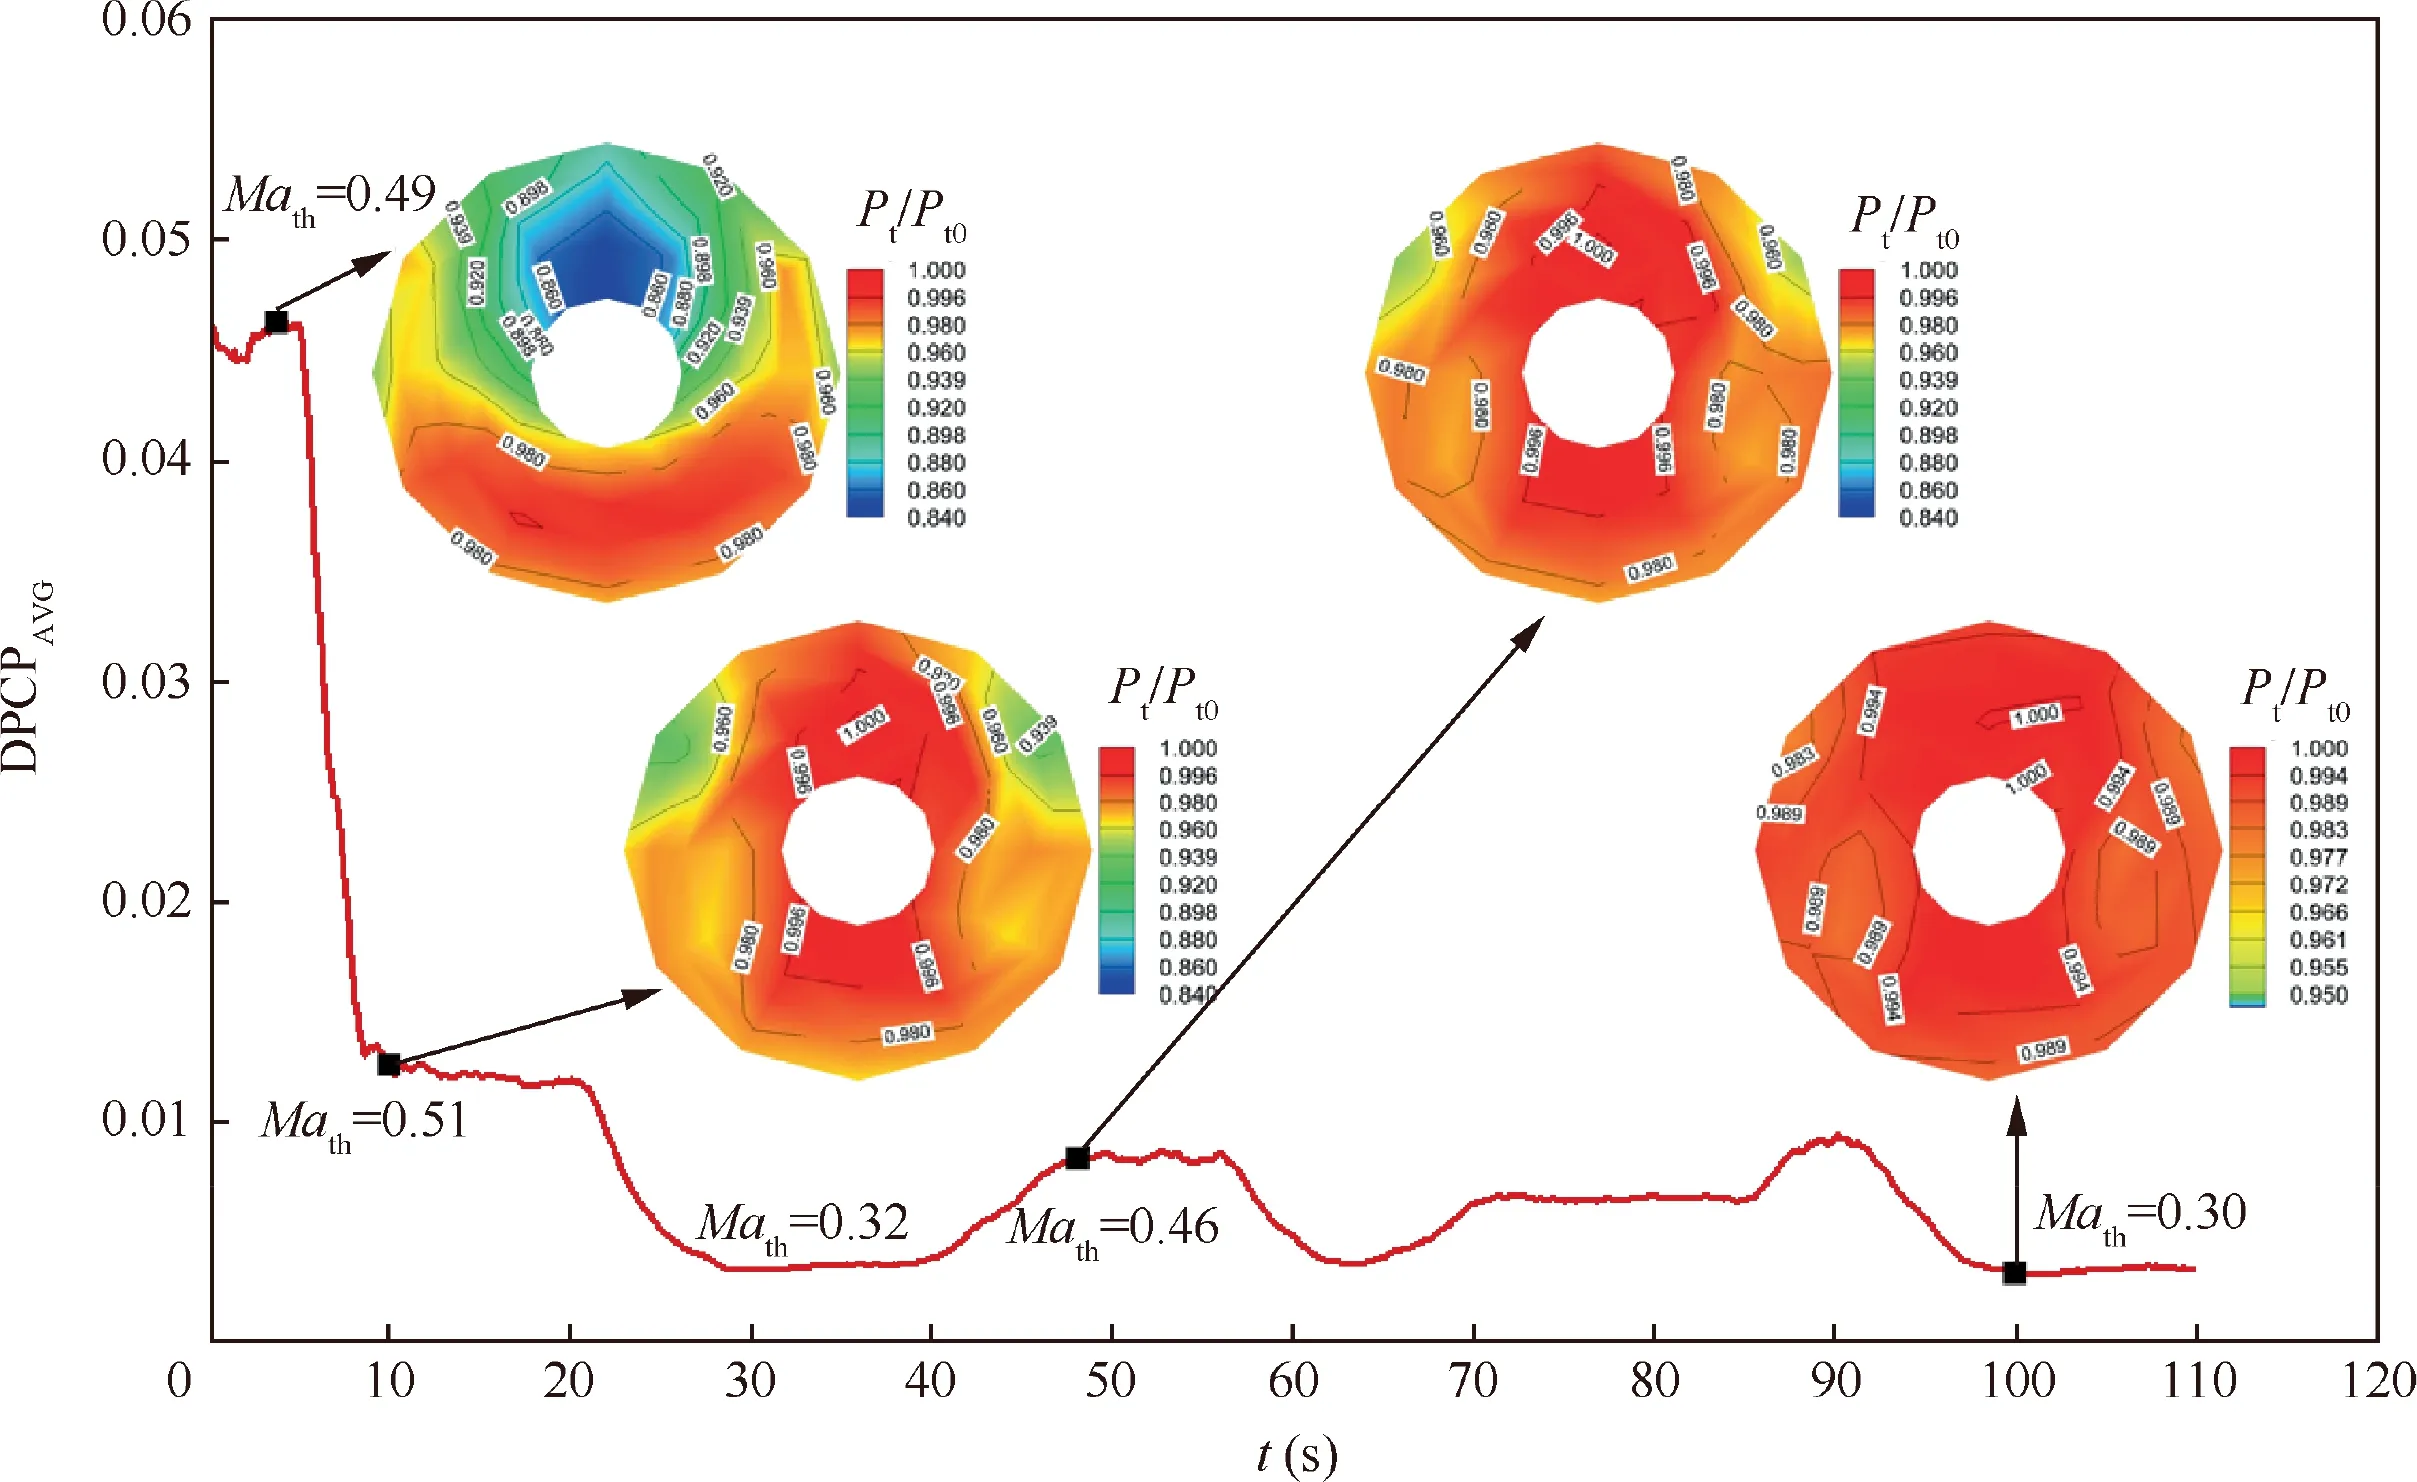
Fig. 15 Circumferential distortion during sectional control.

where subscript i indicates the ith ring of the measuring plane and j the jth rake,DPCP is the circumferential distortion intensity,PR is the pressure ratio and PRLOW is the average pressure ratio of the low pressure region.The final DPCPAVGis the average value of DPCPi. The distortion intensity dropped quickly after the control system started working. Comparing the distortion pattern at t=9.5 s with that in Fig. 3, we can figure out that the flow separation was suppressed. In the following 100 s, the low pressure region did not appear, indicating the system worked well at dynamic conditions.
5. Summary
A closed-loop control scheme based on nondimensional feedback model was developed for an aggressive S-shaped inlet with the aim of suppressing flow separation at both offdesign and dynamic conditions. Through measuring and feeding back the total pressure of microjets,the distortion observer presented a monotonic feature that is favorable for the design of control system. At different throat Mach numbers, the observer response overlapped in the effective control region.These two features contributed to the success of the feedback control in steady off-design conditions. By introducing a sectional PI control law,good qualities were achieved at dynamic conditions. It was also found that the dynamics of this new observer can be simplified as a stable second-order overdamped system.
While this paper is only a preliminary validation for the nondimensional feedback scheme, many works still need to be carried out in the future, such as detailed optimization of control law, improvement of valve dynamics, reliable sensing techniques, closed-loop control on airframe/inlet models, and system integration.
Acknowledgements
The authors would like to thank Li YU and Ning DU for their helps on the programming of control codes and reduction of the RMS pressure data. The work described in this paper was supported by the National Natural Science Foundation of China (No.11602291).
 CHINESE JOURNAL OF AERONAUTICS2020年10期
- CHINESE JOURNAL OF AERONAUTICS的其它文章
- A novel surrogate modeling strategy of the mechanical properties of 3D braided composites
- A user-friendly yield criterion for metals exhibiting tension-compression asymmetry
- Aerodynamic characteristics of morphing wing with flexible leading-edge
- High cycle fatigue failure with radial cracks in gears of aero-engines
- Motion equations of hemispherical resonator and analysis of frequency split caused by slight mass non-uniformity
- Light weight optimization of stratospheric airship envelope based on reliability analysis
