Near-wall topological patterns and flow structures over a simplified Danaus plexippus model
Yichen ZHU, Yuan QU, Jinjun WANG, Baofeng MA
Key Laboratory of Fluid Mechanics of Ministry of Education, Beihang University, Beijing 100083, China
KEYWORDS Danaus plexippus;Flow structure;Flow topological pattern;Hydrogen bubble visualization;Particle image velocimetry(PIV)
Abstract Studies on the high-lift mechanisms of butterfly gliding flights shed light on the design of the micro air vehicles. The flow field around a simplified Danaus plexippus model is investigated using the hydrogen bubble visualization and the Particle Image Velocimetry (PIV) techniques.There are three near-wall topological patterns with different Angles of Attack (AoAs): the separation bubble, the Leading-Edge Vortex (LEV) and the high AoAs flow. For the separation bubble pattern,two saddles and two foci form in the middle of the model.The features of the LEV pattern are the leading-edge separation lines. The topological characteristics of the separation lines are changed by the interaction between the LEV and the Wing-Tip Vortex(WTV).For the high AoAs flow pattern,four unstable foci are found at the forewing and the hindwing respectively.The angle between the trajectory of the WTV and the model increases with increasing AoA even though the slope of the WTV angle versus AoA curve declines at the moderate AoAs.
1. Introduction
In recent decades,the Micro Air Vehicles(MAVs)at low Reynolds numbers have been widely investigated for their potential applications. The butterfly flight, which is a classical phenomenon of the low Reynolds number aerodynamics, has attracted the study interest in the practical use for the development of the MAVs.Butterflies have natural abilities in controlling their flight attitudes and trajectories.1Besides, many species of them have capabilities for long-distance migrations,and their high efficiency in migration flights is worth learning for the design of the MAVs.
Quite a few studies have been conducted to investigate how butterflies improve the flight efficiency in their migrations.For example, the ‘flapping-gliding’ skill was suggested by the field observations of the free-flying butterflies.2In the investigation of Gibo and Pallett,3an energy-saving strategy that butterflies soar and glide with ascending air currents was revealed. Thus,the gliding flights are of significance to the butterfly migrations.
The underlying mechanisms of the gliding flight have been further studied.Hu et al.4experimentally investigated the flow structures and the evolution of them with the Angles of Attack(AoAs) α over a simplified Papilio ulysses model. Particularly,the phenomenon that dual Leading-Edge Vortices (LEVs)emerge at α=8°-12° was observed using dye visualization.5Meanwhile, the flow structures and the aerodynamic characteristics of the Papilio ulysses model were compared with those of the Danaus plexippus model.6The result shows that lift coefficient linearly increases with increasing AoA along with the flow remain attached at small AoAs. The decrease of the lift-curve slope is due to the formation of the LEV and stall.Besides, the lift-to-drag ratio of the Danaus plexippus model was twice as large as that of the Papilio ulysses model at the moderate AoAs, verifying that the wing shape of the Danaus plexippus is preferable for the gliding flight. In the aspect of numerical studies, Lee et al.7performed a three-dimensional simulation around a simplified Graphium policenes model.Their results showed that the lift forces were associated with the downwash induced by the Wing-Tip Vortices (WTVs)and the low-pressure regions caused by the hairpin vortices.Although the large-scale flow structures were similar for the butterfly-like wings with different shapes and forewing orientations, the aerodynamic performance may present some differences. Ortega et al.8found that the forewing orientation with the maximum wingspan had the highest gliding performance while spreading the forewing forward increased the maximum lift coefficient.
So far, most studies have focused on the relationship between the aerodynamic performance and the flow structures.However, the evolution of the flow structures with the AoAs has not been fully understood. The complex flow structures are difficult to analyze with the conventional approaches.Nevertheless, the flow topology analysis provides a powerful tool to analyze such complex separated flows.9Theoretically, the isolated critical points theory, which is the foundation of the flow topology analysis,was introduced in the pioneering work of Hunt et al.10Perry and Chong11categorized the critical points with the phase-plane method. An automated algorithm was developed for the critical point detection by Depardon et al.12This algorithm was improved using a multi-modal particle swarm algorithm in the subsequent study of Cormier et al.13According to the Poincare´-Hopf index theorem, there is a global topological constraint on the number of the detected isolated critical points. The collapsed sphere method was introduced to make the topological constraint more executable for the flow topology analysis.14,15For a singly connected region enclosed by a penetrable boundary, a convenient conservation law was provided by Liu et al.16Practically,the flow topology analysis has been wildly used.Yavuz et al.17characterized the near-surface topology on a delta wing using the high-image-density Particle Image Velocimetry(PIV)technique. Likewise, McKenna & Rockwell18clarified the modes of vortex-wing interaction using streamline topology with the associated critical points.
The objective of the present study is to analyze the evolution of the flow structures over a simplified Danaus plexippus model at low Reynolds numbers in detail based on the flow topology analysis. Therefore, we observed the flow structures with the hydrogen bubble visualization and conducted the near-wall PIV measurement to obtain the corresponding time-averaged topological patterns.Furthermore,the trajectories of the WTVs are investigated in this study.
2. Experimental setup
2.1. Water channel and model
The experiments were performed in a low-speed recirculation water channel in Beihang University, China. The size of the test section was 600 mm (width)×600 mm (depth)×3000 mm (length). The turbulence intensity of the free-stream velocity was less than 1%. The outline of the simplified Danaus plexippus model in the present study was the same one in the previous experiments,6as sketched in Fig. 1(a).The simplified model was made of an aluminum sheet with a thickness of t=1 mm. The aluminum sheet was anodized in order to reduce the reflection of the laser. The span and the chord lengths of the simplified model were L=80 mm and c=58 mm, respectively. The model was supported vertically in the middle of the test section by an L-shaped strut with a diameter of 3 mm. The AoAs ranged from 0° to 24° and the angle of sideslip was fixed to 0° for both the hydrogen bubble visualization and the PIV experiments. The angles were adjusted with an accuracy of 0.1°.In order to describe the spatial positions of the flow structures,a Cartesian coordinate was defined as shown in Fig.1.X-axis was along the symmetric line of the model, Y-axis was tangential to the front edges, and Zaxis was perpendicular to the upper surface.
2.2. Hydrogen bubble visualization
The hydrogen bubble visualization was used to investigate the flow structures over the model. The free-stream velocity was U∞=70 mm/s and the corresponding Reynolds number was ReL=4300 based on the wingspan. The interval of the AoAs was Δα=4°.The hydrogen bubbles were generated from platinum wire.The positions of the platinum wire were adjusted by a mechanical system in order to visualize the flow structures clearly. The view fields with the wire placed along the span of the model and perpendicular to the model were defined as the plan and the side views respectively. In the plan view, the streamwise distance between the wire and the front edges of the model was denoted as d, and h represented the attitude of the wire from the upper surface. In the side view, the distance between the wire and the symmetrical section(Y/L=0) of the model was denoted as l.
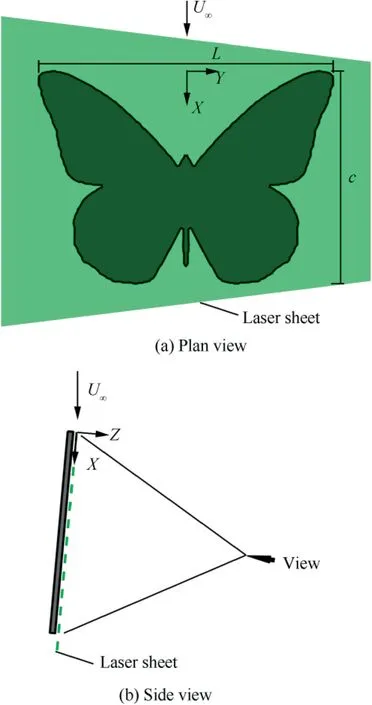
Fig. 1 Sketch of simplified Danaus plexippus model and laser sheet orientation for PIV.
2.3. PIV measurement
The time-resolved PIV experiments were performed to obtain the near-wall topological patterns. The free-stream velocity was U∞=58 mm/s, resulting in the Reynolds number of ReL=5300, which is higher than ReL=4300 for the visualization experiment conducted individually. It was pointed out by Lee et al.7that the flow over the butterfly model is not so sensitive to Reynolds number. In their study, the flow has similar characteristics even the Reynolds numbers changing from 1000 to 14400. Therefore, it is reasonable to ignore the effect of this ReLdifference in present investigation. The interval of the AoAs was Δα=2°. The hollow glass spheres with a typical diameter of 5-20 μm and a density of 1.05 g/mm3were used as the seeding particles. The particle images were recorded using a high-speed CMOS camera with a lens of focal length 70 mm. The resolution of the camera was 1920×1536 pixels with a view field about 100 mm×80 mm.The sampling frequency was 125 Hz and the exposure time was 2 ms.The flow field was illuminated by a continuous laser sheet with a thickness of 1 mm and energy of 5 W. The laser sheet was located parallel to the upper surface of the model.The distance between the center of the laser sheet and the upper surface was 1 mm. Before used to calculate the velocity fields,the particle images were processed to eliminate the influence of the laser reflections using a filter based on the Proper Orthogonal Decomposition (POD) proposed by Mendez et al.19The velocity fields were calculated using the Multipass Iterative Lucas-Kanade (MILK) algorithm.20The interrogation window size was 32×32 pixels with an overlap of 75%. This process provided a total of 240×192 velocity vectors. The effective grid size of the velocity fields was about 0.42 mm.
3. Results and discussion
3.1. Near-wall flow topology
An automated critical point detection algorithm is developed based on the work of Depardon et al.12The outcomes of the developed algorithm have been proved to be insensitive to the grid size of the velocity fields.The algorithm contains three main steps described as follows and illustrated in Fig. 2:
Step 1. Zero velocity test. Theoretically, the velocity of a critical point is zero. A scanning of the entire velocity field is performed to identify the areas where the velocity is less than 5%of the maximum velocity. The areas identified by this step are the potential critical point areas. This step is designed to reduce the time consumption.
Step 2. Poincare´-Bendixson index test. According to the Poincare´-Bendixson theorem, the velocity angle θ will change by 2π or-2π if one travel counter-clockwise on a simple closed loop around a critical point.Concretely,the variation Δθ is 2π for a node or a focus and -2π for a saddle. The Poincare´-Bendixson Index(PBI)is then defined as Δθ/2π,which is equal to1 for a nodal point and -1 for a saddle. Around each point in the potential critical point areas, a rectangular test window is defined with a side length W. The perimeter of the test window is regarded as the closed loop.Thus,the PBI is calculated for each potential point. The potential points with the same PBI are clustered into several groups, based on the distance between the points with a threshold of twice the side length W. This step provides a distinction between the nodal points and the saddles.
Step 3. Critical points identification and precise location.For each clustered group with PBI=1, the Γ1function and the K1function are used to distinguish the types of the nodal points.12The precise positions of the nodes and the foci are determined as the positions of the extremum of the Γ1function and the K1function within each group.The saddles are identified as the extremum of the Q function for each group with PBI=-1.
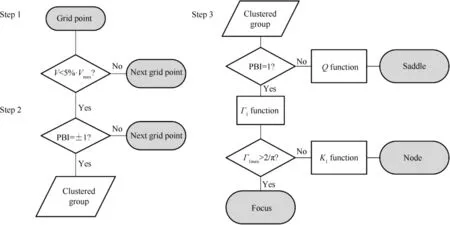
Fig. 2 Three main steps of automated critical point detection algorithm.
The evolution of the topological patterns is further interpreted. In Fig. 3(a), there are two saddles S1 and two foci F1 in the middle of the model at α=4°. In Fig. 3(b), the streamlines are bent and converged to form two Separation Lines (SLs) near the leading edges at α=8°. Since the SLs are not emanated from saddles, the SLs are associated with the open-type separations.22Besides, there are one node N2,two foci F1 and three saddles S1, S2 on the measured plane. In Fig. 3(c), a dramatic topological change takes place for the SLs at α=16°. In contrast to the case of α=8°, critical points are created on the SLs, i.e., the foci F3 and the combination S1-N2-S2. There are other critical points on the upper surface such as F1 and S1. The critical points without denotation might result from the complicated interactions of the flow structures. However, the conservation law is still satisfied despite the appearance of these critical points. In Fig. 3(d), the unstable foci F1 and F2 occur at both the forewing and the hindwing at α=24°. The nodal points at the model head cannot be identified correctly due to the reflection of the model. Overall, the time-averaged patterns vary with the AoAs, and the flow fields around the simplified model can accordingly be classified into three types of patterns, i.e., the separation bubble(α=4-6°), the LEV (α=8-18°) and the high AoAs flow(α=20-24°).
The positions of the SLs might be associated with the Sub-Leading-Edge Vortex (SLEV).23The formation of the SLEV depends on the induction of the LEV and the cross-sectional shapes of the leading edges. Since the leading-edge profile of the model has two sharp corners, the SLEVs develop along the leading edges rotating in the same direction to the LEVs.When the AoA is relatively small, the positions of the SLs are dominated by the induction of the LEVs in the laser plane.When the AoA increases, the positions of the SLs move towards the leading edges under the effects of both the SLEVs and the LEVs. The scale of the SLEVs increases with increasing AoA, forcing the SLs to move upward. When the AoA is larger than 20°, the flow separates at the leading edges completely, which results in the coincidence of the separation lines and the outline of the model.
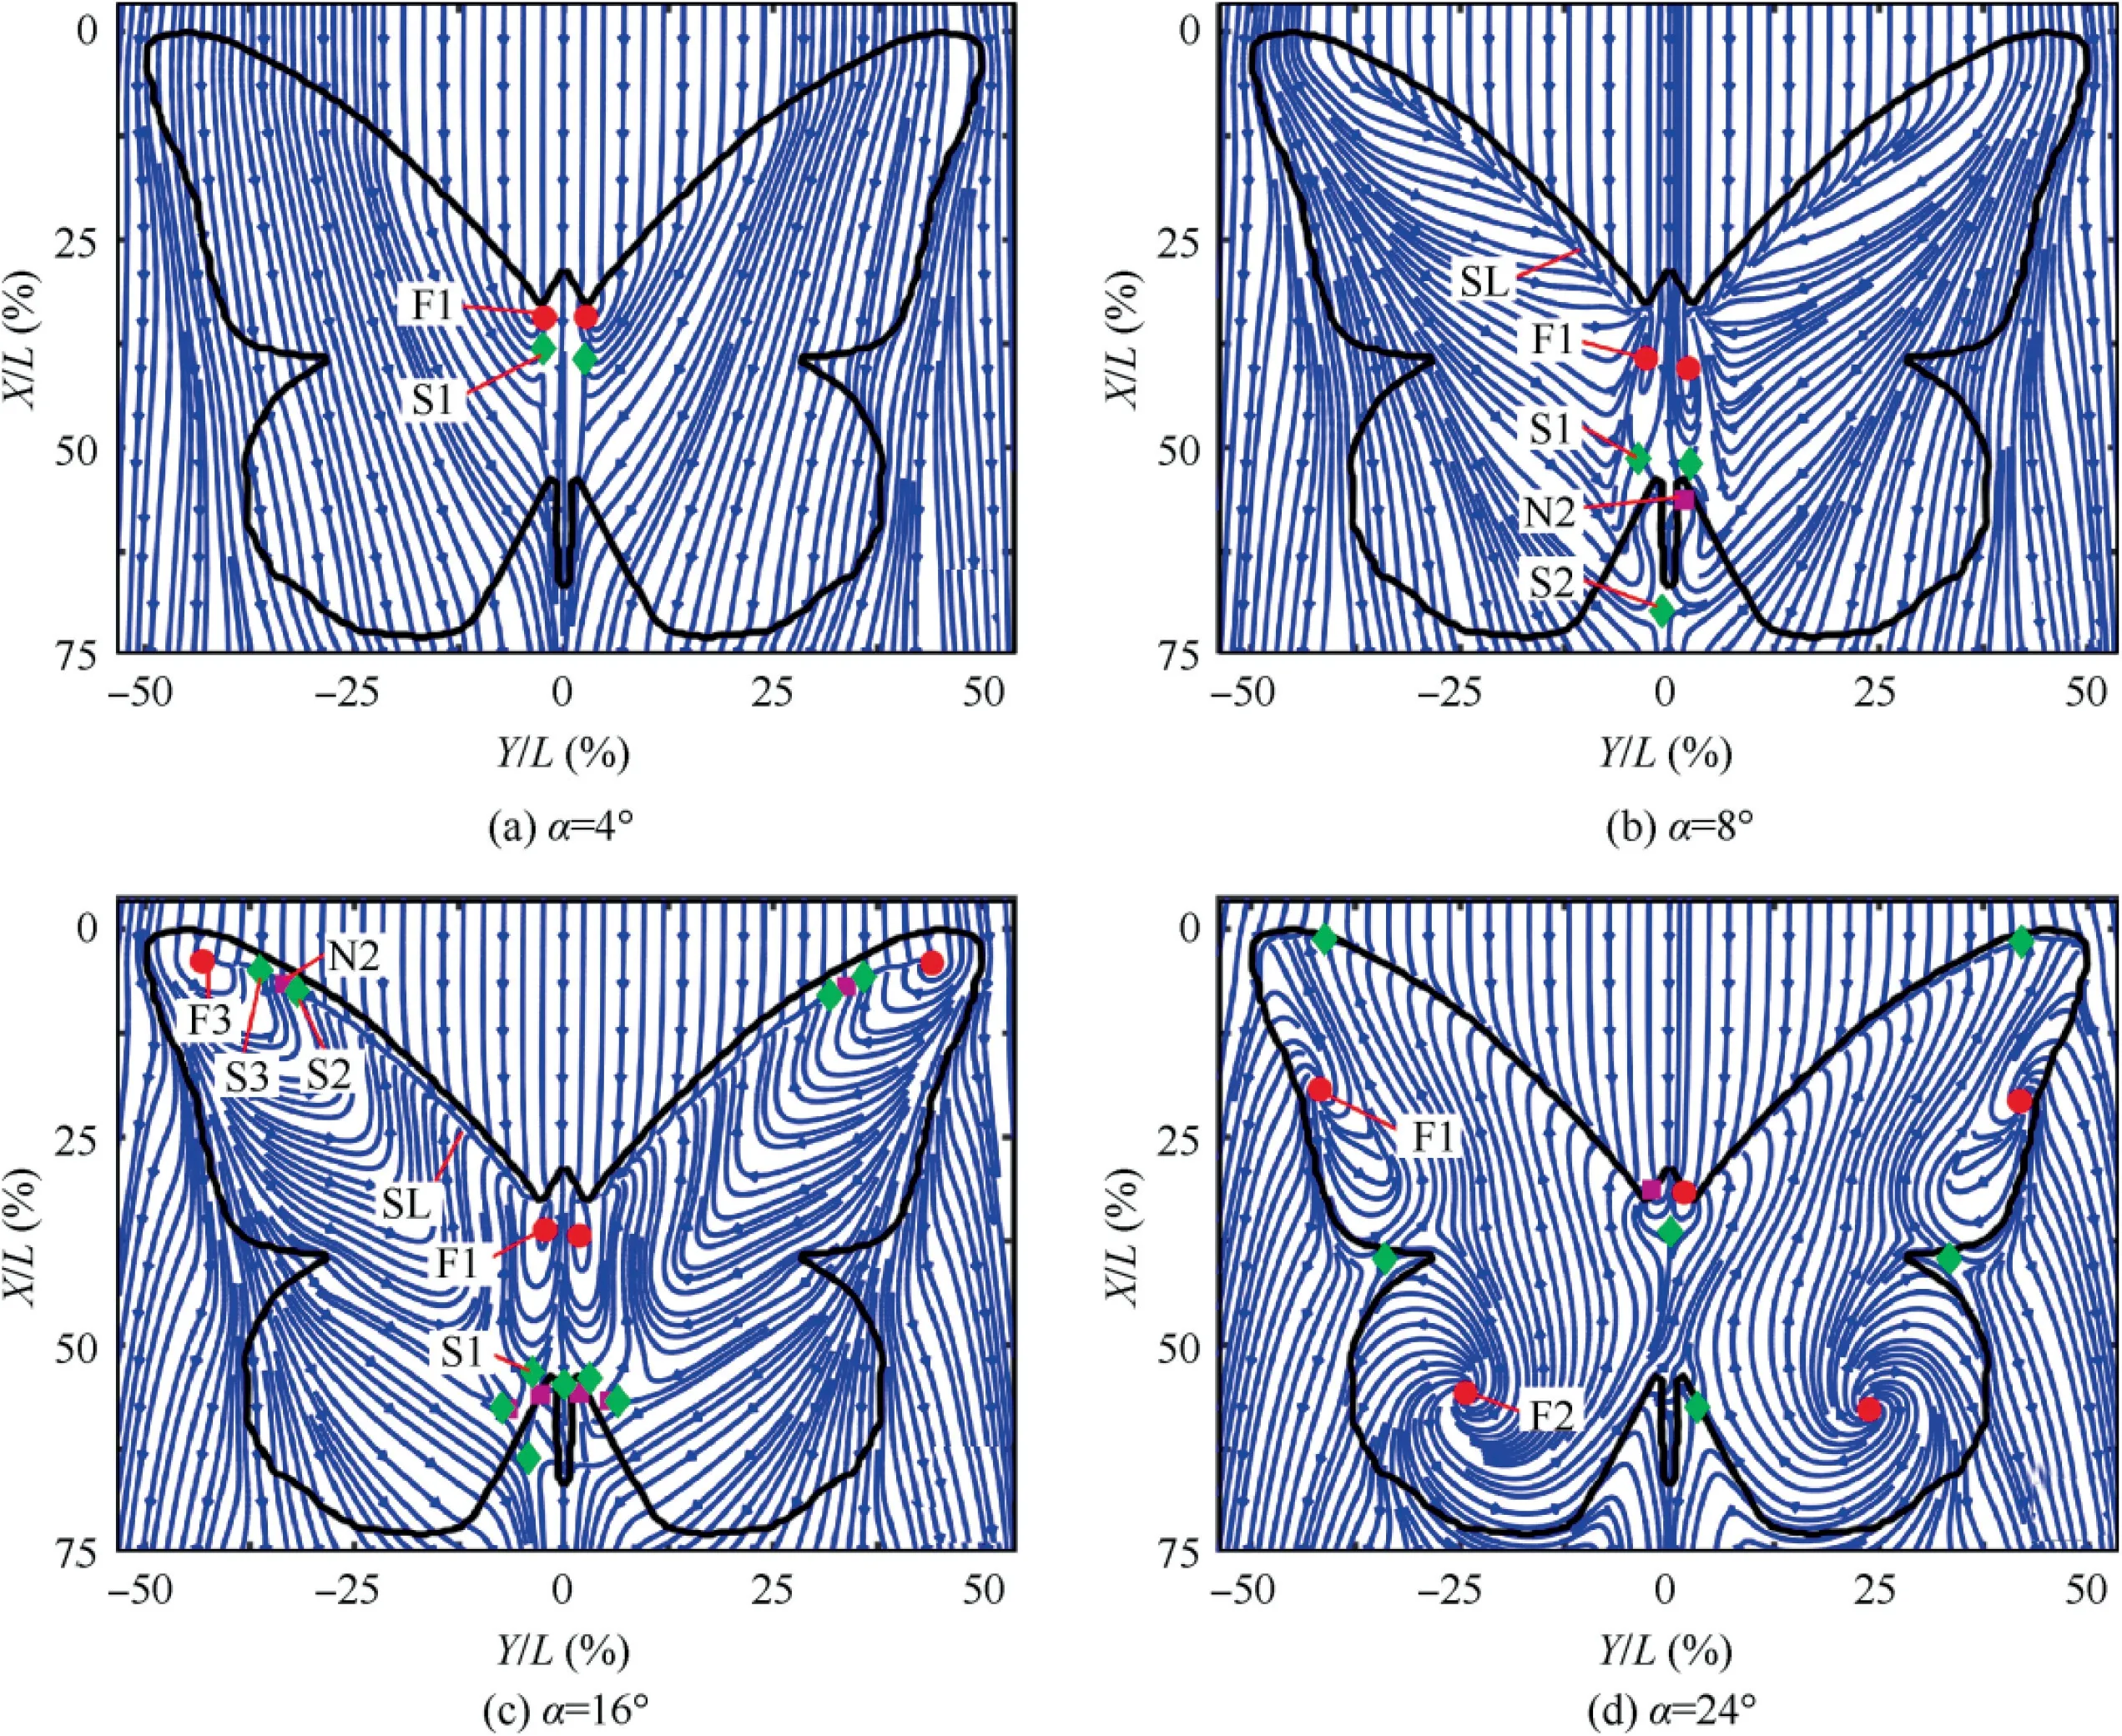
Fig. 3 Patterns of time-averaged streamlines at various AoAs.
3.2. Separation bubble pattern (α=4-6°)
The flow structures visualized by the hydrogen bubble time lines at α=4° is shown in Fig. 4, and the platinum wire is placed at d=19 mm and h=1 mm in this case.The time lines wrap behind the forewing tips while going downstream, indicating the formation of two WTVs. In the range of X/L=25-37.5%,the hydrogen bubbles approach to the symmetrical section while going downstream. After reaching the position of X/L=37.5% and Y/L=±6%, partial hydrogen bubbles move backward. These motions of the hydrogen bubbles indicate the occurrence of the flow separation. The highlight regions, formed by the accumulation of the hydrogen bubbles, present the locations of the separation bubbles.4
The impact of the head and the leading edges of the model on the flow structures is similar to that of the undulating leading edge modification.24The head and the leading edges of the model are shaped like a ‘‘W”, which is similar to the tubercle.When α<4°, the flow which originated from the junctions of the head and the leading edges has a smaller streamwise velocity than that in the surrounding, thus forming two low-speed streaks.As the AoA increases to 4°,the flow separation occurs at the positions of the low-speed streaks. The separated flow creates a pair of streamwise counter-rotating vortices due to the tubercle effect.
The correlation between the flow structures and the timeaveraged topology is then discussed.The time-averaged topology is sketched in Fig. 5. The streamwise velocity component u/U∞is negative in the gray regions, presenting the reversed flow regions.The blue and the red lines denote the streamlines associated with the saddles and the foci, respectively. The green lines, terminated by the saddles S1 and the foci F1, represent the separation lines. Separation starts at the saddles S1 and the separation lines extend from S1 to F1. The reversed flow regions distribute outside the separation lines, which is consistent with the position of the separation bubbles in the flow visualization.Besides,the formation of S1 in Fig.5 corresponds to the counterflow of partial hydrogen bubbles in Fig. 4. Hence, the separation bubble pattern is featured with the formation of two saddles S1 and two foci F1.
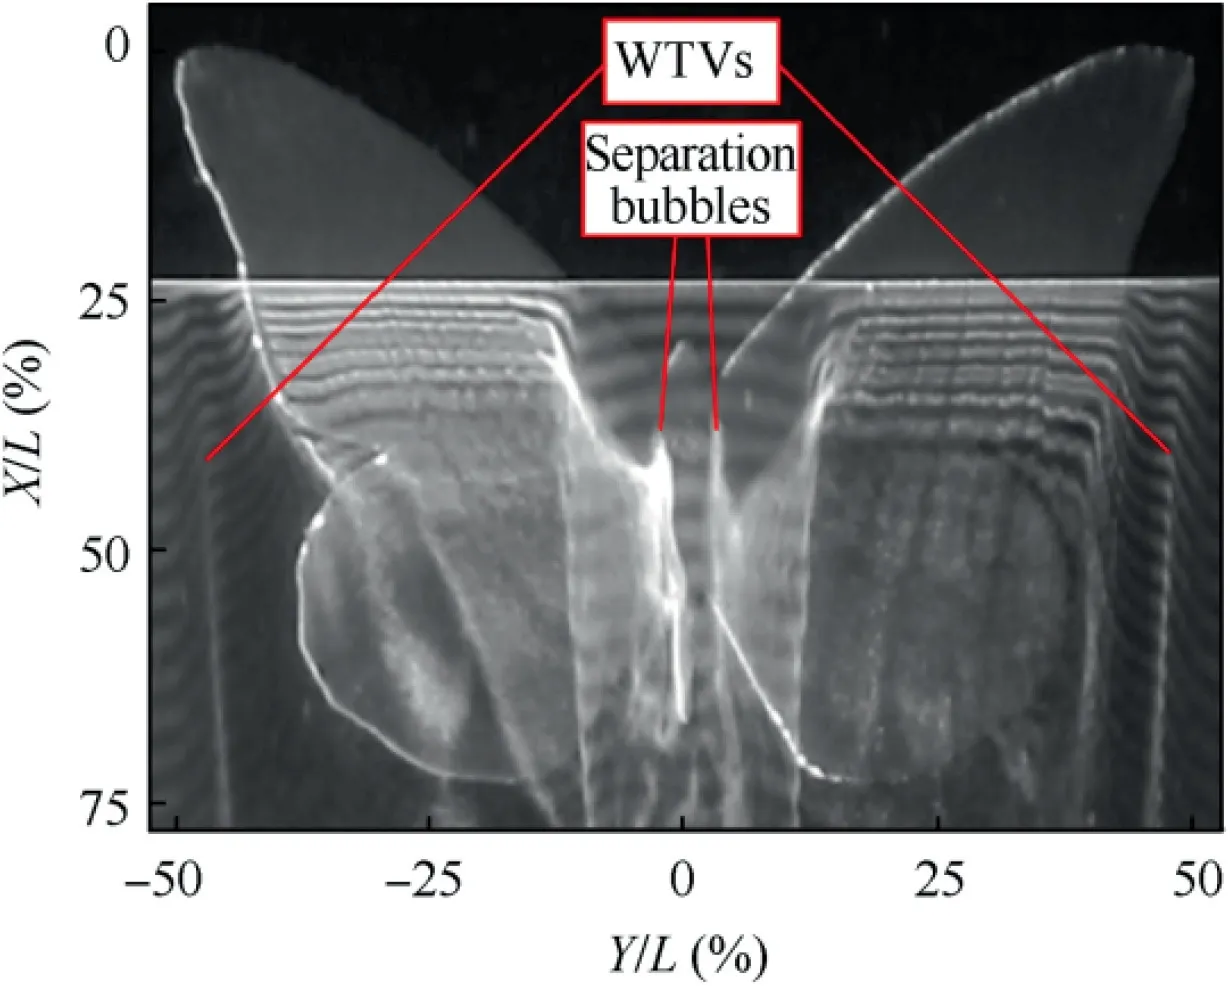
Fig. 4 Plan view of separation bubbles and WTVs at α=4°.
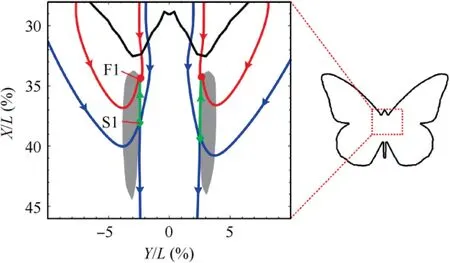
Fig. 5 Zoomed-in view of time-averaged topology at α=4°.
3.3. LEV pattern (α=8-18°)
The LEVs and the WTVs at α=8° are displayed in Fig. 6,with the platinum wire placed at d=19 mm and h=2 mm.Two WTVs are shown clearly by the time lines wrapping behind the forewing tips. The highlight regions indicate a pair of LEVs. However, the hydrogen bubbles only wrap at the positions where the LEVs are strong enough. The trajectories of the LEVs are nearly parallel to the leading edges. These two LEVs merge into the horseshoe vortex at the streamwise position of X/L=62.5%.
The phenomenon that two LEVs merge into the horseshoe vortex at α=8° is different from the previous study.4The Reynolds numbers in this study are lower than that of the previous study.Due to the viscous effect,the strength of the LEVs in this study remains relatively weak at α=8°. Two LEVs convect downstream, approach each other,and transport vorticities to the position where the two LEVs merge. Once saturated, the merged part of the LEVs will be shed and form the horseshoe vortex eventually. Meanwhile, the shear layer derived from the model head also participates in the formation of the horseshoe vortex.
To demonstrate the effect of the AoAs on the strength of the LEVs, Fig. 7 shows the time-averaged streamwise velocity(u/U∞)contours at various AoAs.The regions enclosed by the solid white lines are the reversed flow regions. At α=8°, the reversed flow region is dominated by the separation bubbles.As the AoA increases, the reversed flow region gradually expands from the middle to the forewing tips, arising from the induction of the LEVs. This result indicates that the strength of the LEVs is enhanced with increasing AoA. However,the leading-edge SLs remain the open type in the range of α=8-14°. As the AoA further increases, the topology of the SLs changes at about α=16°.
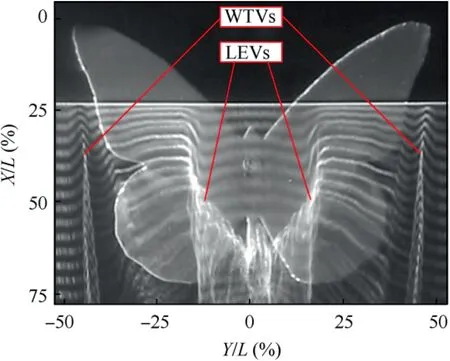
Fig. 6 Plan view of LEVs and WTVs at α=8°.
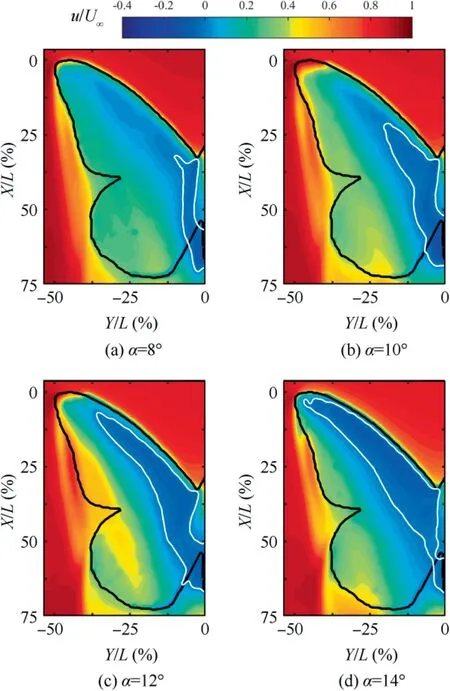
Fig.7 Contours of time-averaged streamwise velocity(u/U∞)at various AoAs.
Fig. 8 shows the LEVs over the model at α=16° with the platinum wire moved to the position of d=0 mm and h=0 mm. The hydrogen bubbles at the forewing tips bend toward the leading edges, accumulate near Y/L=±35%and form the bright spots. The LEVs are derived from the bright spots. In the process of convecting downstream, the LEVs break down, which is annotated in Fig. 8.
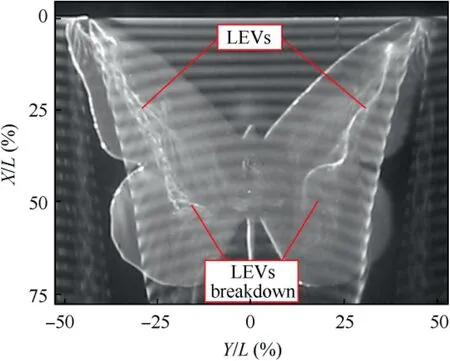
Fig. 8 Plan view of LEVs at α=16°.
The flow structures are further investigated by the near-wall flow topology at the forewing, as shown in Fig. 9. The light gray region is the region with the reversed flow. The region enclosed by the red dotted line has the maximum negative velocity. The blue and the red lines denote the streamlines associated with the saddles and the nodal points, respectively.The green lines represent the separation lines. The formation of the recirculation region is induced by the LEV but suppressed by the downwash effect of the WTV. When the LEV grows sufficiently strong at α=16°,the stable focus F3 forms due to the interaction between the LEV and the WTV. The streamlines near the forewing tip are bent around F3 and connected to the combination S1-N2-S2. The position of S1-N2-S2 coincides with that of the bright spot in the flow visualization. Flow separates here and transports vorticities to the LEV. The region enclosed by red dotted lines at Y/L=±(23-33%) implies that a local extreme strength of LEV exists at the forewing tip.It is suggested that the interaction between the LEVs and the WTVs dominates the dramatic change of the leading-edge SLs at α=16°.
3.4. High AoAs flow pattern (α=20-24°)
Fig. 10 demonstrates the flow structures at α=24° with the platinum wire moved to the position of d=19 mm and h=1 mm. It is obvious that two pairs of spiral structures occur on the forewing and the hindwing respectively. Besides,the WTVs on both sides of the wing are affected by the largescale structures above the upper surface.
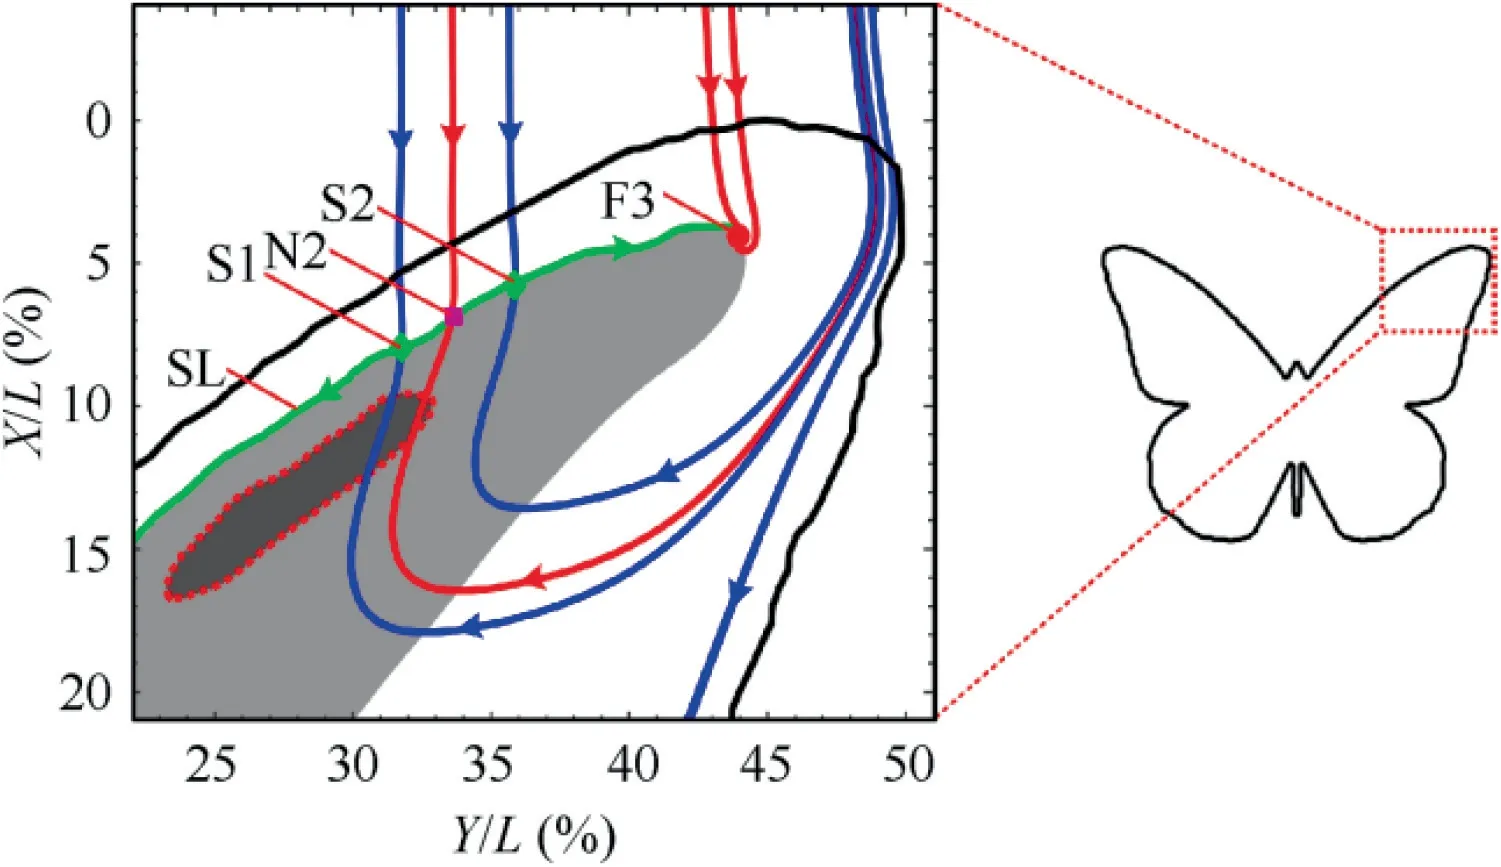
Fig. 9 Zoomed-in view of time-averaged topology at α=16°.
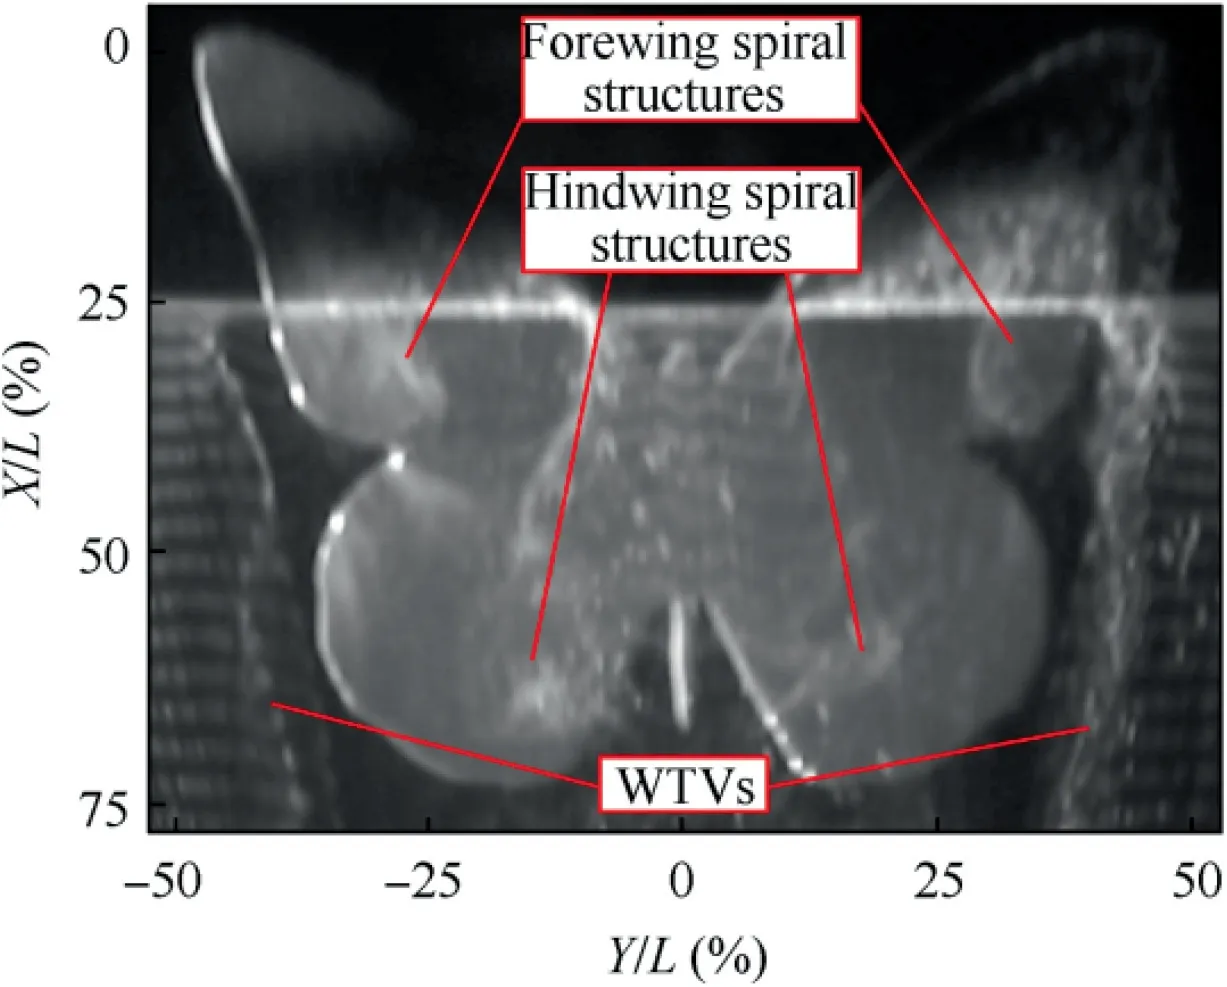
Fig. 10 Plan view of spiral structures and WTVs at α=24°.
The time-averaged near-wall streamwise velocity is displayed in Fig. 11. The region enclosed by the solid white lines is the recirculation region,covering the most area of the upper surface,where the flow is essentially separated.The streamwise velocity in the outer part of the model is positive, induced by the shear layers derived from the edges of the model. For the high-AoAs flow pattern, the flow structures resemble those in the wake of the bluff body.
The forewing and the hindwing spiral structures correspond to the two pairs of unstable foci F1 and F2 in the near-wall pattern, as shown in Fig. 3(d). Instead of the stable foci F3 appearing in the LEV pattern, the unstable foci F1 form at α=20°, located at the forewing. The position of F1 moves downstream with the increase of the AoA. The unstable foci F2 appear at α=20°. The position of F2 is insensitive to the AoAs. The appearance of F1 and F2 is the feature of the transition from the‘vortex’type pattern to the bluff wake type.
As discussed above, the evolution of the flow structures is interpreted with the near-wall topology in detail.Furthermore,the transitions of the near-wall topology indicate the change of the main flow structures.Thus,the transitions reflect the characteristics of the aerodynamic performance. As the AoA increases to the one of the LEV pattern, the LEV structures form and trigger the first decrease of the lift-curve slope.6Because the flow in the high AoA flow pattern is fully separated,the transition from the LEV pattern to this pattern indicates the occurrence of stall.6
3.5. Trajectory of WTV
It is well known that WTV can increase the drag force and substantially affect the flight efficiency. Thus, the trajectories of the WTV at various AoAs are compared in this section. Since the hydrogen bubbles can be entrained by the WTV and accumulate at the core of the WTV, the platinum wire is placed at l=38 mm,and the gray scales of the visualization images are used to identify the core of the WTV.500 continuous instantaneous frames are selected from one video. Due to the reflections of the model surface, the trajectory of the core of the WTV is identified only at the range of X/L=25-100%.Later,the trajectory in each frame is fitted with a line. The angle between the fitting line and the model is named as the WTV angle β, as illustrated in Fig. 12.
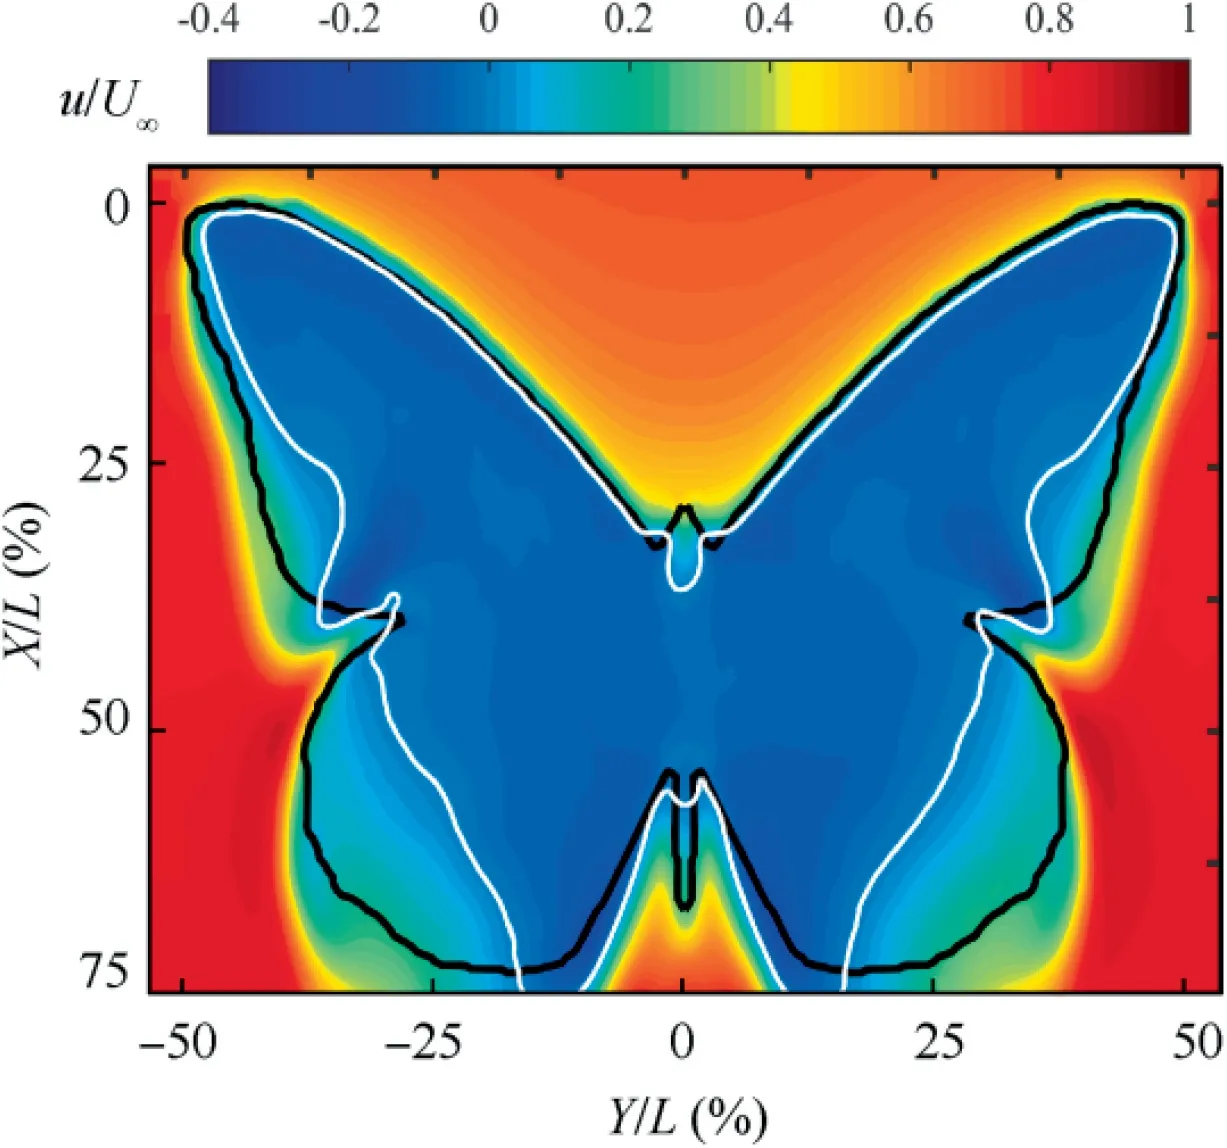
Fig.11 Contour of time-averaged streamwise velocity(u/U∞)at α=24°.
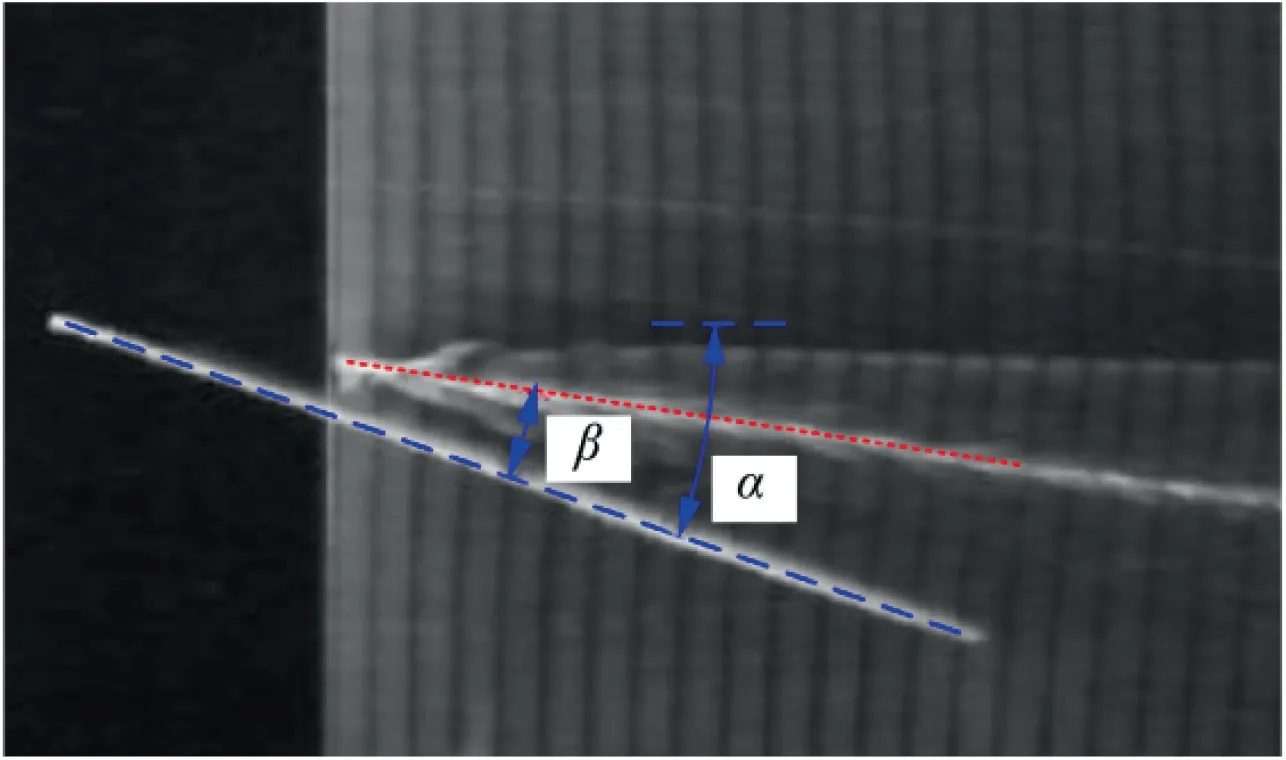
Fig. 12 Representative instantaneous image at α=20°.
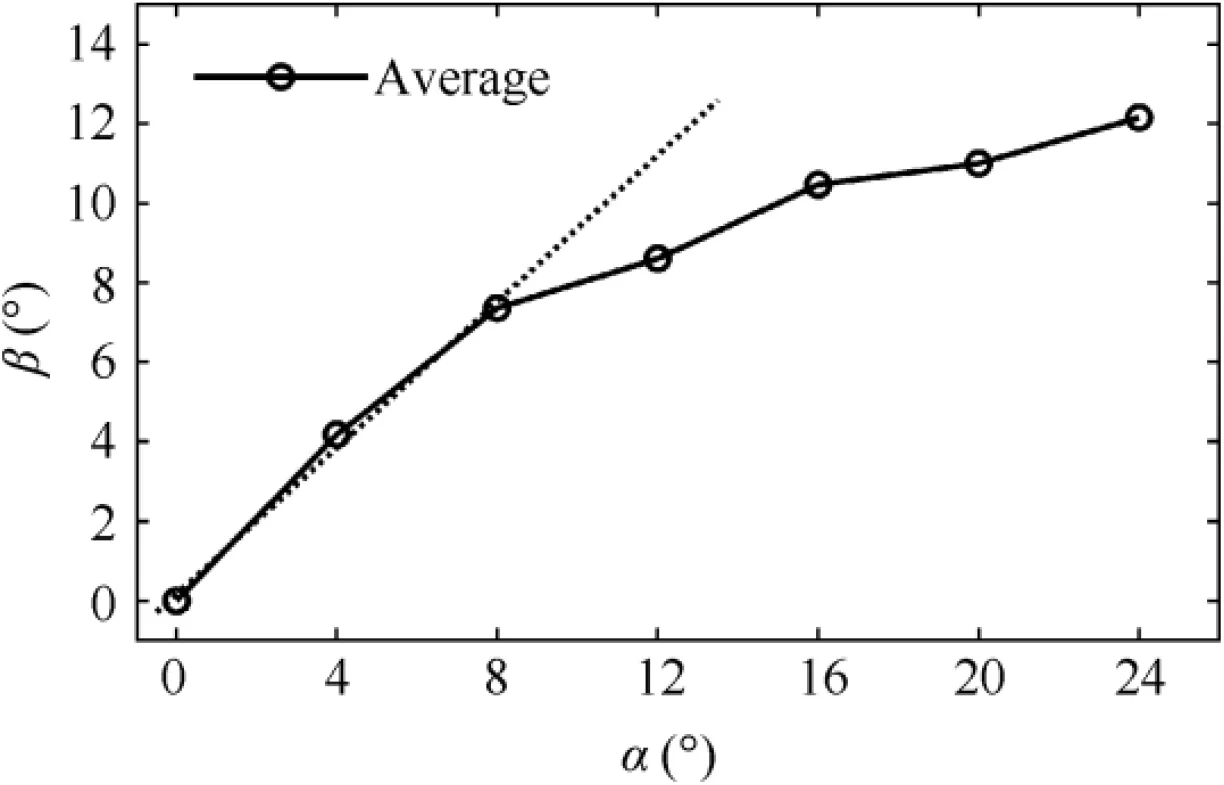
Fig. 13 Variation of WTV angle.
The curve of WTV angle versus AoA is plotted in Fig. 13.For each AoA, the average of WTV angles over 500 frames is calculated as the final value. It is obvious that the WTV angle increases rapidly with increasing AoA in the range of α=0-8°. Accordingly, the core of the WTV is almost along the free-stream direction in the side view. However, as the AoA further increases, the WTV angle deviates from the AoA and the slope of the curve declines.
4. Conclusions
The hydrogen bubble visualization and the time-resolved PIV experiments have been conducted to investigate the flow structures and the near-wall flow topology over a simplified Danaus plexippus model. The drastic evolution of the flow structures with the AoAs is investigated in detail in this study.The main conclusions are drawn as follows:
(1) Based on the characteristics of the near-wall topology,the flow field around the simplified model includes three types of pattern: the separation bubble (α=4-6°), the LEV(α=8-18°)and the high AoAs flow(α=20-24°).
(2) The separation bubble pattern is feathered with two saddles S1 and two foci F1,which are the implication of the separation bubbles.The leading-edge SLs,which appear at the moderate AoAs, are the dominant features of the LEV pattern. The open SLs form at α=8°, along with the occurrence of the merging of the two LEVs. The interaction between the LEVs and the WTVs results in the formation of the stable foci F3 and the combination S1-N2-S2 at α=16°. The foci F1 and F2 form on the forewing and the hindwing in the high AoAs pattern,corresponding to the spiral structures above the upper surface.
(3) The WTV angle increases with increasing AoA in the side view.However,the slope of the curve of WTV angle versus AoA declines when α ≥8°.
Acknowledgement
This study was funded by the National Natural Science Foundation of China (No. 11721202).
 CHINESE JOURNAL OF AERONAUTICS2020年10期
- CHINESE JOURNAL OF AERONAUTICS的其它文章
- A novel surrogate modeling strategy of the mechanical properties of 3D braided composites
- A user-friendly yield criterion for metals exhibiting tension-compression asymmetry
- Aerodynamic characteristics of morphing wing with flexible leading-edge
- High cycle fatigue failure with radial cracks in gears of aero-engines
- Motion equations of hemispherical resonator and analysis of frequency split caused by slight mass non-uniformity
- Light weight optimization of stratospheric airship envelope based on reliability analysis
