Drag increment induced by a small-scale forward-facing step in Mach number 5 turbulent boundary layer flows
Yifei XUE, Jie REN, Jinling LUO, Song FU,*
a School of Aerospace Engineering, Tsinghua University, Beijing 100084, China
b Department of Mechanical Engineering, University of Nottingham, Nottingham NG7 2RD, United Kingdom
c Beijing Aerospace Technology Institute, Beijing 100074, China
KEYWORDS Aerodynamics;Drag increment;Forward-facing step;Hypersonic flow;Turbulent boundary layer
Abstract Small-scale roughness elements or imperfections are inevitable over the surface of a flight vehicle. The aerodynamics of these small-scale structures is difficult to predict but may play an important role in the design of a flight vehicle at high speed. The forward-facing step is a typical type of roughness element. Many experiments have been conducted to study the aerodynamics of supersonic forward-facing step, especially with a step height larger than boundary layer thickness.However, few studies focus on small steps. To improve the understanding of small-scale forwardfacing step flow,we perform a series of simulations to analyze its aerodynamic influence on a Mach number 5 turbulent boundary layer.The general flow structures are analyzed and discussed.Several shock waves can be induced by the step even if the step height is much smaller than the boundary layer thickness. Two significant shocks are the separation shock and the reattachment shock. The influenced area by the step is limited. With the increase of the step height, the non-dimensional influence area decreases and gradually converges when the step height reaches the boundary layer thickness.There are two normalized distributions of the skin friction coefficient and pressure coefficient associated with step height. By using the normalized parameters, a power-law relationship between the step height and the drag increment coefficient is revealed and fits the simulation results well.It is further illustrated that this relationship still holds when changing the inlet angle of attack,but needs slight modification with the angle of attack.
1. Introduction
Roughness on the flight vehicle surface can lead to abnormal aerodynamics and thermodynamics. The surface of a space shuttle or hypersonic aircraft is protected by the thermal protection system to avoid overheating.Ablation may occur at the joints of the tiles,which may result in vertical or lateral movements between tiles. Possible geometries of the roughness element contain gaps, steps, and other complex configurations.The unexpected transition from laminar to turbulent flow1can be triggered by roughness elements and then performs quite different aerodynamic and thermodynamic properties compared with a smooth surface. When the Space Shuttle Columbia re-entered the atmosphere during its 28th mission,it rotated uncontrolled and disintegrated. The incident was found to be related to a hole on its left wing. The unmanaged aerodynamic force and the overheating induced by the hole led to the disaster.2Subsequent technical reports focused on the roughness problems, including the forward-facing step,3after this regrettable incident.
Theoretical and experimental analyses are the conventional effective methods on the forward-facing step flow.As a typical roughness geometry, the forward-facing step has been studied successfully by the theoretical method. The free-interaction theory proposed by Chapman et al.4works well in supersonic step flow and is consistent with plenty of experimental data.As for the experimental method, Boddonff5conducted experiments of different step heights in a Mach number 3 wind tunnel.He observed the characteristic flow structures and pressure distributions. His experimental data, along with other researchers’ data, were summarized by Zukoski,6who proposed a non-dimensional pressure profile along the wall surface. With the non-dimensional characters, Zukoski proposed an evaluation method of aerodynamics. Later on, more experiments7,8proved the accuracy of this method. There are also some experiments focusing on the heat transfer of a forward-facing step.9,10Particle Image Velocimetry (PIV)makes it possible to measure the instantaneous velocity. By using the PIV method, Pearson et al.11found that the interaction between the superstructures in the incoming boundary layer and the separation region causes the wall pressure fluctuation. Murugan and Govardhan12found the correlation between the induced instantaneous shock’s position and the recirculation line.
Reynolds-Averaged Navier Stocks (RANS) method13is reliable in the Shock Wave/turbulent Boundary Layer Interaction(SWBLI)problems,14,15one of which is the step-like structure.16Zheltovodov8simulated the forward-facing step flow by the RANS method and obtained a good agreement between computational and experimental results. Turbulent models,such as k-ε model,8,17k-ω model,18νt-92 model, SA model,and SST model,19are feasible in simulating forward-facing step flow. Hybrid method20and direct numerical simulation21are appropriate in transition or turbulent flow induced by this roughness.The non-equilibrium or rarefied gas flow should be considered at high altitudes. Direct simulation Monte Carlo method22and direct numerical simulation of the Boltzmann kinetic method23have been successfully applied to the simulation of the high-altitude flow.
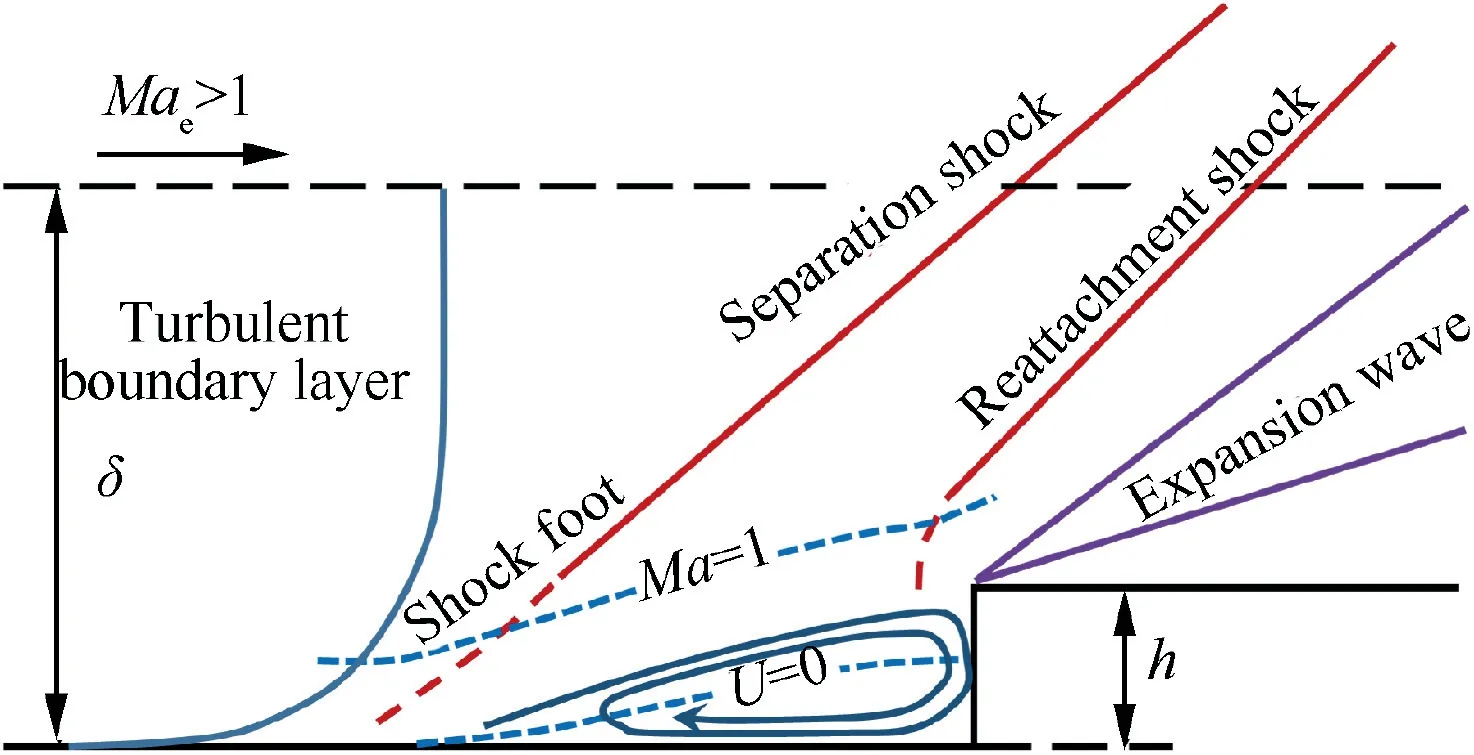
Fig.1 Schematic of forward-facing step in hypersonic turbulent boundary layer.12
The experimental and numerical studies mentioned above have clarified the mechanism of the forward-facing step flow on a hypersonic boundary layer. However, most of these results focus on steps higher than the boundary layer thickness. More efforts are required to improve the understanding of the small-scale step flow. We summarize a schematic of a forward-facing step beneath a hypersonic boundary layer, as illustrated in Fig. 1,where δ is the local boundary layer thickness, Maethe Mach number, U the velocity in the streamwise direction, and h is the height of the forward-facing step. The subscript e denotes values at the edge of the boundary layer.The forward-facing step induces an oblique separation shock at the separation point in front of the step. There is another shock starting near the upper corner of the step, which is named reattachment shock. The reattachment shock is relatively weak compared to the separation shock. An expansion following the reattachment shock changes the flow direction,and the velocity becomes parallel to the wall rapidly.
To quantify the aerodynamic changes caused by a smallscale forward-facing step, we use non-dimensional parameters in the following analysis. Streamwise location and step height are customarily non-dimensionalized by boundary layer thickness. Zukoski6proposed an approximate non-dimensional pressure distribution related to the Mach number.Later experimental results agreed well with his approximation, for example, pressure distributions in Uebelhack’s24experiments.Bobbitt25and Smith26used almost the same approximate method in their work. However, most approximate methods are established with the step height several times larger than the boundary layer thickness. There are very few studies on small-scale step because the flow of small-scale step is too small to survey.27We analyze step flows with heights less than boundary layer thickness in this paper. To further improve the understanding of the influence of parameters on the forward-facing step flow, a series of flows with different step heights and different inlet angles of attack (α) are simulated to analyze the aerodynamic changes. Based on Zukoski’s6approximation, the drag increment of the forward-facing step is investigated to highlight the particular importance of these two parameters.
The rest of this paper is organized as follows. The numerical method and computational setup are presented in Section 2.Section 3 contains simulation results and the analysis of the two parameters,the step height and the angle of attack.A relationship between the non-dimensional drag increment and the influence parameters is established according to the simulation results. Section 4 summarizes this work.
2. Numerical method
According to Dolling’s review,28the RANS method is capable of predicting mean pressure distribution in hypersonic separation problems. The governing equations are Reynoldsaveraged compressible Navier-Stocks equations. The turbulence model adopted in this work is Menter’s Shear Stress Transport (SST) k-ω model.29,30The calculation uses calorically perfect gas, and uses Sutherland law on viscosity. ROE solver is used in solving the Riemann problem. The in-house code uses third-order MUSCL interpolation with minmod limiter for inviscid flux and uses the second-order central difference for viscous flux.
To quantify the aerodynamics of step flow, we utilize drag coefficients to present the aerodynamic changes. Total drag coefficient consists of viscous drag coefficient and wave drag coefficient due to the shock:
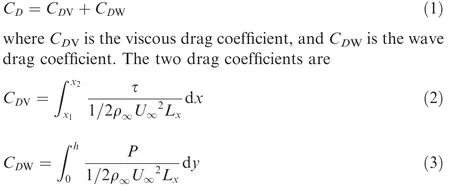
in which τ is the shear stress,and P is the static pressure at the wall. The streamwise length of the integral area is represented with Lx. For the parameters with a subscript ‘‘∞”, ρ∞, U∞and P∞are the density,the wall-tangent velocity and the static pressure in the far-field, respectively. Drag increment coefficient is

It is defined to evaluate the aerodynamic influence in the following discussion. In Eq.(4), CD,0denotes the total drag coefficient on a corresponding smooth flat plate. The value of the drag increment coefficient is independent of the farfield parameters and the integral length Lx.
2.1. Computational setup
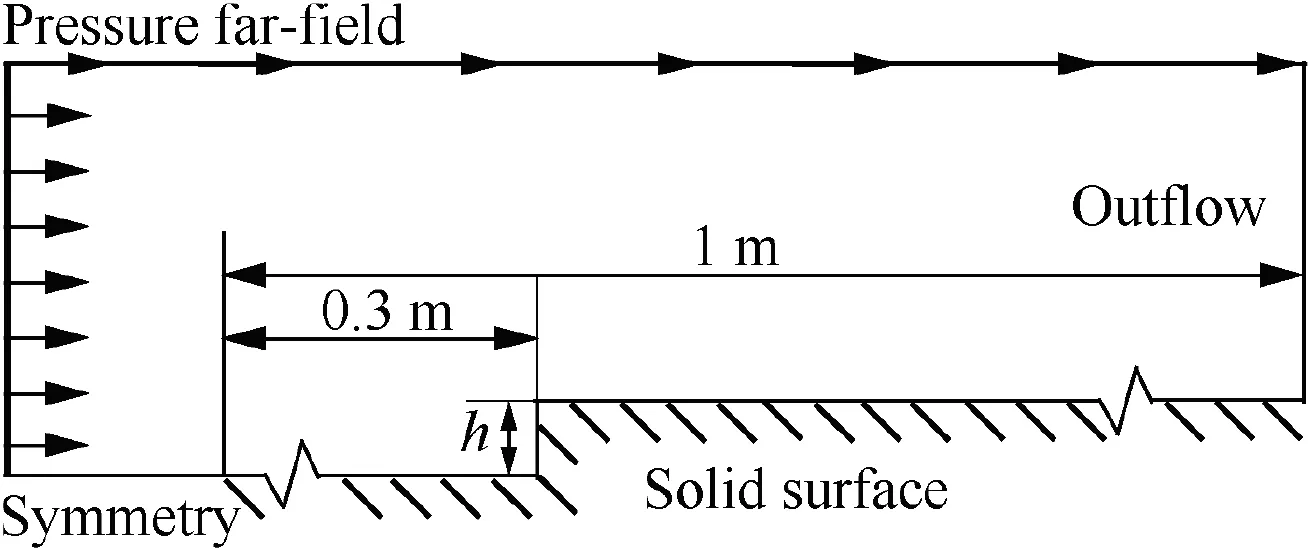
Fig. 2 Sketch of computational domain.
We perform a two-dimensional RANS simulation of forwardfacing step flow in a hypersonic boundary layer. Fig. 2 is a sketch of the step flow. The forward-facing step is located at x=0.3 m on a flat plate. The unit Reynolds number at the inflow is Re∞=9.23×10⁶m-1, which is defined with the free-stream parameters and unit length.The free-stream Mach number is Ma∞=5, and the static temperature is T∞=216.5 K. Various step heights and angles of attack are investigated, as shown in Table 1. Most of the step heights are less than the local turbulent boundary layer thickness δ,measured in the corresponding smooth flow at the location of x=0.3 m. A symmetry boundary condition is adopted ahead of the flat plate to obtain a fully developed turbulent flow on the flat plate. The solid surface is an adiabatic noslip wall. Extrapolation is adopted at the right-end of the domain, which is applicable for hypersonic flow.
2.2. Grid independency study and validation
Simulation results are confirmed to be mesh independent. For the smooth cases at α=0°,we show the results with four mesh configurations in Fig. 3. Finer meshes have been generated by increasing the grid number in each direction with a factor of 1.41. The y+value of the coarsest grid is of one or less in the boundary layer region.As shown in Fig.3,the skin friction coefficients Cfat x=0.3 m with different meshes show a negligible difference in the last three test cases, illustrating that these results are mesh independent. Therefore, the results presented below are based on the mesh of the second point,weighing accuracy and efficiency.
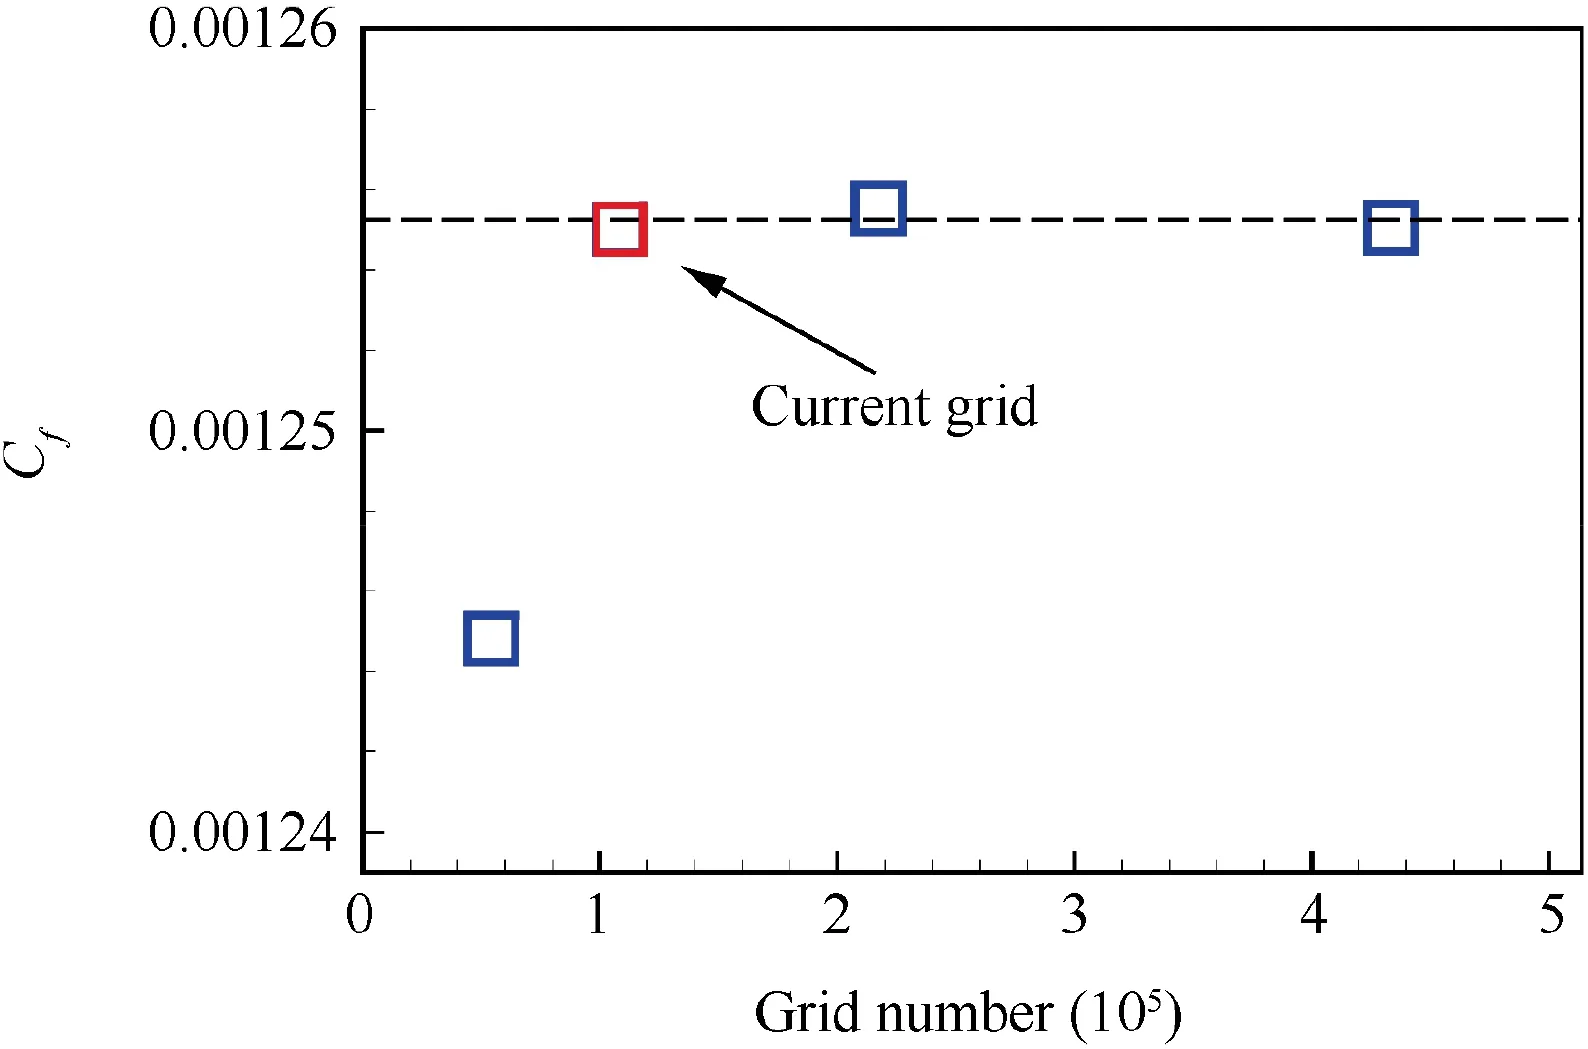
Fig. 3 Skin friction coefficient obtained using different grid numbers.

Table 1 Summary of step heights in all cases.
Taking the case of α=0°, h=1.0 mm as an example, the calculation field has 770 points in the streamwise direction,150 points in the wall-normal direction,wherein there are 55 points in the vertical surface of the step. An overview of the mesh is illustrated in Fig. 4. The omitted unit of length is a meter in figures.
The numerical method is confirmed to be accurate by comparing with Mach number 2.9 experimental results.23The nondimensional skin friction coefficient Cf/Cf,inand nondimensional pressure distributions P/P∞on the surface of the step are in good agreement with the experiment, as shown in Fig.5.Solid squares represent the experimental results,and the solid line represents the simulation results.
3. Results and discussion
3.1. Overview of forward-facing step flow
An overview of the flow structures is shown in Fig.6.The formation of the boundary layer at the leading edge induces a shock that generates the turbulent boundary layer rapidly.The velocity profile agrees well with the log law. Fig. 7 is the velocity profiles at x=0.2 m and x=0.4 m. The symbols are the van Driest transformed velocity profile:
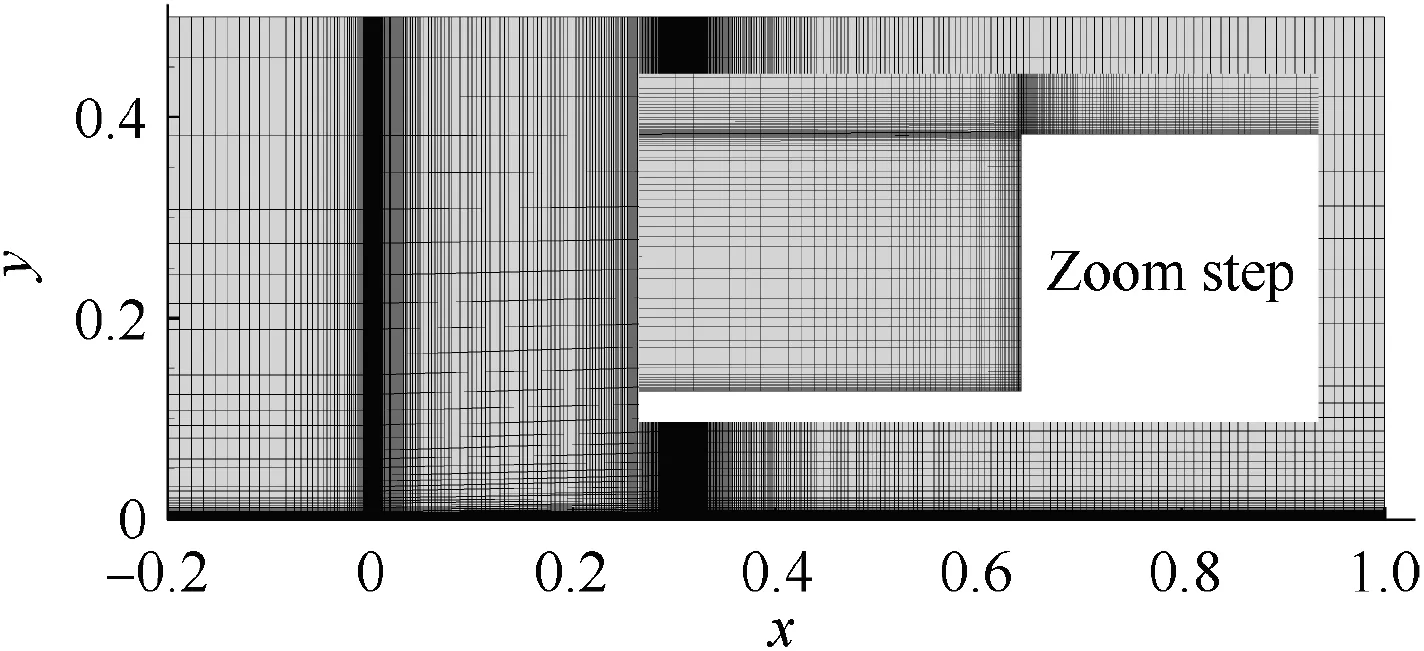
Fig. 4 Overall grid and grid near the step.
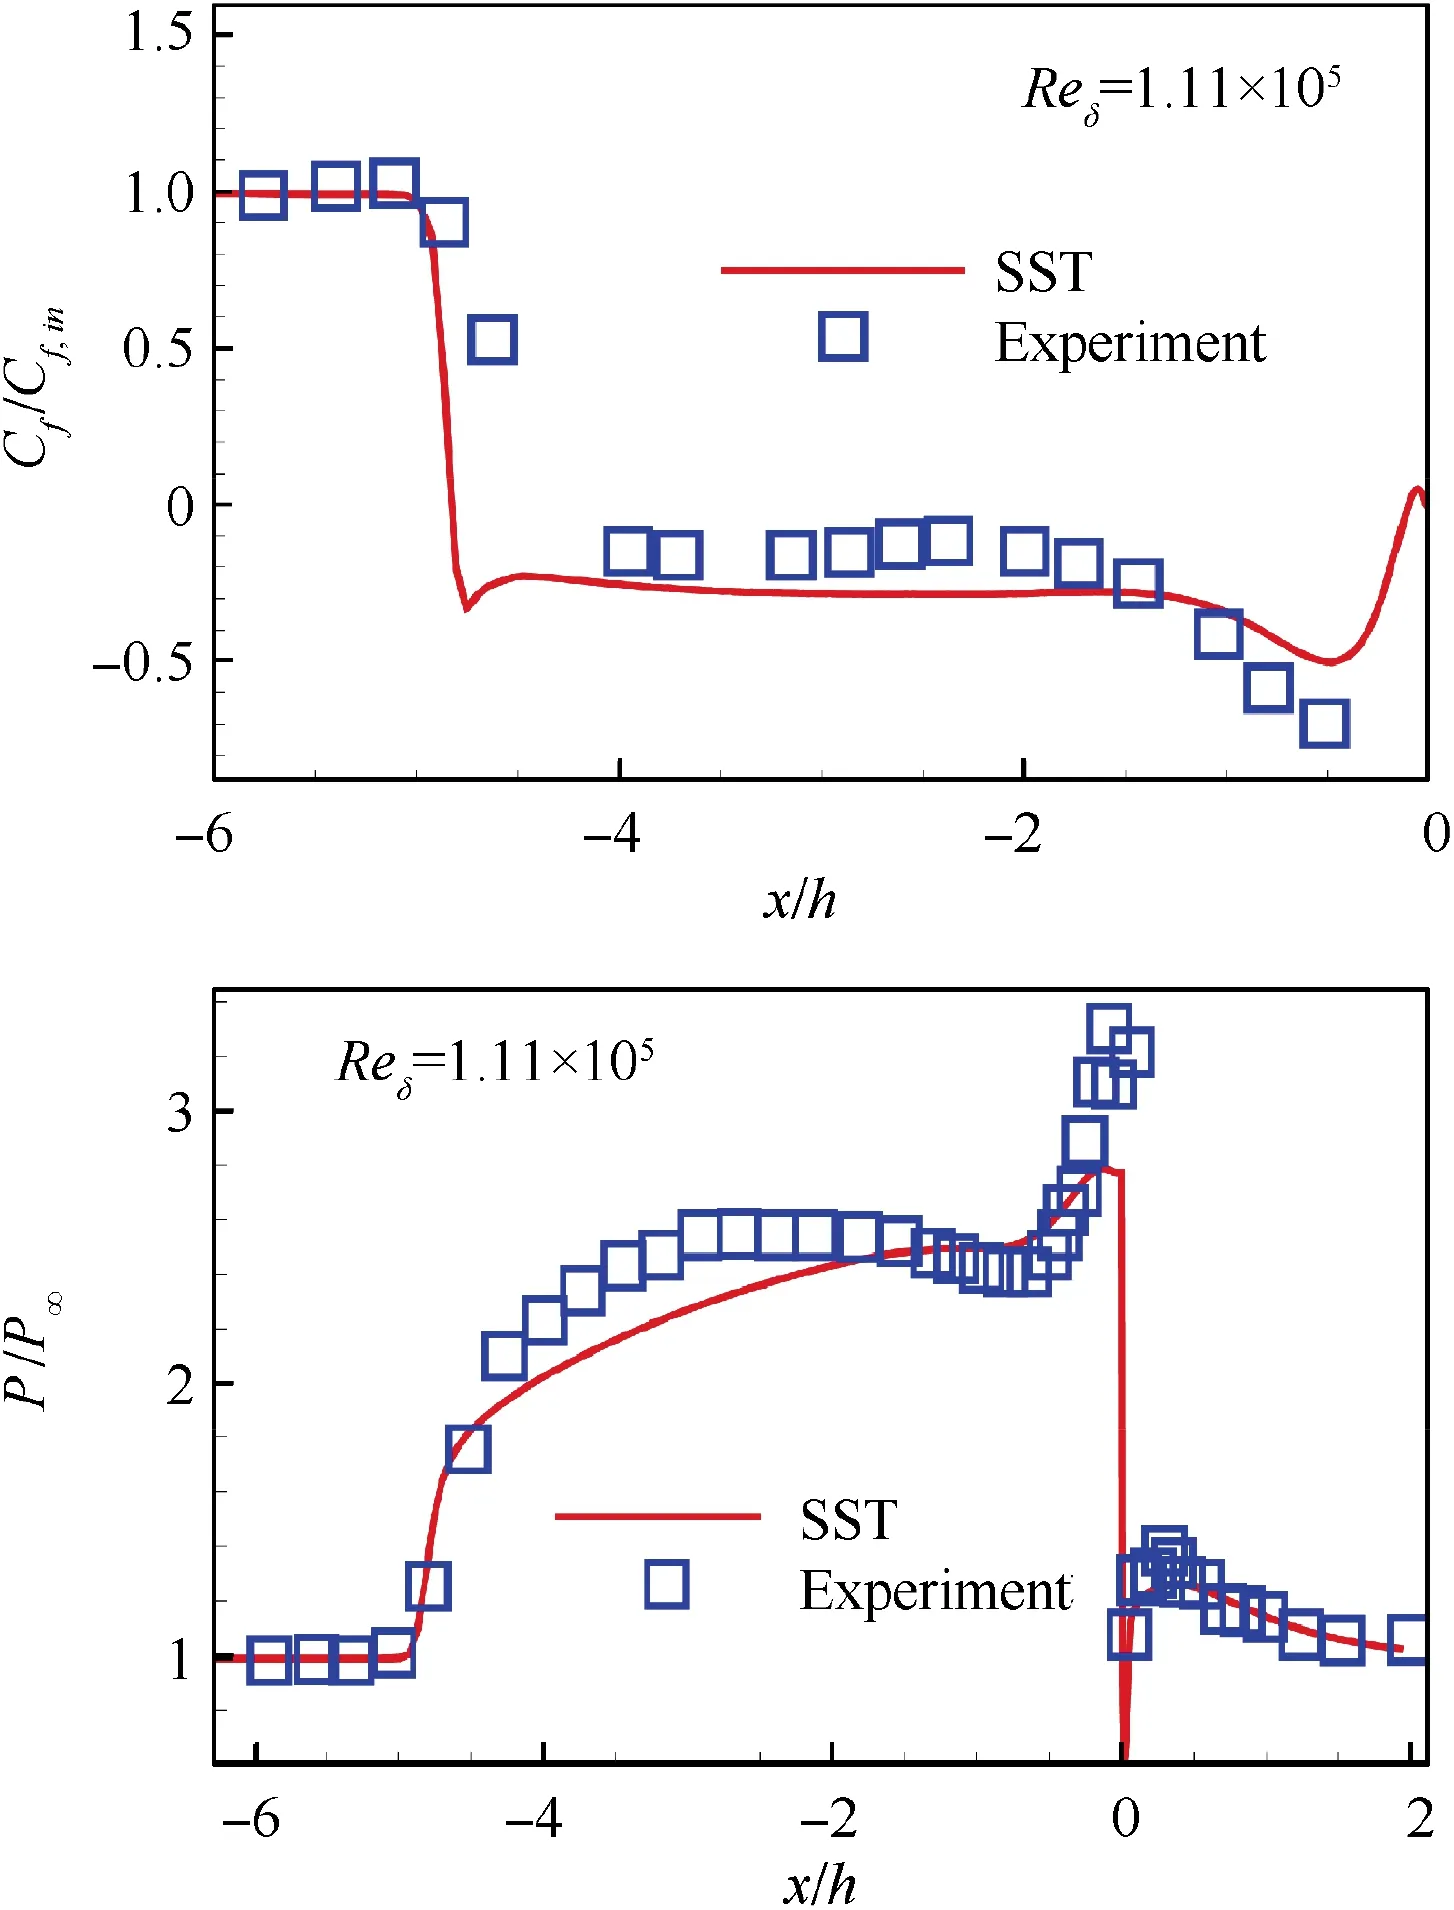
Fig. 5 Verification of current method (non-dimensional skin friction coefficient and non-dimensional pressure).

The dashed line in Fig.7 is the theoretical results,31which is a sum of log law and wake contribution.The simulation result agrees well with the theoretical profile, which also verifies the accuracy of the numerical method.

Fig. 6 Mach number distribution (α=0°, h=1.0 mm).
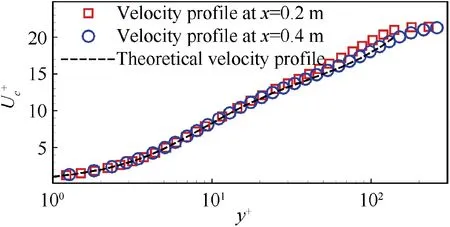
Fig. 7 Velocity profile compared with theoretical solution.
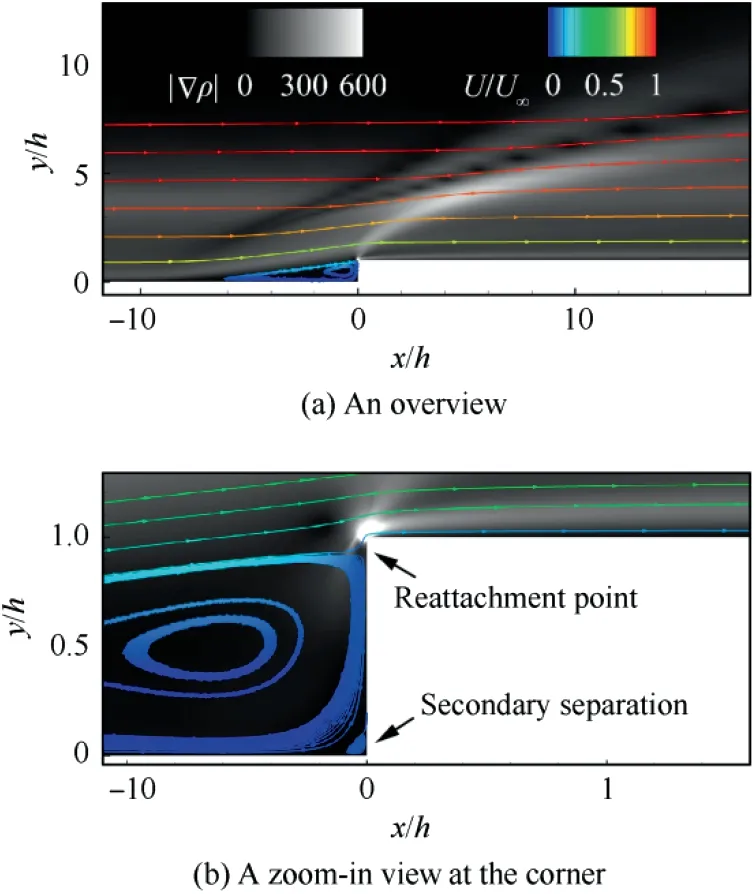
Fig. 8 Shocks and streamlines in the vicinity of step (α=0°,h=1.0 mm).
The time-averaged solution can be resolved by the RANS method, which illustrates the flow structure at the step.Fig. 8(a) shows the flow structures, including two shocks and expansion waves.The first shock is induced by the separation.The foot of the first shock is located near the separation point.The second shock is induced by the upper corner of the step corresponding to the reattachment point. Both two smeared shock feet become compression waves near the wall. Outside the boundary layer, these two shocks merge into one oblique shock.As shown in Fig. 8(b),the reattachment on the vertical surface is located right beneath the upper corner of the step but not exactly at the corner point. The two shocks lift the fluid and finally change the fluid parallel to the wall surface by expansion after the reattachment shock. Unlike the secondary recirculation above the step in low Reynolds number flow,there is no time-averaged separation above the step.The separation in front of the step plays the role of a wedge in this process.
3.2. Effect of step height
Step flows of different heights are investigated in this section.Fig. 9 shows a similar pressure distribution for different step heights. Pressure increases monotonously in front of the step and decreases rapidly after the step. Further downstream,the pressure returns to the undisturbed condition.The aerodynamic effect of the step is local,which means that each step has its influence area. The influence area and the shock strength enlarge with the increment of the step height.
The influence area is defined by locating the streamwise region, where the pressure coefficient difference is over 5%compared with the smooth configuration. The influence area changes with step height,as shown in Fig.10.When the length of the influence area is non-dimensionalized with step height,the minimum step height has the largest influence area,as illustrated in Fig. 10. The influence area extends because the farthest propagation of the interaction between step and boundary layer is related to the local Mach number at the top of the step.When the local Mach number is much less than one, the interaction will propagate far away. In the cases at Ma∞=5, the scale of influence area converges to be (-8h,35 h) as the step approaches the edge of the boundary layer.
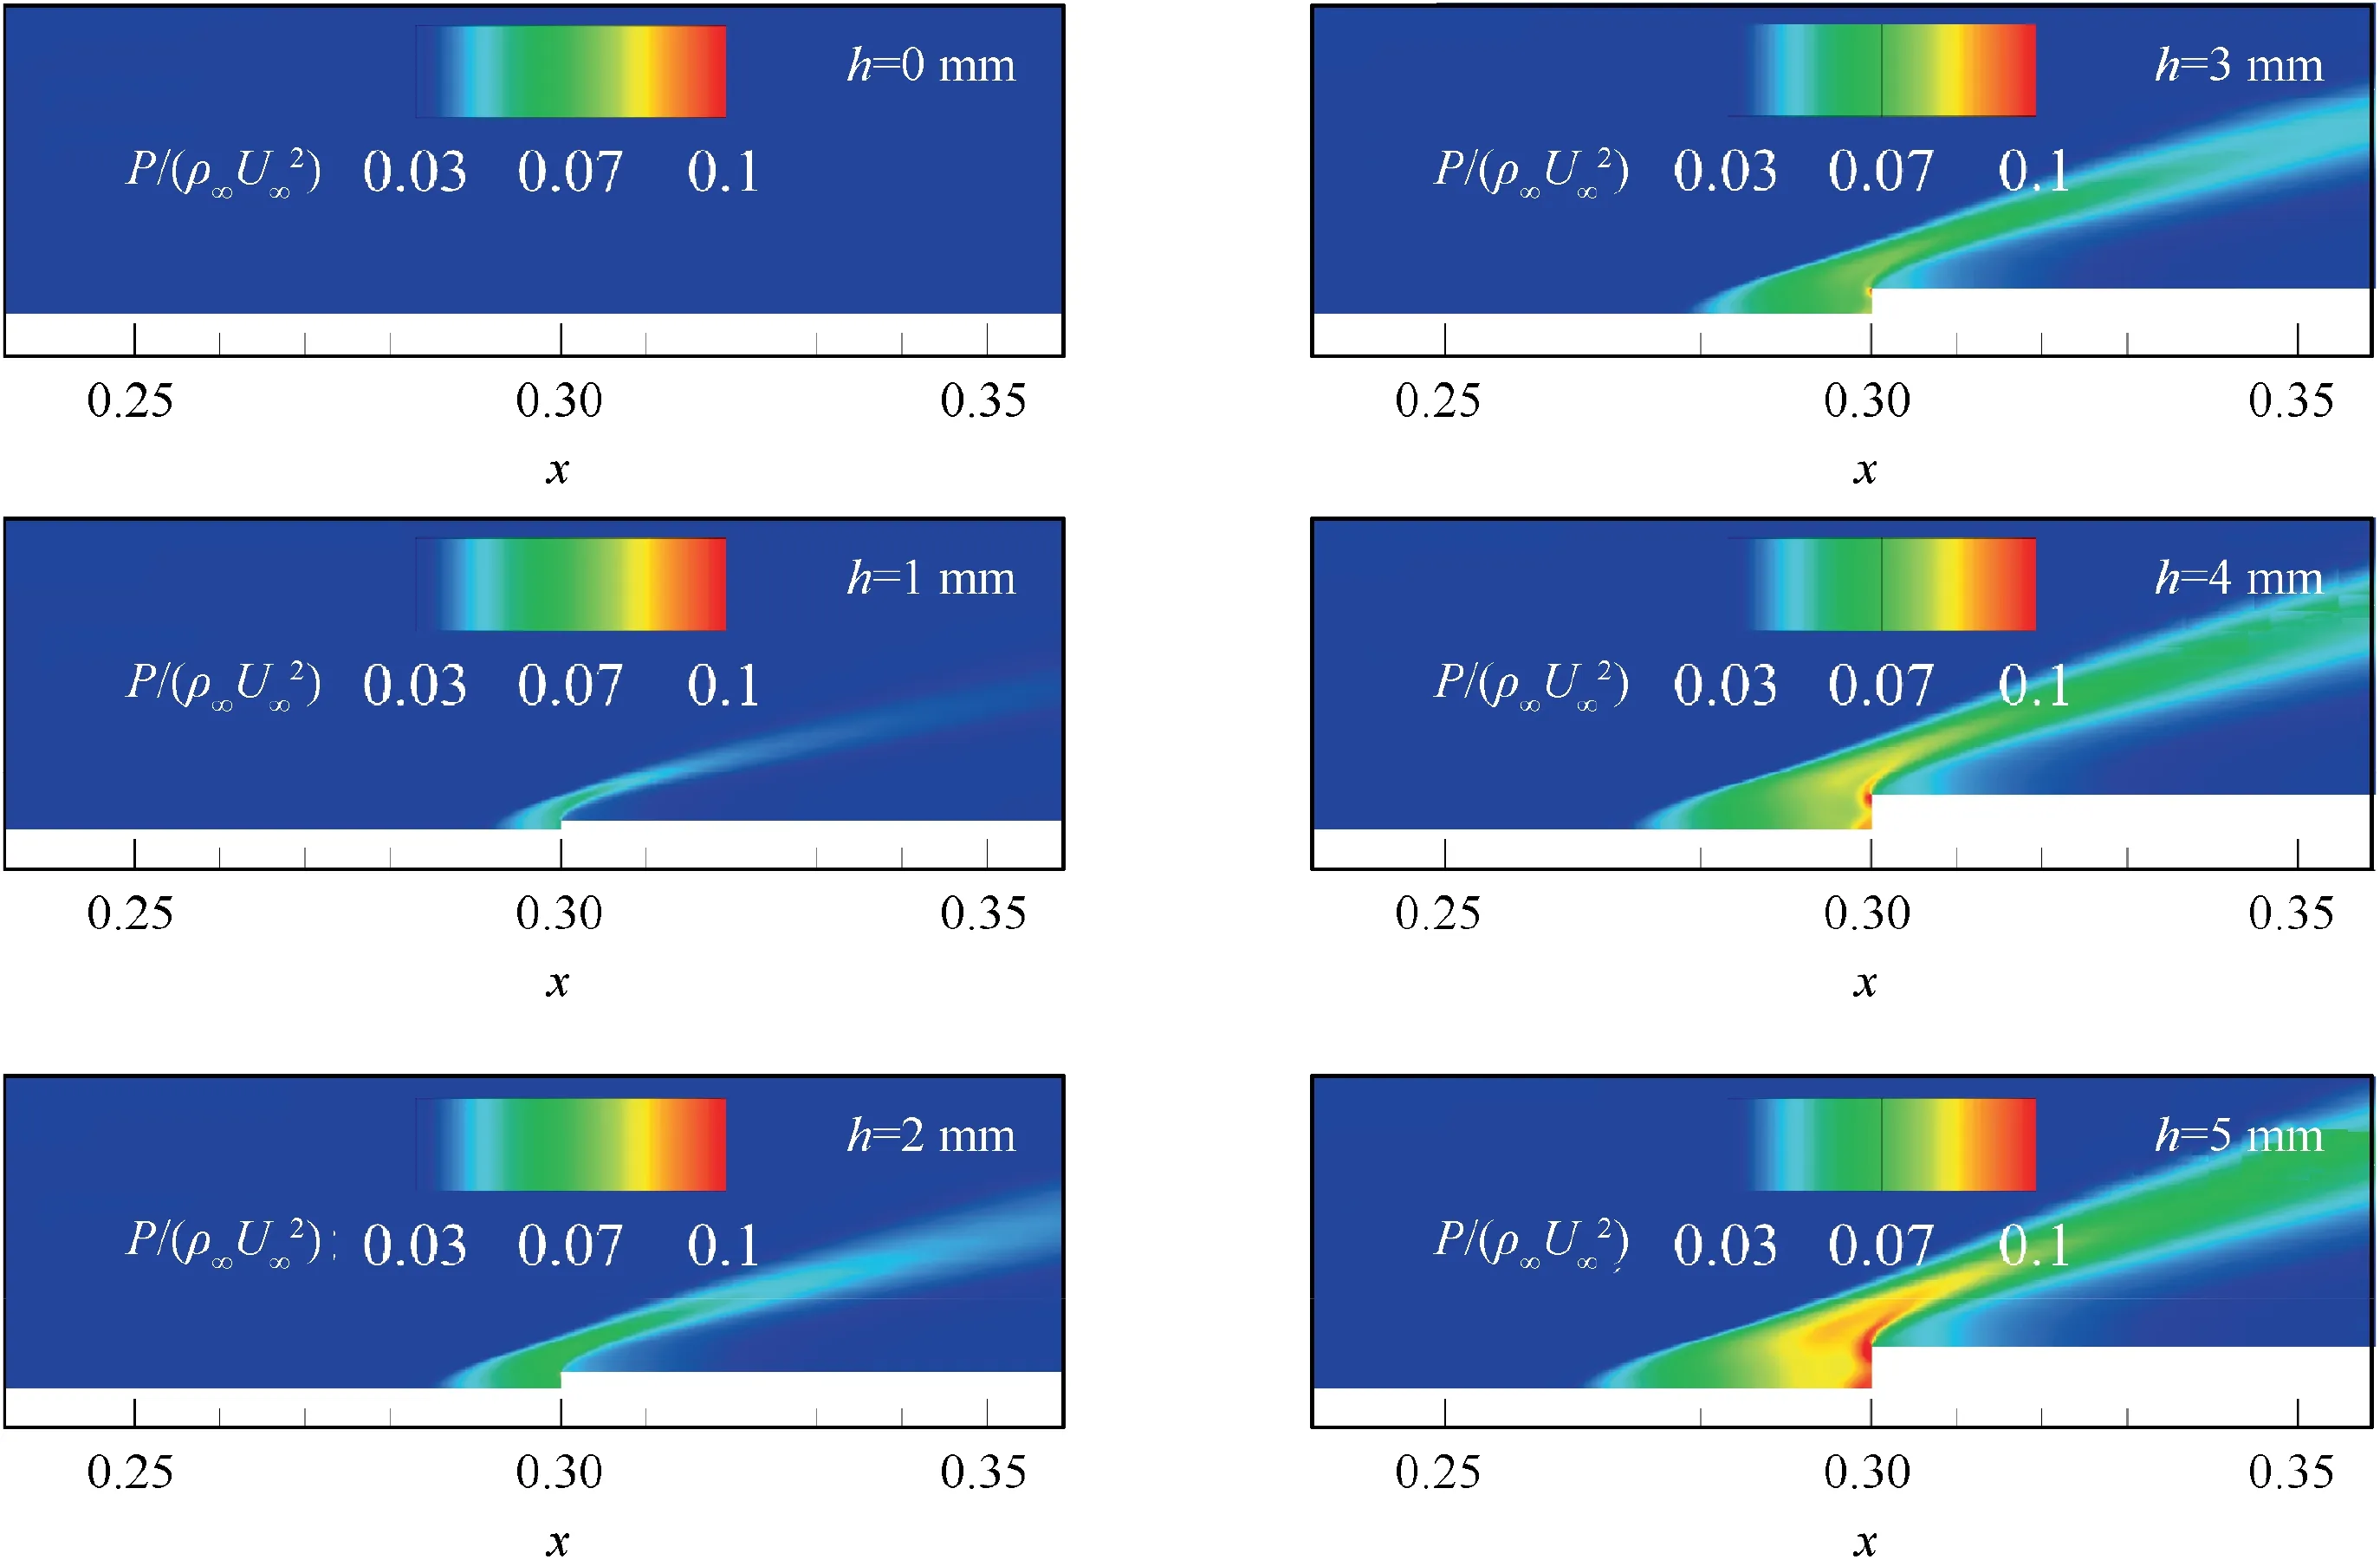
Fig. 9 Pressure distribution at step (α=0°).
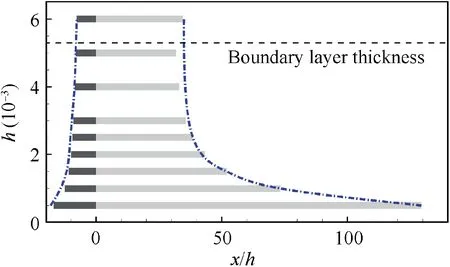
Fig. 10 Influence area of steps (α=0°).
The free-interaction theory32provides a non-dimensional pressure distribution along the wall surface. Also, one characteristic shape of the pressure distribution curve can be derived from experimental results.3,6By using a similar nondimensional method, we obtain two distributions of the pressure and the wall-shear-stress. Fig. 11 illustrates the skin friction coefficient Cfalong the horizontal wall surface. Skin friction coefficient profiles converge when step height is used to normalize the streamwise location. The negative region is the main separation part. The small positive region denotes the secondary separation, as shown in Fig. 8(b), which is located at the lower corner of the step. Fig. 12 shows the normalized pressure distribution along the vertical surface of the step. The velocity in the separation is small, and the fluid is nearly in a dead zone. As a result, each pressure profile has a constant region near the bottom of the step.There is an overshoot at the top region, which is induced by the reattachment shock. Here, we use a normalization function on the pressure to obtain a converged distribution.The normalization function F, as proposed by Zukoski,6is defined as

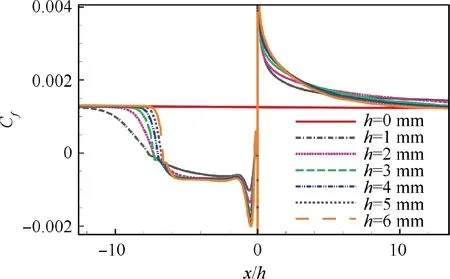
Fig. 11 Friction coefficients distributions at step.
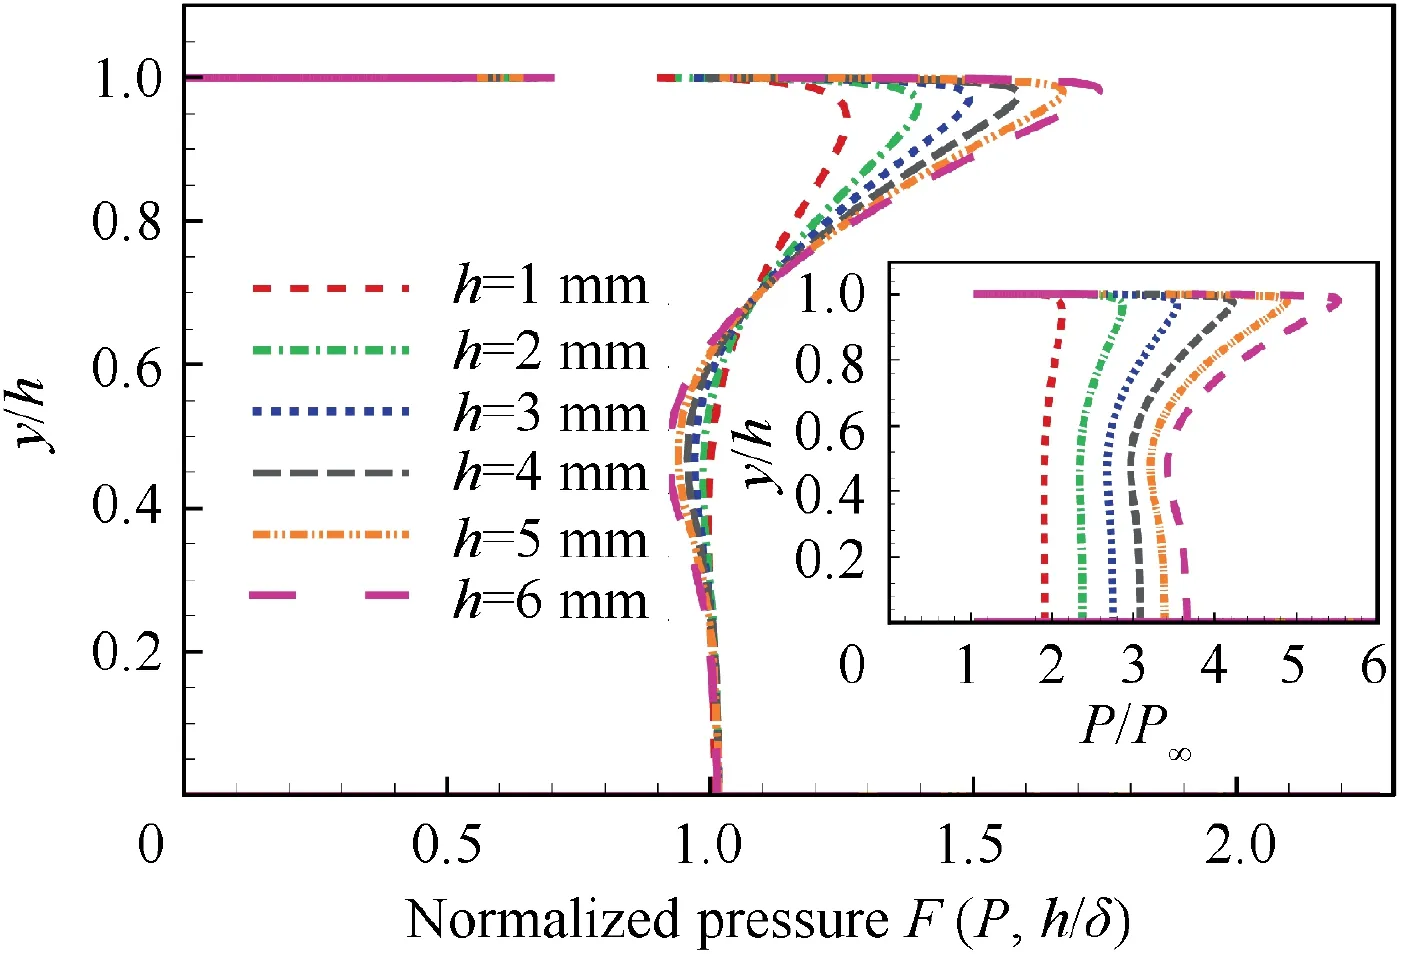
Fig. 12 Non-dimensional pressure distributions at steps.
in which Peis the static pressure at the edge of the boundary layer. Maris the undisturbed Mach number which is defined with the Mach number at the height of the reattachment point in the corresponding smooth flow. It can be simplified with a power law:

The undisturbed Mach number Maris the main parameter that determines the increment scale of the non-dimensional pressure. We use non-dimensional step height h/δ to evaluate Mar,and then the pressure distributions are finally normalized with h/δ. The normalized pressure profiles are shown in Fig.12. The pressure distribution shows high-pressure regions located at the two corners of the step.The reattachment shock is responsible for the upper high-pressure region. The low velocity leads to the lower high-pressure region. Pressure rise at the upper corner is more significant than that at the lower one.
Drag coefficients, defined in Section 2, should have some certain regularities when both the skin friction coefficient and the pressure coefficient can be normalized. The integral of the drag coefficients in Eq. (2) needs a limited streamwise region. As the influence area is non-dimensionalized with the step height, the limited integral region should cover the influence area in most cases. So the integral region in Eq. (2) is set to be x1=-20 h,x2=100 h.Fig.13 shows the drag increment coefficient ID=(CD-CD,0)/CD,0of different step heights.
Taking the case of α=0°, h=1.0 mm as an example, the ratio between the wave drag coefficient increment and the decrease of the viscous drag coefficient is about 10. In other words, the increase of the wave drag is an order of magnitude larger than the change of the viscous drag.So the wave drag is the major contributor to the drag increment coefficient. As a result, the form of the empirical formula is assumed to be a power law similar to the normalization function of pressure distribution. Then the drag increment coefficient IDcan be evaluated with the non-dimensional step height h/δ,
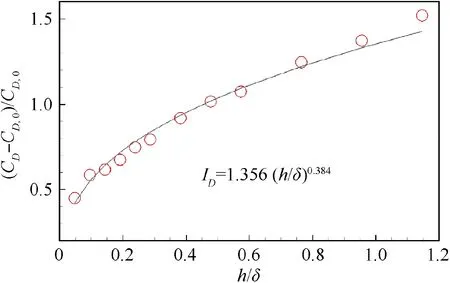
Fig.13 Correlation between drag increment coefficient and nondimensional step height.

This empirical formula is derived from results with step heights less than the boundary layer. So the formula works well only when a step is beneath the boundary layer. The empirical formula fits the points well except the points at h/δ<0.2. One of the reasons is that power law is not suitable at the inner turbulent boundary layer. Another reason is that the influence area in the inner boundary layer is larger than the integral area (see Fig. 10).
3.3. Effect of angle of attack
We simulate step flows with different angles of attack. Five angles of attack are studied: 2.5°,0°,-2.5°,-5°,-10°.A series of tilt symmetry boundary conditions with different angles are utilized to guarantee the accuracy of the inlet flow direction,as illustrated in Fig.14.In the simulations of the positive angle of attack, the borders of the upper boundary layers are tilted to the same directions as the inlet flow.
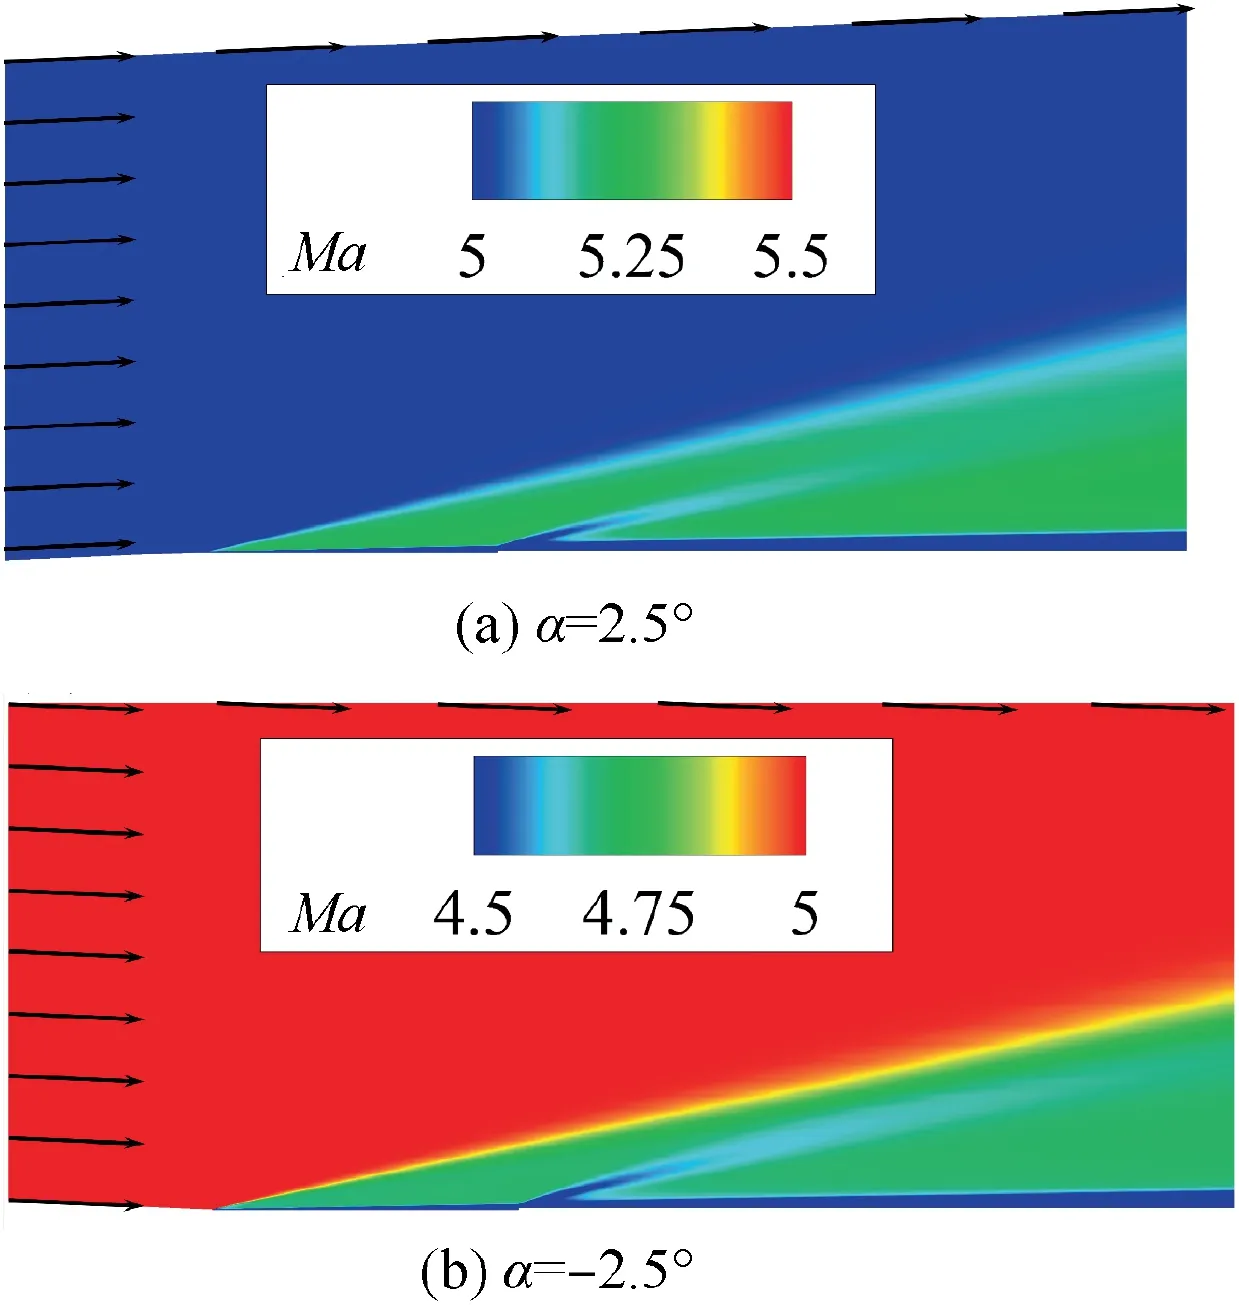
Fig. 14 Computational domain and Mach number distribution of different angles of attack (h=1.0 mm).
The positive angle of attack leads to an expansion at the head of the flat plate. The expansion accelerates the speed of fluid outside the boundary layer.Mach number increases after the leading edge, as shown in Fig. 14(a). For a negative angle of attack,the inlet flow obliquely impinges on the wall.As the angle of attack decreases, the strength of the leading edge shock becomes stronger, as shown in Fig. 14(b). As a result,the Mach number decreases, and the pressure increases after the shock. The aerodynamic influence induced by the forward-facing step becomes stronger at a negative angle of attack.
Fig.15 shows the drag increment coefficients of all angles of attack.The results of the negative angle of attack are above the empirical profile,and the results of the positive angle of attack are beneath the empirical profile. Each angle of attack has a similar shape of the profile — the angle of attack works as an amplifier or a reducer in the step flow.
With a small change of angle of attack, the relationship between the non-dimensional step height and the drag increment coefficient changes in the magnitude but is still the same.The drag increment coefficient of different angles of attack can be rescaled to a unique non-dimensional profile. Then we use two linear transformations to simplify the modifications. The non-dimensional step height is rescaled by multiplying with a parameter related to α,

in which α is measured in radians (rad). The drag increment coefficient is also rescaled by dividing with another linear parameter,

In conclusion, the final empirical formula considering the effect of both the step height and the angle of attack is

The results of all step heights and all angles of attack are collected as a plot of the rescaled drag increment coefficient corresponds to the rescaled dimensionless step height in Fig. 16.The dashed line represents the results of the empirical formula.
The empirical formula provides an efficient way to value the aerodynamic change by a step in engineering. By using the empirical formula,we can predict the local drag increment of a limited part of the aircraft surface without simulating the flow individually.
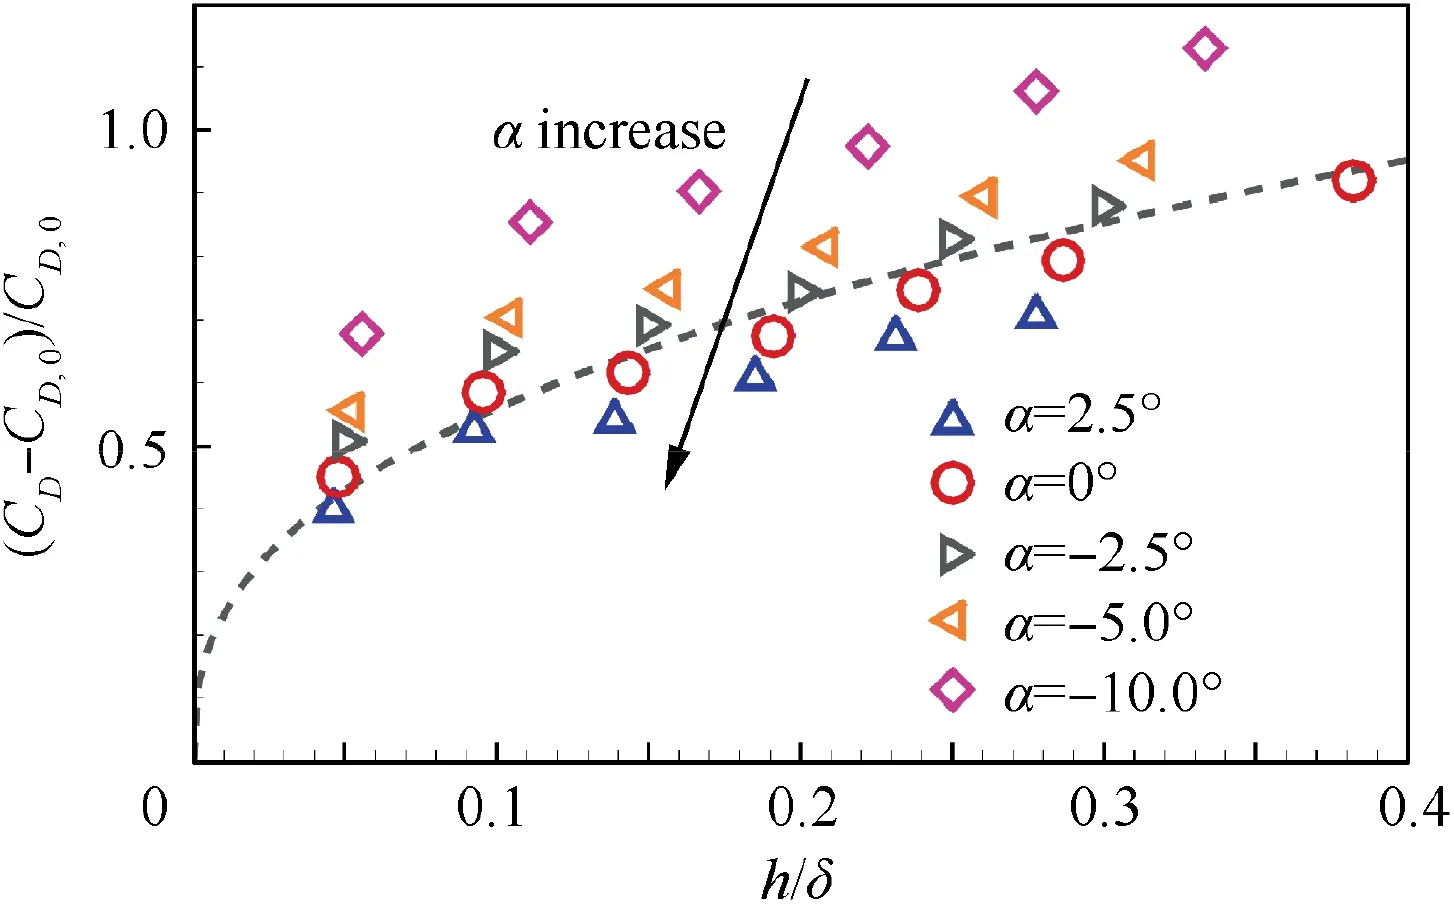
Fig.15 Drag increment coefficients of different angles of attack.
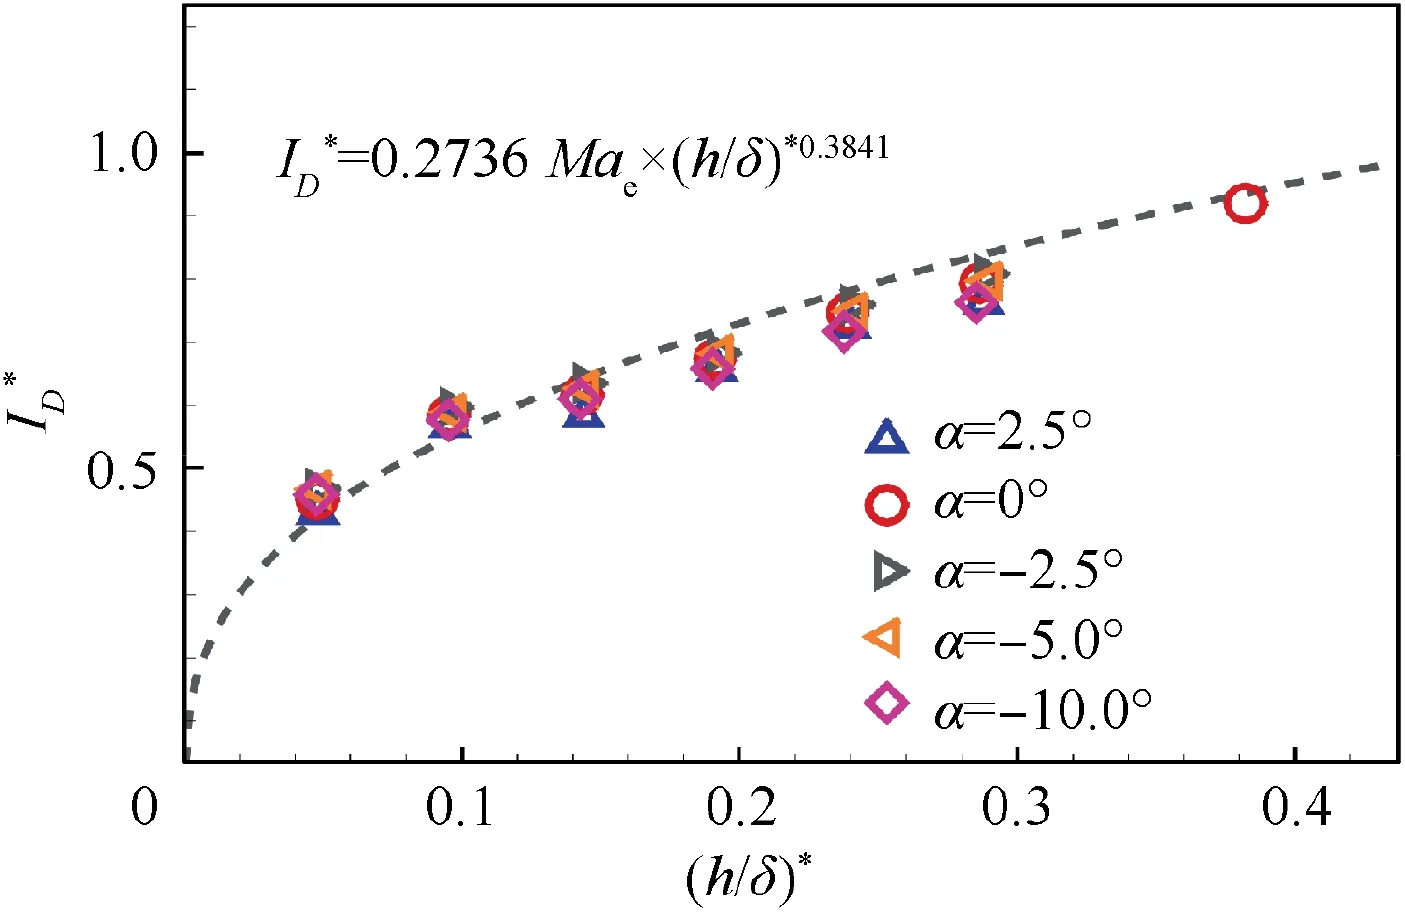
Fig.16 Relationship between rescaled drag increment coefficient and dimensionless step height.
4. Conclusions
The aerodynamics of hypersonic forward-facing step flow is studied in this paper. The step with a height less than local boundary layer thickness is located on a hypersonic flat plate at Mach number 5.RANS method is adopted to solve the fully turbulent flow.
General flow structures are analyzed. Based on the timeaveraged results, even if the step is immersed in the boundary layer, two shocks can be triggered by the step. They are the separation shock appearing at the front of the step, and the reattachment shock at the upper corner. The two shocks merge, forming one oblique shock out of the boundary layer.
The shocks are responsible for the aerodynamic changes.The strength of the step-induced shock increases with the step height.As for the aerodynamic,each of the steps has a similar skin friction coefficient distribution and pressure coefficient distribution. The total drag of step flow consists of wave drag and viscous drag, which corresponds to pressure coefficient and skin friction coefficient.To highlight the effect on the drag increment, a series of non-dimensional parameters are defined for the analysis of the computational results. The empirical formula of the drag increment coefficient in a power-law form is proposed in this paper, which fits simulation data well.
The influence of the angle of attack is also investigated.The decrease of the angle of attack will lead to a thinner boundary layer thickness and a smaller Mach number at the step. The drag increment coefficient is amplified by a negative angle of attack and reduced by a positive one. By modifying the proposed empirical formula with the angle of attack, a new formula for the drag increment coefficient is proposed, which includes the effect of dimensionless step height as well as the angle of attack. The empirical formula can quickly predict aerodynamic changes with these two parameters.
Acknowledgements
The authors acknowledge financial support from the National Natural Science Foundation of China (Nos. 11602127 and 11572176).
 CHINESE JOURNAL OF AERONAUTICS2020年10期
- CHINESE JOURNAL OF AERONAUTICS的其它文章
- A novel surrogate modeling strategy of the mechanical properties of 3D braided composites
- A user-friendly yield criterion for metals exhibiting tension-compression asymmetry
- Aerodynamic characteristics of morphing wing with flexible leading-edge
- High cycle fatigue failure with radial cracks in gears of aero-engines
- Motion equations of hemispherical resonator and analysis of frequency split caused by slight mass non-uniformity
- Light weight optimization of stratospheric airship envelope based on reliability analysis
