
A unified graphical method for integration of hydrogen networks with purification reuse☆
2016-05-30 12:54MinboYangXiaoFengGuilianLiu
Minbo Yang,Xiao Feng*,Guilian Liu
School of Chemical Engineering&Technology,Xi'an Jiaotong University,Xi'an 710049,China
1.Introduction
Hydrogen is an essential raw material in re fineries to produce high quality petrochemicals.In recent years,because of the increasing strict environmental regulations and the change of crude oil to heavier and poor in quality,re fineries are forced to increase their hydrotreating processes.Consequently,the consumption of fresh hydrogen increases rapidly,posing great challenges for most re fineries[1–3].
Process integration is an effective way to achieve reasonable hydrogen networks,avoiding unnecessary waste and minimizing the demand of fresh hydrogen.At present,methods of process integration for hydrogen networks mainly include graphical methods[4–6],algebraic methods[7–9]and mathematical programming methods[10,11].Among these methods,graphical ones have the characteristics of clear conceptions and easy procedures.
Hydrogen purifiers provide a low-cost way to recover and reuse the hydrogen in streams with low hydrogen concentrations[12–15]and have been widely used in re fineries,obviously reducing the consumptions of fresh hydrogen,as well as the total cost for re fineries[16].In order to minimize fresh hydrogen consumptions,a hydrogen network and purification processes should be analyzed as a whole[8,17–21].Zhang et al.[20]proposed a graphical representation of purification processes and combined it with an early graphical method[4],giving a systematic graphical method for integration of hydrogen networks with purification reuse.This graphical method was improved and extended for further study on the purification reuse of hydrogen networks,including the performance of purifiers[22–24],change rules of pinch[25],and the optimal purification process[26].In these graphical methods,purification processes with purified product of different purities are divided into three scenarios and identified by differentprocedures,making these methods complex and inconvenient.Moreover,graphical iterations are needed to determine the final purification processes.
The objective of this work is to propose a unified graphical method for integration of hydrogen networks with purification reuse.Purification processes with purified product of different purities as well as the corresponding fresh hydrogen savings can be identified without divisions.More importantly,the proposed procedure is straightforward and non-iterative,making it easy to apply and understand.
2.Model of Purification Process
Common purification processes include pressure swing adsorption(PSA),membrane separation and cryogenic separation[12].Although these processes rely on different principles and operations,they can be modeled to separate a hydrogen stream(the feed with Finand Cin)into two streams(purified product with Fpurand Cpurand tail gas with Ftailand Ctail),as shown in Fig.1.The mass balance of a purification process can be described as[21].


Fig.1.Purification process model.
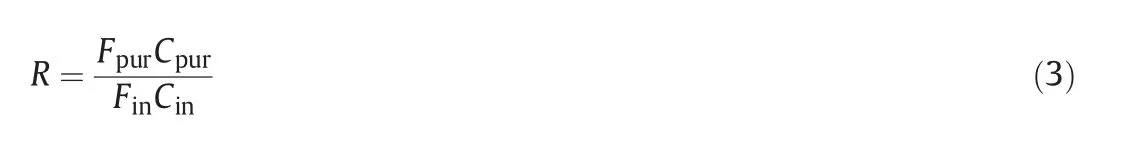
where F and C represent the flow rate and hydrogen concentration,respectively;subscripts in,pur and tail represent the feed,purified product and tail gas,respectively;R is the recovery ratio of hydrogen.
With specified Cpurand Ctail,Eqs.(1)and(2)can be represented in the hydrogen load versus flow rate diagram forany feed,asthe graphical rule shown in Fig.2.Afeed consisting ofseveralstreams can be regarded as a mixed stream,as shown by dash lines[20].
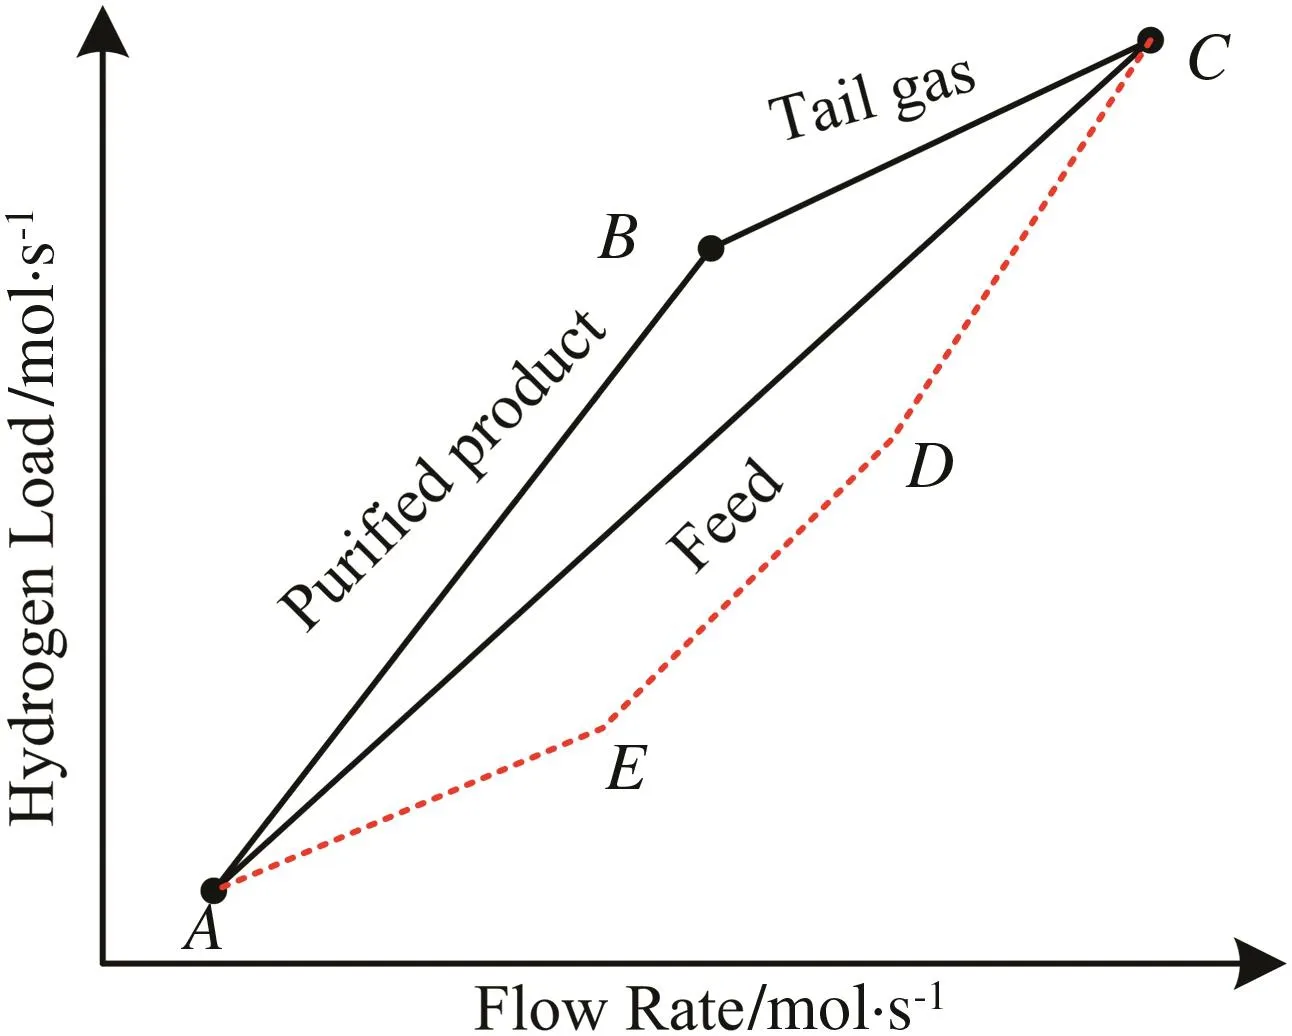
Fig.2.Graphical rule of purification process.
3.Targeting Procedure
The targeting procedure for a purification process(feed,purified product,and tail gas)and the fresh hydrogen saved by purification reuse can be separated to three parts:(1)identify the minimum fresh hydrogen consumption without purification reuse;(2)identify the fresh hydrogen saved by purification reuse;and(3)optimize the purification process.
3.1.Targeting of the minimum fresh hydrogen consumption without purification reuse[4]
Based on the hydrogen load versus flow rate diagram,Zhao et al.[4]proposed a graphical method for integration of a hydrogen network.Fig.3 illustrates the targeting procedure for the minimum fresh hydrogen consumption.First,each hydrogen source and sink is plotted as a segment in the diagram with its flow rate and hydrogen load.Note that segment of fresh hydrogen is plotted with its maximum flow rate.Second,construct the source composite curve by connecting all segments of sources in the decreasing order of hydrogen concentration,and construct the sink composite curve by the same way.Third,move the source composite curve to intersect the sink composite curve at their top points.Finally,move the part of source composite curve below fresh hydrogen upwards in the decreasing direction of fresh hydrogen until the source composite curve intersects and lies below the sink composite curve.The intersection is the pinch of this hydrogen network.With the identified pinch,the minimum fresh hydrogen consumption and waste discharge can be determined.
3.2.Targeting of the fresh hydrogen saved by purification reuse
In most re fineries,purifiers are used in hydrogen networks to save fresh hydrogen.Based on the graphical representation in Fig.2,the maximum fresh hydrogen saved by purification reuse can be determined by a unified targeting procedure for any specified Cpurand Ctailas follows:
(1)Choose hydrogen source(s)as the feed of purifier and then determine the purified product and tail gas with specified Cpurand Ctailby the graphical rule in Fig.2.For example,in Fig.4,SR5and SR6are taken as the feed of purifier.
(2)Re-rank all hydrogen sources including the purified product and tail gas in the decreasing order of hydrogen concentration.Then construct the new hydrogen source composite curve.
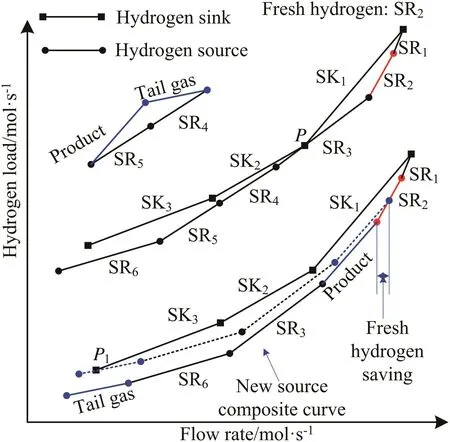
Fig.4.Targeting of the maximum fresh hydrogen saving.
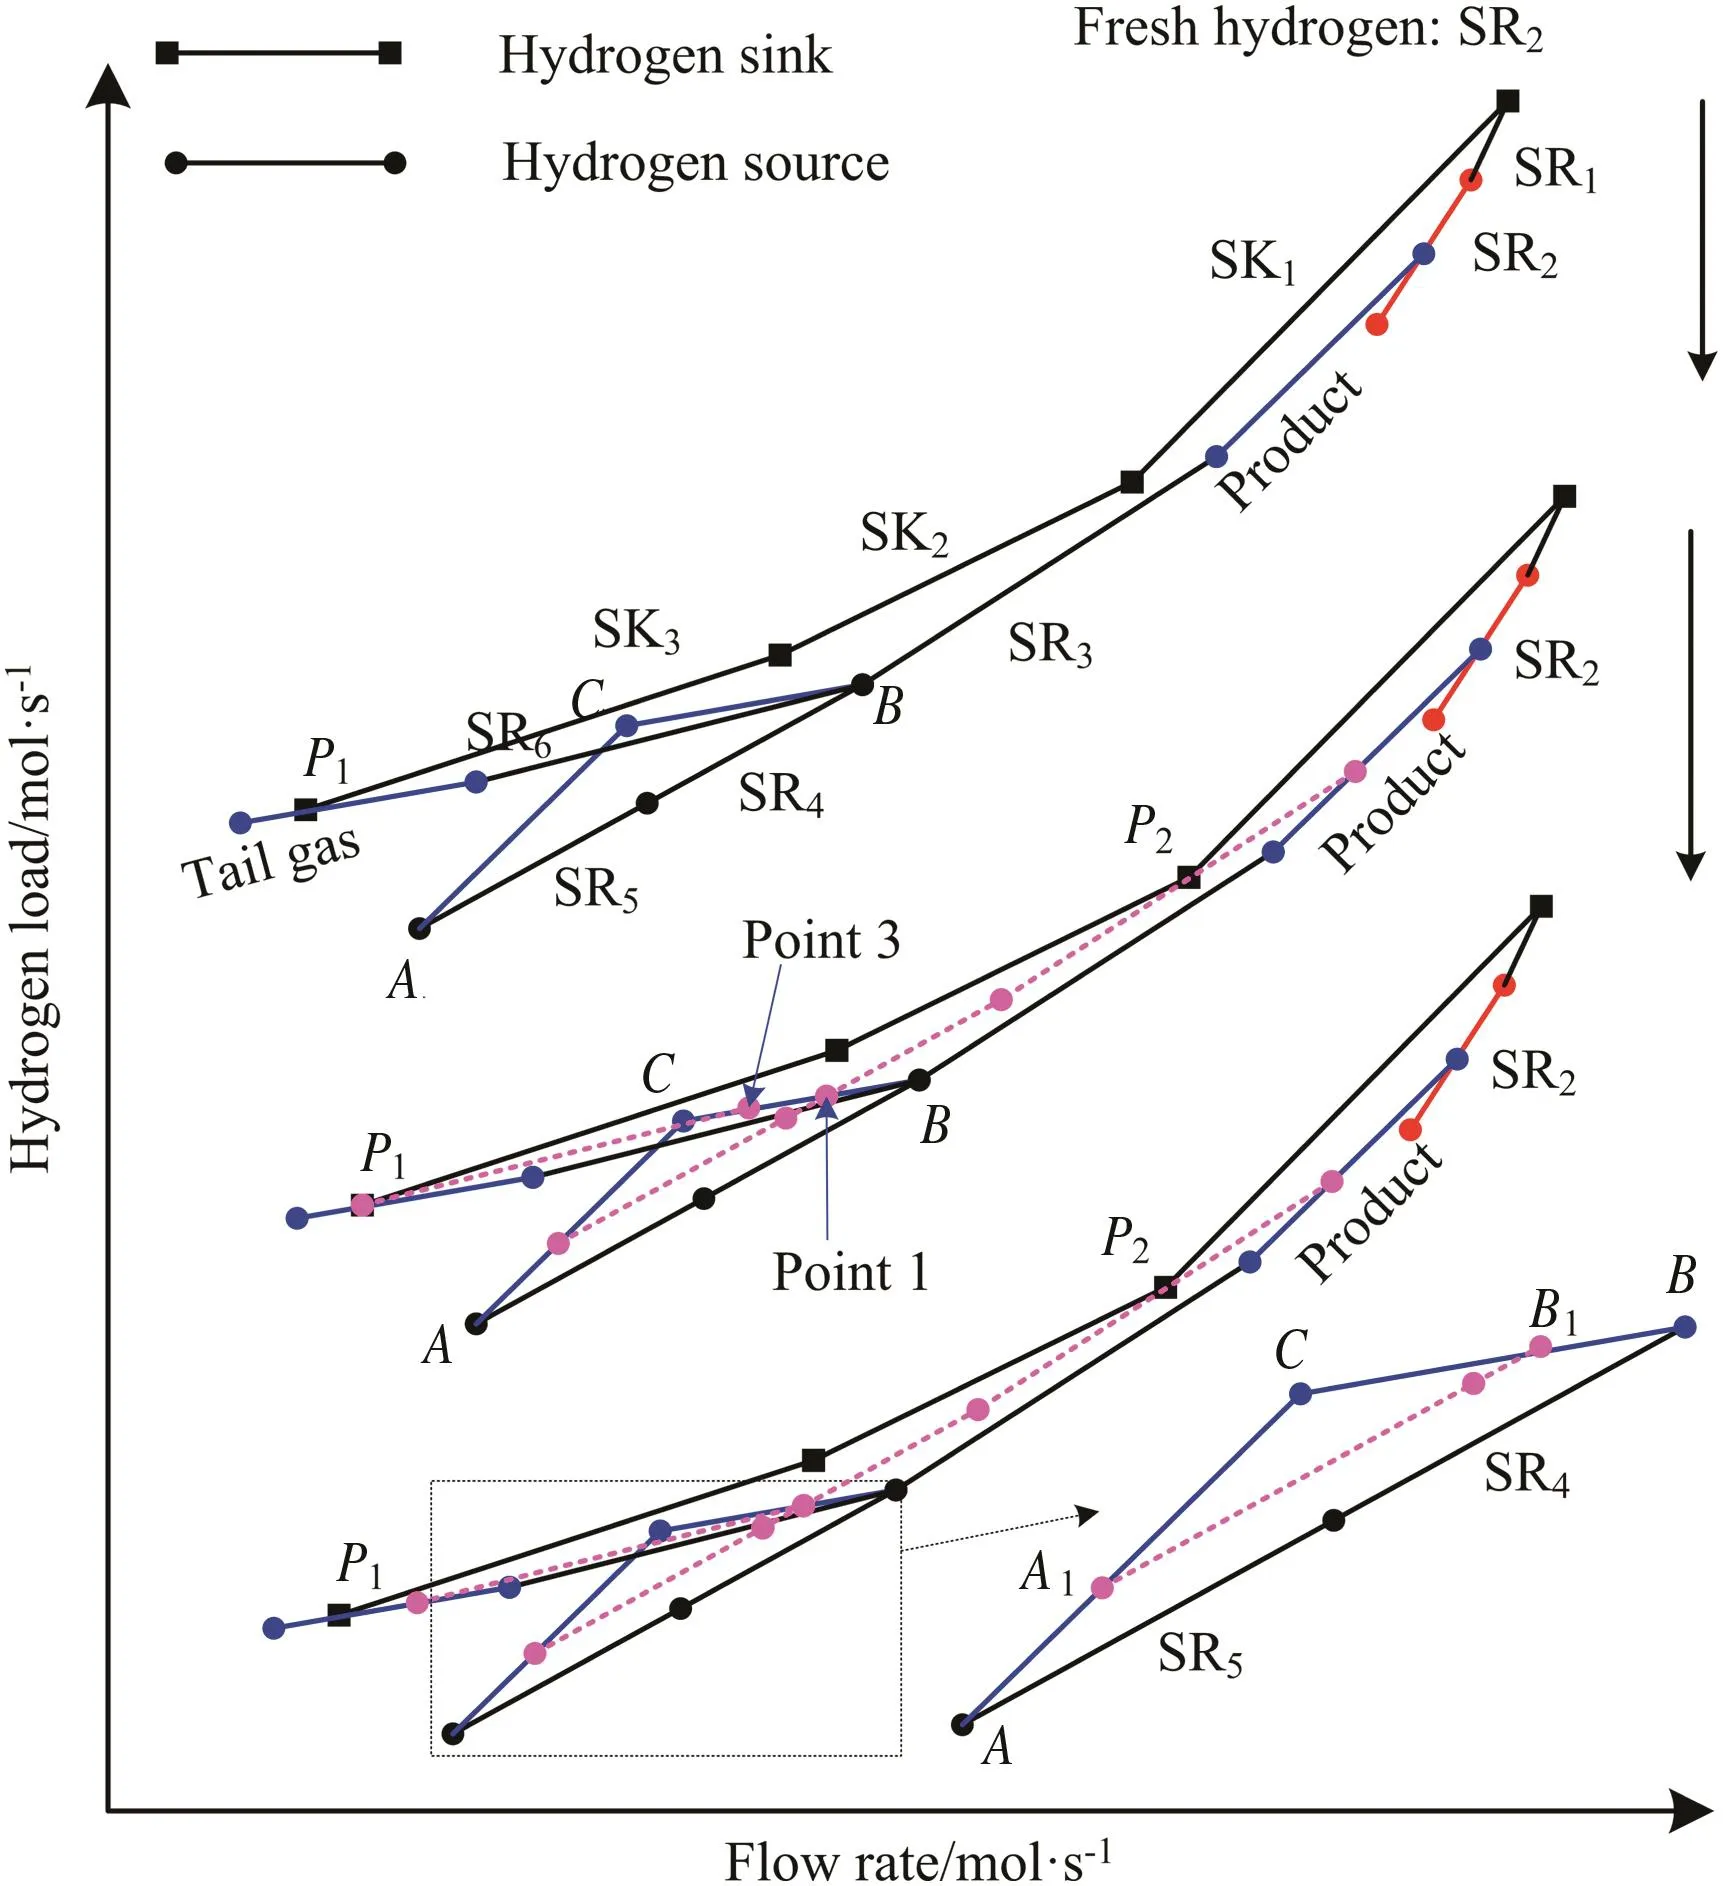
Fig.5.Optimization of purification process.

Table 1 Hydrogen data for case study[21]
(3)Identify the new pinch by the targeting procedure in Section 3.1.As shown in Fig.4,P1is identified as the new pinch of this hydrogen network.
With the new pinch identified,the maximum fresh hydrogen saved by purification reuse is determined,as shown in Fig.4.Allofthe purified product is reused by hydrogen sinks.As a result,the consumption of fresh hydrogen is reduced.
3.3.Optimization of purification process
Generally,the cost of purification increases proportionally with the flow rate of feed entering the purification process[27].Based on the initial purification process in Section 3.2,the flow rate of feed is optimized to give a better process with the maximum fresh hydrogen saving unchanged.
Fig.5 shows a hydrogen network with a purification process.For convenience,taking the feed as reference,the hydrogen source composite curve can be divided into three parts:Curve 1 locates between purified product and feed,such as SR3;Curve 2 is the feed,such as SR4and SR5;Curve 3 locates below Curve 1,such as SR6.On this base,the purification process can be identified by the following procedures:
(1)Move Curves 1 and 2 in the decreasing direction of purified product until Curve 1 intersects the sink composite curve at one point while lying below the sink composite curve.During such moving procedure,Curve 1 increases and Curve 2(feed)decreases,while the fresh hydrogen saving is constant,as shown in Fig.5.These moved curves are represented by dash curves.
(2)Similarly,move Curve 3 in the decreasing direction of tail gas until Curve 3 intersects the sink composite curve at one point while lying below the sink composite curve,as shown in Fig.5.
(3)Name the lower end of Curve 1 as Point 1 and the top of Curve 3 as Point 3,both being on segment BC.To make the final hydrogen network feasible,if Point 3 locates at the left side of Point 1,move Curve 3 in the increasing direction of tail gas(along BC)to intersect Curve 1 at Point 1,as shown in Fig.5;if Point 1 locates at the left side of Point 3,move Curve 1 in the increasing direction of purified product(along AC)to intersect Curve 3 at Point 3.

Fig.6.Flow sheet of a hydrogen network[21].

Fig.7.Targeting of the minimum fresh hydrogen(case study).
Finally,the new source composite curve,as well as the optimized purification process is determined as shown in Fig.5.Besides,another pinch P2occurs.As a result,the feed of purification process is reduced from AB to A1B1,and corresponding purified product and tail gas decrease as well,from AC to A1C and BC to B1C.On this base,if the flow rate of feed is reduced further,the consumption of fresh hydrogen will increase.
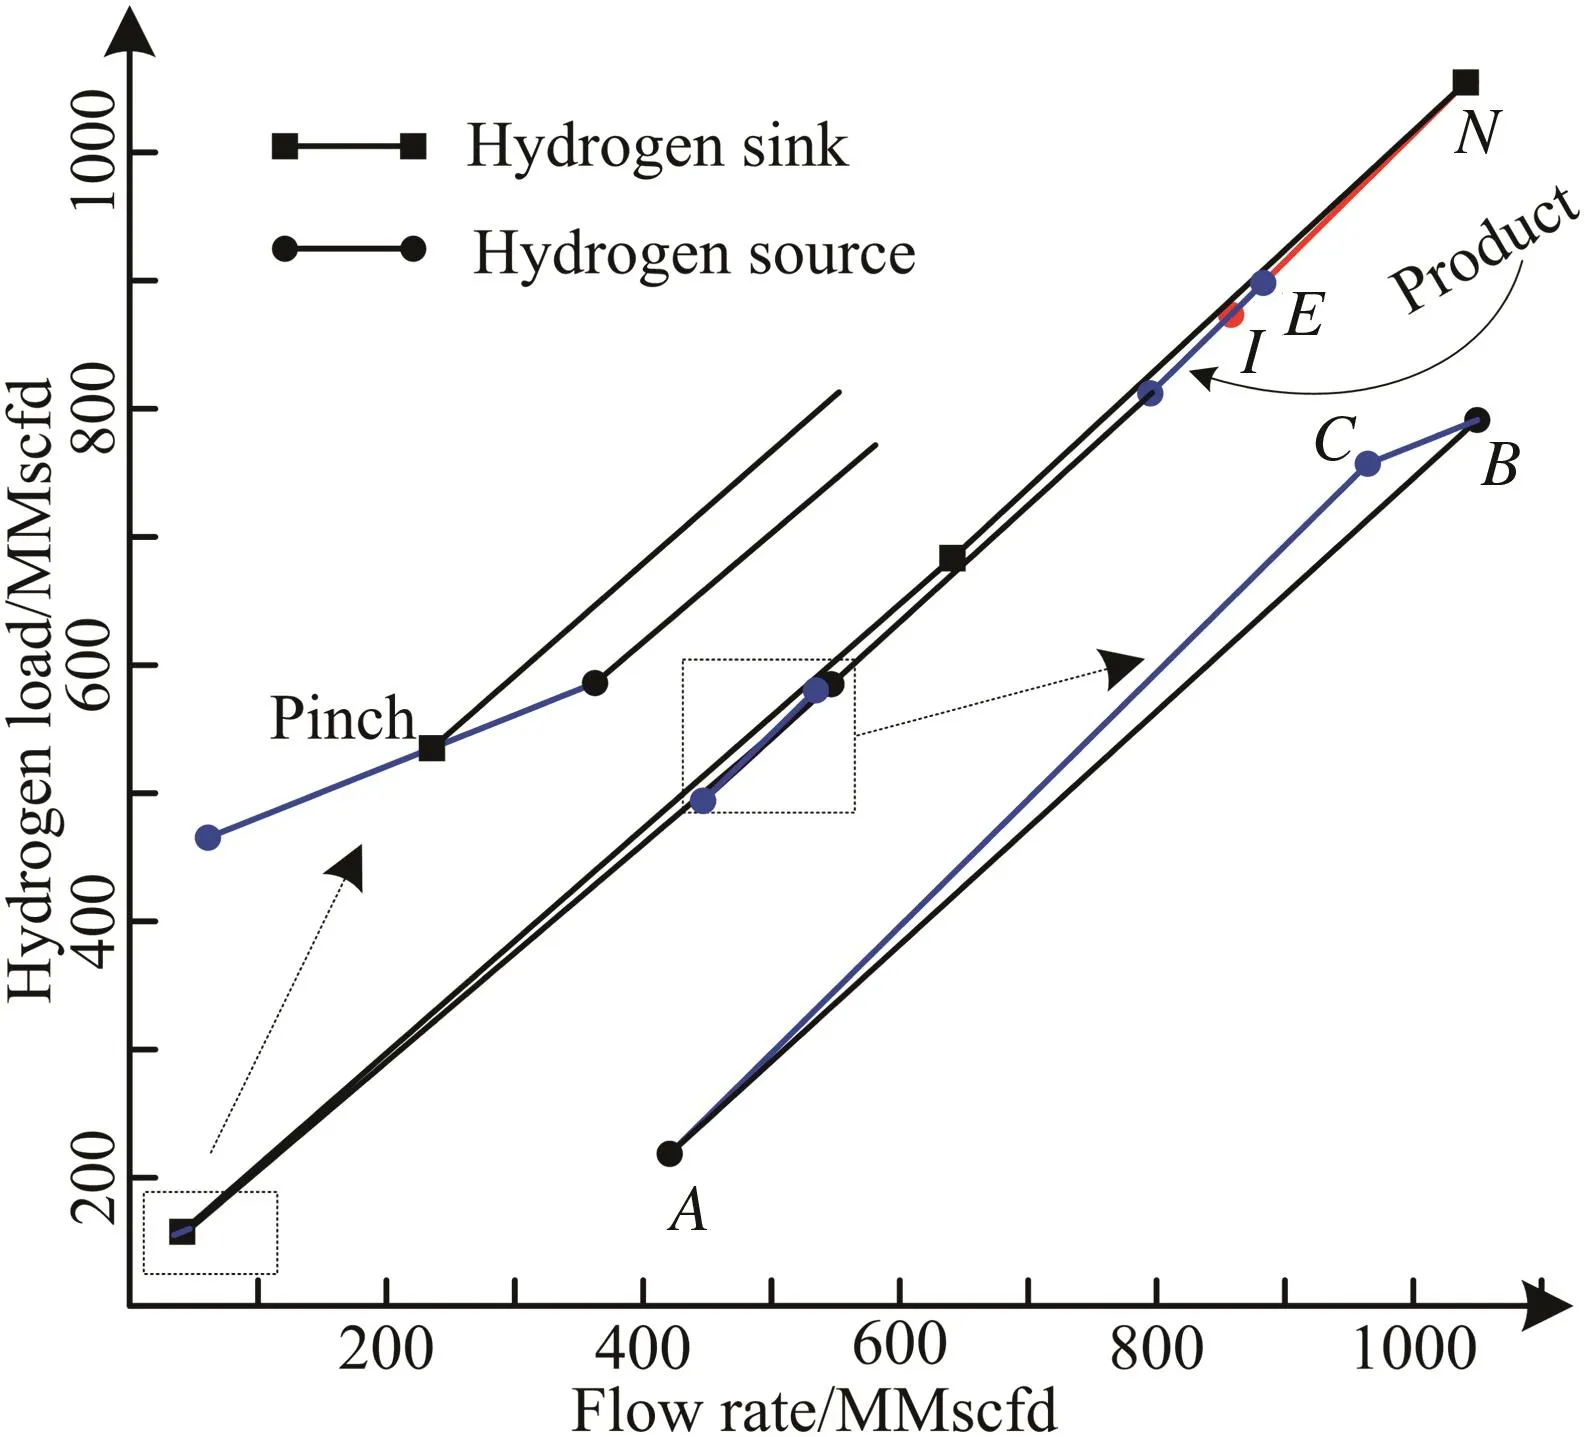
Fig.8.Targeting of the fresh hydrogen saving(case 1).
4.Case Study
Table 1 shows the data extracted from the hydrogen network in Fig.6[21].By the method ofZhao etal.[4],the minimum fresh hydrogen consumption is identified as segment NI of 182.86 MMscfd,as shown in Fig.7.The waste discharge is identified as 32.86 MMscfd.Such results are the same as that obtained by Agrawal and Shenoy[21].
4.1.Case 1
Hydrogen purification is achieved by a PSA process with specified Cpur=0.98(lower than Cfreshof 0.99)and Ctail=0.4.Assuming that 100 MMscfd of SR2is taken as the feed of PSA,the corresponding fresh hydrogen saving can be determined as segment IE of 25.06 MMscfd by the proposed procedure in Section 3.2.As a result,the fresh hydrogen consumption decreases from 182.86 MMscfd to 157.80 MMscfd,as shown in Fig.8.
Next,the purification process is optimized to minimize its flow rate of feed with the fresh hydrogen saving unchanged.Following the procedure in Section 3.3,the flow rate of feed can be targeted as segment A1B1of 64.60 MMscfd,as shown in Fig.9.The flow rates of purified product and tail gas are 56.80 MMscfd and 7.80 MMscfd,respectively.The hydrogen network with the PSA process is designed in Fig.10.
4.2.Case 2
Hydrogen purification is achieved by another PSAprocess with specified Cpur=0.995(higher than Cfreshof 0.99)and Ctail=0.4.Similarly,SR2is taken as the feed with a flow rate of 100 MMscfd.By the method proposed in Section 3.2,the fresh hydrogen saving can be identified as segment IE of 25.06 MMscfd,as shown in Fig.11.As a result,the fresh hydrogen is reduced from 182.86 MMscfd to 157.80 MMscfd.Next,the purification process is optimized to reduce the flow rate of feed by the procedure in Section 3.3.The minimum flow rate offeed is identified as A1B1of 54.58 MMscfd,as shown in Fig.12.The flow rates of purified product and tail gas are identified as 46.78 MMscfd and 7.80 MMscfd,respectively.The hydrogen network with the PSA process is designed in Fig.13.

Fig.9.Optimization of purification process(case 1).
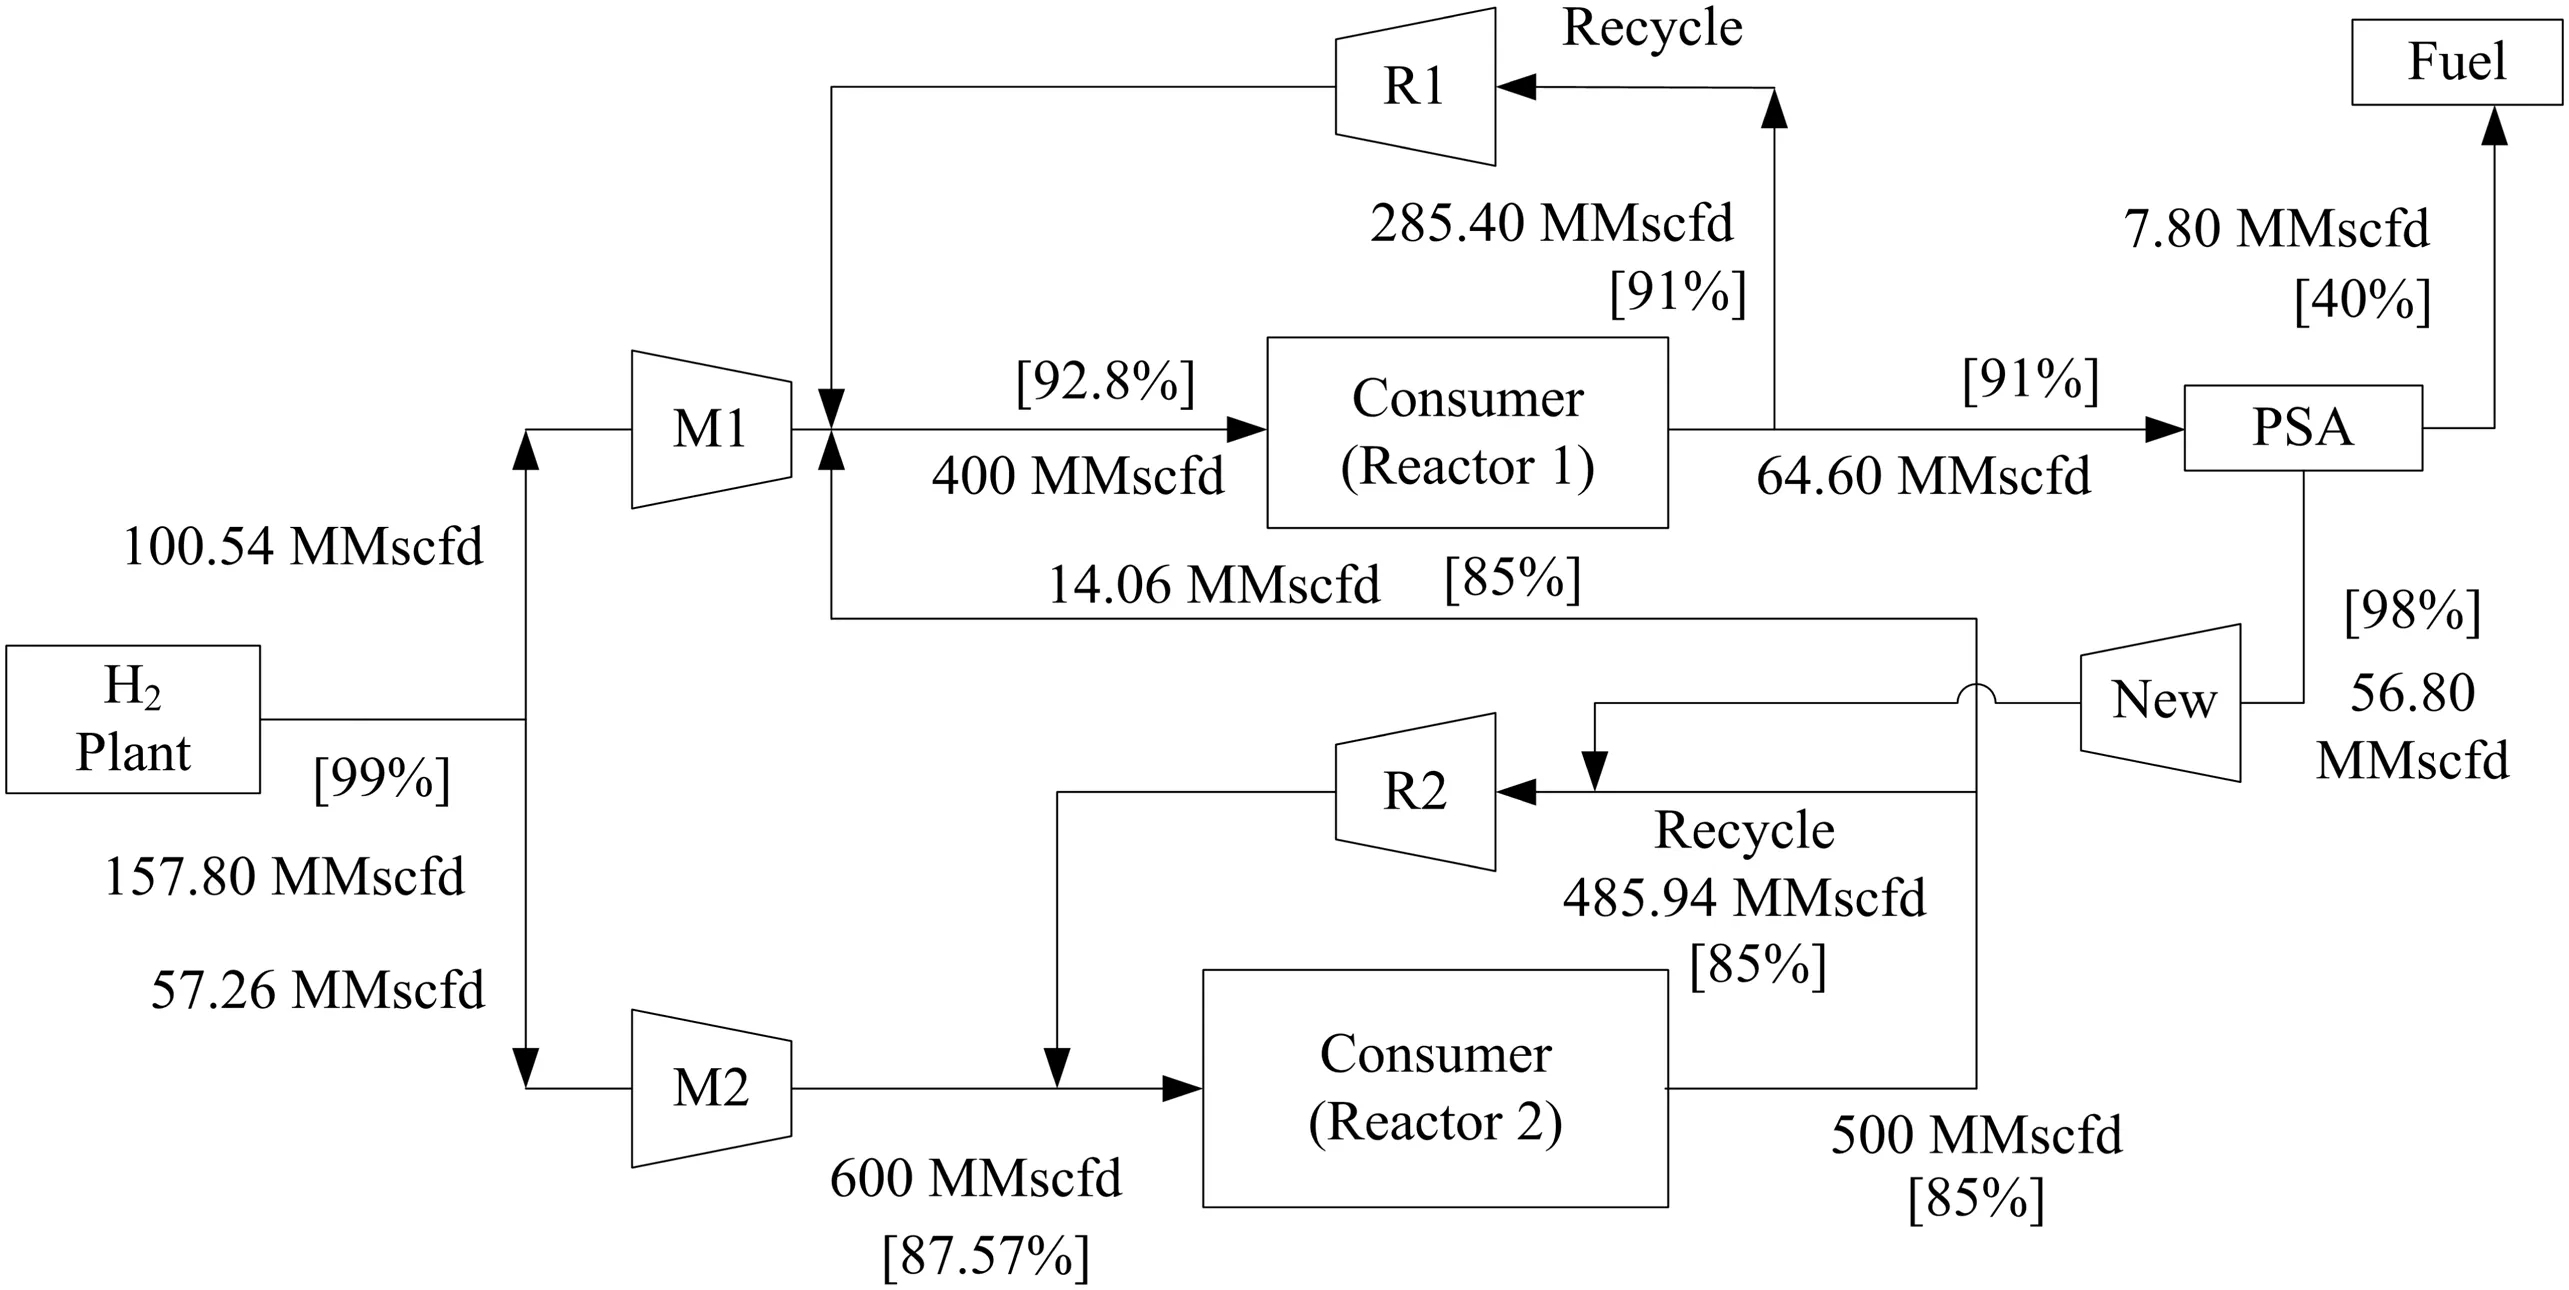
Fig.10.Hydrogen network with PSA process(case 1).
From all above,scenarios with different purities of purified product(Cpur=0.98 and Cpur=0.995)can be analyzed and targeted by the unified method proposed.Furthermore,the targeting procedure is noniterative.Thus,this method is easier and more efficient than previous ones[20,23,24].For Ctail=0.4,25.06 MMscfd of fresh hydrogen is saved by purification reuse.This result agrees with that calculated by the method of Yang et al.[24].
5.Conclusions
A unified graphical method is proposed for integration of hydrogen networks with purification reuse,targeting the maximum fresh hydrogen saved by purification process and optimizing the corresponding purification process.The procedure has clear conceptions and no iteration.Scenarios with different purities of purified product can be analyzed by the unified procedure,so this method is simpler and easier for applications and understanding than the existing ones[20,23,24].A case study illustrates the ease and effectiveness of the proposed method.However,the proposed method can only analyze the purification process with given feed and specified Cpurand Ctail,with the capital cost and operating cost ignored.These factors also affect the hydrogen network integration with purification reuse and will be studied in the future work.

Fig.11.Targeting of the fresh hydrogen saving(case 2).
Nomenclature
师:同学们,这节课老师和大家一起复习了相似的性质、判定和应用,在复习过程中我们梳理了知识,小结方法,提炼了策略,这三者合起来就形成我们的解题能力.当然能力永远是第二位的,那么第一位是什么呢?那是“意识”,就是我们要“想到用”相似来解题,“意识”让我们“想到用”,能力让我们“会用”,如何才能“用好”“用巧”?这就要求我们站在一定的高度,掌握一定的数学思想,关于这一点我们同学也许不太理解.下面我来解决这个问题,同学们“今天这节课老师主要和大家探讨了几个题目?”
Cfreshhydrogen mole concentration of fresh hydrogen,%
Cinhydrogen mole concentration of feed,%
Cpurhydrogen mole concentration of purified product,%
Ctailhydrogen mole concentration of tail gas,%
Finflow rate of feed,mol·s−1
Fpurflow rate of purified product,mol·s−1
Ftailflow rate of tail gas,mol·s−1
R recovery ratio of hydrogen

Fig.12.Optimization of purification process(case 2).
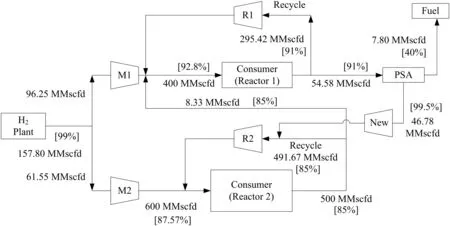
Fig.13.Hydrogen network with PSA process(case 2).
[1]H.Wake,Oil re fineries:A review of their ecological impacts on the aquatic environment,Estuarine Coastal SheflSci.62(1)(2005)131–140.
[2]G.P.Towler,R.Mann,A.J.Serriere,C.M.Gabaude,Refinery hydrogen management:Cost analysis of chemically-integrated facilities,Ind.Eng.Chem.Res.35(7)(1996)2378–2388.
[3]P.P.Oh,G.P.Rangaiah,A.K.Ray,Simulation and multiobjective optimization of an industrial hydrogen plant based on re finery off-gas,Ind.Eng.Chem.Res.41(9)(2002)2248–2261.
[4]Z.Zhao,G.Liu,X.Feng,New graphical method for the integration of hydrogen distribution systems,Ind.Eng.Chem.Res.45(19)(2006)6512–6517.
[5]M.El-Halwagi,F.Gabriel,D.Harell,Rigorous graphical targeting for resource conservation via material recycle/reuse networks,Ind.Eng.Chem.Res.42(19)(2003)4319–4328.
[6]J.J.Alves,G.P.Towler,Analysis of re finery hydrogen distribution systems,Ind.Eng.Chem.Res.41(23)(2002)5759–5769.
[7]J.L.Borges,F.L.Pessoa,E.M.Queiroz,Hydrogen source diagram:A procedure for minimization of hydrogen demand in petroleum re fineries,Ind.Eng.Chem.Res.51(39)(2012)12877–12885.
[8]D.C.Y.Foo,Z.A.Manan,Setting the minimum utility gas flowrate targets using cascade analysis technique,Ind.Eng.Chem.Res.45(17)(2006)5986–5995.
[9]A.M.Almutlaq,V.Kazantzi,M.M.El-Halwagi,An algebraic approach to targeting waste discharge and impure fresh usage via material recycle/reuse networks,Clean Technol.Environ.7(4)(2005)294–305.
[10]S.Wu,G.Liu,Z.Yu,X.Feng,Y.Liu,C.Deng,Optimization of hydrogen networks with constraints on hydrogen concentration and pure hydrogen load considered,Chem.Eng.Res.Des.90(9)(2012)1208–1220.
[11]C.Deng,H.M.Pan,J.Y.Lee,D.C.Y.Foo,X.Feng,Synthesis of hydrogen network with hydrogen header of intermediate purity,Int.J.Hydrog.Energy 39(25)(2014)13049–13062.
[12]F.Liu,N.Zhang,Strategy of purifier selection and integration in hydrogen networks,Chem.Eng.Res.Des.82(10)(2004)1315–1330.
[13]D.Zhang,A.Kodama,M.Goto,T.Hirose,Recovery of trace hydrogen by cryogenic adsorption,Sep.Purif.Technol.35(2)(2004)105–112.
[14]G.Lu,J.Diniz da Costa,M.Duke,S.Giessler,R.Socolow,R.Williams,T.Kreutz,Inorganic membranes for hydrogen production and purification:A critical review and perspective,J.Colloid Interface Sci.314(2)(2007)589–603.
[15]A.M.Ribeiro,C.A.Grande,F.V.Lopes,J.M.Loureiro,A.E.Rodrigues,A parametric study of layered bed PSA for hydrogen purification,Chem.Eng.Sci.63(21)(2008)5258–5273.
[16]Z.Liao,J.Wang,Y.Yang,G.Rong,Integrating purifiers in re finery hydrogen networks:A retro fit case study,J.Clean.Prod.18(3)(2010)233–241.
[17]G.Liu,H.Li,X.Feng,C.Deng,K.H.Chu,A conceptual method for targeting the maximum purification feed flow rate of hydrogen network,Chem.Eng.Sci.88(2013)33–47.
[18]G.Liu,H.Li,X.Feng,C.Deng,Pinch location of the hydrogen network with purification reuse,Chin.J.Chem.Eng.21(12)(2013)1332–1340.
[19]G.Liu,H.Li,X.Feng,C.Deng,Novel method for targeting the optimal purification feed flow rate of hydrogen network with purification reuse/recycle,AICHE J.59(6)(2013)1964–1980.
[20]Q.Zhang,X.Feng,G.Liu,K.H.Chu,A novel graphical method for the integration of hydrogen distribution systems with purification reuse,Chem.Eng.Sci.66(4)(2011)797–809.
[21]V.Agrawal,U.V.Shenoy,Unified conceptual approach to targeting and design of water and hydrogen networks,AICHE J.52(3)(2006)1071–1082.
[22]Q.Zhang,G.L.Liu,X.Feng,K.H.Chu,C.Deng,Hydrogen networks synthesis considering separation performance of purifiers,Int.J.Hydrog.Energy 39(16)(2014)8357–8373.
[23]J.Lou,Z.Liao,B.Jiang,J.Wang,Y.Yang,Pinch sliding approach for targeting hydrogen and water networks with different types of purifier,Ind.Eng.Chem.Res.52(25)(2013)8538–8549.
[24]M.Yang,X.Feng,K.Chu,G.Liu,Graphical method for integrating purification processes in hydrogen systems with constraints of flow rate and concentration,Ind.Eng.Chem.Res.53(8)(2014)3246–3256.
[25]M.Yang,X.Feng,Change rules of pinch point for hydrogen distribution systems with purification reuse,CIESC J.64(12)(2013)4544–4549.
[26]M.Yang,X.Feng,K.H.Chu,G.Liu,Graphical method for identifying the optimal purification process of hydrogen systems,Energy 73(2014)829–837.
[27]D.K.S.Ng,D.C.Y.Foo,R.R.Tan,Automated targeting technique for single-impurity resource conservation networks.Part 2:Single-pass and partitioning wasteinterception systems,Ind.Eng.Chem.Res.48(16)(2009)7647–7661.
猜你喜欢
小学生学习指导(低年级)(2022年9期)2022-10-08
中学生数理化·中考版(2022年8期)2022-06-14
小学生学习指导(低年级)(2021年4期)2021-07-21
文苑(2020年7期)2020-08-12
宁夏医学杂志(2020年3期)2020-02-27
中学生数理化·八年级数学人教版(2019年11期)2019-09-10
小学生必读(中年级版)(2019年10期)2019-03-24
速读·下旬(2017年7期)2017-08-03
人间(2016年28期)2016-11-10
中学生数理化·八年级数学人教版(2016年3期)2016-04-13
 Chinese Journal of Chemical Engineering2016年7期
- Chinese Journal of Chemical Engineering的其它文章
- Vanadium oxide nanotubes for selective catalytic reduction of NO x with NH3
- Optimal design for split-and-recombine-type flow distributors of microreactors based on blockage detection☆
- Theoreticalpredictions ofviscosity ofmethane under confined conditions☆
- Permeabilization of Escherichia coli with ampicillin for a whole cell biocatalyst with enhanced glutamate decarboxylase activity☆
- Formation of crystalline particles from phase change emulsion:In fluence of different parameters
- The effect of SiO2 particle size on iron based F–T synthesis catalysts