基于肌酐和胱抑素C的肾小球滤过率评估公式判断2型糖尿病肾病患者的预后
潘 瑜 蒋 松 邱丹丹 施劲松 周敏林 安 玉 葛永纯 谢红浪 刘志红
基于肌酐和胱抑素C的肾小球滤过率评估公式判断2型糖尿病肾病患者的预后
潘 瑜 蒋 松 邱丹丹 施劲松 周敏林 安 玉 葛永纯 谢红浪 刘志红
目的:比较三种肾小球滤过率(GFR)计算方法(eGFRcre、eGFRcys与eGFRcre-cys)评价2型糖尿病肾病(T2DN)患者肾功能的准确性及判断预后的临床价值。 方法:纳入随访登记数据库中T2DN患者501例,通过横断面分析,比较0、12、24月时用eGFRcre、eGFRcys与eGFRcre-cys公式计算得到eGFR的分布及偏移状态,并随访观察12月和24月时不同eGFR下降幅度(20%、30%、40%和57%)对判断患者肾脏终点事件的敏感性和特异性。 结果:将eGFRcre-cys设为参考,eGFRcre公式会高估GFR水平,在eGFRcre-cys>120 ml/(min·1.73m2),90~120 ml/(min·1.73m2),60~89 ml/(min·1.73m2),30~59 ml/(min·1.73m2),<30 ml/(min·1.73m2)的T2DN患者中,中位偏移分别为-0.21 ml/(min·1.73m2),6.17 ml/(min·1.73m2),12.69 ml/(min·1.73m2),9.55 ml/(min·1.73m2),5.27 ml/(min·1.73m2)。低龄、高收缩压、低体质指数(BMI)和高血糖增加偏移度。基于eGFRcre-cys公式24月的GFR下降速率较eGFRcre和eGFRcys公式更好的判断肾脏终点,曲线下面积(ROC)分别为0.857±0.029 7,0.839±0.031 9和0.796±0.035 7。24月的eGFRcre-cys下降速率联合基线eGFRcre-cys的GFR水平可有效判断肾脏预后,ROC达0.917±0.017 8。基线eGFRcre-cys≥90 ml/(min·1.73m2)的患者,以eGFRcre-cys 24月下降57%作为判断指标,敏感性和特异性均为100%;基线eGFRcre-cys<90 ml/(min·1.73m2)的患者,以 eGFRcre-cys 24月下降40%作为判断预后指标,其准确性更好。 结论:eGFRcre公式可能高估T2DN患者的GFR,尤其在eGFR 60~120 ml/(min·1.73m2)的患者。以eGFRcre-cys公式计算的24月GFR下降57%和40%分别用于判断基线eGFRcre-cys≥90 ml/(min·1.73m2)和<90 ml/(min·1.73m2)的T2DN患者肾脏预后的敏感度和特异度较好。
胱抑素C 肾小球滤过率 糖尿病肾病 CKD-EPI公式 预后
2型糖尿病是导致终末期肾病(ESRD)的主要原因之一,准确评估肾功能有利于判断疾病进展和调整用药。采用外源性示踪剂(如菊粉或碘海醇等)检测的肾小球滤过率(mGFR)可准确评估患者的GFR,但其价格昂贵,操作复杂并不合适临床使用;而根据内源性指标如肌酐(SCr)和胱抑素C(Cys C)计算的GFR(eGFR)简单易行,易被临床所接受。2012年,美国慢性肾脏病流行病合作工作组(CKD-EPI)在基于肌酐的(eGFRcre)和胱抑素C的(eGFRcys)eGFR公式的基础上推出了联合肌酐和胱抑素C两个指标的eGFRcre-cys公式,并被国际肾脏病学会改善肾脏病整体预后工作组(KDIQO)指南推荐为估算GFR的确认公式[1-3]。目前已有研究报道,eGFRcre-cys公式较eGFRcre和eGFRcys更加接近mGFR,且在慢性肾脏病(CKD)[4]、老年[5]、1型糖尿病肾病[6]及肾移植[7]患者中得到证实。由于2型糖尿病肾病(T2DN)病情复杂[8],相关研究甚少[9-10],其在T2DN患者中是否同样适用尚无定论。本文采用观察性队列研究,通过横断面分析,比较eGFRcre、eGFRcys与eGFRcre-cys公式计算得到eGFR下降速率预测T2DN患者肾脏终点事件的敏感度和特异度。
对象和方法
研究对象 从南京军区南京总医院肾脏科随访登记数据库中筛选出501例T2DN患者进行研究(图1)。

图1 研究流程图CysC:胱抑素C;ESRD:终末期肾病;eGFR:估算的肾小球滤过率
诊断标准 (1)年龄18~72岁;(2)2型糖尿病患者,且持续尿白蛋白定量≥30 mg/24h和(或)估计的肾小球滤过率(eGFR)<60 ml/(min·1.73m2),或经过肾活检诊断糖尿病肾病(DN)。排除标准:(1)合并其他肾脏疾病(如IgA肾病、膜性肾病等);(2)有肿瘤和肝脏疾病史。
临床资料 包括性别、年龄、糖尿病病程、入组时血压、空腹血糖、糖化血红蛋白(HbA1c)、体质量指数(BMI)等。
本文采用Jaffe’s kinetic法检测SCr,血Cys采用德国贝林Nephelometer Ⅱ (Dade-Behring Diagnostic, Germany)仪器,免疫比浊法测定空腹静脉Cys C浓度。根据文献报道的方法计算估算的肾小球滤过率[1]。
肾脏终点 进入ESRD[定义为eGFRcre-cys<15 ml/(min·1.73m2)或进入维持性透析治疗]。
统计学方法 采用Stata/SE software 12 (Stata Corp) 软件进行数据统计,采用RStudio(0.99.486)和GraphPad Prism 6 软件进行绘图。正态分布连续变量以均数±标准差表示,组间比较采用ANOVA进行比较。非参数以中位数(四分位间距)表示,组间采用Kruskal-Wallis检验;分类变量以率表示,采用卡方检验。偏移计算采用eGFRcre-cys-eGFRcys和eGFRcre-cys-eGFRcre的差值。分别对年龄、BMI、收缩压、空腹血糖进行亚组分析。偏移用中位数(95%可信区间)表示。12、24月eGFR下降速率=(基线eGFR-12、24月eGFR)/基线eGFR×100%。ROC曲线用于计算eGFR下降速率预测肾脏终点事件。Logist回归方程用于计算eGFR下降速率联合基线eGFR的预测值。P<0.05差异有统计学意义,P<0.01为统计学差异显著。
结 果
三种方法计算eGFR在不同水平的分布 不同计算方法得到的eGFR分布差异明显(图2A),将eGFRcre-cys作为参考, eGFRcre公式得到eGFR出现明显右偏,尤其是eGFR波动于30~120 ml/(min·1.73m2)(图2B)。分别计算eGFRcre和eGFRcys在不同eGFR水平的偏移度,发现eGFRcre在>120 ml/(min·1.73m2),90~120ml/(min·1.73m2),60~89 ml/(min·1.73m2),30~59 ml/(min·1.73m2),<30 ml/(min·1.73m2)患者的中位偏移分别为-0.21(95%CI 4.42~-2.51)、6.17(95%CI 7.35~4.78)、12.69(95%CI 15.37~12.34)、9.53(95%CI 11.12~9.16)和5.27(95%CI 6.74~4.47)。而eGFRcys在>120、90~120、60~89、30~59、<30 ml/(min·1.73m2)患者的中位偏移为-11.00(95%CI -7.89~-14.21)、-7.36(95%CI -6.27~-8.07)、-9.55(95%CI -8.35~-10.66)、-5.78(95%CI -5.11~-6.48)和-2.19(95%CI -1.65~-3.11)(图3)。

图2 不同eGFR计算方法估算eGFR的分布A: 柱状图;B:密度图

图3 将eGFRcre-cys设为参考,eGFRcre与eGFRcys的偏移程度,根据年龄、收缩压、BMI、空腹血糖和基线eGFRcre-cys水平分层后eGFR的中位偏移(95%CI)BMI:体质量指数;eGFR:估算的肾小球滤过率
eGFRcre高估偏移的主要原因 进一步分析导致eGFRcre较eGFRcre-cys高估GFR的原因,对相关因素进行亚组分析发现,年龄<30岁、收缩压>160 mmHg、BMI<20 kg/m2及空腹血糖>10 mmol/L,增加了eGFR的高估偏移,中位偏移值分别为17.03(95%CI 10.72~20.58)、8.6336(95%CI 7.54~12.29)、10.38(95%CI 14.83~7.87)和9.41(95%CI 13.59~9.311 9)(图3)。而eGFRcys公式除了年龄<30岁,增加了低估偏移-10.52(95%CI -6.93~-14.23),受到其他因素影响较少。
eGFR下降速率对肾脏预后判断 我们首先比较了12、24月三个eGFR计算方式计算的下降率对肾脏终点事件的评判。结果显示,12月时eGFRcre-cys的eGFR下降速率的ROC面积高于eGFRcre和eGFRcys。24月eGFRcre-cys的eGFR下降速率的ROC面积较eGFRcre的增加(P<0.05),但与eGFRcys 的ROC无明显差异,且较12月时三个计算方法的eGFR下降速率ROC面积增加。该结果提示eGFRcre-cys较eGFRcre和eGFRcys可以更好判断肾脏预后。随后我们比较了基线eGFR联合eGFR下降速率对长期肾脏预后评判。结果提示基线eGFRcre-cys水平联合eGFRcre-cys下降速率具有更好评价肾脏预后功能(表1)。

表1 12、24月时eGFR下降预测肾脏终点的曲线下面积(ROC)
a:与ΔeGFRcre-cys组比较,ROC配对检验;b:Y=0.803-0.069×基线eGFR+0.078×eGFR下降速率;c:Y=0.766-0.088×基线eGFR+0.069×eGFR下降速率;d:Y=0.610-0.081×基线eGFR+0.078×eGFR下降速率
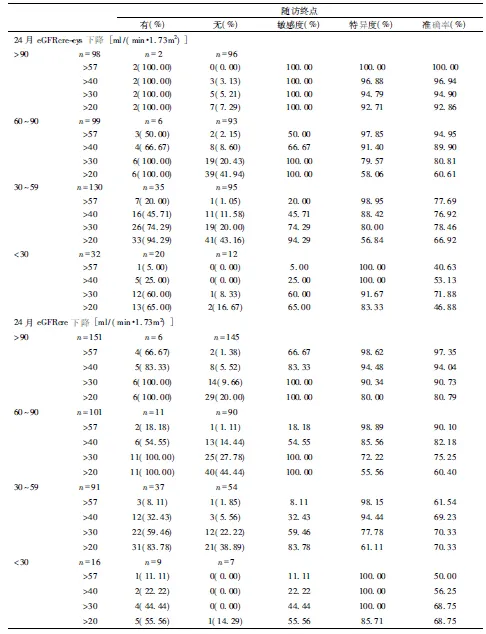
进一步根据基线eGFR分层,结果显示采用eGFRcre-cys公式,在基线eGFRcre-cys≥90 ml/(min·1.73m2)的T2DN患者中,24月下降57%具有最高的准确性100%,在基线eGFRcre-cys 60~90 ml/(min·1.73m2),30~59 ml/(min·1.73m2),<30 ml/(min·1.73m2)的T2DN患者中,24月下降40%具有更好的敏感度和特异度。且值得注意的是,24月下降40%作为替代终点假阳性错误(1类错误)较低。此外,若采用eGFRcre公式,在基线eGFRcre>60 ml/(min·1.73m2)的患者中,敏感度与特异度均降低(表2)。结果提示24月eGFRcre-cys的下降速率联合基线eGFRcre-cys可以准确的预测肾脏预后,eGFRcre-cys公式计算的24月下降57%和40%分别用于基线eGFRcre-cys≥90 ml/(min·1.73m2)和<90 ml/(min·1.73m2)具有良好的敏感度和特异度。
讨 论
本研究通过横断面和随访数据比较三个eGFR计算方法评估T2DN患者的基线水平肾功能和临床肾脏终点事件的预测价值。首先在基线eGFRcre-cys 90~120 ml/(min·1.73m2)、60~89 ml/(min·1.73m2)、30~59 ml/(min·1.73m2)水平时,eGFRcre出现了明显的GFR高估,而eGFR>120 ml/(min·1.73m2)或<30 ml/(min·1.73m2)的T2DN患者,偏移减小。该结果与之前1型DN的研究有部分类似[6],该研究认为三个计算公式在<90 ml/(min·1.73m2)倾向于高估了实际GFR,而≥130 ml/(min·1.73m2)可能低估实际GFR,且在总体上eGFRcre-cys更为接近mGRF。另外,该结果也在之前两项T2DN的研究中得到支持[9,11],然而,这两项研究并未对产生偏移的原因进行分析。
本研究对所有纳入患者进行年龄、BMI、收缩压和空腹血糖分层,发现年龄<30岁,收缩压升高,空腹血糖控制不良及低BMI均导致了eGFRcre高估偏移的增加。已有研究发现, BMI是导致eGFR产生偏移的主要因素之一[3]。也有研究报道通过高糖钳夹技术证实维持患者血糖在9~11 mmol/L,短时间可增加肾小球的滤过率[12]。而本文进一步发现年龄和收缩压也是影响eGFRcre产生偏移的因素,结果尚需进一步验证。但是eGFRcys公式相对平稳,受上述因素影响较小。增加的偏移可能将基线水平eGFR低的患者错分到eGFR高的组。
由于之前所有比较三个eGFR计算方法的研究均采用了实测GFR作为参照[4-6,9,11],且已经证实eGFRcyscre在精确性上优于其他公式。但是尚无研究将肾脏终点作为终点事件来进行研究。DN患者肾功能的快速下降如每年GFR下降>3 ml/(min·1.73m2)[13]或者5 ml/(min·1.73m2)[13-14]是发生ESRD的危险因素。因此,本研究分别观察三个计算方法计算得到下降速率对肾脏终点预测效力,结果亦发现eGFRcre-cys的下降速率联合基线水平的eGFRcre-cys具有良好的预测价值。

表2 根据基线eGFR分层,24月不同eGFR下降速率判断肾脏终点的敏感度和特异度
准确率(%)=(∑真阳性+∑真阴性)/∑样本
大型临床研究中多采用血清肌酐倍增(相当于eGFR下降57%)和进入ESRD作为主要肾脏终点事件[15],由于该终点事件发生率低,需要增加样本量和延长观察时间才能完成临床试验。近年来,研究者试图寻找新的替代肾脏终点事件如24月GFR下降30%或40%来预测肾脏终点[15-17]。然而T2DN的疾病较为复杂,如何取值存在争议[8,15-16,18]。且目前的研究均采用eGFRcre估算GFR,可能导致偏移增加,由此计算的eGFR下降速率预测肾脏终点事件增加了假阳性的发生[18]。本文分别比较了24月不同eGFR下降程度(20%,30%,40%,57%)预测肾脏终点事件的敏感度和特异度。结果提示eGFRcrecys在诊断准确性中优于其他公式,具有良好的敏感性和特异性,但值得一提的是,需根据基线eGFRcrecys分层采用不同的下降速率来进行预后评估。
小结:eGFRcre公式可能高估T2DN患者的GFR,尤其是eGFR 60~120 ml/(min·1.73m2)的患者。eGFRcre-cys公式计算的24月下降57%和40%分别用于基线eGFRcre-cys≥90 ml/(min·1.73m2)和<90 ml/(min·1.73m2)的患者具有良好的敏感度和特异度。
1 Inker LA,Schmid CH,Tighiouart H,et al.Estimating glomerular filtration rate from serum creatinine and cystatin C.N Engl J Med,2012,367(1):20-29.
2 Andrassy KM.Comments on ′KDIGO 2012 Clinical Practice Guideline for the Evaluation and Management of Chronic Kidney Disease′.Kidney Int,2013,84(3):622-623.
3 Fan L,Inker LA,Rossert J, et al.Glomerular filtration rate estimation using cystatin C alone or combined with creatinine as a confirmatory test.Nephrol Dial Transplant,2014,29(6):1195-1203.
4 Ye X,Liu X,Song D,et al.Estimating Glomerular Filtration Rate (GFR) by serum creatinine or/and cystatin c equations: an analysis of multi-center chinese subjects.Nephrology (Carlton),2015.
5 Fan L,Levey AS,Gudnason V,et al.Comparing GFR Estimating Equations Using Cystatin C and Creatinine in Elderly Individuals.J Am Soc Nephrol,2015,26(8):1982-1989.
6 de Boer IH,Sun W,Cleary PA,et al.Longitudinal changes in estimated and measured GFR in type 1 diabetes.J Am Soc Nephrol,2014,25(4):810-818.
7 Masson I,Maillard N,Tack I,et al.GFR estimation using standardized cystatin C in kidney transplant recipients.Am J Kidney Dis,2013,61(2):279-284.
8 Thompson A,Lawrence J,Stockbridge N.GFR decline as an end point in trials of CKD: a viewpoint from the FDA.Am J Kidney Dis,2014,64(6):836-837.
9 Wood AJ,Churilov L,Perera N,et al.Estimating glomerular filtration rate: Performance of the CKD-EPI equation over time in patients with type 2 diabetes.J Diabetes Complications,2016,30(1):49-54.
10 Bjornstad P,Cherney DZ,Maahs DM.Update on Estimation of Kidney Function in Diabetic Kidney Disease.Curr Diab Rep,2015,15(9):57.
11 MacIsaac RJ,Ekinci EI,Premaratne E,et al.The Chronic Kidney Disease-Epidemiology Collaboration (CKD-EPI) equation does not improve the underestimation of Glomerular Filtration Rate (GFR) in people with diabetes and preserved renal function.BMC Nephrol,2015,16:198.
12 Cherney DZ,Scholey JW,Sochett E, et al.The acute effect of clamped hyperglycemia on the urinary excretion of inflammatory cytokines/chemokines in uncomplicated type 1 diabetes: a pilot study.Diabetes Care,2011,34(1):177-180.
13 Bjornstad P,Cherney DZ,Snell-Bergeon JK,et al.Rapid GFR decline is associated with renal hyperfiltration and impaired GFR in adults with Type 1 diabetes.Nephrol Dial Transplant,2015,30(10):1706-1711.
14 Chapter 2: Definition,identification,and prediction of CKD progression.Kidney Int Suppl (2011),2013,3(1):63-72.
15 Coresh J,Turin TC,Matsushita K,et al.Decline in estimated glomerular filtration rate and subsequent risk of end-stage renal disease and mortality.JAMA,2014,311(24):2518-2531.
16 Lambers Heerspink HJ,Tighiouart H,Sang Y, et al.GFR decline and subsequent risk of established kidney outcomes: a meta-analysis of 37 randomized controlled trials.Am J Kidney Dis,2014,64(6):860-866.
17 Inker LA,Lambers Heerspink HJ,Mondal H, et al.GFR decline as an alternative end point to kidney failure in clinical trials: a meta-analysis of treatment effects from 37 randomized trials.Am J Kidney Dis,2014,64(6):848-859.
18 Greene T,Teng CC,Inker LA, et al.Utility and validity of estimated GFR-based surrogate time-to-event end points in CKD: a simulation study.Am J Kidney Dis,2014,64(6):867-879.
(本文编辑 心 平 律 舟 莫 非 凡 心)
Prediction of renal outcome by estimating GFR from a combination of serum creatinine and cystatin C in type 2 diabetic nephropathy
PANYu,JIANGSong,QIUDandan,SHIJingsong,ZHOUMinlin,ANYu,GEYongchun,XIEHonglang,LIUZhihong
NationalClinicalResearchCentreofKidneyDiseases,Jinlinghospital,NanjingUniversitySchoolofMedicine,Nanjing210016,China
LIUZhihong(E-mail:liuzhihong@nju.edu.cn)
Objective:To investigate estimated GFR from combination of serum creatinine and cystatin C as marker to predict long-term renal outcome in patient with Type 2 diabetic nephropathy (DN). Methodology:Five hundred one patients with DN were enrolled in this study. The levels of eGFRcre, eGFRcys, eGFRcrecys were assessed at baseline, 12, and 24 month. After the follow-up time of median 31 months, the end-stage renal disease (ESRD) risk related to percentage change in estimated GFR over one and 2 years were compared to the three equations. Results:compared with eGFRcrecys, eGFRcre overestimated GFR in DN. The absolute bias was -0.21,6.17,12.69,9.55,5.27 ml/(min·1.73m2) when eGFRcrecys>120 ml/(min·1.73m2), 90~120 ml/(min·1.73m2), 60~89 ml/(min·1.73m2), 30~59 ml/(min·1.73m2),<30 ml/(min·1.73m2), respectively. Lower age, higher systolic blood pressure, lower body mass index, and increased fast blood glucose contributed to the bias. eGFRcrecys slope over 2 year was superior to eGFRcre or eGFRcys to predict renal outcome, whose area under curve ( AUC ) was 0.857±0.029 7 and the ROC of eGFRcrecys slope over 2 year combined with baseline eGFRcrecys was further increased to 0.917±0.0178. Baseline eGFRcrecys ≥90 ml/(min·1.73m2), 57% reduction over 2 years as an alternative end point, the sensitivity and specificity was 100%; Baseline eGFRcrecys <90 ml/(min·1.73m2), 40% reduction over 2 years could be an idea alternative end point. Conclusion:eGFRcre overestimated GFR in the patients with DN, in particular eGFR less than 120 ml/(min·1.73m2), 57% reduction over 2 years in baseline eGFRcrecys ≥90 ml/(min·1.73m2) and 40% reduction over 2 years in baseline eGFRcrecys <90 ml/(min·1.73m2) could be an idea alternative end point to predict ESRD.
cystatin C glomerular filtration rate diabetic nephropathy CKD-EPI prognosis
10.3969/cndt.j.issn.1006-298X.2016.02.002
国家自然科学基金青年基金(81500548),国家科技支撑计划课题(2015BAI12B05)
南京大学医学院附属金陵医院博士研究生(潘 瑜) 国家肾脏疾病临床医学研究中心 全军肾脏病研究所(南京,210016)
刘志红(E-mail:liuzhihong@nju.edu.cn)
2016-01-18
ⓒ 2016年版权归《肾脏病与透析肾移植杂志》编辑部所有

