Artificial Intelligence Based Multi-Scenario mmWave Channel Modeling for Intelligent High-Speed Train Communications
Zhang Mengjiao ,Liu Yu,,* ,Huang Jie ,He Ruisi ,Zhang Jingfan ,Yu Chongyang ,Wang Chengxiang
1 School of Microelectronics,Shandong University,Jinan 250101,China
2 The State Key Laboratory of Rail Traffic Control and Safety,Beijing Jiaotong University,Beijing 100044,China
3 The National Mobile Communications Research Laboratory,School of Information Science and Engineering,Southeast University,Nanjing 210096,China
4 The Purple Mountain Laboratories,Nanjing 211111,China
Abstract: A large amount of mobile data from growing high-speed train (HST) users makes intelligent HST communications enter the era of big data.The corresponding artificial intelligence (AI) based HST channel modeling becomes a trend.This paper provides AI based channel characteristic prediction and scenario classification model for millimeter wave (mmWave) HST communications.Firstly,the ray tracing method verified by measurement data is applied to reconstruct four representative HST scenarios.By setting the positions of transmitter (Tx),receiver(Rx),and other parameters,the multi-scenarios wireless channel big data is acquired.Then,based on the obtained channel database,radial basis function neural network (RBF-NN) and back propagation neural network(BP-NN)are trained for channel characteristic prediction and scenario classification.Finally,the channel characteristic prediction and scenario classification capabilities of the network are evaluated by calculating the root mean square error (RMSE).The results show that RBF-NN can generally achieve better performance than BP-NN,and is more applicable to prediction of HST scenarios.
Keywords: artificial intelligence;channel characteristic prediction;HST channel;millimeter wave;scenario classification
I.INTRODUCTION
As a typical application scenario of new generation communication system,high-speed train (HST) communications are developing rapidly,and the communication demands of HST users continue to increase.A large number of HST users bring diverse communication demands,such as multimedia entertainment,video conference,and online HDTV,which lead to a rapid growth in communication data flows [1].The existing HST communication system is far from meeting the growing requirements.Consequently,the fifth generation communication system for railway(5G-R)considering 5G key technologies is essential,which can provide vast HST environment sensing,high energy efficiency,low delay,and highly reliable communication services[2].Accurate channel model that can capture the distinctive channel characteristics plays a crucial role in the design,test,and network evaluation of future 5G-R system[3].Due to the expansion of future HST channels in multiple domains and the big data attributes presenting in various HST channels,it is a tendency to apply artificial intelligence (AI) to HST channel modeling[4-6].
In the literature,the relative HST channel measurements and modeling researches have been conducted[7].Sub-6 GHz HST measurement campaigns were carried out in tunnel,open space,viaduct,and cutting scenarios in [8,9],where large-scale fading and small-scale fading were analyzed.The power delay profile (PDP) of viaduct and hilly scenarios measured in 2.6 GHz band were compared in [10].Based on the channel measurement results,typical large-scale fading parameters andK-factor(KF)were studied.In [11],a non-stationary IMT-A HST channel model with time-varying parameters was proposed to obtain a series of time-varying small-scale characteristics.Moreover,the measurement campaign at 2.4 GHz band along the Guangzhou-Shenzhen railroad was performed[12].The concept of active scatterer region was proposed to improve the geometry based stochastic model (GBSM).GBSM was applied to a multi-link propagation scenario for HST communication[13],and the channel model considering lineof-sight (LoS) component,a single-bounced one-ring model,and a double-bounced ellipse-ring was mentioned.With the increasing growth of HST channel data,the existing modeling methods have their own challenges.
Due to the advantages of machine learning (ML)algorithms in big data processing,AI based channel modeling is gradually becoming one of the key methods to study future wireless channels[14].Compared with traditional channel modeling methods,a significant advantage of applying AI and ML is the ability to partially predict the wireless channel characteristics of unknown scenarios,unknown frequency bands and future moments.In addition,AI based channel modeling methods have a wider range of application scenarios and higher flexibility.A large amount of valid channel data in highly complex scenarios can be obtained without the need of huge human and material resources.Then,high-precision channel modeling and channel characteristic prediction in various high-complexity scenarios can be achieved [6].Furthermore,the introduction of neural network algorithms to train channel databases for channel characteristic prediction and scenario classification was provided in [15,16].In [17],a fast time-varying channel prediction algorithm was proposed.It was based on support vector machine (SVM) and genetic algorithm(GA)model.In [18],2.35 GHz band measurements considering massive multiple-input multipleoutput (MIMO) systems were introduced in cutting scenario.A Conv-CLSTM channel characteristic prediction model was proposed for the prediction of channel state information (CSI),KF,root mean square(RMS)delay spread(DS),and angular spread(AS).In addition,measurements at 1890 MHz and 2605 MHz bands were conducted.Based on the measured data,a deep neural network (DNN) based weighted score fusion model for rural,station,suburban,and multilink HST scenario identification was proposed [19].The above works mainly focused on the sub-6 GHz band.Millimeter wave (mmWave) technology,with its high speed and large bandwidth [20,21],will be used as a promising communication technology for future 5G-R HST communications [22].Measurement campaigns of 25-37 GHz mmWave channels were carried out in conventional railway stations,tunnels,and open space scenarios[23,24].The received power,PDP,RMS DS,and channel non-stationarity were analyzed.A strong correlation between angle and environment was demonstrated for rural scenario measured at 28 GHz band [25].However,due to the complex operation scenario of HST and expensive test equipment,HST channel measurements in the mmWave band are very limited[26].The ray tracing(RT) simulation modeling method based on limited real measurement verification was recommended[27].In [28],60-300 GHz mmWave measurements were performed in a car to simulate HST.The measurement results verified the effectiveness of their selfdeveloped RT simulator.Based on the verified RT,typical HST scenarios were reconstructed [29].The received power,KF,RMS DS,and ASs were analyzed for data obtained from the simulations[30].Moreover,RT deterministic modeling method with high computational complexity.Considering the specificity of the HST scenario,a GBSM containing ambient modes was proposed,which was specifically used for 3GPP mmWave HST[31].The PDP,KF,DS,and ASs were analyzed in comparison with the verified RT simulation.The introduction of mmWave communication and massive MIMO has led to a rapid growth of data volume,which urgently requires using big data methods for mmWave channel modeling [32,33].Currently,AI based mmWave channel modeling has been carried out in indoor scenarios.In [34],a measurement campaign was launched in a typical indoor scenario at 60 GHz band,and the SVM+GA algorithm was used to predict the path loss (PL) and delays.A database of wireless channels in four indoor mmWave bands was built,and the received power,DS,and ASs were predicted by training feedforward neural network(FNN)and radial basis function neural network(RBFNN)[35].
To the best of our knowledge,AI based channel characteristic prediction and scenario classification for mmWave HST communications are still in the preliminary stage.Thus,it is essential to study characteristic prediction method for complex HST scenarios,and use channel multidimensional features to intelligently distinguish HST scenarios.To fill the research gaps,the RT method verified by measurement data is employed to reconstruct four typical HST scenarios.Moreover,two kinds of neural network algorithms are imported for characteristic prediction and scenario classification.The main contributions of this paper are summarized as follows.
• A comprehensive HST channel database is established by the RT and measurement data.Using the limited HST channel measurement data,the RT software in typical HST scenarios are verified.Based on the verified RT,four HST scenarios including viaduct,open space,hilly,and cutting are reconstructed,and large amounts of channel data is acquired correspondingly.
• An artificial neural network (ANN) based channel characteristic prediction modeling method for four HST scenarios is provided.The back propagation neural network (BP-NN) and RBF-NN algorithms are introduced to achieve accurate prediction of classic channel characteristics for multi-scenario fusion under HST mmWave communication.The performance of two algorithms is compared and analyzed by calculating the root mean square error(RMSE).
• HSTs usually travel through different scenarios rapidly.An ANN based modeling method for HST scenarios classification is provided.During training the ANN,the classification of various HST scenarios is achieved by using identified numbers to label the scenario types.And the model classification performance is verified by the multi-scenario dataset.
The remainder of this paper is organized as follows.Section II describes the typical scenario reconstruction and HST wireless database generation.In Section III,typical channel characteristics are introduced and ANN based prediction and classification model methods are proposed.Then,the model is analyzed and evaluated by a multi-scenario fusion database in Section IV.Conclusionand future research work are given in Section V.
II.HST WIRELESS DATABASE GENERATION
2.1 Verification of Measurement Data
The RT software Wireless Insite (WI) is verified by measurement data and applied to reconstruct typical HST scenarios.The WI is a full-featured software that can mimic complex and realistic communication scenarios and produce effective channel data[36].Before channel data collection,the RT method is verified by related measurement data to ensure the accuracy and availability of generated data.Since the limited HST mmWave measurement data,the open space scenario is selected as verification scenario[25].All the parameters in RT method are kept consistent with the real measured ones.The fitting result of RMS DS is presented in Figure 1.In this case,the channel parameters are determined and then extended to multiple scenarios of HST.
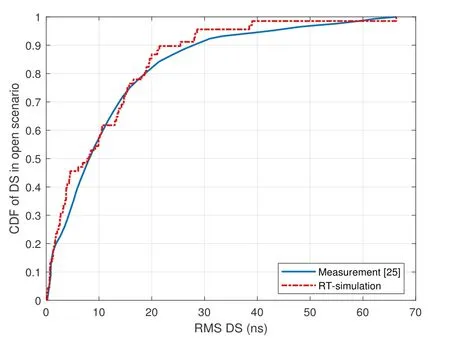
Figure 1.DS of channel measurement and RT simulation in open space scenario.
2.2 Typical Scenarios Description
HST can go through multiple scenarios during traveling.Typical HST scenarios are roughly divided into six categories: open space,viaduct,cutting,hilly,tunnel,and station scenarios [11].Here,we choose the most representative four outdoor scenarios,including open space,viaduct,cutting,and hilly scenarios for reconstruction.
2.2.1 Viaduct Scenario
Viaduct is one of the typical HST scenarios.Over 70%of the traveling scenarios in Beijing-Shanghai highspeed rail line are viaducts [4].Here,the vicinity of Huayuan Road in Daiyue District,Tai’an City of Beijing-Shanghai High-speed Railway is used to reconstruct.The area on both sides near the railroad is mainly farmland and dense trees.The left side of the railroad covers residential buildings,low buildings,cement road,and lawn,with the cement road in the middle of the buildings and land,and the right side of the railroad is a wide road as shown in Figure 2.The viaduct height and relative base station (BS) height have great influence on the received signal.
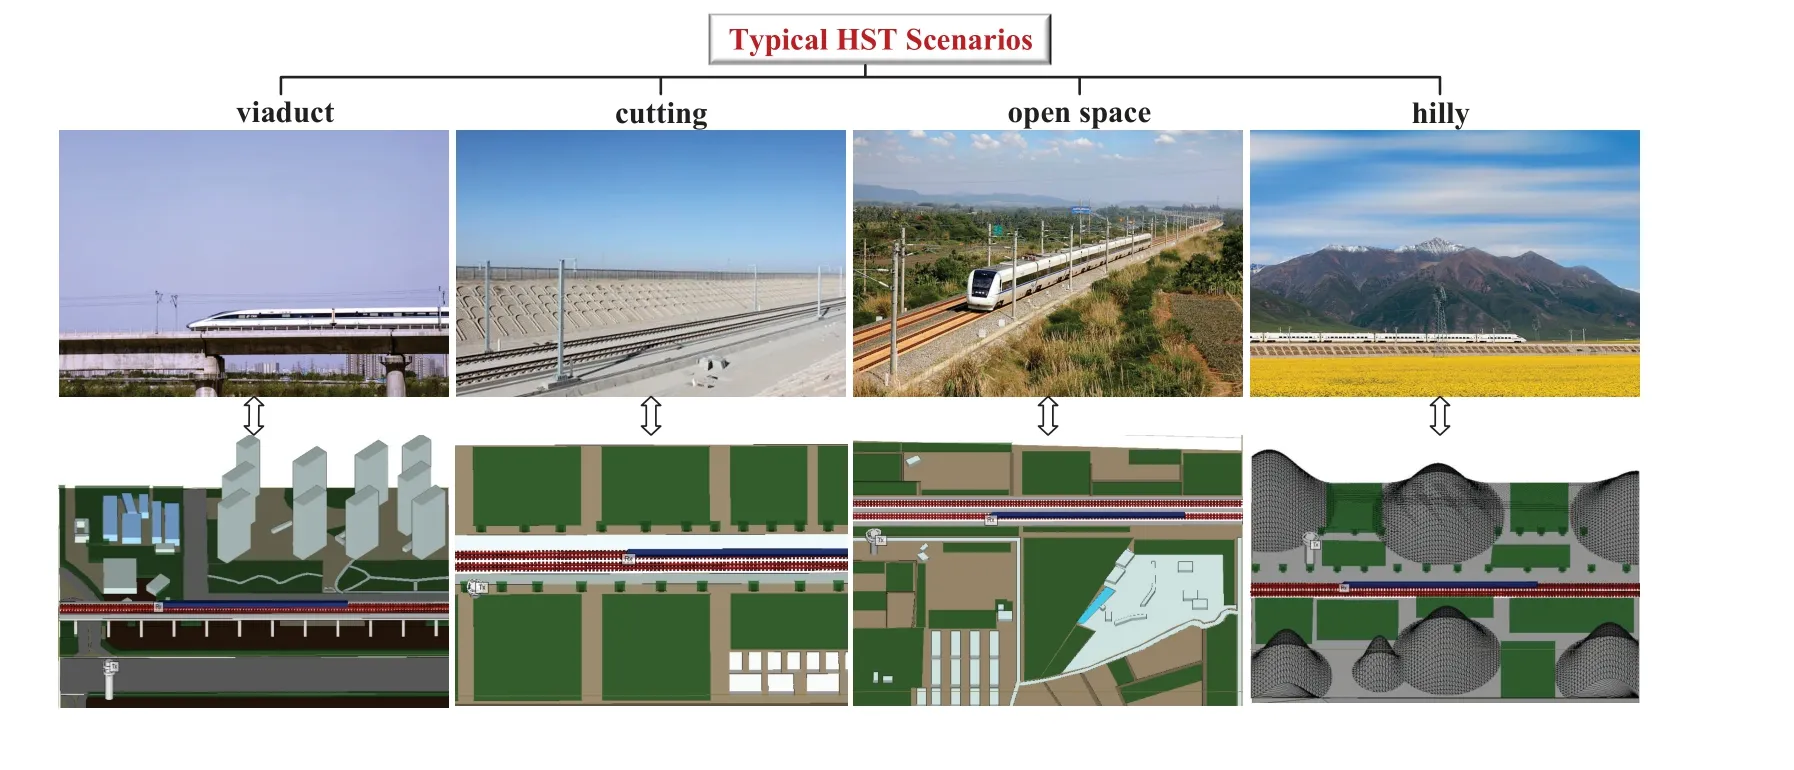
Figure 2.Four typical HST scenarios: Actual scenario and WI modeling reconfiguration.
2.2.2 Cutting Scenario
Cutting scenario refers to the real dimensions in[18],where cutting crown width is set to 40 m,bottom width is set as 16 m,and depth is 5 m.SketchUp software is used to complete the main modeling and import into WI.The whole scenario contains dense trees,farmland,grass,and low buildings as shown in Figure 2.The scenario size is 400 m×300 m.Compared with other scenarios,there are fewer kinds of objects in cutting scenario.The propagation of radio waveforms is significantly affected by the steep walls on both sides,and the relative height between transmitter (Tx) and receiver (Rx) in this scenario is different from other scenarios.
2.2.3 Open Space Scenario
The vicinity of the Beijing-Shanghai HST Jinan Jiu Province Royal Road Tea Culture Ecological Park as a typical open-field scene is selected as open space scenario.The original size scenario is reconstructed for the 400 m range of the area,with specific dimensional data from Baidu Map.Both sides of the railroad are dominated by farmland,in which there are several low buildings and concrete roads.Moreover,there are dense trees along the railroad line as shown in Figure 2.The Rx is moving with a high speed in this area where the BS antenna is much higher than the surroundings.
2.2.4 Hilly Scenario
The communication transmission of hilly scenario is mainly affected by the mountain.The reconstruction of hilly environment is referred to scenario parameters in [10].Similar to cutting scenario,the main modeling is completed in SketchUp software and imported into WI.During the modeling,the common objects of mountain are added,and the results are shown in Figure 2.The height of the mountain is 70-90 m,and the main materials are gravel,trees,and dry land.In this scenario,the radio reflection,scattering,and diffraction are mainly caused by hill distributed irregularly.
2.3 Channel Database Generation
The WI verified by measurement data is used to obtain the channel data.The simulation details and parameters selection in different scenarios are set up as in Table 1.It should be noted that the specific electromagnetic parameters are from International Telecommunication Union (ITU)-R P.2040 [37].The dimensions and material parameters of track are identical in all four scenarios,including steel rails,sleepers,and roadbed.Here,we take the open space scenario as an example to introduce the generation process of channel datasets.Firstly,the size of scenario is selected as 400 m×300 m.The Tx with a height of 33.2 m is located on the one side of steel rails.Meanwhile,the Rx is placed above the front of train with 3.89 m height.An 8×8 MIMO antenna array with antenna elements spaced at half-wavelength is used as the Tx antenna,while a single omnidirectional antenna deployed on the Rx.Moreover,the frequency is 28 GHz with bandwidth of 933 MHz,and transmit power is set as 34 dBm.The traveling distance between Tx and Rx is set as 297 m,and received data is captured every 3 m.It can totally get 64×100 sets of channel data at 100 different positions of Rx,such as Rx1,Rx2,...Rx100.The Tx/Rx antenna elements coordinates are recorded as (tx,ty,tz) and (rx,ry,rz),respectively.Then,the Tx-Rx distancedtris calculated according to the Euclidean distance formula,htris the height difference between Tx and Rx antenna elements,andhtsis the height difference between Tx and the highest scatterer object in the scenario.A 10-dimensional channel database including Tx/Rx coordinates,Tx-Rx distancedtr,frequencyfc,height difference between Tx and Rxhtr,and height difference between Tx and highest scattering objecthtsare generated,described as[tx,ty,tz,rx,ry,rz,dtr,fc,htr,hts].Channel data for other scenarios can be obtained by adjusting simulation parameters according to specific scenario features.Finally,a total of 6400×4 channel data sets are obtained to establish channel database.Before inputting into the network,the training set of 10-dimensional channel parameters was normalized to preprocess.
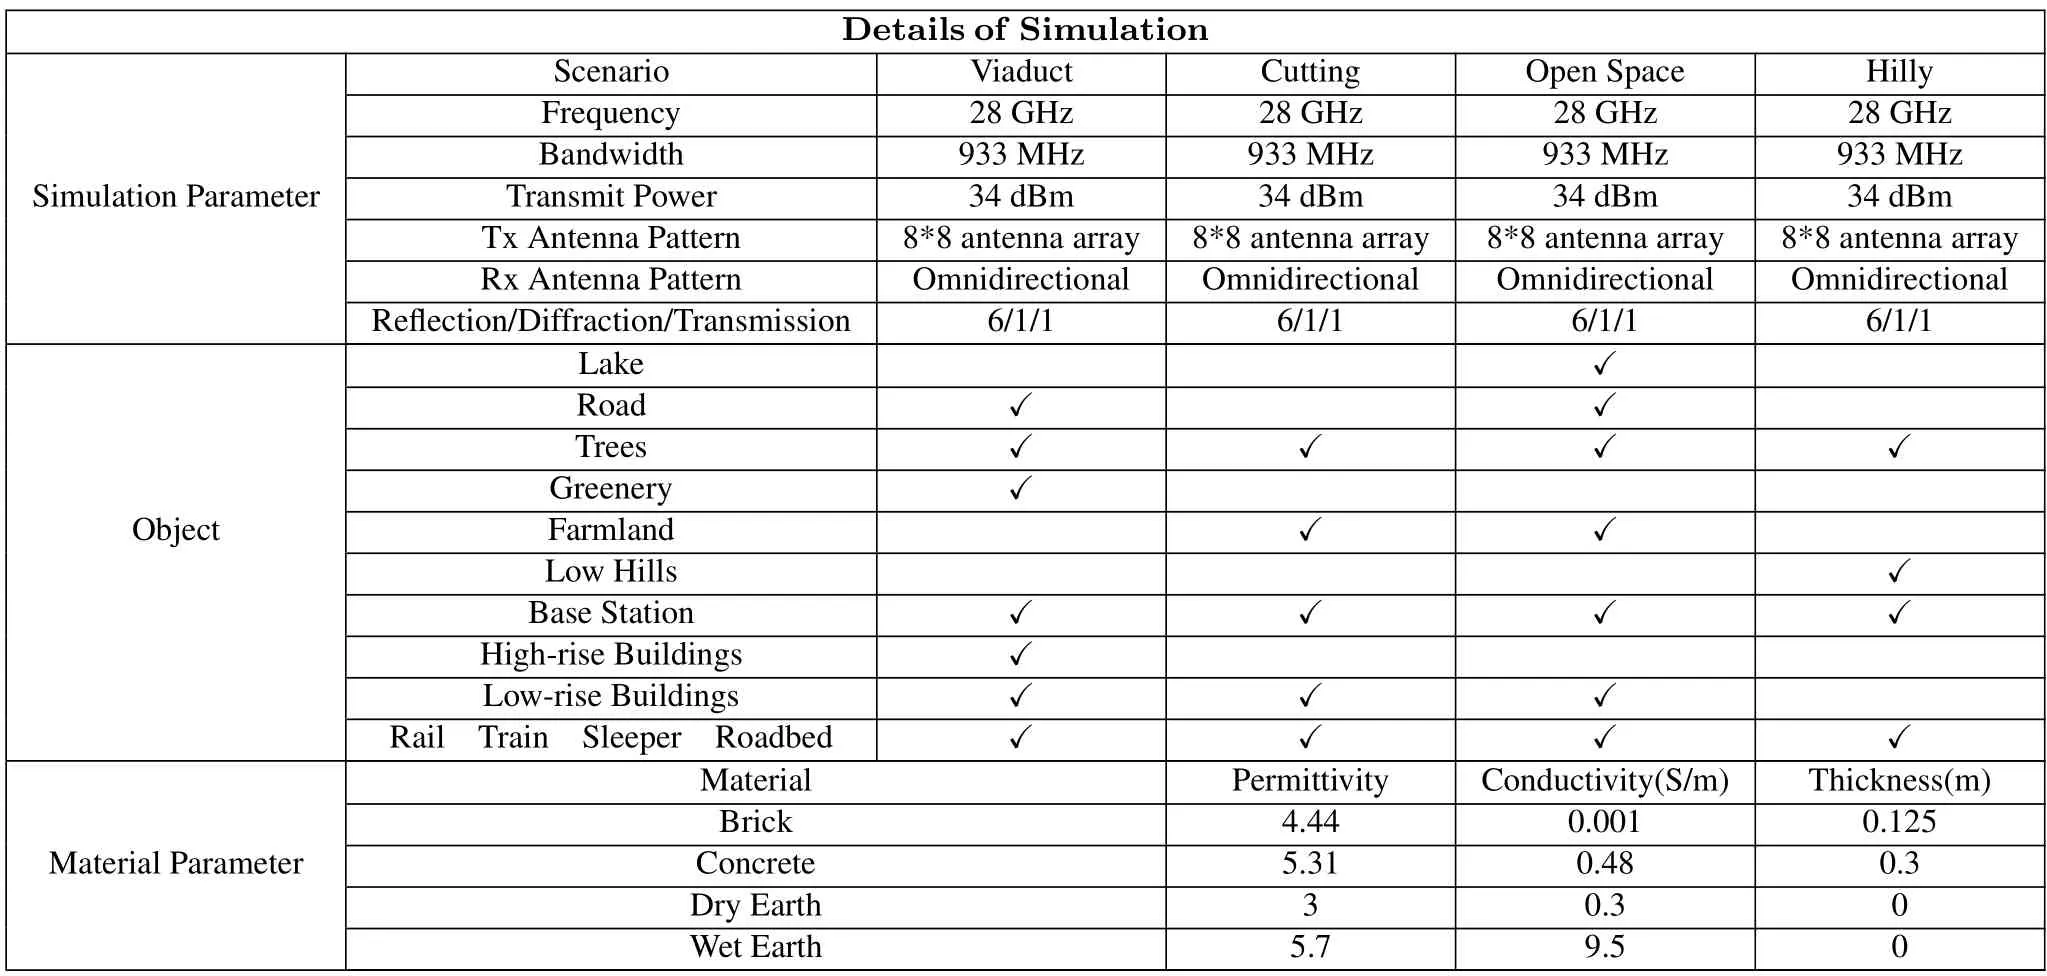
Table 1.The parameter settings of simulation.
III.NEURAL NETWORK-BASED CHANNEL CHARACTERISTIC PREDICTION AND SCENARIO CLASSIFICATION MODELS
3.1 Typical Channel Characteristics
During the generation of channel data,multipath components (MPCs) information including delay,amplitude,phase,azimuth angle of arrival(AOA),azimuth angle of departure (AOD),elevation angle of arrival(EOA),and elevation angle of departure (EOD),etc.,is obtained.Based on the channel data,the typical channel characteristic values are obtained.The channel characteristic set is then established.Several typical channel characteristics are calculated as follows.
3.1.1 Receiver Power
Based on multipath information,the total received power is calculated.Moreover,the PL value of Rx located at a specific position can be calculated by subtracting the transmit power from the total received power.PL is a key indicator to assess the communication transmission quality.The total received power can be obtained as
whereαpq,idenotes the propagation amplitude ofith path betweenpth Tx andqth Rx,andIis the total number of multipaths.
3.1.2 Root Mean Squared Delay Spread
The RMS DS is an important small-scale fading characteristic parameter which can be used to measure the channel dispersion in delay domain.It can be expressed as
whereτpq,idenotes the propagation delay ofith path betweenpth Tx andqth Rx.
3.1.3 Rician Factor
The KF is a typical channel parameter for studying the signal transmission process.It is defined as the ratio of the LoS power to the sum of the remaining MPCs[21],which can be expressed as
wherePLoSdenotes the power value of the direct path,andPpq,iis the power value of theith path betweenpth Tx andqth Rx.
3.1.4 Root Mean Squared Angular Spread
AS is a second-order statistic measuring channel dispersion in angular domain,including azimuth and elevation angles.The AS of azimuth and elevation angles can be obtained separately as
whereθpq,iandφpq,idenote the azimuth and elevation angles via theith path betweenpth Tx andqth Rx,respectively.Using similar calculation process,the AOA spread(AAS),AOD spread(ADS),EOA spread(EAS),and EOD spread(EDS)can be acquired.
3.2 Basic Neural Network Model
ANN are an abstraction of the neuronal network of human brain from an information processing perspective.Following different connections way,a large number of simply connected neurons formed a complex neural network.Neuron is the basic unit of ANN,each neuron generates a sequence of real-valued activations [38].With highly nonlinear characteristics,ANN is capable of complex logic operations and nonlinear relational implementations.Moreover,it adopts parallel distributed signal processing mechanism,which results in fast processing speed and strong fault tolerance.FNN is one of the typical structures of ANN[35].The commonly used FNN contains BPNN and RBF-NN,which are easier to be implemented.Both of them do not require very complex network to achieve the desired results,which can better meet the initial design requirements.Moreover,compared with more complex networks such as CNN,BP-NN has lower complexity and less loss of accuracy.
BP-NN is one of the most widely used neural networks.It can realize complex pattern classification and multidimensional function mapping.Structurally,it contains input layer,hidden layer,and output layer.The basic idea of its algorithm is to adopt the network error squared as the target function,and use the gradient descent method to calculate its minimum value[38].RBF-NN is another commonly used classical FNN with excellent performance.For the RBFNN,the input terms are mapped to a high-dimensional space by Gaussian transform,and RBF is used as the activation function of the hidden layer neurons.Based on the above features,RBF-NN has better approximation ability and global optimum property[39].
Channel characteristic prediction and scenario classification are two separate networks,namely Network 1 and Network 2.Network 1 adopting BP-NN and RBF-NN respectively,is established for key channel characteristic prediction.After several training verifications,the following BP-NN parameter settings are adjusted for the best results.A 10-10-7 multilayer BP network is built.The activation functions of the implicit layer and the output layer are′tansig′and′purelin′,respectively.Levenberg-Marquardt (L-M)optimization algorithm is used for training function,which has the fastest convergence speed compared with other training functions [40].The number of training is set to 1000,the learning rate is 0.01,and the minimum training target error is set to 1×10⁻⁵.The′tansig′and′purelin′functions are as follows
The RBF-NN uses the′newbe′function to design an exact radial basis network with spread set to 1.The RBF-NN activation function uses a Gaussian kernel function,which can be expressed as
wherecnis the center point of thenth neuron in the hidden layer andσis the width of the Gaussian kernel.
The outputymof the network is given by
whereωmnis the moderation weight between themth neuron in the output layer and thenth neuron in the hidden layer,Nis the number of units in the hidden layer,andMis the number of units in the output layer.The network-based channel characteristic prediction and scenario classification model framework is shown in Figure 3.During the prediction of channel characteristic Network 1,10-dimensional channel parameters are selected as inputs of Network 1,and some typical channel characteristics are set as outputs.Then,during scenario classification Network 2,the predicted channel characteristics are chosen as inputs of Network 2,and the identified numbers of different scenarios are set as the outputs.
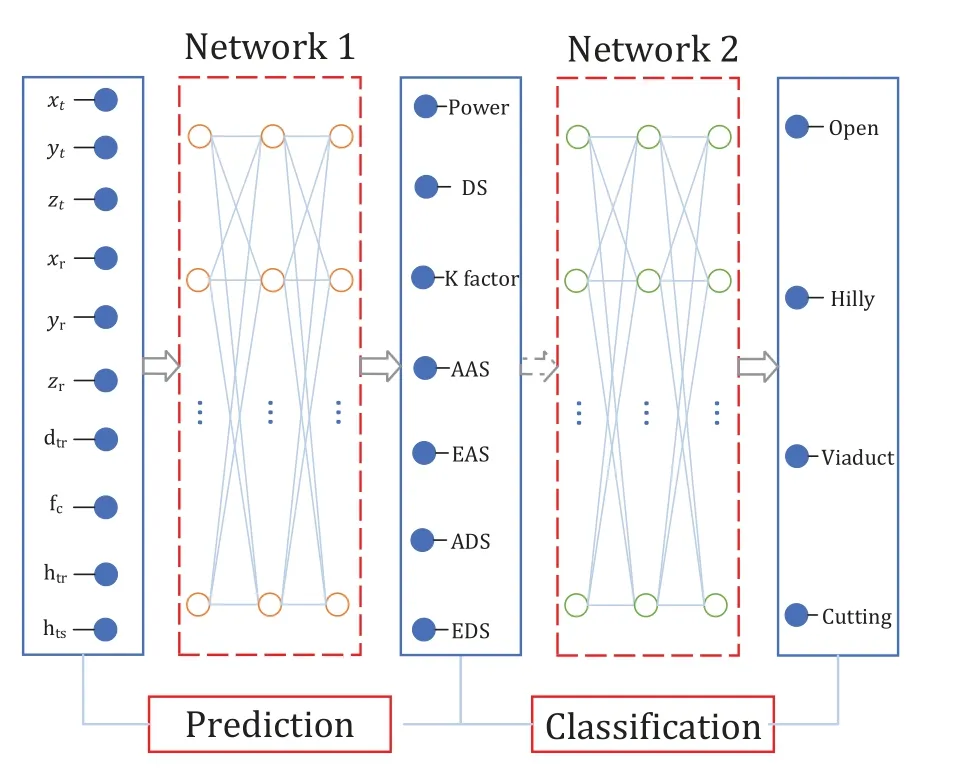
Figure 3.Modeling framework for channel characteristic prediction and scenario classification of HST.
3.3 Channel Characteristics Prediction Network
For every scenario,a total of 6400 (64×100) data groups are generated for training and testing the neural network.The input parameters of the neural network contain[tx,ty,tz,rx,ry,rz,dtr,fc,htr,hts],and the output parameters are some key channel characteristics calculated at the corresponding locations,including receiver power,DS,KF,and ASs(AAS,ADS,EAS,EDS).Here,we take the open space scenario as an example to introduce the training and testing of neural network.The total number of datasets for the open space scenario is 6400.In the dataset of open space scenario,the testing dataset is extracted every 80 groups regularly,and the remaining dataset is used for the training.The ordered datasets tend to cause bias in the training process and reduce the generalization of the neural network model.Training sets are randomly sorted by MATLAB and then fed into network,and the output channel characteristic predictions are compared with their true values.The above mentioned method is further extended to four scenarios,and the neural network model is applied to the fusion scenario.That is,one set of data is taken every 4 groups,and 1600 data sets in all are produced for each kind of scenario.Then,a total number of 1600×4 groups are taken out from the four scenarios to finally form the fusion dataset.The training and testing sets generation basis and model training method in the fusion scenario are consistent with the open space scenario.
3.4 Scenario Classification Network
Channel environments of different HST scenarios vary greatly,and each scenario has its unique channel characteristics.Hence,studying how to describe the mapping relationship between wireless channel data and HST scenarios is crucial [41].Based on the aboved channel characteristics dataset,Network 2 is established for scenario classification.It is implemented by two neural network algorithms,BP-NN and RBF-NN,respectively.The input of ANN model use the generated fusion scenario wireless channel characteristics dataset [P,DS,KF,AAS,EAS,ADS,EDS],and the output of ANN model is the scenario type numbers.Different HST scenarios are marked by different labeling numbers,such as open space,cutting,viaduct,and hilly scenarios corresponding to numbers 1,2,3,and 4,respectively.The Network 2 above is trained,and the output scenario numbers are compared with their real scenario numbers,so as to achieve the purpose of classifying HST scenarios.
IV.RESULTS AND ANALYSIS
4.1 Prediction Fitting of Typical Channel Characteristics
The prediction performance of the model is evaluated by using the fusion scenarios dataset,and the ANN predicted values are compared with the RT simulated values.The fitting results can be used to intuitively reflect the overall prediction effect.Both the BP-NN and RBF-NN models can predict the overall variation trends very well.Moreover,the prediction results of RBF-NN are significantly better than those of BP-NN.
The RBF-NN has very high accuracy for prediction of received power,DS,KF,and ASs.The BP-NN has lower accuracy for prediction of KF than received power,DS,and ASs.
Figure 4 shows the fitting results of received power among two neural network predictions as well as simulated datasets.The x-axis denotes the testing dataset number,and the y-axis is the received power value of the corresponding data index.The range of received power is between -125 dBm and -90 dBm.Figure 5 describes the predicted DS values,which has a concentrated range of 0 ns to 50 ns.Moreover,there are several spots in the series between 50 ns and 200 ns.It might be caused by more scatterers in some scenarios and/or the train being far away from the Tx.
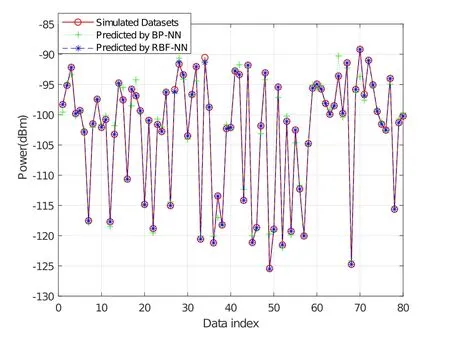
Figure 4.Fitting results of receiver power for BP-NN prediction,RBF-NN prediction,and simulated datasets.
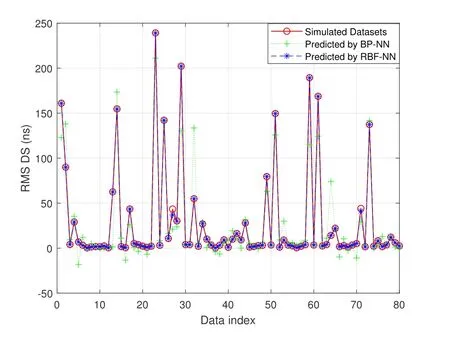
Figure 5.Fitting results of DS for BP-NN prediction,RBFNN prediction,and simulated datasets.
The predicted KF values among two neural network predictions as well as simulated datasets are presented as shown in Figure 6.It can be seen that the prediction performance of BP-NN for KF is relatively weak,and the overall fluctuation of KF with large difference at a certain place reflects the time-varying nature of KF.The sudden drop of KF value at a certain moment may be caused by the blockage of other scatterers,such as trees during the train operation.In addition,when the train runs to a certain moment,there is no blocking between Tx and Rx,and at this time,the LoS path between Rx and Tx is strong [42].As illustrated in Figure 6,the above described situation occurs when data index is 49,leading to a significant increase of KF value.
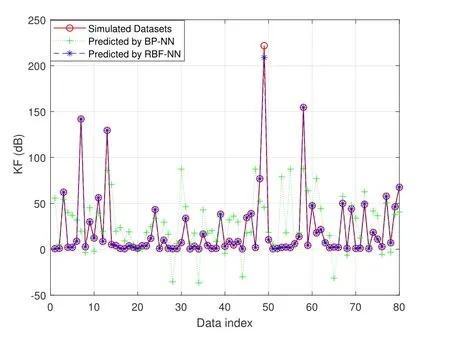
Figure 6.Fitting results of KF for BP-NN prediction,RBFNN prediction,and simulated datasets.
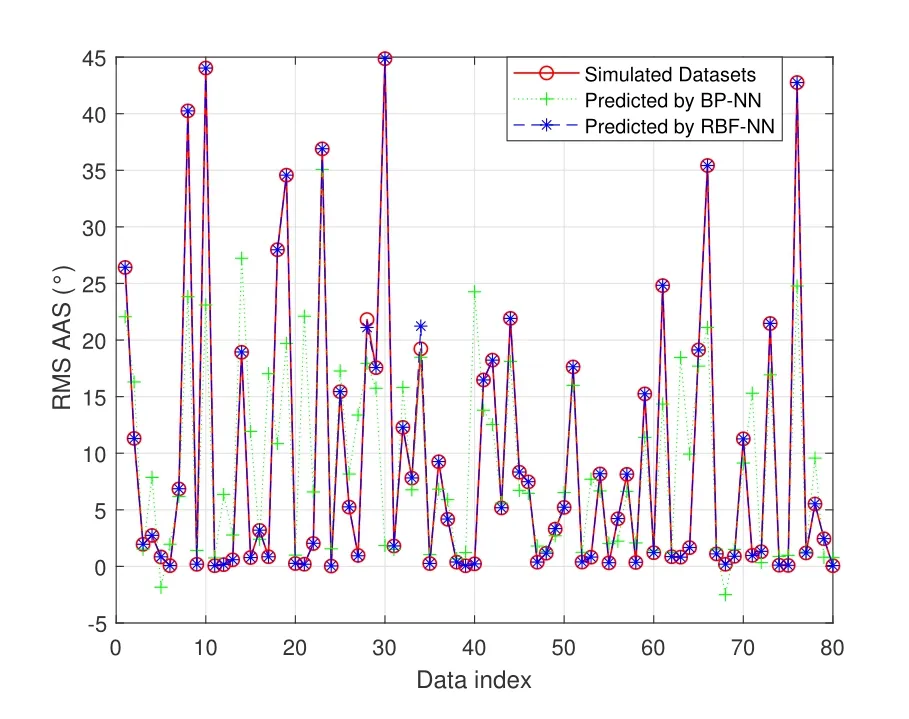
Figure 7.Fitting results of AAS for BP-NN prediction,RBFNN prediction,and simulated datasets.
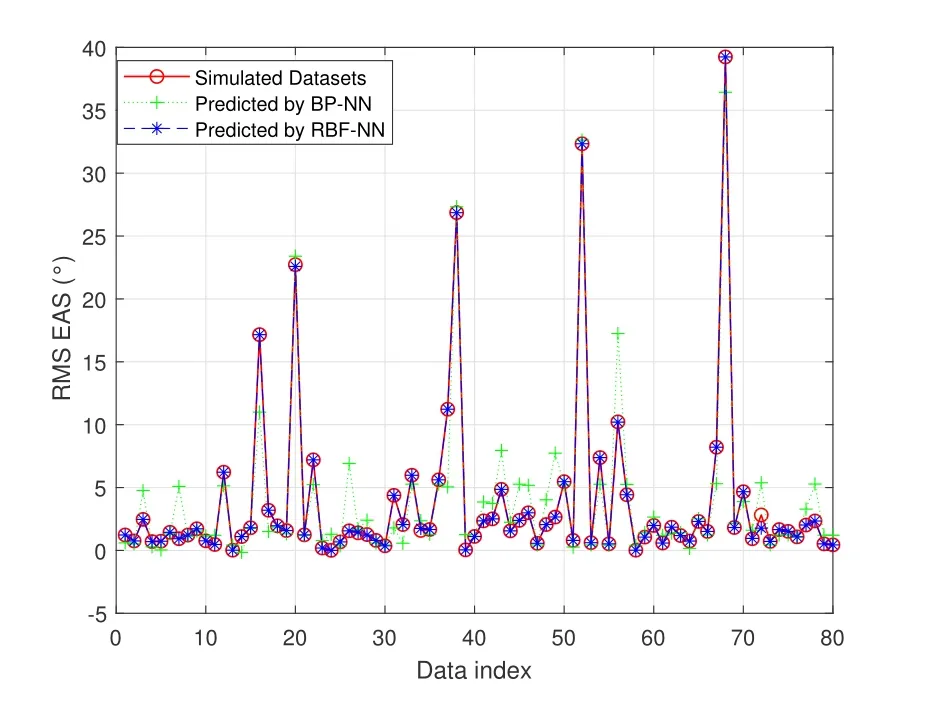
Figure 8.Fitting results of EAS for BP-NN prediction,RBFNN prediction,and simulated datasets.
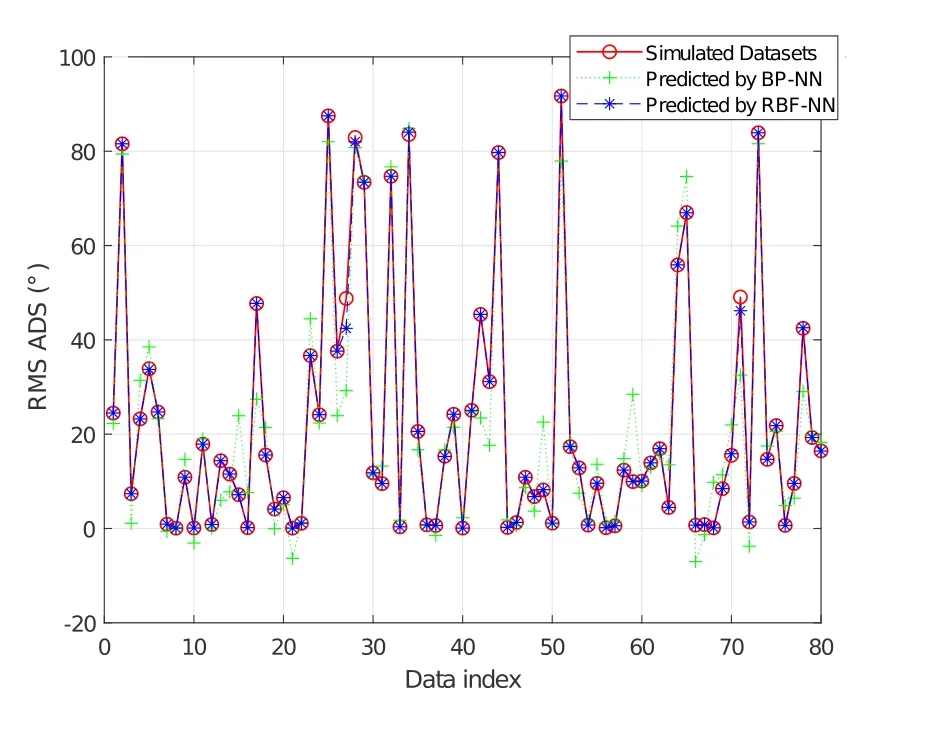
Figure 9.Fitting results of ADS for BP-NN prediction,RBF-NN prediction,and simulated datasets.
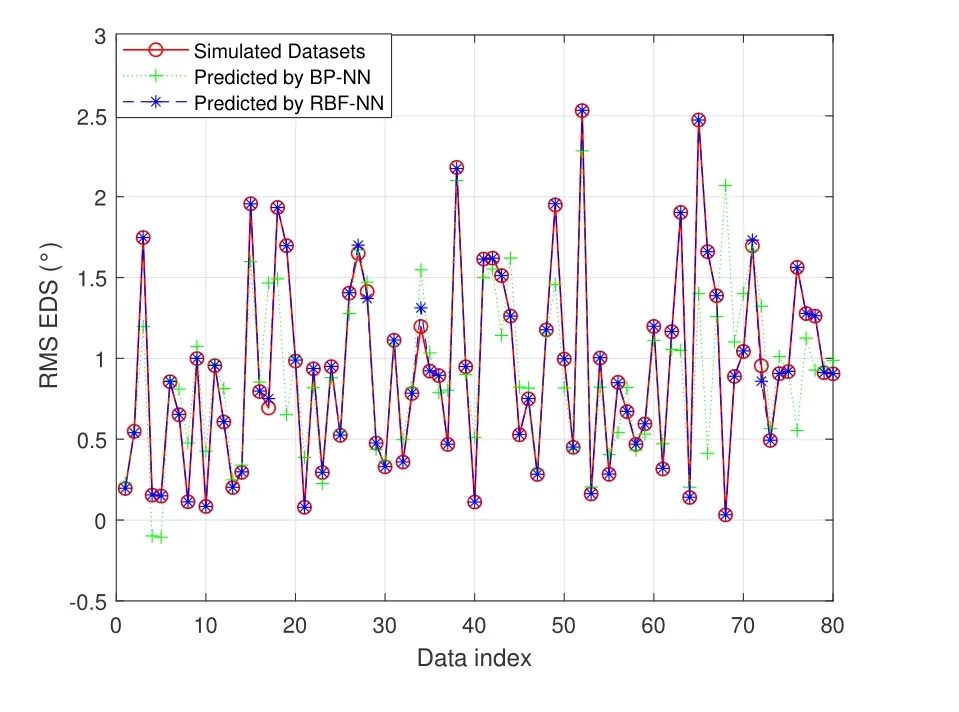
Figure 10.Fitting results of EDS for BP-NN prediction,RBF-NN prediction,and simulated datasets.
The predicted values of ASs,including AAS,EAS,ADS,and EDS are shown in Figures 7-10,respectively.The EAS ranges from 0°to 10°and AAS ranges from 0°to 40°.The angles range of ADS is the largest,which reaches 0°-90°,while the maximum of EDS does not exceed 3°.The floating range of azimuth angle is larger than the elevation angle,for which EDS has the highest prediction accuracy.
4.2 Scenario Classification Results
By labeling category of each scenario,the numbers 1,2,3,and 4 are used to represent open space,cutting,viaduct,and hilly scenarios,respectively.The scenario label dataset is obtained as the output of Network 2.In the classification process,the testing groups are randomly sorted and input into the Network 2.
The related classification results for BP-NN prediction,RBF-NN prediction,and simulated datasets are illustrated as Figure 11.From this figure,both BPNN and RBF-NN predictions can achieve good performance in scenario classification.Compared with RBF-NN,BP-NN classification is more accurate and stable in this application.
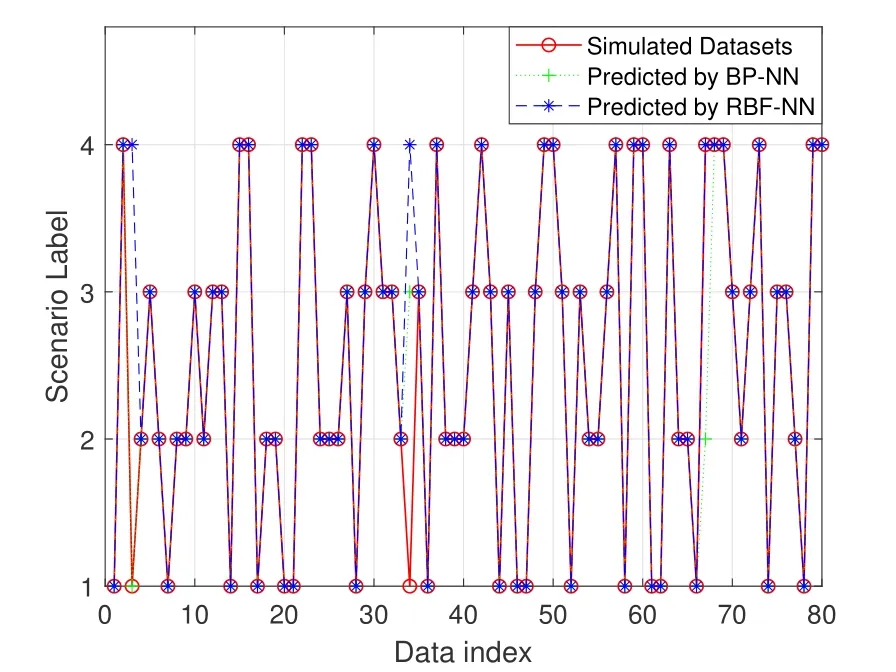
Figure 11.The classification results of multi-scenario fusion for BP-NN prediction, RBF-NN prediction, and simulated datasets.
4.3 Performance Evaluation of ANN Models
The RMSE is used to measure the performance of ANN models.It is a commonly used statistical indicator,which responds to the deviation between the predicted and real values.The detailed calculation of RMSE can be expressed as
whereais the total number of dataset groups,yrealandypredare the real and predicted values of thebth group,respectively.
To compare the prediction performance,the RMSEs of BP-NN and RBF-NN applied to the fusion scenario are calculated as listed in Table 2.The smaller the RMSE value,the closer the predicted value is to the real value,and the model prediction is better.When the value of RMSE is equal to 0,the predicted value is equal to the true value,and it is called a perfect model.For prediction of EDS,both RBF-NN and BP-NN can provide good performance.Furthermore,the RMSE of EDS using RBF-NN prediction is only 0.02,which indicates that EDS is highly correlated with the input features.However,for prediction of KF,both method can not achieve good performance,which means that the correlation between KF and the input features is relatively lower.Meanwhile,the RMSE values are calculated according to the scenario classification results.The classification ability of the Network 2 is verified.Meanwhile,both RBF-NN and BP-NN exhibit excellent classification performance,and the classification ability of BP-NN is stronger than RBF-NN.The RMSE obtained with RBF-NN is 0.47,while BP-NN corresponds to 0.32.

Table 2.RMSEs comparison for BP-NN and RBF-NN in multi-scenarios.
V.CONCLUSION
In this paper,ANN based models for channel characteristic prediction and scenario classification have been proposed.Four typical HST scenarios have been reconstructed using the RT method,which has been verified by the limited real measurement data.Then,the channel data for four HST communication scenarios in mmWave bands has been acquired and the corresponding channel database has been established.Based on the channel datasets,the Network 1 and Network 2 have been used for characteristic prediction and scenario classification,respectively.In each network,two neural network algorithms,BP-NN and RBF-NN,have been selected for implementation.Finally,the prediction performance of BP-NN and RBF-NN has been compared.The two neural network algorithms have achieved the best prediction performance for EDS,indicating that EDS is highly correlated with physical channel parameters.The worst prediction performance has been obtained for KF,and both neural networks algorithms have the same performance trend of superior and inferior prediction for each channel characteristic.Moreover,the prediction performance and classification ability of the proposed models have been verified by fusion dataset.The results show that both networks can realize the basic functions.RBFNN has higher stability and is more suitable for characteristics prediction of HST channels,while BP-NN outperforms RBF-NN in classification of HST scenarios.The proposed ANN models can extend the applicability conditions to multi-frequency bands and more HST multi-scenarios as well as the same type of HST scenarios in different regions.
ACKNOWLEDGEMENT
This work was supported by the National Key R&D Program of China under Grant 2021YFB1407001,the National Natural Science Foundation of China(NSFC) under Grants 62001269 and 61960206006,the State Key Laboratory of Rail Traffic Control and Safety (under Grants RCS2022K009),Beijing Jiaotong University,the Future Plan Program for Young Scholars of Shandong University,and the EU H2020 RISE TESTBED2 project under Grant 872172.
- China Communications的其它文章
- Space/Air Covert Communications: Potentials,Scenarios,and Key Technologies
- Improved Segmented Belief Propagation List Decoding for Polar Codes with Bit-Flipping
- Scenario Modeling-Aided AP Placement Optimization Method for Indoor Localization and Network Access
- Off-Grid Compressed Channel Estimation with ParallelInterference Cancellation for Millimeter Wave Massive MIMO
- Low-Complexity Reconstruction of Covariance Matrix in Hybrid Uniform Circular Array
- Dynamic Update Scheme of Spectrum Information Based on Spectrum Opportunity Incentive in the Database-Assisted Dynamic Spectrum Management

