Scenario Modeling-Aided AP Placement Optimization Method for Indoor Localization and Network Access
Pan Hao ,Chen Yu ,Qi Xiaogang1,,* ,Liu Meili
1 School of Mathematics and Statistics,Xidian University,Xi’an 710126,China
2 Science and Technology on Near-Surface Detection Laboratory,Wuxi 214035,China
3 School of Software,Nanchang Hangkong University,Nanchang 330063,China
Abstract: Owing to the ubiquity of wireless networks and the popularity of WiFi infrastructures,received signal strength (RSS)-based indoor localization systems have received much attention.The placement of access points (APs) significantly influences localization accuracy and network access.However,the indoor scenario and network access are not fully considered in previous AP placement optimization methods.This study proposes a practical scenario modelingaided AP placement optimization method for improving localization accuracy and network access.In order to reduce the gap between simulation-based and field measurement-based AP placement optimization methods,we introduce an indoor scenario modeling and Gaussian process-based RSS prediction method.After that,the localization and network access metrics are implemented in the multiple objective particle swarm optimization (MOPSO) solution,Pareto front criterion and virtual repulsion force are applied to determine the optimal AP placement.Finally,field experiments demonstrate the effectiveness of the proposed indoor scenario modeling method and RSS prediction model.A thorough comparison confirms the localization and network access improvement attributed to the proposed anchor placement method.
Keywords: indoor localization;MOPSO;network access;RSS prediction
I.INTRODUCTION
Currently,with the development of wireless networks,indoor location-based services(LBS)and applications have attracted much attention due to their social and commercial values [1].Wireless communication devices,such as WiFi,Bluetooth low energy (BLE),RFID,etc.,have been pervasively deployed in buildings[2-8].They provide not only convenient network access services but also popular indoor localization and navigation services for smartphones.Due to the existing communications infrastructure,Received Signal Strength (RSS) fingerprinting emerged as one of the most popular approaches for implementing indoor localization systems[9].
Fingerprint-based localization traditionally consists of two steps,the fingerprint library construction process and the matching process.In the fingerprint library construction process,the RSS fingerprint library is constructed by collecting RSS measurements of APs at the planned reference points (RPs).In the matching process,the RSS measurements of the location to be estimated are matched according to the fingerprint library,and one or several most likely locations are selected so that the final estimated location can be obtained[10,11].
As for the matching process in the fingerprint-based localization method,the discrimination of the fingerprints in the radio map mainly involves two factors:the number and placement of the deployed APs [12].Suppose that the number of the APs is limited,optimizing the placement of the APs is an important and effective method to improve the localization accuracy.Various AP or beacon placement optimization methods have been proposed to improve the localization accuracy,and these methods are mainly divided into field measurement-based and simulation-based methods.
Field measurement-based methods require measurement of the target environment to find the optimal AP placement.In [13],the authors investigated the number of beacons/AP should be deployed to reach a given location performance,then the localization experiments of the different beacons/AP placements have been conducted in a fingerprinting localization system.The authors of [14] propose a measurementbased AP deployment mechanism (MAPD).MAPD improves the localization accuracy by deploying new APs in the identified positions that with poor localization accuracy.
Obviously,field measurement-based methods are labor-intensive and time-intensive,especially in large and complex environments[15],which cannot be implemented.To this end,simulation-based methods for optimizing AP placement locations are widely studied and used.In [16],the authors introduced the fingerprint differences(FD)metric to evaluate the localization accuracy in fingerprint-based localization system,and then proposed the Coverage-FD method optimize the AP placement,which based on the wireless coverage and FD metric.In[17],the authors propose a genetic algorithm (GA)-based AP placement optimization method using the log distance path loss (LDPL)propagation model.The results show that it can provide a relatively high uniqueness rate of RSS.
Recently,Cramer-Rao low bound(CRLB)has been developed to evaluate the localization performance[18,19],the CRLB-based optimization methods were proposed to improve the effectiveness of the optimal AP placement.In[20],the authors proposed the GACRLB AP placement optimization method to improve the estimation performance.This method adopts the CRLB to evaluate the location estimation accuracy,and the genetic algorithm is applied to quickly search for the optimal location of all APs.The authors of[21]adopted the differential evolution algorithm as the search algorithm (Coverage-CRLB),and the Motley Keenan model was used to predict the RSS measurements.
1.1 Motivation and Objective
Currently,previous works have proposed several AP placement methods for improving the indoor localization accuracy,which use computer-aided calculations to save costs.Intuitively,the Wi-Fi AP placement not only affects the localization accuracy,but also determines the access of the wireless network.
(1) According to the lower bound on the mean squared error (MSE) of the unbiased location estimation in the CRLB theory,the localization accuracy is affected by the relative target-sensor geometry.The recommended placements for wireless localization systems in the previous works have a common feature: the sensors are distributed around the localization area as much as possible[22,23].Thus,such optimal placements may cause the deterioration of the wireless signal in the center area,which influences network access.In addition to the signal strength,the number of the accessed devices is another critical factor in deploying Wi-Fi AP,which has not received attention in previous works.
(2) The indoor scenario is not fully considered in most simulation-based AP placement methods.In indoor environments,concrete walls have a significant impact on signal level[24].The so-called wall attenuation factor(WAF)can be predicted with a known and variable amount of obstructing walls,which can be obtained by modeling the specific indoor scenario.In practice,the placement from the previous simulationbased methods may be failed in both the localization accuracy and network access.As shown in Figure 1,even though the APs can cover the whole scenario,AP1 and AP3 may encounter the problem of overburdened access,which affects the quality of user network usage.
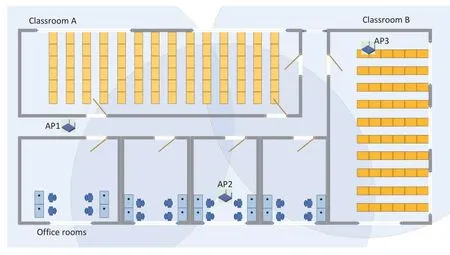
Figure 1.An example of the localization-oriented AP placement scheme.
Thus,the objective of this research work is to propose an empirical indoor scenario-based AP placement optimization method for improving localization accuracy and network access.
1.2 Contribution
To this end,we focus on reducing the gap between simulation-based and field measurement-based AP placement optimization method,and propose a practical indoor scenario-based simulation method for optimizing the AP placement.The main contributions of this work are outlined as follows:
(1) We propose an indoor scenario modeling method,which can provide information about the concrete walls and predict the number of potential access devices.In addition,we develop a management tool for managing and visualizing the indoor scenario model.
(2) With the assistance of the indoor scenario,a Gaussian process regression(GPR)-based RSS prediction model taking into account the effect of obstructing walls on the perceived RSS is preliminary proposed in this work.
(3) The proposed method implements the MOPSO algorithm searching the indoor scenario to determine the optimal AP placement.The localization accuracy and network access of the placement are considered in the optimization process.
II.INDOOR SCENARIO MODELING
2.1 Scenario Model
Generally,there are two data structures of the indoor scenario: precise vector models and semantic presentations.Building Information Modeling(BIM)and Indoor Geography Markup Language(IndoorGML)[25]are representative precise vector models.The semantic presentations are usually based on the network model,which abstract indoor space as nodes and the topological relationship between indoor spaces as edges,such as Geometric Network Model(GNM)[26],iNAV[27],Length-Optimal Routing Graph[28].
In the proposed scenario modeling-aided AP placement optimization method,we need to obtain the wall’s locations to simulate RSS measurement.The room’s area and function can be converted to the potential network access scale.The relationship of the indoor scenario is necessary to store the above data.The precise vector models contain a lot of information that is not needed in the AP placement optimization method.Moreover,the implementation of precise vector models is based on detailed measurement data,specialist and professional equipment.However,the information provided by the existing semantic presentations can not be used for signal simulation as well as network access metrics.To this end,we extend the information such as room attributes and the location of walls based on semantic presentations,which is applicable to our proposed scenario modeling-aided AP placement optimization method.
The scenario model consists of nodes,edges,and relations.The node denotes the intersections and rooms,and the edge represents the corridors in a building.As for rooms,some information is associated with the specific room,such as network access requirement and wall,which are represented byAandW,respectively.The indoor scenario model can be expressed as in mathematics:
whereVis the set of all nodes in indoor scenario model,Eis the edge set.The associating of the room and the wall is represented byfV W.Similarly,the associating of the room and the potential network access scale is represented byfV A.The schematic diagram of area state representation on the indoor scenario is presented in Figure 2.
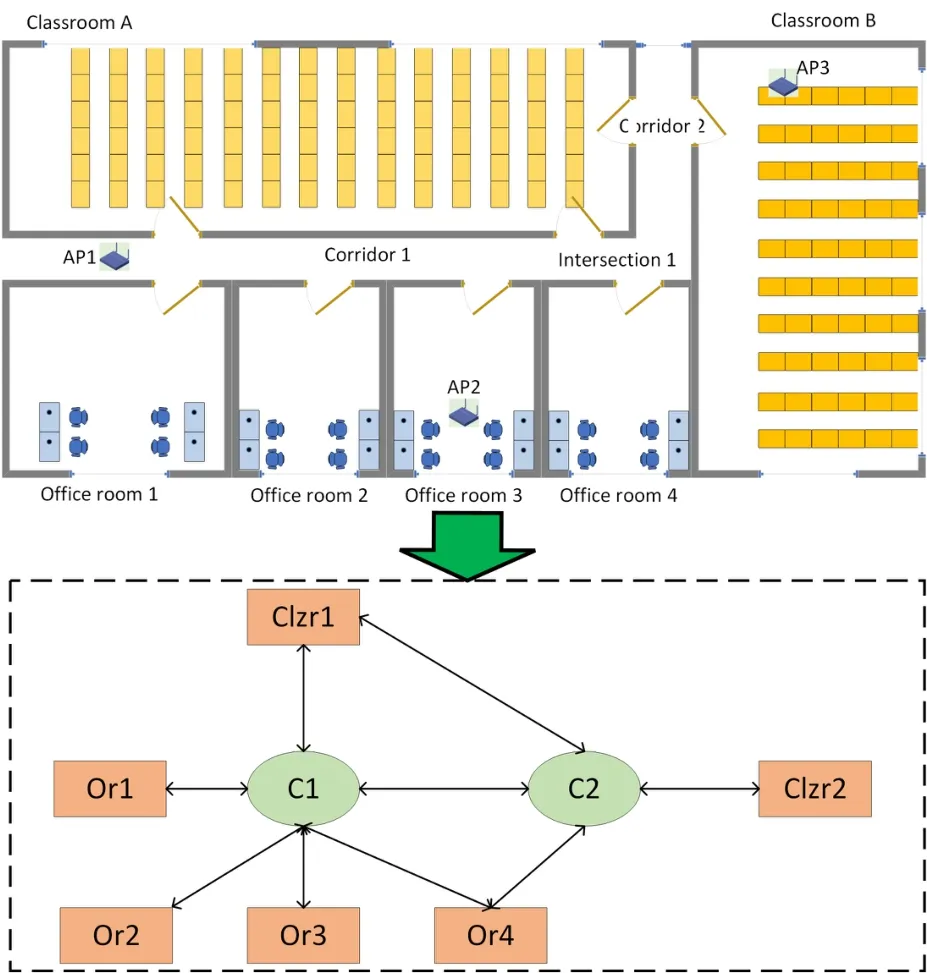
Figure 2.Schematic diagram of area state representation on the indoor scenario.
2.2 NLOS Detection
With the assistance of the indoor scenario model using vector format,the parameters required in the RSS prediction model can be obtained.Thus,the number and characteristics of walls between RPs and APs are computed by retrieving the objects between them.An NLOS detection method to calculate the number of walls,and the NLOS information is used in the RSS prediction model.The NLOS detection is based on the line segment intersection detection algorithm due to the walls are represented as the line segment in the indoor scenario model.Line segment intersection detection consists of the quick exclude check and the intersection check.In the quick exclude check,the endpoints of each line are used to make rectangles,respectively.If two rectangles do not intersect,the two line segments will definitely not intersect.If the quick exclude check cannot determine whether two line segments intersect,then a further intersection check is required,as shown in Figure 3.
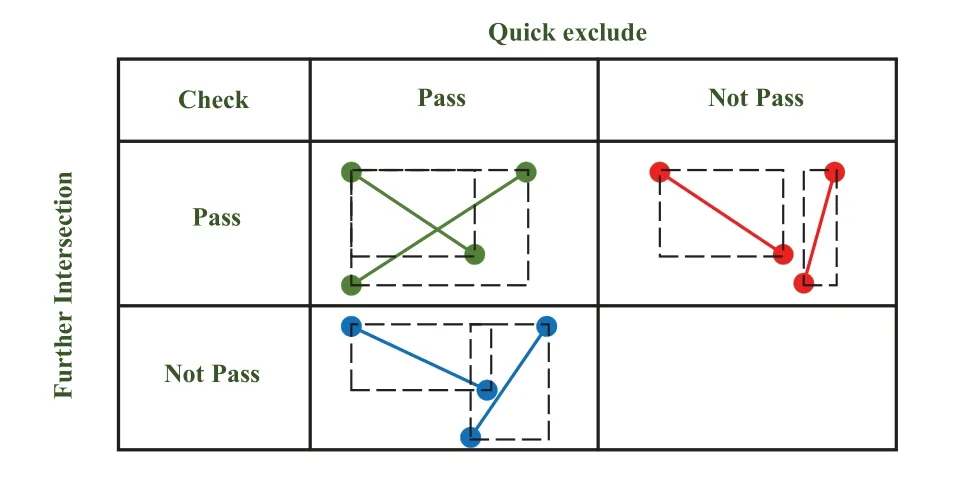
Figure 3.Schematic diagram of the line segment intersection detection.
III.OPTIMIZATION METHOD
3.1 RSS Prediction Model
Currently,wireless devices basically support real-time collection of RSS values[29],and the signal-to-noise ratio can be converted by spectral density and measured RSS values,due to which RSS is used as an indicator of the network access in many literatures[30,31].Generally,there are two main approaches to indoor RSS measurement modeling: empirical and deterministic propagation models[32].As for the empirical models,the RSS measurements are collected from the device,the channel model coefficients can be determined by using statistical analysis.Deterministic propagation models depend on the path loss model and the obstructions [33,34].In an indoor environment,concrete walls,load-bearing columns,doors and windows will bring different degrees of signal attenuation,so a relatively accurate estimation of RSS values is one of the basic guarantees to accomplish the objectives of the AP placement scheme.To this end,the RSS prediction model takes into account objects which obstruct signal propagation in an indoor wireless link.The pass loss involves two parts: the path loss between the transmitter and the receiver in lineof-sight(LOS)conditions,and the additional path loss caused by the objects[35]:
wherePLOSS(d) denotes the path loss between the transmitter and the receiver,andddenotes the distance.ALOSSrepresents the additional path loss.In an indoor area,walls and other obstacles often exist between the transmitter and the receiver,and the additional path loss can be expressed as:
whereNtypedenotes the number of obstacle types,Nn,idenotes the number of obstacles of the typei,plcdenotes the constant loss,pln,idenotes the pass loss due to the obstacles of typei.These value can be obtained from the indoor scenario modelSsc.
As for the path loss between the transmitter and the receiver,thePLOSScan be expressed by the One Slope(OS)model[35,17]:
whereddenotes the distance between the transmitter and the receiver,pl0denotes the reference path loss ind=0,λis the wavelength.For example,λ=2 andpl0≈40.22 dB in 2.45GHz.
As to the RSS prediction model,the simple log distance path loss model was adopted in most studies.However,the nature of wireless communication in indoor environments is complicated;a slight movement of a target can cause a dramatic change in the RSS.Thus,the general RSS prediction models may not be as accurate as we expect.Since the non-parametric nature of GP-based methods can mitigate this issue,the GP-based prediction method can be regarded as the virtual RSS map that predicts the RSS measurements between the APs and any arbitrary positions in the area of requirements.
Using the RSS measurements,the GP training is performed.In the Gaussian process regression (GPR)model,each sampleyican be expressed as:
Let a training setXofnsamples drawn from the above noisy process[34]:
wherexidenotes the input samples,yiis the RSS measurement at the samplexi,andεis the multi-path fading following a Gaussian distribution.Using the observations,the GP training is performed.
3.2 Coverage Metric
In this section,we introduce the metric for evaluating AP coverage.The indoor area is divided by grids,and a set of discrete reference points (grid vertex) is selected for evaluating the coverage of the specific AP placement.The effective coverage can be expressed as follows[36]:
whereA(Ssc) denotes the number of the grids in whole area(m×n),mdenotes the grid vertex number in x-axis andndenotes the grid vertex number in yaxis.C(Z,Ssc)represents the sum number of the grids in the coverage area,C(Z,Ssc)=andRidenotes thei-th gird.The coverage functionCi(Ri,Ssc)is expressed as follows:
3.3 Network Access Metric
Due to the limitation of the number of network access devices for an access point,the optimal AP placement scheme may not satisfy the requirement of network access.Network coverage is related to the size of the region.However,the performance of the network access is related to the potential area access devices.Thus,we need to propose a method to evaluate the network access metric.The process of the network access evaluating method is illustrated in Figure 4.
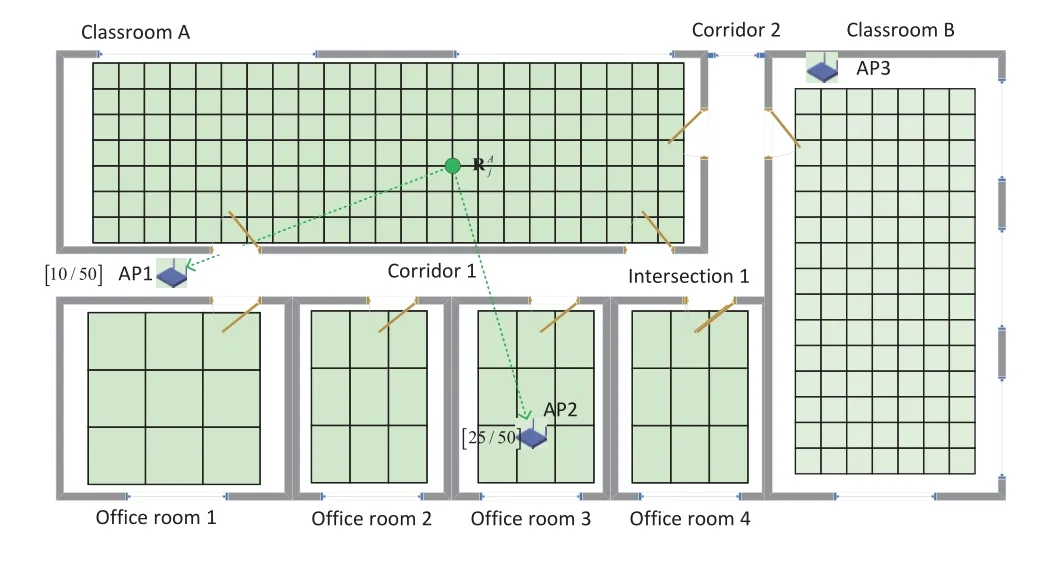
Figure 4.The process of the network access evaluating method.
According to the potential access number of the region from the indoor scenario model(Eq.(1)),the region is divided by the grid,each vertex of the grid represent the reference point of the network access.The reference points of the network access in regioniis expressed as Ri={represents the coordinate of then-th reference point.After that,we search the available APs for thej-th reference point.The number of nodes already connected to thei-th AP is denoted byAci.Thus:
whereRSS(i,j) is the predict RSS measurement between thej-th reference point and thei-th AP,which can be obtained by the proposed indoor scenario model and RSS Prediction model.Crssrepresents the access threshold.If there are more than two APs that can be accessed,one of them will be accessed randomly.
While all reference points have been accessed,the access unbalance rate (AUV) ofi-th AP can be expressed as:
whereMa=NR/NPrepresents the average access number of the AP,which is the balanced access number.From the definition of AUV we can see that access to too many and too few devices can lead to imbalance.NRis the number of reference points(potential access devices)andNPis the number of APs.Then,the network access metric can be expressed as:
whereNapis the number of the APs.
3.4 Localization Metric
Without loss of generality,the RSS measurements fromnAPs at a locationTare denoted as vectorRSS=[RSS1,RSS2,···,RSSn],which are independent and identically distributed random variables.The RSS measurement model can be expressed as:
wherem(T)=[m1(T),m2(T),···,mn(T)]Tdenotes a vector function of mean RSS measurements at the positionTfromnAPs,Inandσ2denote the identity matrix of ordernand measurement error,respectively.The localization problem can be solved through the maximum likelihood estimator(MLE):
Hence,the fisher information matrix (FIM) can be formulated as:
whereG=[g1,g2,···,gi]T,andgi=[gi,1,gi,2].
According to [37],the Cramer-Rao lower bound(CRLB)can be expressed by FIM:
Generally,the trace of the CRLB is utilized to denote the lower bound on the mean squared error(MSE)of any unbiased localization algorithm:
whereθijis the angle subtended by two vectorgiand.
3.5 AUV-CRLB-Aimed MOPSO
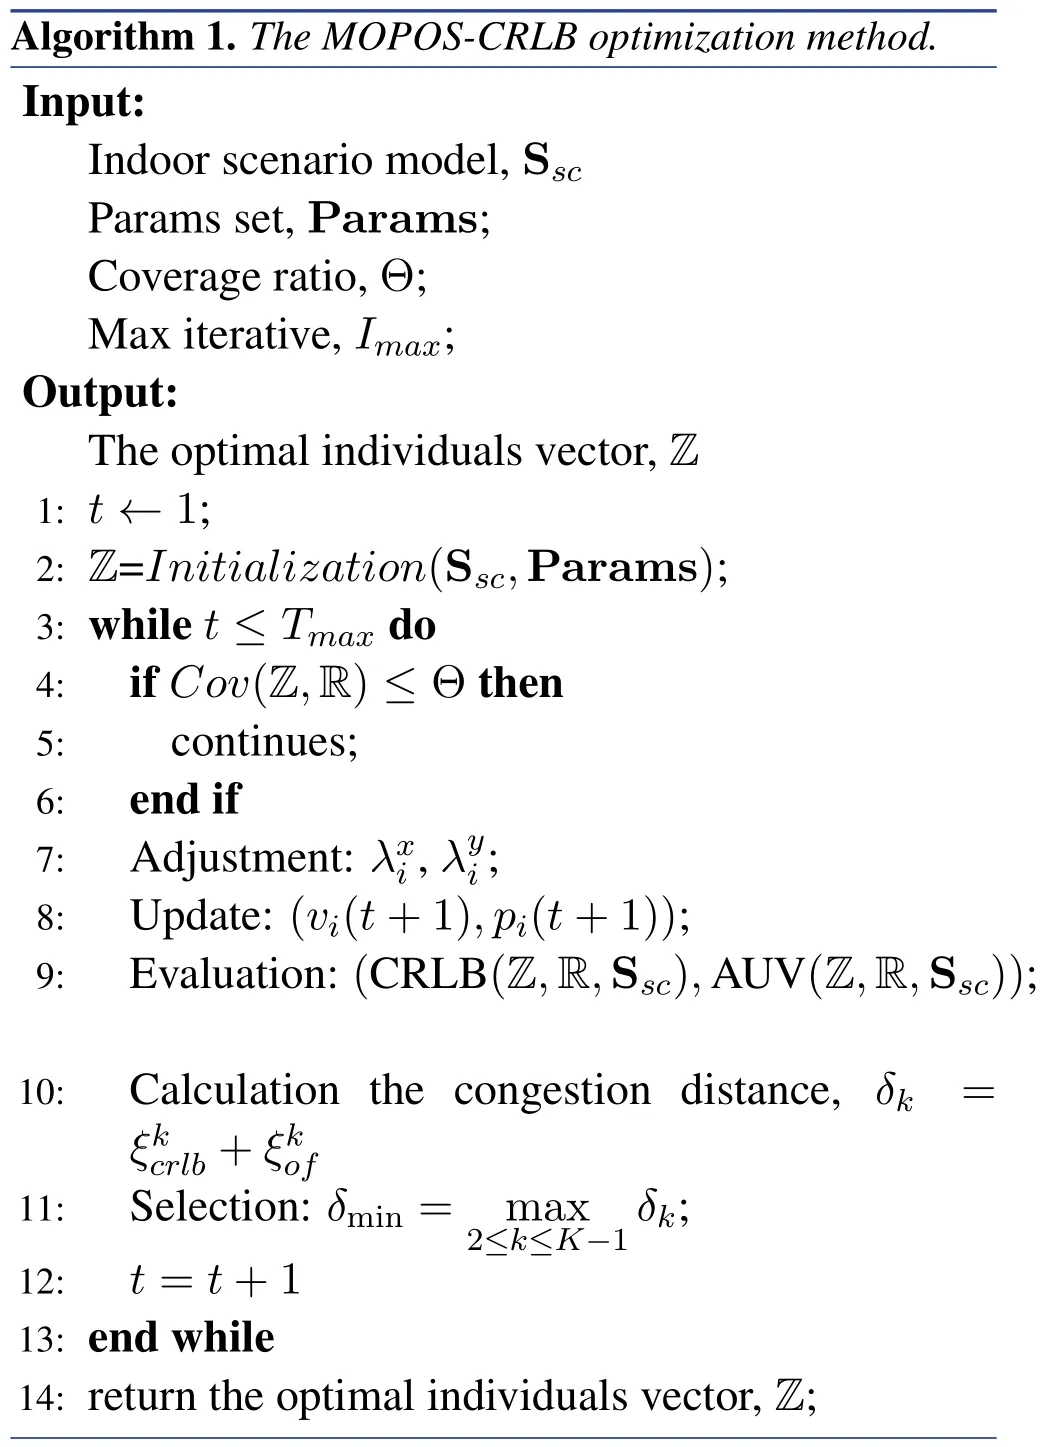
In the proposed scenario modeling-aided AP placement optimization method,the optimization objective consists of the localization performance(evaluated by CRLB(·))and the network access performance(evaluated by AUV(·)),the placement Z is our solution in this optimization method.The specific indoor scenarioSscand reference point set R are important bases for evaluating the localization and the network access performance.Regardless of the performance of the AP placement for improving whatever function,its coverage capability is the most fundamental limitation of the AP deployment,since the AP placement itself is designed to provide network services to the building.Similar to the previous work,the coverage of AP placementCov(Z,R) needs to be limited to satisfy the basic requirements of network services.Thus,the objective of the proposed indoor scenario modelingaided AP placement optimization is expressed as:
where Z denotes the AP placement,R represents the coordinates of the reference points,Sscis the indoor scenario model.
The problem of the AP placement optimization is high-dimensional and has multiple locally optimal solutions,and searching for the optimal AP placement in a large indoor area is essentially NP-complete.A modified PSO-based solution is implemented to reduce the search space.Thus,in the proposed AUV-CRLBaimed MOPSO AP placement optimization method,we introduced the Pareto front-based optimal MOPSO algorithm to evaluate the AP placement scheme.The steps are given below:
(1)Initiation:Suppose thatNsparticles are selected for the optimal solution.In the initialization phase of the algorithm,each particle initializes its position and velocity,and the evaluation of each particle is calculated by the objective function and initial AP placement.After that,the evaluations of all particles can be obtained,and the non-dominated solutions of the initial phase are selected and stored in an external archive file.The initial individual optimum of each particle is set to its initial position,while the global optimum solution is selected using the congestion distance (CD)based method.
(2)Evaluation and selection:The global optimal solution selection method based on the crowding distance is given below.Suppose that there areKnondominated solutions in the external archive file,the calculation of the congestion distance is given for thek-th non-dominated solution as an example.First,the position of thek-th non-dominated solution in this work is given as:
Thek-th non-dominated solution of the congestion distance can be expressed as:
where:
Since expanding the Pareto front is an important criterion of multi-objective optimization solutions (a larger Pareto front means that a larger space can be dominated,accommodating more non-dominated solutions and providing more solutions).The relevant definition of the Pareto optimization principle can be found in the literature[38].Thus,the solutions located at the edge of the Pareto front are given the maximum congestion distance:
(3) Update: In each iteration (for example,thei-th particle att+1-th iteration),the particle updates its velocity and position according to the following:
wherevi(t+1) indicates the current velocity of the-th particle.In the searching process,the particle updates its position by the optimal position searched by itself (represented by(t)-xi),and the optimal position searched by all particles is represented bywidenotes the time-varying folding factor such that it decays with the number of iterations(wi=0.9-0.5(i/Imax)).c1,c2are positive constants called learning factors,which are usually set to 2.r1,r2are random numbers in the[0-1].Piis the position of thei-th particle.
After the individual optimal solutions are updated,all optimal solutions in the current iteration are compared with the non-dominated solutions stored in the external archive file,and the new set of non-dominated solutions is selected and stored in the external archive file.
(4) Virtual repulsion force-based adjustment: To prevent the MOPSO algorithm from falling into a local optimum solution too early in the iterative process,virtual repulsion force is used to adjust the position of the relay drones updated in each iteration to make the position of the relay drones more balanced.Suppose that the i-th individual receives the repulsive force from the j-th individual in the vicinity defined as:
wherewdenotes the repulsion weight,di,jdenotes the Euclidean distance betweeni-th individual andj-th individual,andθi,jdenotes the angle betweeni-th individual andj-th individual.Let the movement steps of individuals on the x,y axes be,,respectively.The position adjustment can be expressed as:
Finally,based on the crowding distance of all nondominated solutions in the external archive file,the global optimal solution of the current iteration stage is selected,the specific process is illustrated in Algorithm 1.
The computational time complexity of individual discrete variable updates isO(N×m),m <Nand the computational time complexity of continuous variable updates isO(N).The worst-case situation is considered when updating the optimal position of an individual,i.e.,the constraint violation multiplier and the function value optimization multiplier are calculated for each individual update,then its computational time complexity isO(N).In summary,the time complexity of the AUV-CRLB-aimed MOPSO algorithm does not exceedO(N×m)≃O(N2)in the worst case.Compared to the previous work,the proposed AUV-CRLBaimed method adds additional computational overhead due to the consideration of indoor scenarios.Assuming that the number of enclosures isPand the number of APs isQ,each signal simulation requires iterationsP×Q.
IV.SIMULATION TOOL AND EXPERIMENT
4.1 Indoor Scenario Modeling
Modeling the indoor scenes is important for simulating RSS measurements between the APs.With the application of the specific indoor scenario,the RSS prediction model can detect the number and information of obstacles,which block the propagation path,and predict the RSS measurements.Figure 5 shows the graphic user interface(GUI)of the management tool.
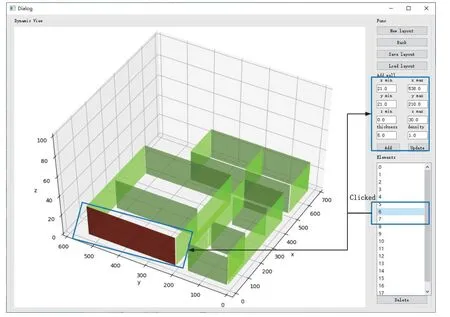
Figure 5.Indoor scenario management GUI.
The main window consists of four major view panel:a 3D scenario viewer (center),file management buttons (upper right),line editors of the wall attributes and a wall management list-view (bottomed right).The scenario can be displayed in the center,users can rotate and zoom in to view the indoor scene.When the user clicks on the wall ID in the wall management list-view,the selected wall will be marked in red,and its related attributes will be displayed in the line editor.The user can select a specific wall to modify the related attributes and save it.
In an indoor environment,signal propagation is blocked by walls with a high probability.Without considering the indoor scenario,the LOS and NLOS measurements are randomly generated (as shown in Figure 6a).An extreme example is shown in Figure 6b,all the randomly generated RSS measurements are under the LOS condition,which deviates significantly from the real-world measurement,and the simulation results are not representative.In the proposed indoor scenario-based RSS prediction model,it is clear from Figure 7 that the proposed method can effectively generate realistic LOS and NLOS signal propagation.
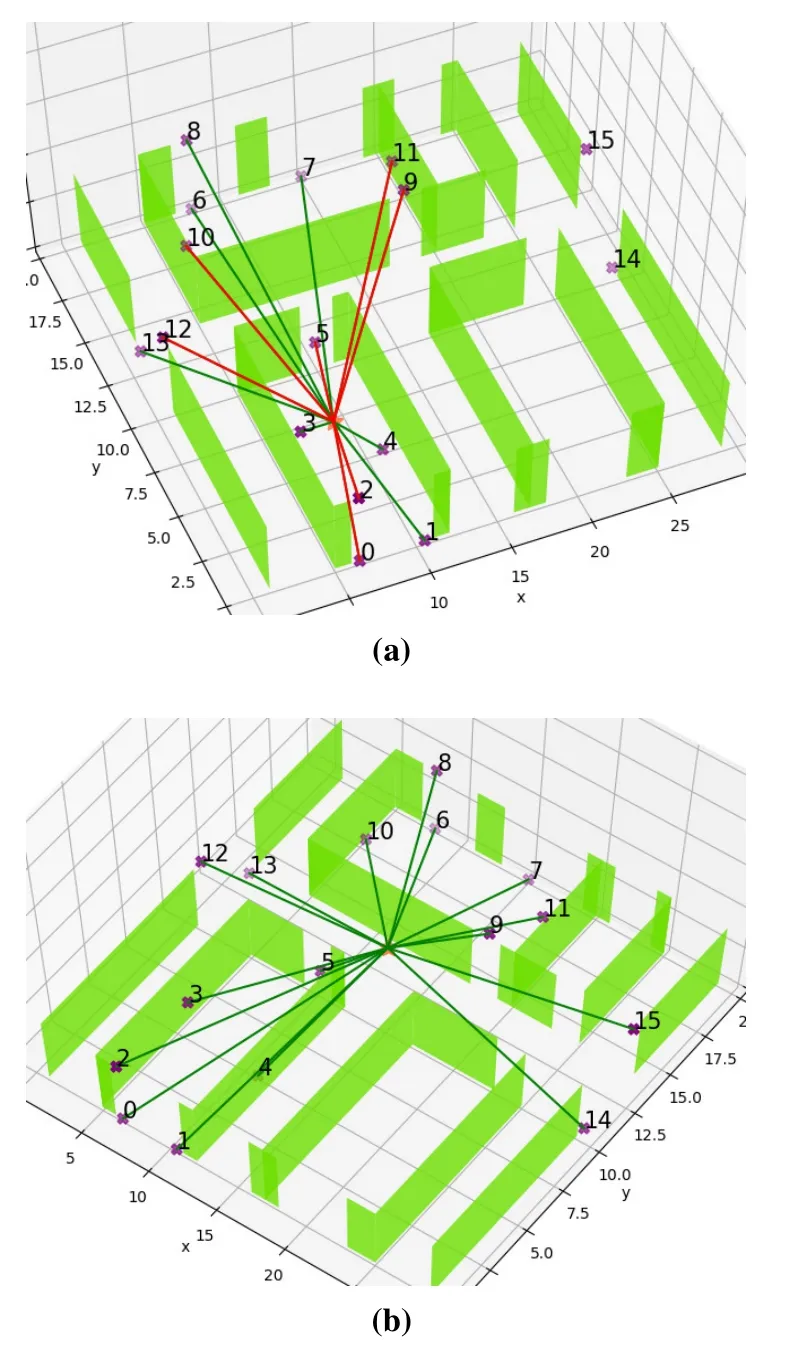
Figure 6.LOS and NLOS measurements generated by random method.
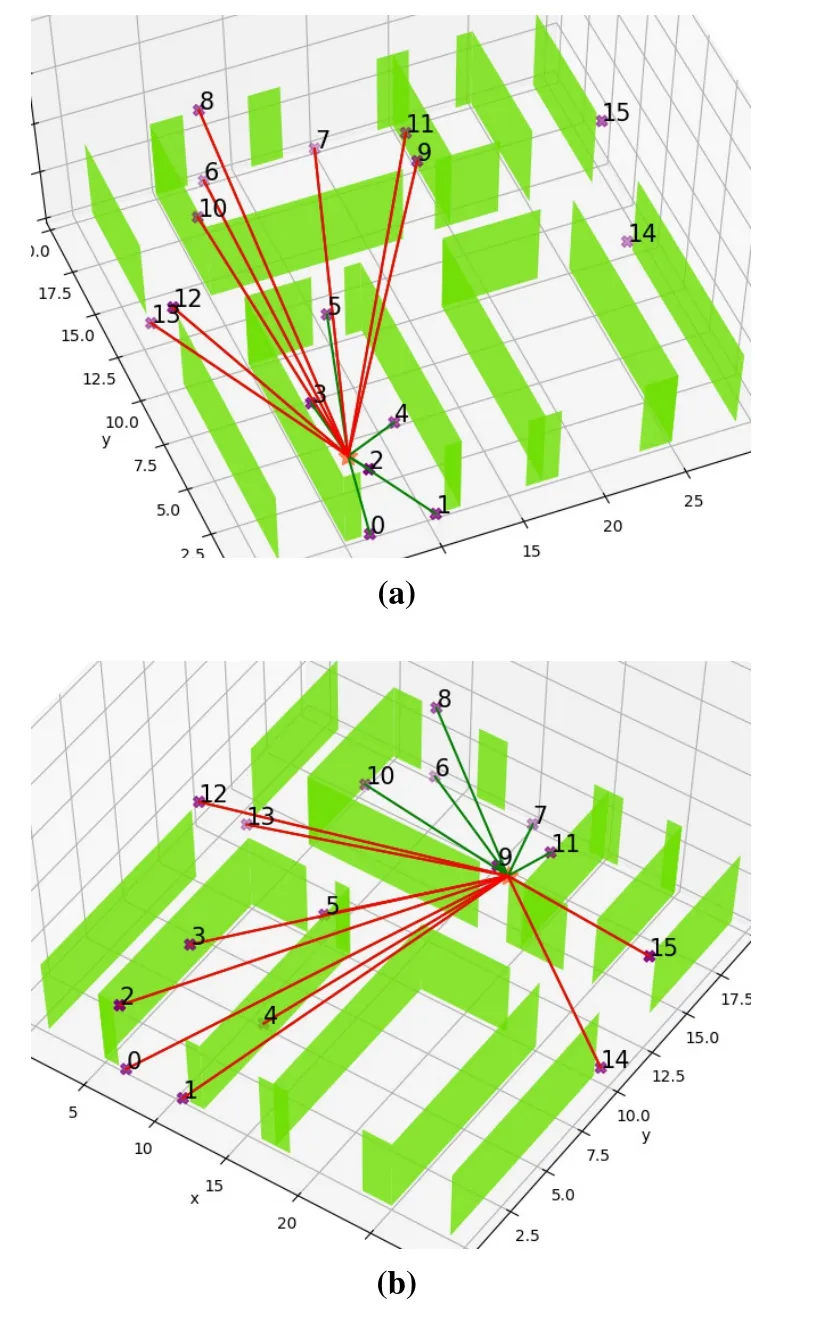
Figure 7.LOS and NLOS measurements generated by proposed method.
4.2 RSS Measurements
In this experiment,a cellphone is used to collect the RSS measurements from an AP working at 2.45 GHz.92 collecting points in a corridor (LOS/NLOS mixed environment) and 72 collecting points in an office room(LOS environment),which are divided by grids.We collect 20 sets of RSS measurements at each collecting point.The collected RSS measurements are divided into two groups,one is for training,and the other is for testing.About 20%of the data is used for validation,and the other measurements are used for training.
Figure 8 shows the prediction results,and the purple line depicts the RSS values predicted by the log distance path loss (LDPL) model,which is generally used in previous works.The red line depicts the proposed model.True RSS measurements are plotted in blue points.The white and gray backgrounds represent the training/validation and testing regions,respectively.Figure 8a shows the prediction RSS in the LOS (slight interference exists) environment,which was collected in an office room.Figure 8b shows the prediction RSS in the LOS/NLOS mixed environment.The empirical distance-based LDPL model can predict RSS values with acceptable accuracy in the LOS environment.However,the prediction values are significantly lower than the actual values in the LOS/NLOS mixed condition.
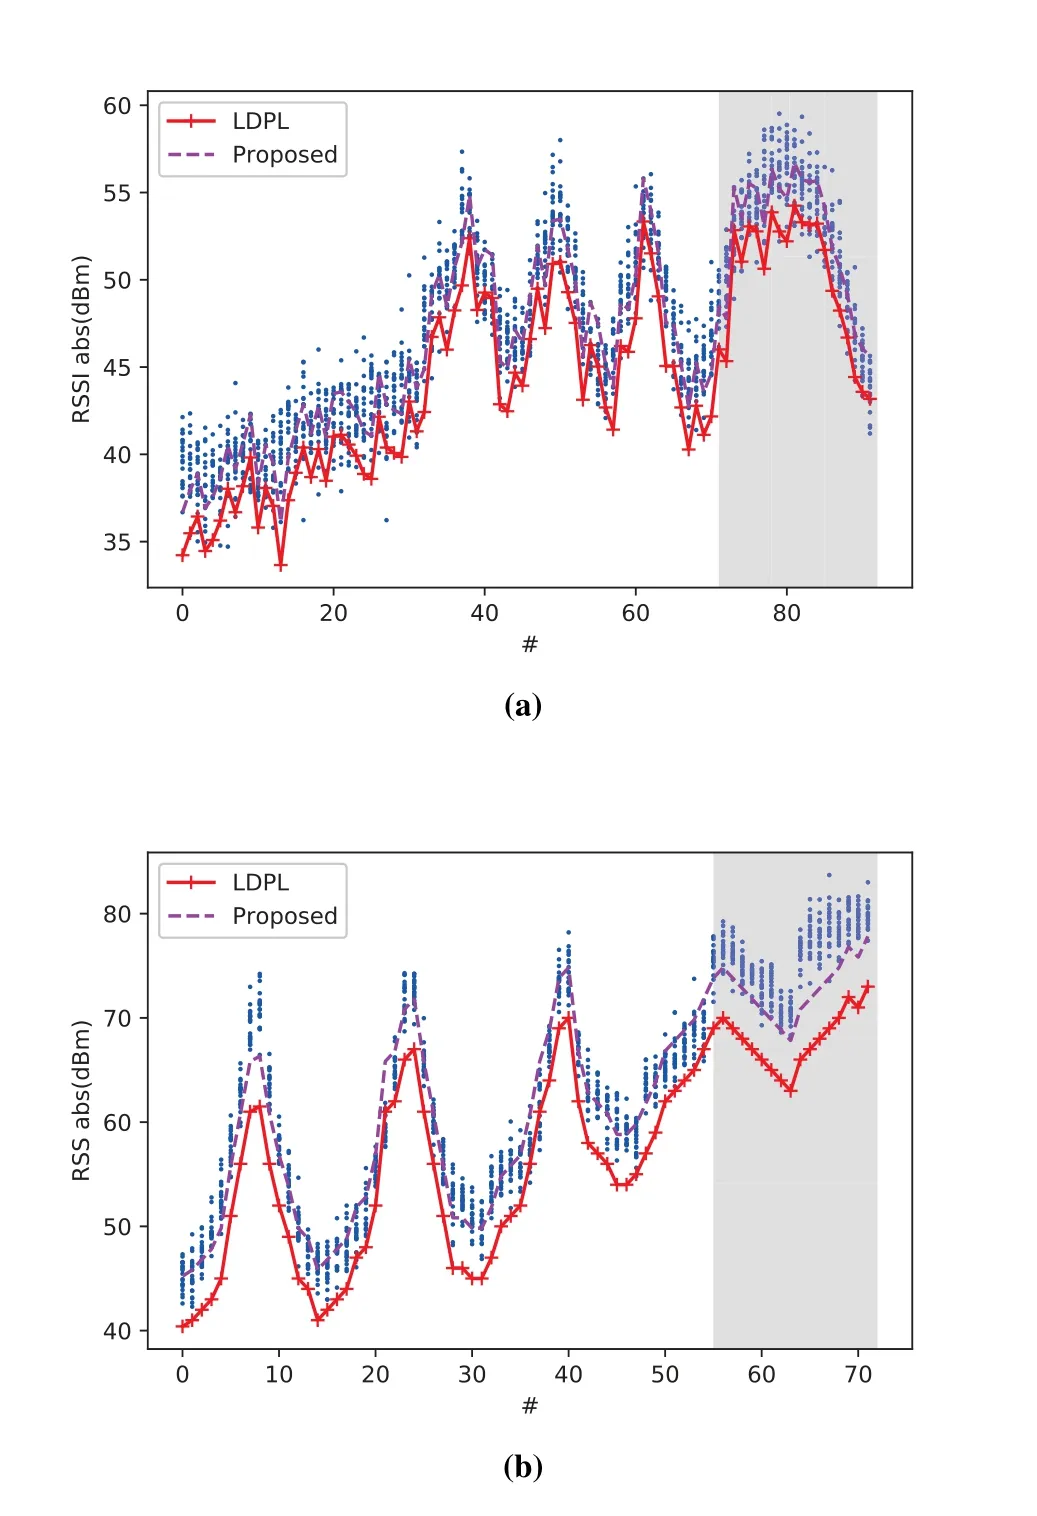
Figure 8.Predicted RSS measurement by different methods and training measurements in different conditions(The green line denotes the proposed RSS prediction model,the red line represents the empirical distance-based LDPL model).(a)LOS condition.(b)NLOS/LOS mixed condition.
In fact,the measuring RSS value increases significantly when some obstacles influence the propagation path.The empirical distance-based LDPL model does not consider the environmental factors for prediction.Then,not surprisingly,the accuracy of the proposed RSS prediction model is better than the general used LDPL model.To sum up,the proposed RSS prediction model has better performance with the help of measured data and the GPR training process,but it requires more measuring work to collect training data.From the results,we can infer that the indoor scenario and GR training process play a key role in RSS prediction.
4.3 Localization and Network Access
We compare the resulting localization accuracy and network access quality given the optimal AP placement returned by the four schemes (The proposed AUV-CRLB-aimed MOPSO,Random,Coverage-CRLB[21]and Coverage-FD[16]schemes).The experiment configuration is illustrated in Figure 9.Provided that the grid distance is 1m,the vertex of the grid denotes the reference point that uses in radio map construction.The test point is represented by the purple triangle.It is notable that the number of the test point in a region is associated with the network access requirement.As shown in Figure 9,suppose that the potential network access number in TestArea1 is larger than that of region TestArea2,and the area of these two test region is similar,but the number of the test points is different.
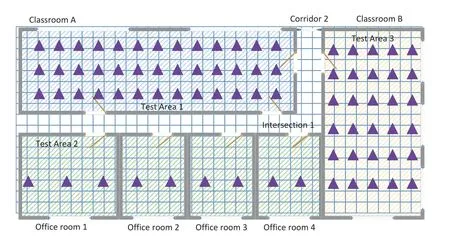
Figure 9.Experiment configuration, the purple hexagons represent the test points of the UWB anchors.
The placement of five APs is optimized in this experiment.As for the localization performance of the placement optimization method,Figure 10 reports the average localization error and the cumulative distribution function (CDF) of four comparison placement scheme.The proposed MOPOS-CRLB placement has a slightly large localization error that the Coverage-CRLB placement that is purposely optimized for localization performance.Not surprisingly,the Random placement has non-optimal localization performance compared to other schemes.
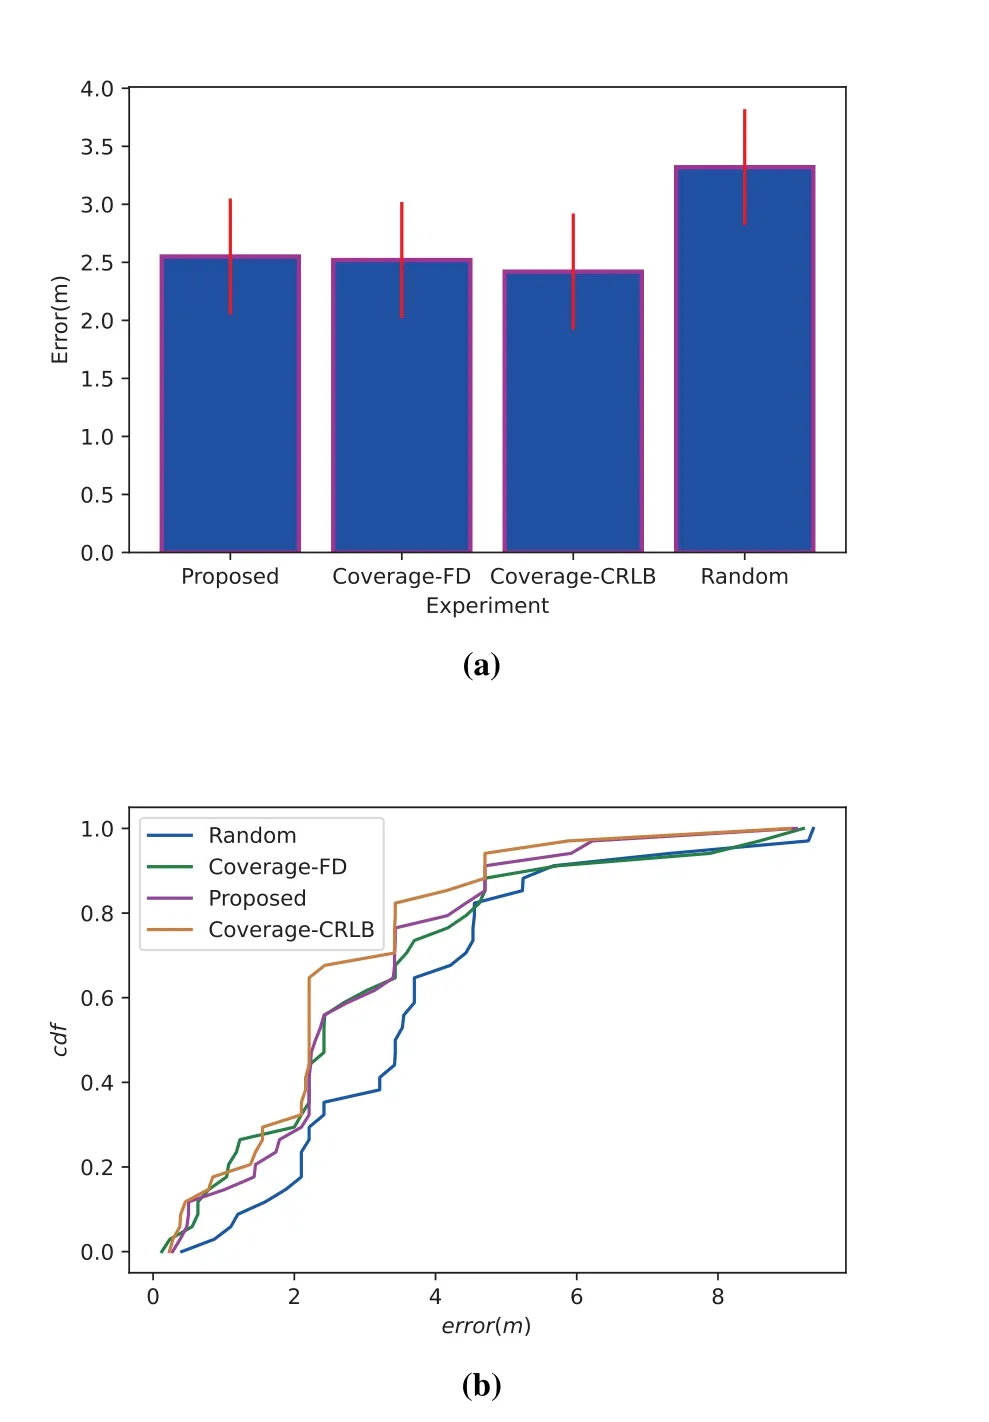
Figure 10.Comparison of localization performance with different AP placement methods. (a)Localization error(m).(b)CDF.
Figure 11 shows the bar plots of the average RSS and AUV (introduced in section 3.3).As for network access,the proposed MOPOS-CRLB placement has significant improvement that compares to other localization performance-oriented AP placement method.This is attributable to the fact the localization performance-oriented AP placement optimization method causes the APs to be placed across the edge of the region.The proposed method leverages redundant APs to optimize network access.
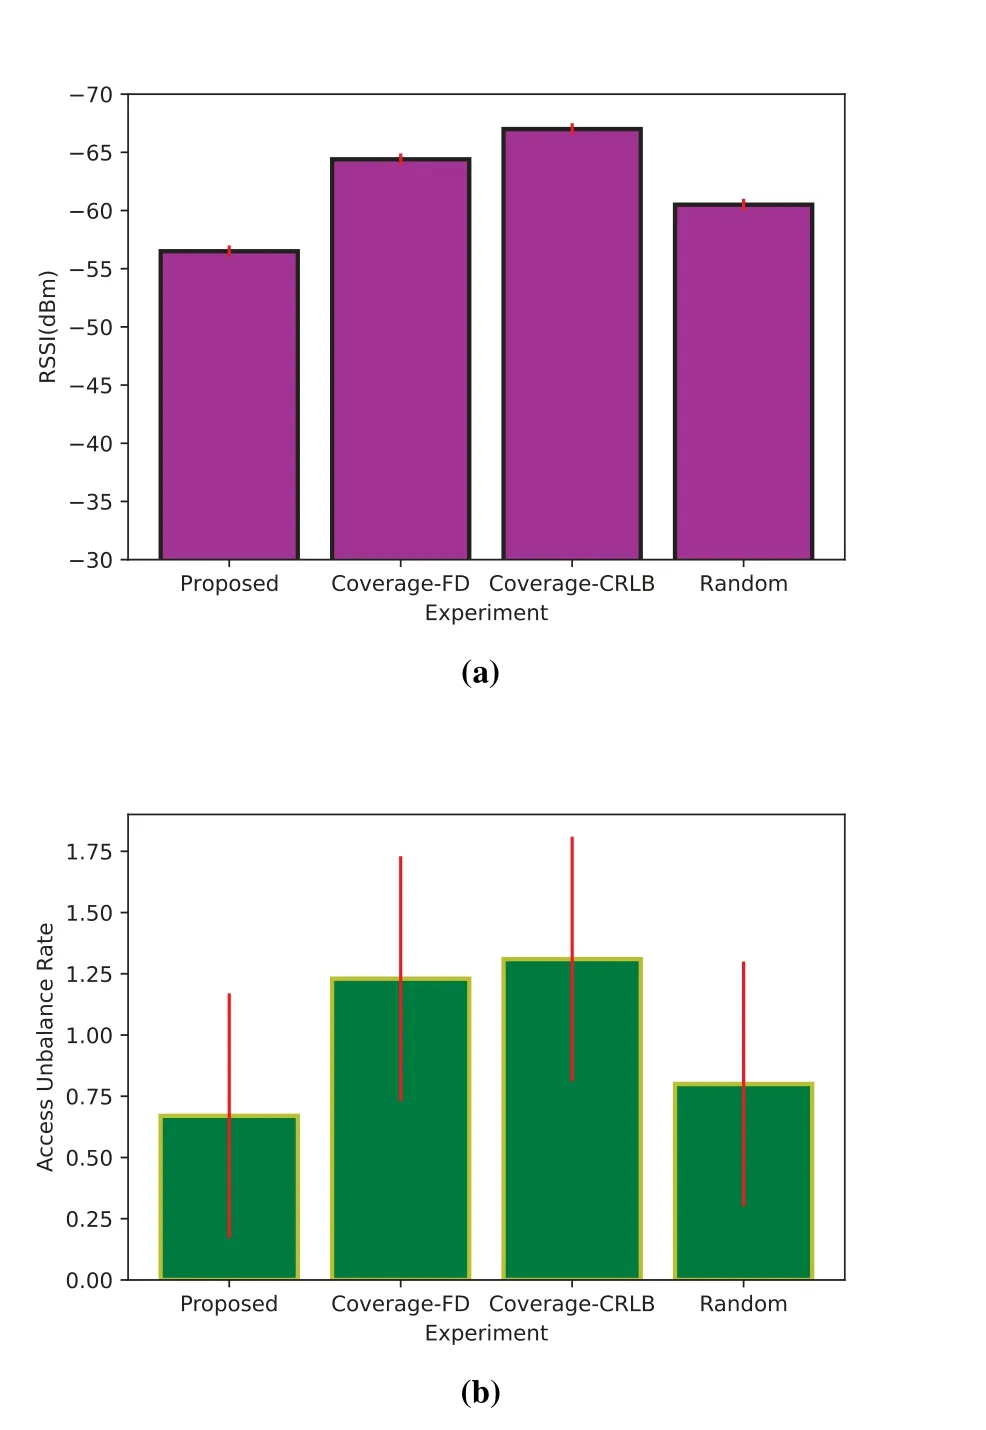
Figure 11.Comparison of network access performance with different AP placement methods. (a) Average RSS value. (b)Access unbalance value(AUV).
4.4 Small-Scale Experiment
In this section,we conduct a small-scale experiment to evaluate the effectiveness of the proposed method.
Due to the installation limitation experiment area for the Wi-Fi Routers,4 cellphones with hotspots on are deployed as wireless access points at 2.45 GHz.In this experiment,three rooms and two corridors are accessible,and 90 RPs are selected to evaluate the localization and network access performance.An android application (named OpenCollector) is used to collect the fingerprint,and we use WiFiAnalyzer to obtain the specific information of the network access.The scenario and applications are shown in Figure 12.
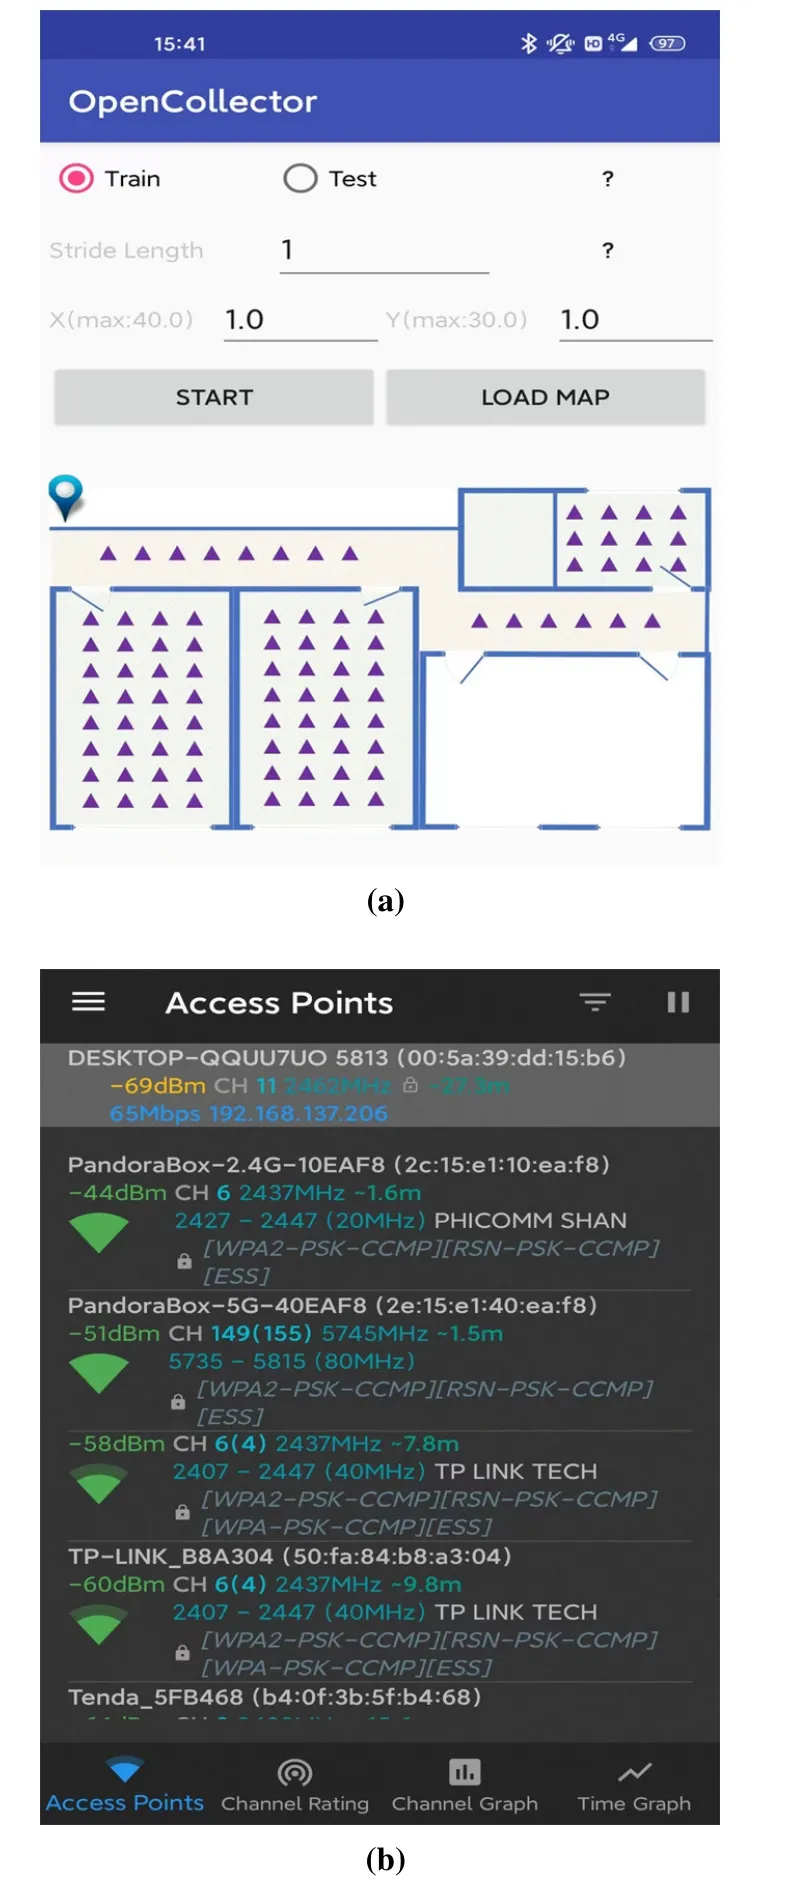
Figure 12.The scenario and tools in the small-scale experiment.
The experimental results are shown in Table 1.Since a small number of APs can make the localization error fluctuate,we used other fixed APs (already deployed in the floor)throughout the localization process.Thus,the gap between the localization results of different AP deployment methods is close.As for the network access performance,the proposed indoor scenario modeling-aided AP placement optimization method has more advantages.The indoor scenario makes an important contribution.As for previous placement schemes,the specific indoor scenario is not fully considered.This results in many RPs being able to be covered in the simulation,while in reality some RPs cannot be covered due to the signal being blocked by the concrete walls.

Table 1.Comparison of localization and network access performances with previous without indoor scenario optimization for anchor placement.
V.CONCLUSION
In this study,we propose an indoor scenario modelingaided AP placement optimization method for improving localization accuracy and network access.An in-door scenario modeling and Gaussian process-based RSS prediction method are proposed for improving the accuracy of the simulation-based AP placement optimization process.After that,we introduce the metrics of localization and network access performance,and propose the AUV-CRLB-aimed MOPSO AP placement optimization method.Pareto front criterion and virtual repulsion force are applied to determine the optimal AP placement.Comparison experiments show the effectiveness and improvement of the proposed indoor scenario modeling method,RSS prediction model and AP placement optimization method.
However,the scope of the communication quality is too wide,and network access is only a small part of the overall communication quality.Due to equipment installation limitations,we are unable to conduct largescale AP placement experiments in a whole building.In the future,we will focus on improving the AP placement method to make it suitable for improving both the communication quality and localization accuracy in multi-story environments.
ACKNOWLEDGEMENT
The authors sincerely acknowledge the editors and the reviewers for their insights and comments to further improve the quality of the manuscript.
- China Communications的其它文章
- Space/Air Covert Communications: Potentials,Scenarios,and Key Technologies
- Improved Segmented Belief Propagation List Decoding for Polar Codes with Bit-Flipping
- Off-Grid Compressed Channel Estimation with ParallelInterference Cancellation for Millimeter Wave Massive MIMO
- Low-Complexity Reconstruction of Covariance Matrix in Hybrid Uniform Circular Array
- Dynamic Update Scheme of Spectrum Information Based on Spectrum Opportunity Incentive in the Database-Assisted Dynamic Spectrum Management
- Channel Estimation for Reconfigurable Intelligent Surface Aided Multiuser Millimeter-Wave/THz Systems

