Modeling and experimental validation of vertical landing reusable launch vehicle under symmetric landing conditions
Shui YUE ,Qing LIN ,Gung ZHENG ,Zhonghu DU
a School of Mechanical Engineering,Nanjing University of Science and Technology,Nanjing 210094,China
b Aerospace System Engineering Shanghai,Shanghai 201109,China
c Key Laboratory of Impact and Safety Engineering,Ministry of Education,Ningbo University,Ningbo 315211,China
KEYWORDS Dynamics;Impact;Landing gear;Launch vehicle;Modeling
Abstract This paper illustrates the dynamic modeling,experimental validation of Reusable Launch Vehicle under symmetric landing mode.Firstly,a new quasi-3D dynamic landing model of vehicle under 2-2 and 1-2-1 symmetric landing mode is established,which can predict the plane motion of the main body and the spatial motion of landing struts and footpads.The strut force,footpad-ground contact force and the liquid spring damper are also included in the model.Secondly,the landing impact experiments are performed for 2-2 and 1-2-1 symmetric landing mode.The main and auxiliary strut force are obtained,along with the force-stroke diagram of damper.By comparing with experimental data,the accuracy of simulation model is verified.It is found that the simulation model possesses good match with tested responses in damping stroke and main strut force.The simulation and experiment also indicate the same trend in auxiliary strut force and main body acceleration.The main discrepancies attribute to the simplified structural flexibility and nonlinear contact.
1.Introduction
Due to the reduction of flight cost and the increase of launching flexibility brought by Reusable Launch Vehicle(RLV),many organizations take RLV as a potential way for space transportation.1For the vertical landing RLV,touchdown is the final step for recovery which closely relates to the success of whole mission.2In addition to the high center of gravity for RLV,the landing velocity,rotation angle,ground angle and friction force can be uncertain during touchdown.3These would increase the landing impact and reduce the altitude stability,complicating the research of landing performance.Therefore,it is necessary to study the attenuation characteristics for dampers in different struts and the dynamic responses of RLV under multiple vertical landing conditions.
The research on landing dynamics of vehicles and landers are mainly based on the following methods.Some scholars study the dynamic performance through establishing the simplified single-leg landing model.4–6This model can illustrate the dynamic responses of main body in vertical direction and footpad in planar motion,which can be used to investigate the damping characteristics.But the rotation angle and angular velocity of main body fail to be calculated in this model,causing the lack of landing stability analysis.Some scholars conduct two-dimensional dynamic analysis of launch vehicle under symmetric landing conditions.7–10Compared with 3D dynamic model,the 2D model possesses less Degrees-of-Freedom (DOF),resulting in the higher calculation efficiency to obtain responses under multiple landing conditions.But these studies lack the description in conversion of four strut forces and footpad-ground contact forces from 3D space to 2D symmetric plane,which is complex and directly affects calculation accuracy.Therefore,the accuracy of 2D dynamic model cannot be guaranteed.Some other scholars develop the 3D landing dynamic model and perform analysis of landing performance under certain conditions.11–13Although the 3D dynamic model can generate accurate results,it usually has considerable DOF,increasing the calculation time span and the difficulty of parameter analysis,especially with large amount of landing conditions.Besides,the design and analysis of RLV landing system are basically based on symmetric landing conditions.14,15Thus,many studies with 3D dynamic model still focus on analyzing performance under symmetric conditions,which further cause limited practical significance of the 3D model in engineering.
Following these investigations,a quasi-3D dynamic landing model of vehicle under 2-2 and 1-2-1 symmetric landing mode is established,which maintains both the calculation accuracy and efficiency.This novel model takes considerations of the plane motion of the main body,the spatial motion of footpads and the lateral load of landing struts.A dedicated landing impact system is then developed and employed to conduct experiments under symmetric conditions.The conditions include two landing modes with different horizontal velocities and tilt angles.The obtained experimental results are employed to verify the simulation.Among the novel aspects of this work is the development of the quasi-3D dynamic model and model validation performed under different test conditions.The purpose is to demonstrate the feasibility of quasi-3D dynamic model and present the different dynamics responses of RLV with liquid spring dampers under 2-2 and 1-2-1 symmetric landing conditions.
The structure of the paper is as follows: Section 1 presents an overview of the relevant research and the main contributions of this work.Section 2 provides the working principle of landing system for RLV.Section 3 investigates the dynamic model of the RLV under symmetric landing conditions.Section 4 includes the setup of landing impact experiments.Section 5 concludes this research with the validation study of the quasi-3D model.
2.Working principle of landing system for RLV
The structure of the landing system for the vertical landing RLV is illustrated and the working principle of the damper in landing strut is demonstrated in this section.
The overall scheme of the landing system is shown in Fig.1.The configuration of this retractable four-legged landing system is inspired by the existing engineering-based design.16Each landing leg includes main strut and auxiliary strut.Main strut consists of one liquid spring damper located at the lower end and four deployable cylinders actuated by pneumatic force.Footpad is fixed at the lower end of auxiliary strut and directly contacts ground during touchdown.
When the vehicle is launched,the landing system is in a stowed condition and the main strut remains at its retracted state.Before touchdown,the four deployable cylinders are unfolded by pneumatic power successively to support the energy absorption by dampers.The composition of damper is also shown in Fig.1.The damper is composed of outer cylinder,piston,piston road and sealing components.The piston rod is fixed with deployable cylinders and the outer cylinder is attached with auxiliary strut through spherical joint.
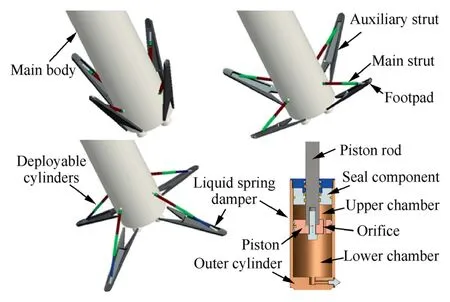
Fig.1 Overall scheme of landing system for RLV.
When the piston rod compresses,the fluid flows from lower chamber to upper chamber,which generates the pressure loss between two chambers.This process converts part of the landing energy into the fluid heat.Besides,with the growth of compression stroke,the piston rod reduces the total volume of chambers and further compresses the fluid.Therefore,the fluid,which belongs to a type of highly compressible dimethyl silicone oil,generates spring force in the damper to store other parts of the landing energy.The friction force of sealing components should also be considered during compression and extension of damper.
3.Soft-landing dynamic model
Symmetric landing of RLV can be divided into two modes,which are 1-2-1 and 2-2.17The dynamic model for RLV is established under these landing modes,respectively.Due to the force balance of main body perpendicular to the symmetric plane,the model only analyzes the planer motion of main body.But the spatial motion of footpad is considered in the model for calculating the strut force and footpad-ground contact force accurately.Given the combination of equations built under 2D plane and 3D space,the dynamic model is called quasi-3D model.The modeling process of different landing modes are demonstrated separately.
3.1.Case 1: 2-2 landing mode
3.1.1.Model assumptions
The main and top view of RLV with 2-2 landing mode are shown in Fig.2,along with the number and configuration of different landing legs.The following assumptions are made before the establishment of dynamic model under symmetric landing modes:
(A) The RLV is divided into one elastic mass and four inelastic masses.The elastic mass includes the main body,three deployable cylinders,the piston rod of liquid spring damper and half of auxiliary strut.The inelastic mass consists of the envelop of damper,footpad and the other half of auxiliary strut.18
(B) The elastic mass is concentrated at the gravity center of RLV and possesses two translational and one rotational motion in the symmetric plane (3 DOF in total).The inelastic mass,which is concentrated at the gravity center of each footpad,has three translational motion in space.
(C) The auxiliary strut is simplified as a rod with nonlinear stiffness and damping.The ground force perpendicular to the auxiliary strut axis is directly transferred from the footpad to the revolution joint of main body.
(D) The entrapped air and vapor are uniformly distributed in the liquid.The pressure,fluid density and effective bulk modulus are defined as lumped parameters for each working chamber.19The nonlinear contact model is employed for calculating the contact force between footpad and ground.20The modified Reset Integral model is adopted to obtain the friction force.21
To describe the ground slope,pitch angle and velocity angle of RLV during touchdown,the inertial coordinate system,ground coordinate system,body coordinate system and strut coordinate system are introduced and shown in Fig.2.They are defined as follows.
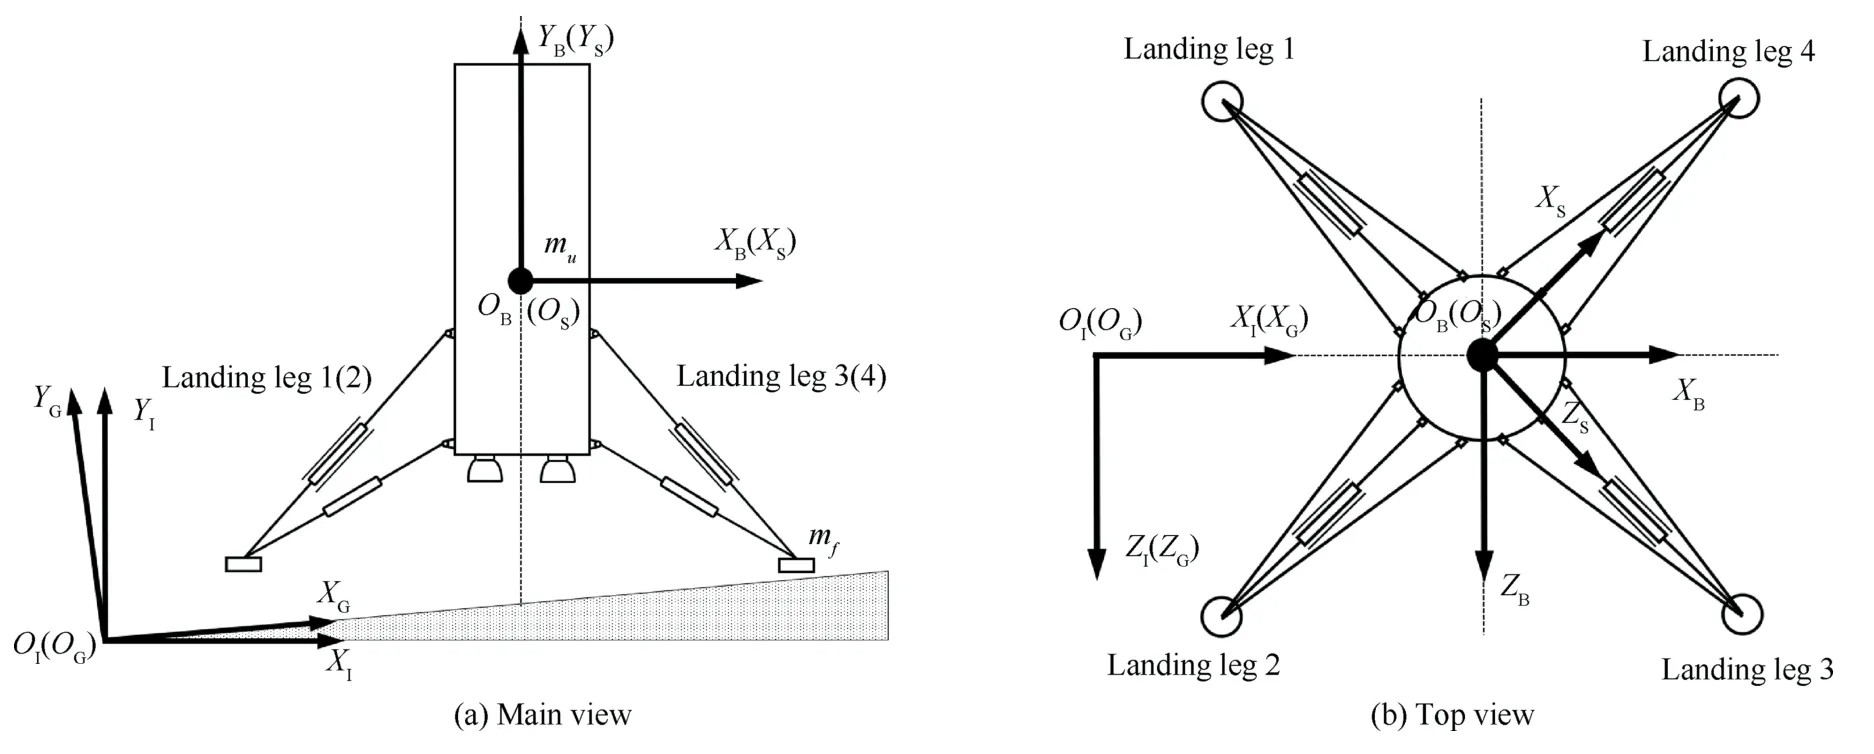
Fig.2 Main and top view of launch vehicle with 2-2 landing mode.
(A) Inertial coordinate systemOI-XIYIZI: TheOIYIaxis points upward vertically.TheOIXIaxis and theOIZIaxis are in the horizontal plane and perpendicular to theOIYIaxis.
(B) Ground coordinate systemOG-XGYGZG: Its origin pointOGcoincides withOIof the inertial coordinate.TheOGYGaxis is perpendicular to the ground and points upward.TheOGXGaxis andOGZGaxis form the ground surface.The ground coordinate is connected with the inertial coordinate by the ground slope α,which is positive in clockwise direction.
(C) Body coordinate systemOB-XBYBZB:It is fixed with the main body of RLV and the origin pointOBcoincides with the gravity center of main body.TheOBYBaxis is parallel to the vertical center line of main body and points upward.TheOBXBaxis is in the symmetric plane and perpendicular to theOBYBandOBZBaxis.The body coordinate is related with the inertial coordinate through the pitch angle ψ,which is positive in clockwise direction.
(D) Strut coordinate systemOS-XSYSZS: Its origin pointOScoincides withOBof the body coordinate.The direction of theOSYSaxis is identical with theOBYBaxis.TheOSXSaxis,which is perpendicular to theOSYSaxis,is in the plane formed by landing legs 2 and 4.The strut coordinate is related with the body coordinate through the angle β,which is π/4.By introducing the strut coordinate system,the main and auxiliary strut force can be conveniently written within the strut coordinate system,which simplifies the denotation of dynamic equations.
Based on the transitivity of matrix,the transition from strut coordinate system to ground coordinate system can be denoted as:

3.1.2.Elastic mass model
The dynamic equation of elastic mass along theOIYIaxis within inertial systemOI-XIYIZIcan be written as:

wheremuis the elastic mass,yuis the displacement of the elastic mass along theOIYIaxis,Fh1andFh3are the damper force of landing legs 1 and 3,respectively,Fa1andFa3are the axial forces of auxiliary struts in landing legs 1 and 3,respectively,FeyI1andFeyI3are the transverse force from auxiliary strut 1 and 3 to main body,respectively,θyI1and θyI3are the angles between main struts and horizontal plane,φyI1and φyI3are the angles between auxiliary struts and horizontal plane.It is noted that the force of landing legs 2 and 4 are identical with landing legs 1 and 3,respectively.
The dynamic equation of elastic mass along theOIXIaxis within inertial systemOI-XIYIZIcan be denoted as:

wherexuis the displacement of the elastic mass along theOIXIaxis,FexI1andFexI3are the transverse force from main strut 1 and 3 to main body,respectively,θxI1and θxI3are the angles between symmetric plane and the projection of main strut axis on the horizontal plane,φyI1and φyI3are the angles between symmetric plane and the projection of auxiliary strut axis on the horizontal plane.
According to the momentum theorem,the rotational equation of the elastic mass in the symmetric plane can be denoted as:
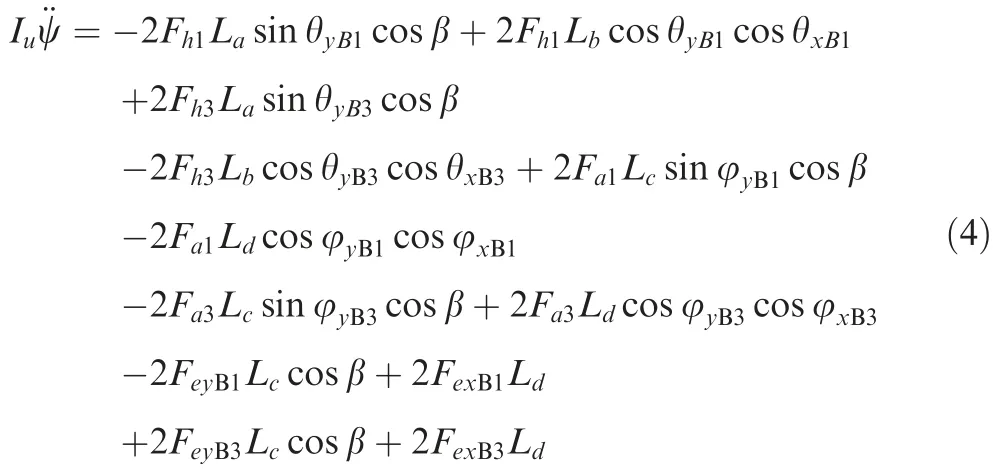
whereIuis the rotational inertia of elastic mass around theOBZBaxis,θxB1and θxB3are the angles between main struts and theOB-XBZBplane,θyB1and θyB3are the angles between symmetric plane and the projection of the main struts onOBXBZBplane,φxB1and φxB3are the angles between auxiliary struts and theOB-XBZBplane,φyB1and φyB3are the angles between symmetric plane and the projection of the auxiliary struts onOB-XBZBplane,Lais the distance from the body gravity center to the connection point of main strut along theOBXBaxis,Lbis the distance from the body gravity center to the connection point of main strut along theOBYBaxis,Lcis the distance from the body gravity center to the connection point of auxiliary strut along theOBXBaxis,Ldis the distance from the body gravity center to the connection point of auxiliary strut along theOBYBaxis,FexBandFeyBare the transverse force from auxiliary struts to main body along theOBXBandOBYBaxis,respectively.
The relationship betweenFexI,FeyIandFexB,FeyBis written as:

3.1.3.Inelastic mass model
To establish the dynamic model conveniently,the mathematical equation of inelastic mass is built within the strut coordinate system.Based on the modeling theory for non-inertial system,the Coriolis acceleration and centripetal acceleration generated by the rotation of moving coordinate system should be considered.22Therefore,the dynamic equations of the generalith inelastic mass within the strut coordinate system is denoted as:
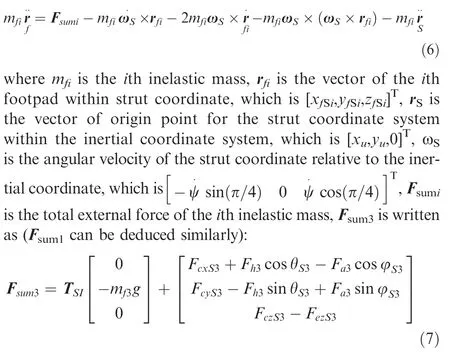
whereFcxS3,FcyS3andFczS3are ground-footpad contact force along theOSXS,OSYSandOSZSaxis,respectively,FezS3is the transverse force transferred from auxiliary strut to main body along theOSZSaxis,θS3is the angle between the main strut 3 and theOS-XSZSplane,φS3is the angle between the auxiliary strut 3 and theOS-XSZSplane.Then the dynamic equations of elastic mass 3 along theOSXS,OSYSaxis are denoted as (equations for elastic mass 1 can be deduced similarly):
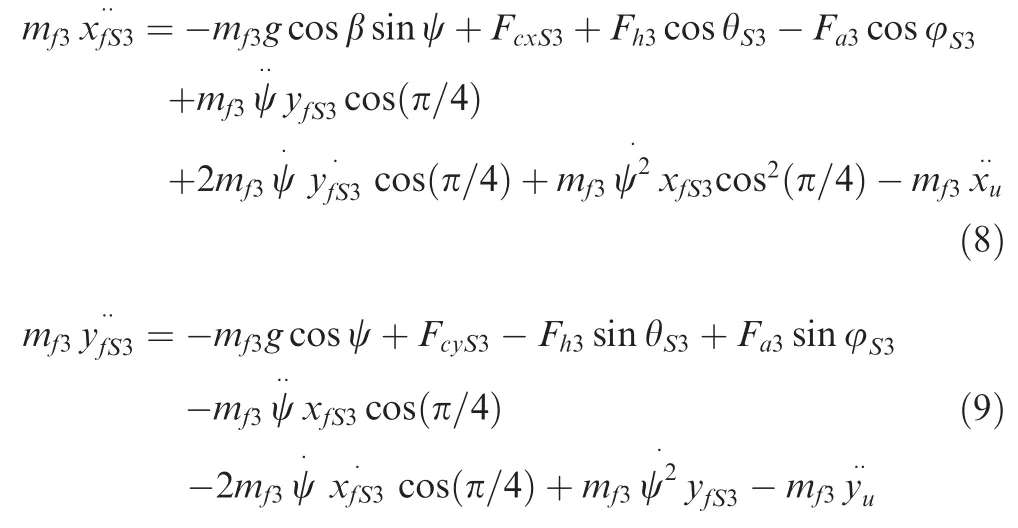
According to the symmetric landing assumption,the displacement of inelastic mass 3 along theOSZSaxiszfS3is kept as 0.Based on the equation in theOSZSdirection of Eq.(6),FezS3can be deduced as:

Through the following relationship,FezS3can be employed to obtain[FexI3,FeyI3,FezI3],which are further used in Eqs.(2)–(4):

3.1.4.Strut and ground-footpad contact force model
The model of liquid spring damper and auxiliary strut in author’s previous work6is continually used in this paper to constitute the axial force of main and auxiliary strut.The axial force of main strut is written as:

whereP1andP2are the pressures of the upper and lower chamber in damper,respectively,B1andB2are the fluid bulk modulus of the upper and lower chamber,respectively,AP,1andAP,2are the wetted piston areas in upper and lower chamber respectively,vPis the piston velocity,ρ1and ρ2are the fluid density in upper and lower chamber,respectively,ρavgis the average density of two chambers,Qois the volumetric fluid flow rate through orifice,Ffis the damper friction force.
The axial force of auxiliary strut is denoted as:

whereKaandCaare the axial stiffness and damping coefficient of the auxiliary strut,respectively,saandvaare the stroke and velocity of auxiliary strut,ekis the exponential coefficient of the nonlinear strut spring force,which is introduced to represent the stiffness hardening effect,sign() is the signum function.
The transverse forces of main and auxiliary strut acting on main body come from the components of ground-footpad contact force along the strut’s transversal directions.
The ground-footpad contact forces within ground coordinate are expressed as [FcxG,FcyG,FczG].For convenience,the use of the footpad subscriptiis dropped in this section.FcyGcan be denoted as:
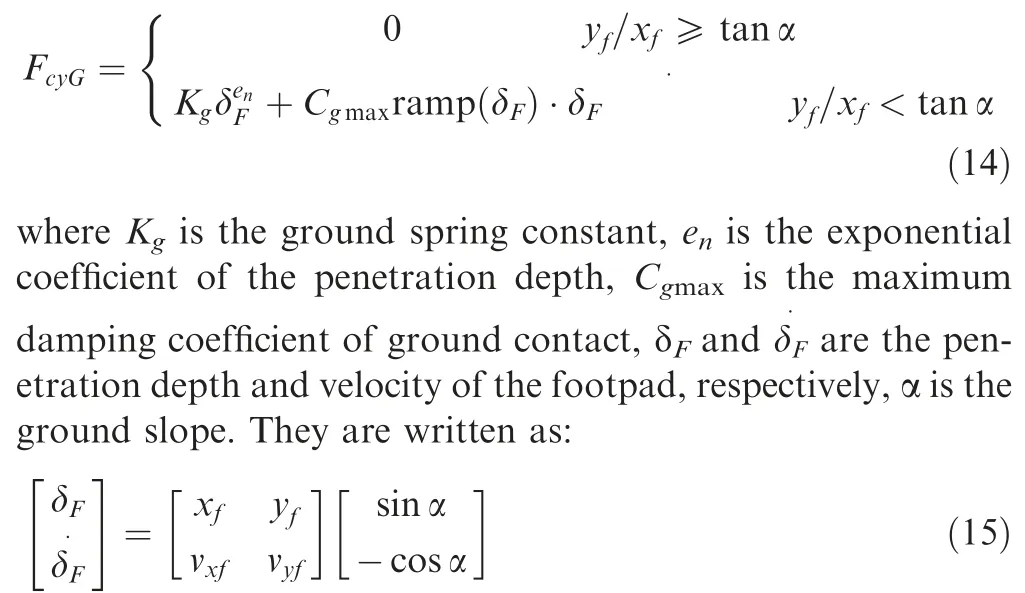
The Reset Integral Friction model21with the stribeck effect is employed in modified form to calculate the friction force of contact(FcxGandFczG).Two additional state variablessrxfandsrzfare introduced to monitor the condition of friction displacement inOGXGandOGZGdirections.Their corresponding threshold are set assrxf0andsrzf0,respectively.WhenvxfGsrxf>0 and|srxf|≥srxf0are both satisfied,the friction force ofOGXGdirection is in the slip zone and=0.Otherwise theOGXG-direction friction force is in the stick zone and there exists=vxfG.Therefore,the friction force inOGXGdirection can be denoted as:
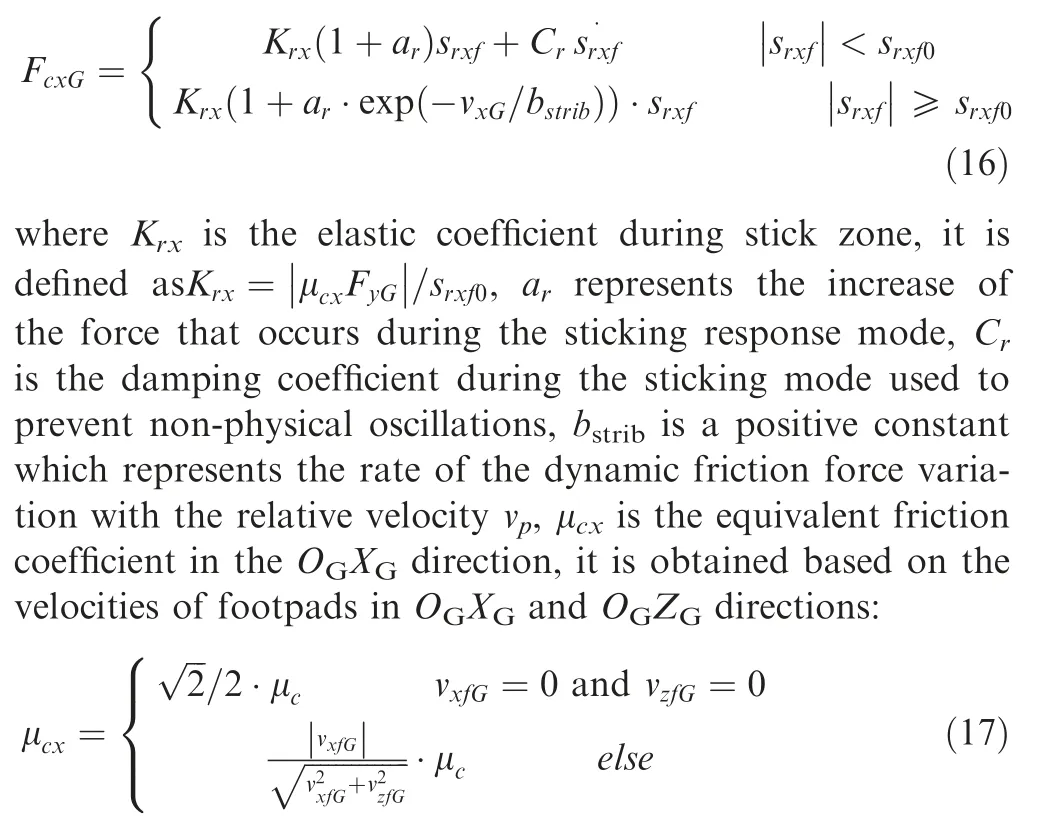
where μcis the friction coefficient of footpad-ground contact.Besides,the deduction of friction force inOGZGdirection is omitted here because the expressions are similar forOGXGandOGZGdirection.
The contact force and the gravity force of inelastic mass should be transferred to strut coordinate system and are further used in Eq.(6).The transformation can be written as:

3.1.5.Kinematic equations of struts and footpads
The stroke of liquid spring damper is written as:

whereLm0is the initial length of damper,Lmis the length during touchdown,[xf,yf,zf]is the coordinate of the footpad within the inertial coordinate,[xmI,ymI,zmI] is the coordinate of connection point between main strut and main body within the inertial coordinate,it can be obtained by transition from the body coordinate.Take main strut 3 as an example to show the deduction (Other landing legs can be deduced similarly):

where[xu,yu]is the coordinate of gravity center for main body within the inertial coordinate.
By differentiating Eq.(19)with time,the velocity of damper is obtained as:

where [vxf,vyf,vzf] is the velocity vector of footpad within the inertial coordinate,[vxmI,vymI] is the velocity vector of connection point between main strut and main body within the inertial coordinate(Its velocity in theOIXIdirection is kept as 0),it is attained by differentiating Eq.(20) with time:

where [vxu,vyu] is the velocity vector of gravity center for main body within the inertial coordinate.
The angle between main strut and theOI-XIZIplane can be denoted as:

The angle between the symmetric plane and the projection of main strut on theOI-XIZIplane can be denoted as:

The stroke of auxiliary strut can be written as:

whereLs0is the initial length of auxiliary strut,Lsis the length during touchdown,[xsI,ysI,zsI] is the coordinate of connection point between auxiliary strut and main body within the inertial coordinate,it can be attained by transition from the body coordinate.Take auxiliary strut 3 as an example:

By differentiating Eq.(25)with respect to time,the velocity of auxiliary strutvacan be obtained similarly,which is not described here.
The deductions of angles φyIand φxIare similar with those of main strut,thus they are omitted here.
The relationship between thex,yandzcoordinate of footpad can be denoted as:

wherezfBandzfGare coordinates of footpad alongzdirection within the body coordinate and the ground coordinate,respectively.
By differentiating Eq.(27) with time,the velocity of footpad alongzdirection within the inertial coordinate is attained as:

wherevzfBandvzfGare velocities of footpad alongzdirection within the body coordinate and the ground coordinate,respectively.It is noted that the coordinates of footpad in different coordinate systems can be converted to each other through transition matrix.
3.2.Case2: 1-2-1 landing mode
3.2.1.Model assumptions
The main and top views of the RLV under 1-2-1 landing mode are shown in Fig.3,along with the numbers of each landing leg.
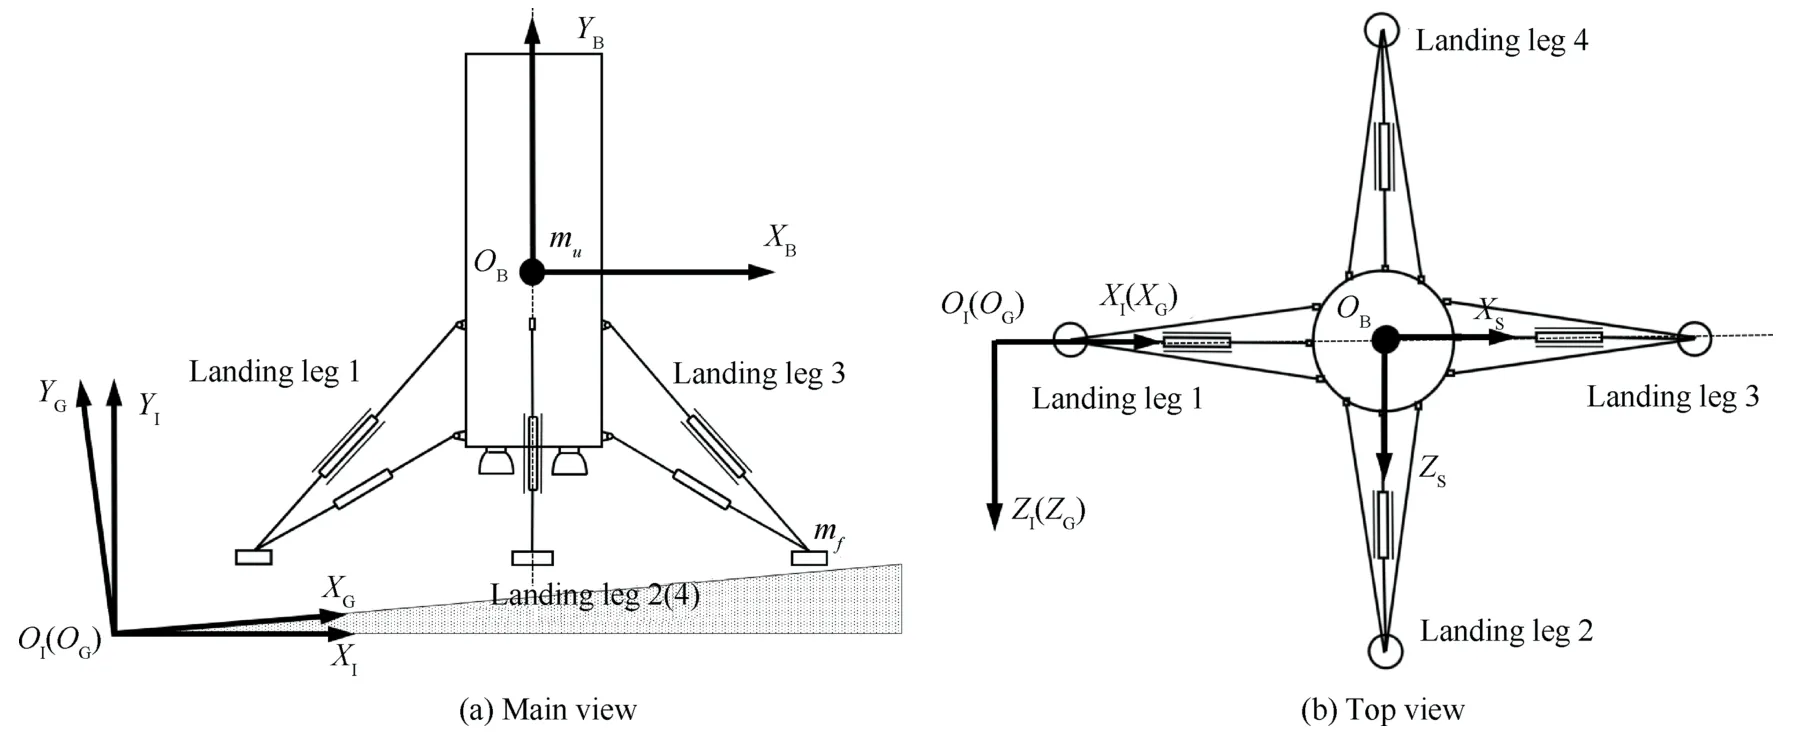
Fig.3 Main and top views under 1-2-1 landing mode.
The difference from the 2-2 landing model is that the inelastic mass 1 and 3 consider 2 translational DOF in the symmetric plane,and the inelastic mass 2 and 4 consider 3 DOF in space.The dynamic model still uses the Inertial coordinate systemOIXIYIZI,Ground coordinate systemOG-XGYGZGand body coordinate systemOB-XBYBZB.The strut coordinate system is no longer employed here.The transition between different coordinate systems is similar with that under 2-2 landing mode,thus it is omitted in this section.
3.2.2.Elastic mass model
The dynamic equation of the elastic mass along theOIYIaxis withinOI-XIYIZIcoordinate is:

whereFh1,Fh2andFh3are the damper force of landing leg 1–3,respectively,Fa1,Fa2andFa3are the axial forces of auxiliary struts in landing legs 1–3,respectively,FexBis the transverse force from auxiliary strut 2 to main body,it has the same direction with theOBXBaxis,θI1and θI3are the angles between the main struts(1 and 3)and the horizontal plane,φI1and φI3are the angles between the auxiliary struts (1 and 3) and the horizontal plane.It is noted that the forces of landing leg 4 is substituted with those of landing leg 2 due to symmetry.
The dynamic equation of the elastic mass along theOIXIaxis is denoted as:

The rotational equation of the elastic mass around theOBZBaxis is written as:

where θBis the angle between the main struts and theOB-XBZBplane,φBis the angle between the auxiliary struts and theOBXBZBplane.
3.2.3.Inelastic mass model
The dynamic equation of the inelastic massmf3along theOIYIaxis is:

whereFcxGandFcyGare the components of the groundfootpad contact force along theOGXGaxis andOGYGaxis,respectively.
The dynamic equation of the inelastic massmf3along theOIXIaxis is:

The dynamic equations for inelastic massmf1are similar with those ofmf3,which are omitted here.
For convenience,the mathematical equations of inelastic massmf2are established within the body coordinate system.Considering the Coriolis acceleration and centripetal acceleration generated by the rotation of moving coordinate system,the dynamic equations ofmf2are written as:

where rfis the vector of footpad 2 within the body coordinate system,which is [xfB2,yfB2,zfB2]T,ωSis the angular velocity of the body coordinate with respect to the inertial coordinate,which is [0,0,ψ·]T,rBis the vector of origin point for the body coordinate system within the inertial coordinate system,Fsumis the total external force which is denoted as:

whereFcxB2andFcyB2are the components of the groundfootpad contact force along theOBXBaxis andOBYBaxis.
Because the displacement ofmf2along theOBXBaxisxfB2is always 0,the dynamic equations ofmf2along theOBYBaxis andOBZBaxis can be obtained:


Through the equation ofmf2along theOBXBaxis,the expression ofFexBis attained:

3.2.4.Strut and ground-footpad contact force model
The force models of main and auxiliary strut are similar with 2-2 landing mode in Section 3.1.4.The contact forces of footpads 1 and 3 are in the symmetric plane and consist of components along theOGXGaxis andOGYGaxis,while the contact forces of footpads 2 and 4 are built in three directions.Take the contact force of footpad 2 as an example to show the deduction.
The contact force of footpad 2 within ground coordinate can be denoted as[FcxG2,FcyG2,FczG2].The expression ofFcy-G2is similar with Eq.(14),where the penetration depth of footpad 2 is equal to-yfG2.The penetration velocity is deduced as:

Similar to the 2-2 landing mode,two additional friction state variablessrxfandsrzfare introduced to monitor the state of friction force inOGXGandOGYGdirections.Then the friction forceFcxG2andFczG2are obtained through equations similar with Eq.(16).
3.2.5.Kinematic equations of struts and footpads
The displacements of main and auxiliary struts are obtained by calculating the position variance between footpads and main body.The velocities are then attained by differentiating displacements with respect to time.The expression of angles between struts and reference plane are similar with those of 2-2 landing mode.For simplicity,the deduction of kinematic equations for 1-2-1 landing mode is omitted here.In addition,it should be noted that when calculating the contact force,the coordinates of footpads within ground coordinate system are required.The coordinates can be obtained by the following relationship (Take footpad 2 as an example):

3.3.Quasi-3D landing model of RLV
The complete dynamic models are conducted in MATLAB23and the Ordinary Differential Equation (ODE) solver are employed to obtain the transient responses under landing.The prototype model shown in Figs.2 and 3 adopts the mechanical states xm,hydraulic states xhand friction states xfto represent the landing system as:

where the solution time interval ist∈[0,tmax],the full state vector is x=[xm,xh,xf]∈R13for 2-2 landing mode and x=[xm,xh,xf]∈R13for 1-2-1 landing mode.The individual states are denoted as:

The flow chart showing the integration of all sub-models is presented in Fig.4.The elastic model is featured by Eqs.(2)–(4) under 2-2 landing mode and Eqs.(29)–(31) under 1-2-1 landing mode.The elastic model is connected with the main strut model and auxiliary strut model through main forceFhand auxiliary forceFa,Fe,respectively.The inelastic model is characterized by Eqs.(8)–(9) under 2-2 landing mode and Eqs.(32)–(37) under 1-2-1 landing mode.The inelastic model is connected with the strut model and ground contact through strut forceFhand contact forceFc,respectively.The strut force model(Eqs.(12)–(13))is integrated with the elastic and inelastic model through the kinematic equations of struts(Eqs.(19)–(26)).The ground contact model (Eqs.(14)–(18),(39)),which includes the normal force component and the friction force component,is coupled with the inelastic model by the footpad kinematic equations (Eqs.(27)–(28)).
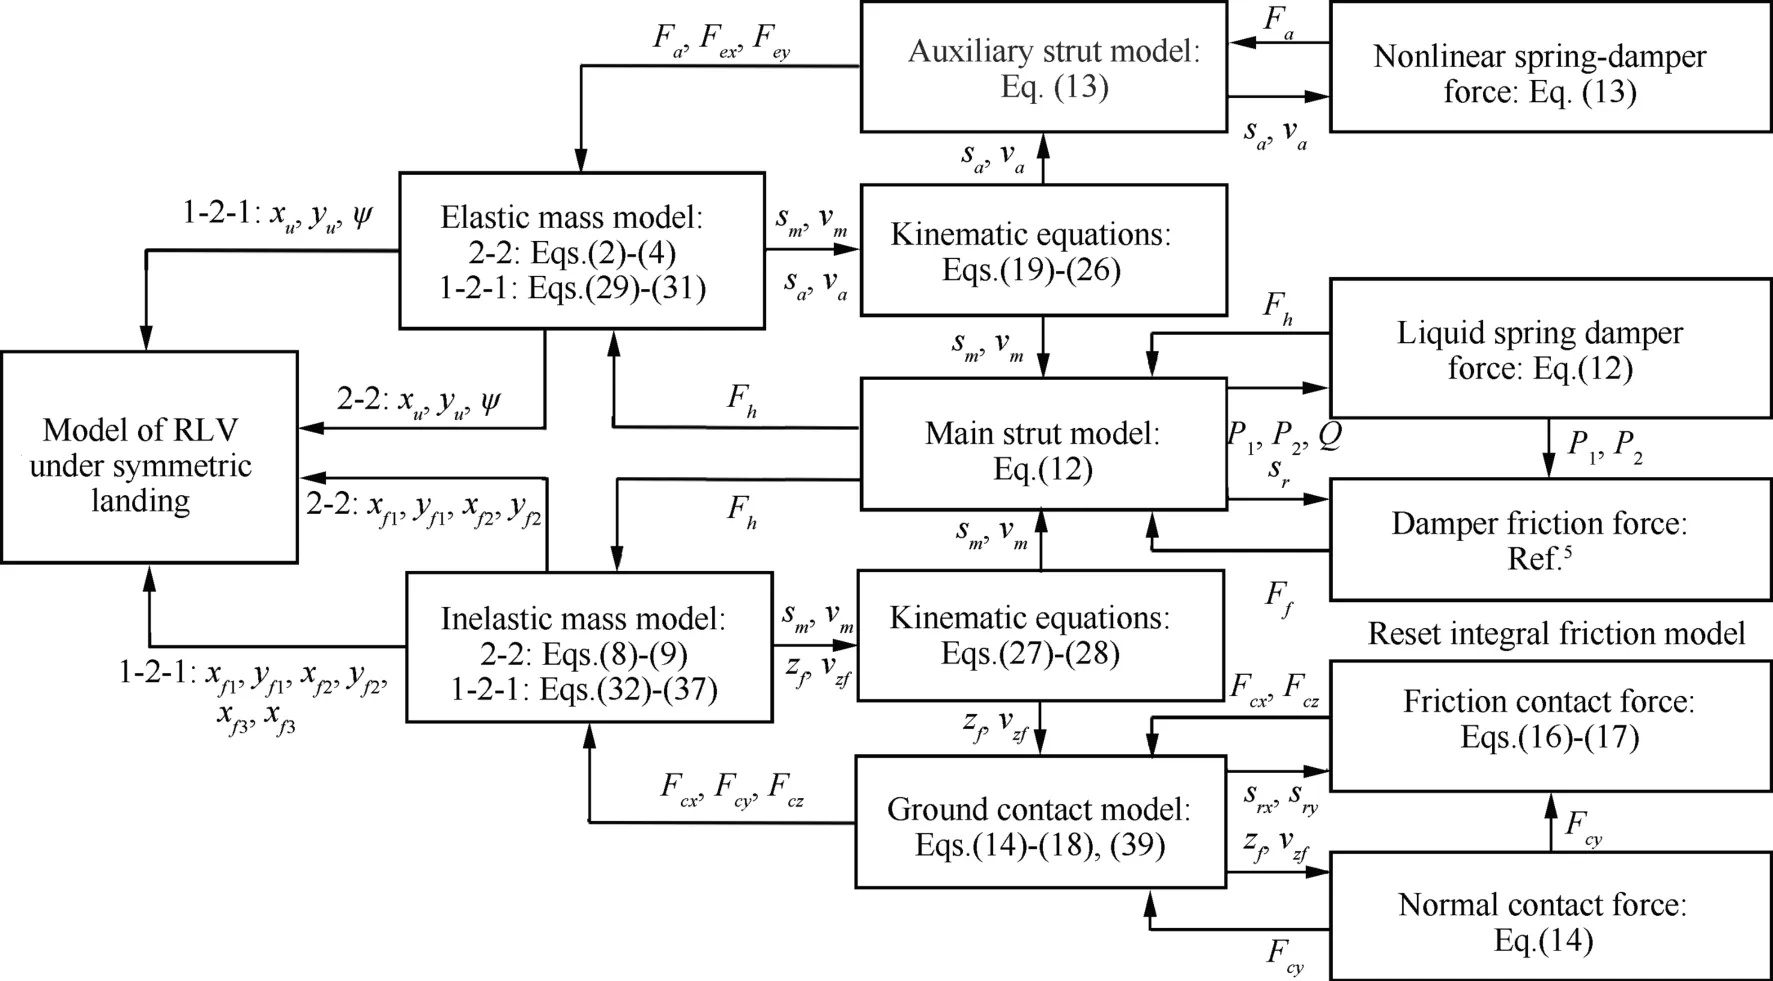
Fig.4 Integrated landing model of RLV.
In addition,a variable step size MATLAB ODE solver ode45,24which uses a pair of the explicit Runge-Kutta methods,is employed to calculate the dynamic responses of the whole system.Some key parameters of the simulation model are listed in Table 1.In the table,the structural parameters are from the measurements of the test prototype.The auxiliary strut force and normal ground contact force are obtained by the previous research,25,26whereas the parametersarandbstribin the friction force of ground contact are based upon Ref.27.
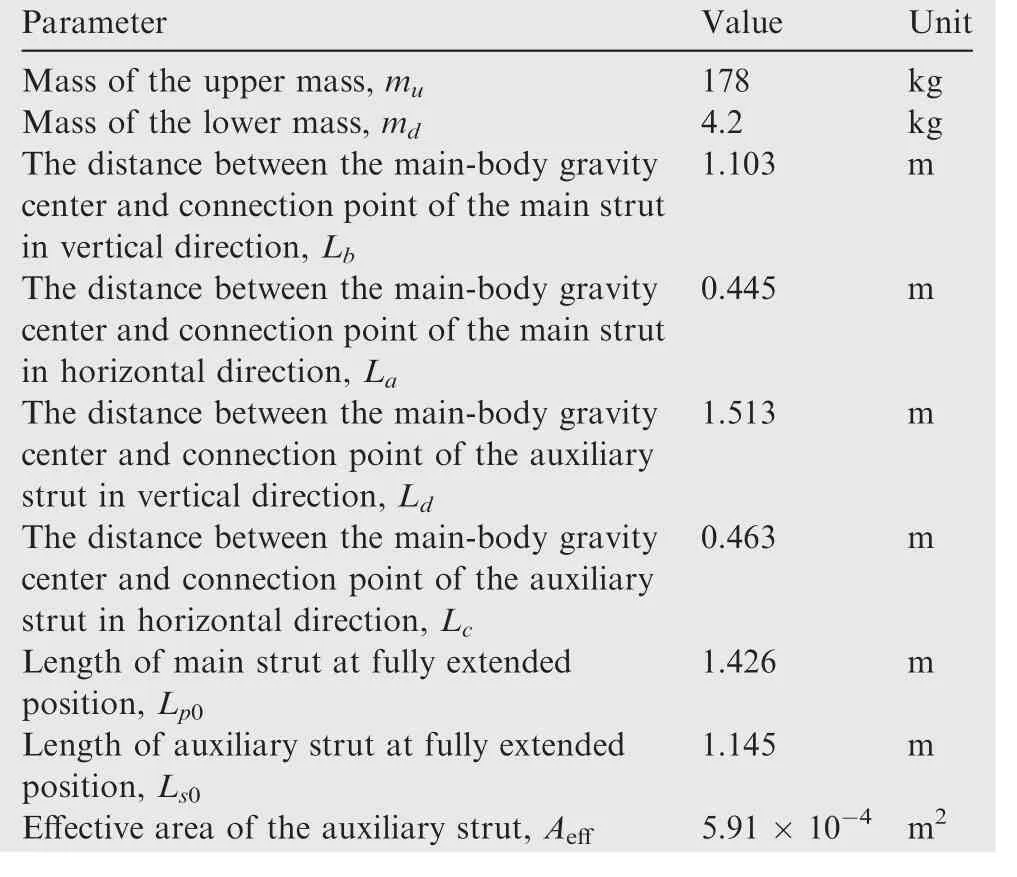
Table 1 Parameters of vehicle’s structure.
4.Experimental description
The landing impact experiments are designed and conducted to verify the simulation model.Aimed for symmetric landing mode,the simple pendulum principle is employed to obtain the specified landing velocity and angle.28As is shown in Fig.5,the steel block,which is on top of the main body,is firstly attracted by electromagnet and elevated to the predetermined height by the elevating-releasing system.Secondly,the prototype is rotated to the initial position around the rotational hinge.Afterwards,the prototype is released from the initial position and spins around the axis,triggering the photoelectric sensor at the specified location to switch off the electromagnet.Then the prototype would experience the free fall movement with the designed initial tilt angle and horizontal velocity.Finally,it would gain the designed vertical velocity at the landing position when footpads contact the ground.The revolute joint mounted on top of the main body ensures the symmetric landing.Besides,the footpad-ground distances for four landing struts and the tilt angles of main body are measured before releasing,which are used as references to adjust the initial drop-off position.
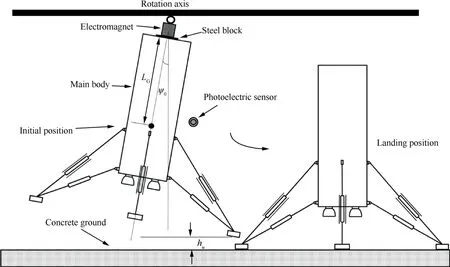
Fig.5 Principle of landing impact experiments for RLV.
The prototype of landing impact system is shown in Fig.6.The system mainly contains the electromagnet,the elevatingreleasing,control device,structural components and data measuring system.The displacements of four liquid spring dampers are obtained by the displacement sensors mounted on each main strut.The axial forces of four main and auxiliary struts are measured by the force sensors installed along the strut axis.The acceleration along the main-body vertical direction is recorded by the piezoelectric accelerometer installed near the steel block.The data processing equipment employed in the experiment is based on the signal acquisition and analysis system,which is suitable for high-frequency impact conditions.In addition,it is noted that the sampling rates for the measured data from sensors are set as 5000 Hz aimed at recording the touchdown transient responses.The measured data of damper strokes are smoothed by the Savitzky-Golay filter.The vertical accelerations of the experiment are filtered by a low-pass filter with 100 Hz cut-off frequency.Other experimental data,such as the main strut force and the auxiliary strut force are neither smoothed nor filtered.
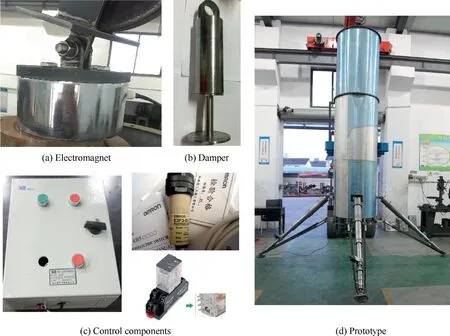
Fig.6 Prototype of landing impact system.
Two landing conditions are conducted in the impact experiments to testify the simulation model under 2-2 and 1-2-1 landing mode.The tilt angle of main body at the initial position is set as 5°and the initial distance between the lowest footpad and the ground is set as 36 mm.The electromagnet is powered off when the tilt angle of main body reaches -2°.Based on this,the touchdown parameters can be calculated and summarized in Table 2.It is noted that the tilt angle for main body is positive in the clockwise.

Table 2 Touchdown parameters of landing tests.
5.Simulation-experiment comparison
The comparison between simulation and experiment are conducted under 2-2 and 1-2-1 landing mode in this section.The discrepancies in dynamics responses of strut forces,strut displacements,buffering efficiency and accelerations are analyzed.The buffering efficiency of dampers is denoted as:

whereEdrepresents the absorbed energy of damper during compression,Fmaxrepresents the maximum damper force during compression,Smaxrepresents the maximum compression stroke.
5.1.Case1: 2-2 landing mode
Fig.7(a) and (b) are the forces of the first touchdown and the second touchdown main strut,respectively.The solid curves represent the numerical results and the dashed curves represents the experimental results.The negative value stands for the compression of main strut.From Fig.7(a),at the touchdown instant,the simulation force reaches -2.71 × 10³N while the experimental forces get to -1.93 × 10³N and-1.71×10³N due to landing impact.Then the forces decrease gradually with the compression of main strut.At the maximum stroke the forces reach the valley,which are -4.38 × 10 3 N in simulation and -4.56 × 10³N in experiment.From around 0.37 s to 0.52 s,the forces rise to approximately 0 N due to the rebound of main strut.After that,the forces start the second compression-rebounding period.It can be also seen that the experimental force curves experience more highfrequency oscillations comparing with simulation,which is due to the flexible deformation of struts and main body.From Fig.7(b),the second touchdown force of simulation reaches-3.71 × 10³N at the contact instant (around 0.239 s),while the forces of experiment get to -2.02 × 10³N.After that,the forces decrease smoothly and reach the valley at the maximum stroke at approximately 0.362 s.The minimum value of simulation and experiment are-4.12×10³N and-4.53×10 3 N,respectively.Through comparisons,it can be obtained that the valley of main strut force in simulation is generally lower than the valley in experiment.It is known that the strut force mainly includes the spring force and friction force of dampers at the maximum stroke,where the compression velocity and damping force are both zero.Based on this,the discrepancy of force valley possibly comes from the following reasons: (A) The overlap of connection joints in experiment causes the downward movement of main-body to become larger,and further increases the landing energy absorbed by dampers in main strut.(B) The experimental friction force of dampers is bigger than the simulation friction force.(C) The flexibility of strut and main body causes the reduction of damper compression velocity,which further decreases energy dissipated by hydraulic damping.
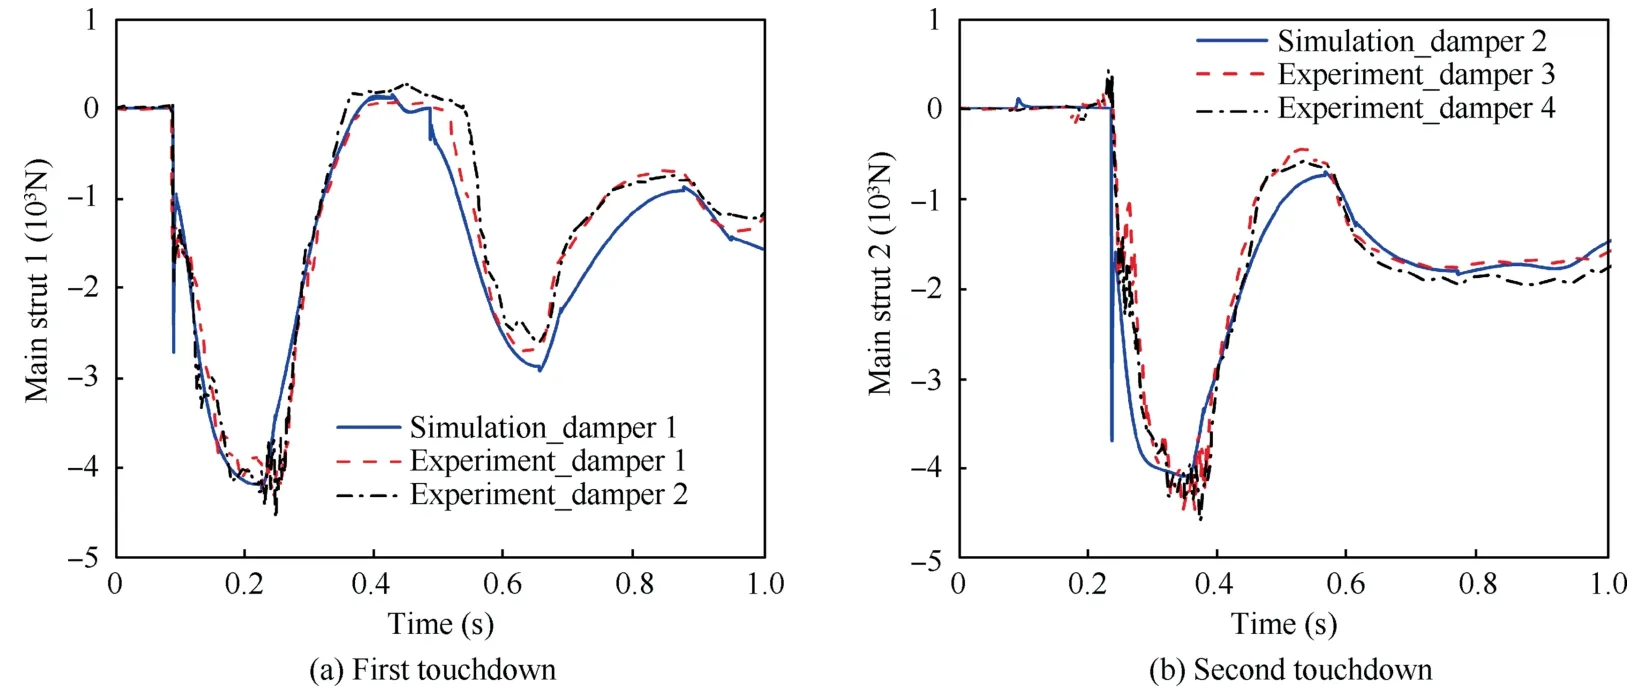
Fig.7 Comparison of the main strut force.
Fig.8(a) and (b) are the strokes of the first and the second touchdown main strut,respectively.The positive value represents the compression of main strut.In Fig.8(a),the first touchdown main strut experiences the first compressionrebounding period from around 0.088 s to 0.375 s,where the tendency and magnitude of curves between simulation and experiment are in good consistency.Then the stroke rebounds to 0.44 mm in simulation,while the experimental stroke rebound to 3.72 mm and 4.80 mm.Thus,the main strut in experiment is less likely to rebound due to the more energy absorption by structural flexibility and friction.From Fig.8(b),more oscillations are recorded in the experimental stroke curve,which is probably caused by the wire vibration in the displacement transducer during transient impact.At around 0.392 s,the test stroke reaches the peak 22.55 mm,which is 9.36% larger than the simulation.After that,the curves gradually stabilize at approximately 10.3 mm in the end of second compression-rebounding period.
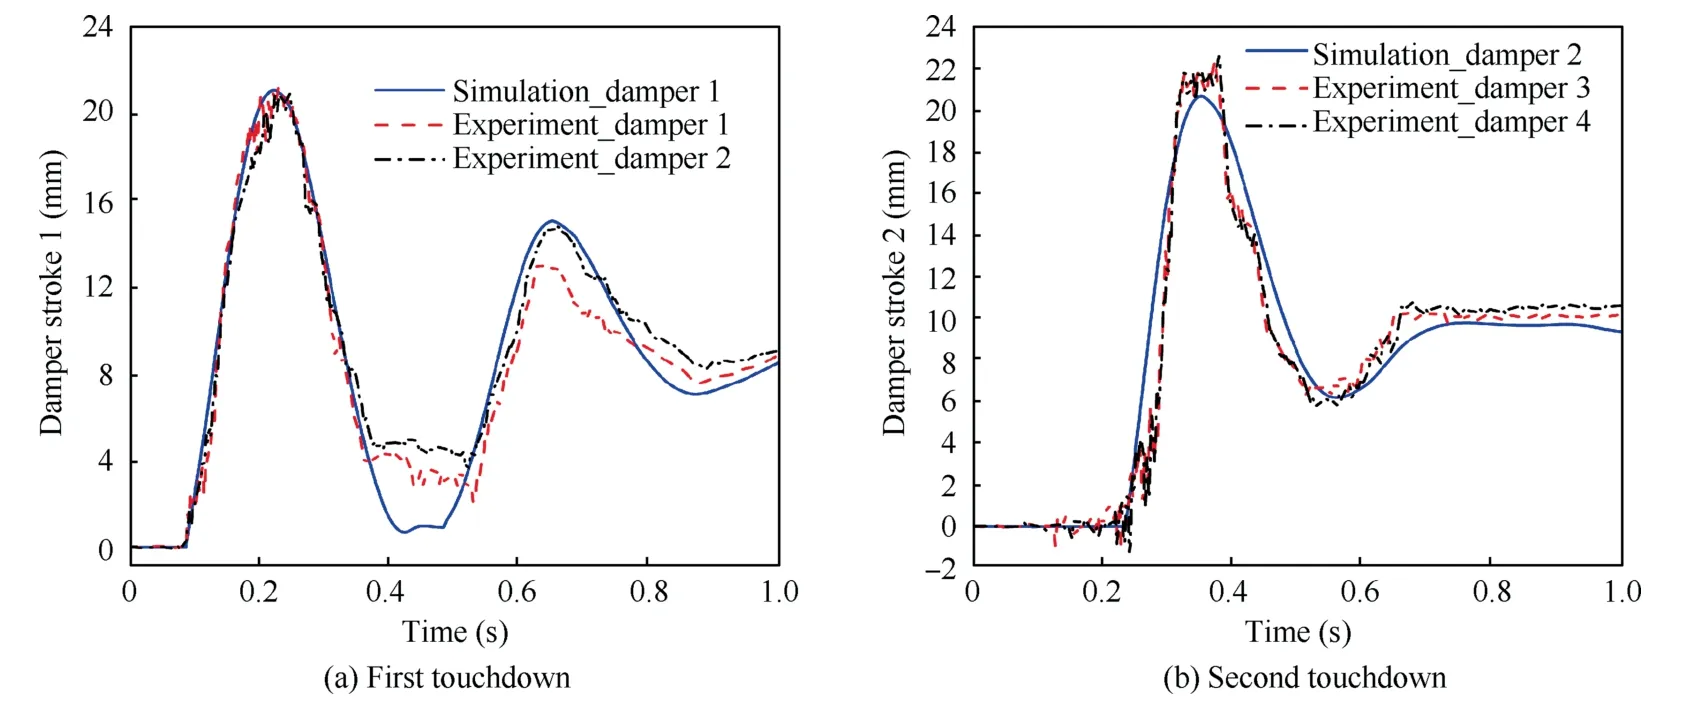
Fig.8 Comparison of the main strut stroke.
Fig.9(a) and (b) are the damper forces versus damper stroke curves of the first and the second touchdown dampers,respectively,which represent the buffering efficiency.Due to the inconvenience in analysis brought by the high-frequency oscillations of damper stroke,the Savitzky-Golay polynomial filtering method29is introduced to filter the measured stroke.The polynomial coefficient of the filter is set as 2,and the sampling window size is set as 31.From Fig.9(a),higher level of oscillations are observed in the experimental curves than the simulation curves,which is caused by the simplification of structural flexibility in the simulation model.During the compression period,the damper force 1 is slightly smaller than force 2 in experiments,which are mainly induced by two reasons: (A).The machining and mounting error of landing legs lead to the unbalanced load subjected by main struts;(B).Differences exist in the release position and angles of main body,leading to the asymmetric landing for prototype.It is also found that the simulation-experiment discrepancy of the second touchdown damper is much smaller than the first touchdown damper.Additionally,during the initial range of rebounding,the simulation curve is slightly inconsistent with the experimental curve,which are possibly due to large difference in friction force and damping force.
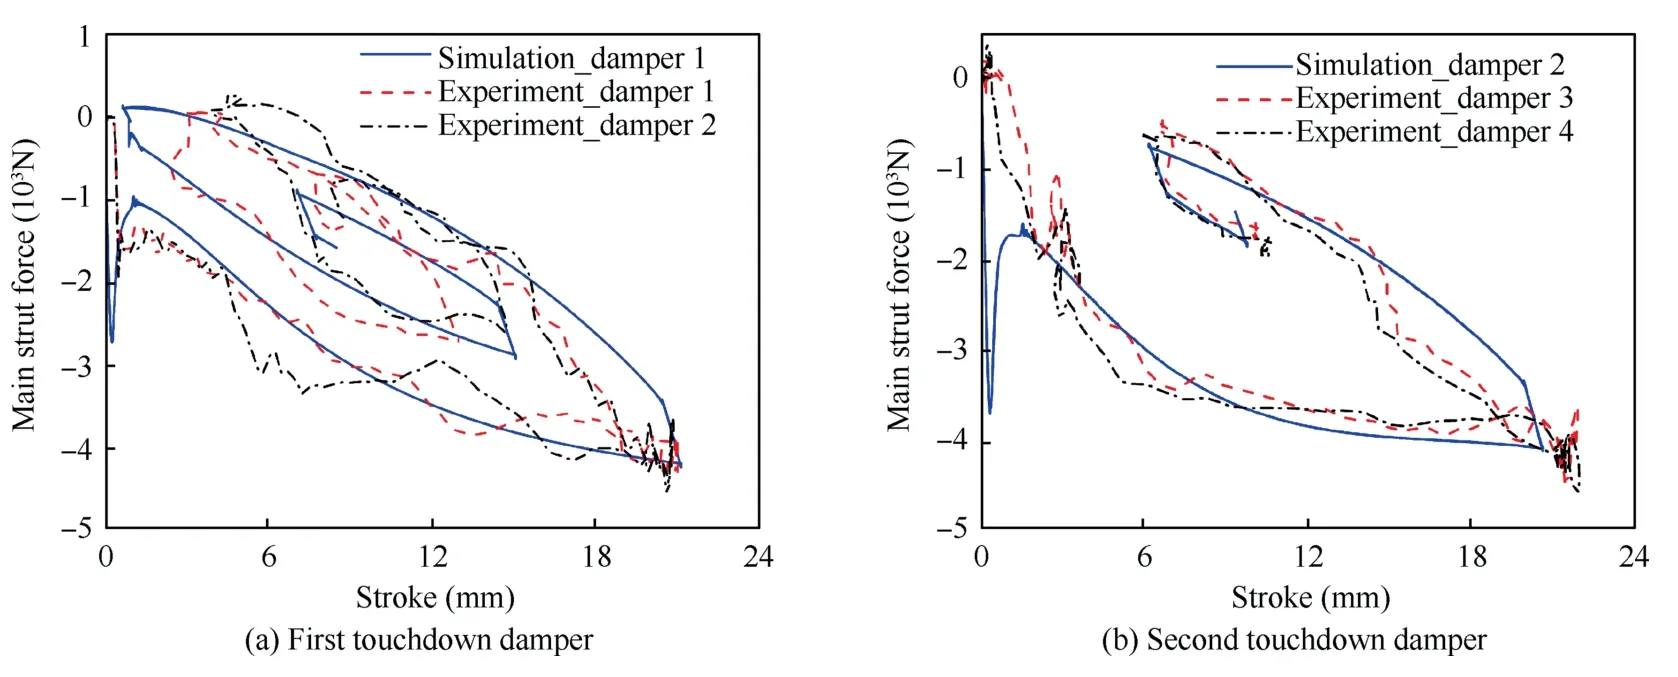
Fig.9 Comparison of buffering efficiency curves for dampers.
Fig.10(a) and (b) are the forces of the first and the second touchdown auxiliary strut.Similar to main strut,the experimental curves of auxiliary strut also have high-frequency oscillations.As is shown in Fig.10(a),the auxiliary strut is first subjected with compressive load at the touchdown instant both in simulation and experiment.The maximum compressive load is 0.40 × 10³N and 0.47 × 10³N for experiment and a much larger value 1.52 × 10³N for simulation.This is because the equivalent stiffness for auxiliary strut in experiment is smaller than the simulation due to the existence of connection overlap and bearing deformation.After the initial landing impact,the auxiliary strut is subjected by tensile load with the slip of footpad.The maximum tensile loads are 3.57 × 10³N and 3.80×10³N for experiment,which are 7.53%and 14.5%bigger than the simulation,respectively.From Fig.10(b),the second touchdown auxiliary strut also undergoes the compression-load period and the tensile-load period successively.
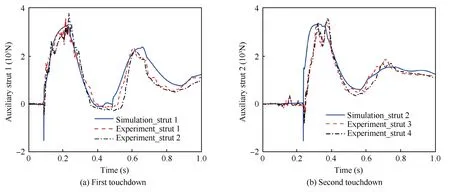
Fig.10 Comparison of auxiliary strut force.
Fig.11 shows the vertical acceleration of the top position in main body along the body axis.From Fig.11,two peaks are observed in curves of both simulation and experiment,which correspond to the first and the second touchdown instant of landing legs,respectively.The simulation curve reaches peaks(13.35 m/s2and 25.77 m/s2)at 0.092 s and 0.238 s,respectively.The test curve reaches peaks(9.57 m/s2and 24.17 m/s2),which are slightly smaller than simulation,at 0.125 s and 0.271 s,respectively.After around 0.35 s,the acceleration starts to decrease and approach to 0 m/s2eventually.The slight oscillations are observed before the touchdown during [0 s,0.098 s],which result from the transient response brought by the initial sudden release of the prototype in experiment.Additionally,because the acceleration sensors are vertically mounted on the main body,high-frequency oscillations are observed in the acceleration curves due to structural flexibility.Fig.12 demonstrates the entire movement of RLV during landing,with the wireframe changing from light to deep in time sequence.From Fig.12,the main body rotates around footpad 1/2 clockwise during touchdown and lands on the ground with a stable altitude after approximately 0.6 s.
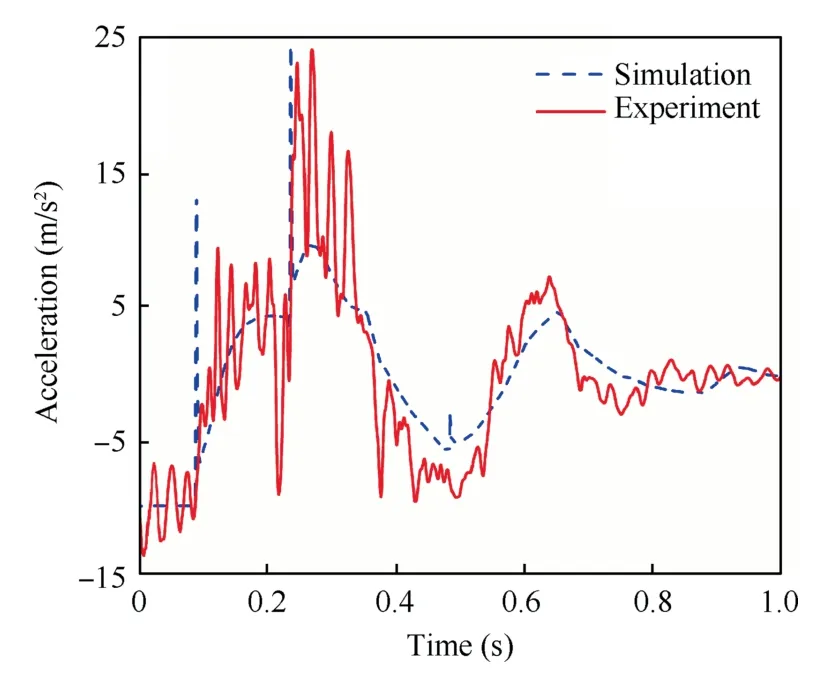
Fig.11 Comparison of vertical acceleration.
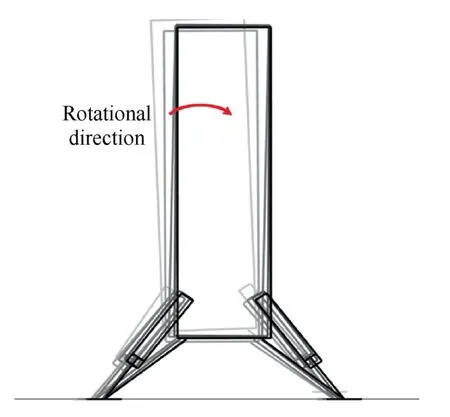
Fig.12 Movement of RLV during landing.
5.2.Case2: 1-2-1 landing mode
Fig.13(a)–(c) are the forces of the first,second and third touchdown main strut,respectively.From Fig.13(a),at the touchdown instant,the main strut force of simulation reaches-2.87 × 10³N,whereas the force of experiment gets to -2.4 1×10³N.At around-0.251 s,the strut gets to the maximum stroke and the force decreases to the valley -5.57 × 10³N.From 0.379 s to 0.563 s,the force rises to approximately 0 N due to the rebound of main strut.Fig.13(b) represents the main strut forces of the middle two landing legs.In Fig.13(b),high-frequency oscillations can be observed obviously due to the structural flexibility.At touchdown (0.197 s),the simulation force reaches -3.66 × 10³N while the experiment forces arrive at-3.41×10³N and-2.06×10³N.When strut stroke reaches maximum (around 0.3 s),the simulation force gets to the valley -3.52 × 10³N,and the experiment forces get to the valley -4.04 × 10³N and -4.17 × 10³N.From Fig.13(c),after the initial impact,the experiment forces of third touchdown main strut experience two valleys during the compression period,which are -5.56 × 10³N and -5.88×10³N at 0.267 s and 0.344 s,respectively.The valleys in simulation are -5.57 × 10³N and -5.09 × 10³N at around 0.293 s and 0.355 s,respectively.The additional valley,which occurs before the time of maximum stroke,results from the increasing damping force brought by the growth of compres-sion velocity.In general,the first main strut forces maintain good consistency between simulation and experiment,while the simulation forces are slightly lower than the experiment forces for the second and third main strut.Besides,the forces of second main strut are smaller than those of the first and third main strut,which is because the strut 2 and 4 shares the landing impact load.

Fig.13 Comparison of main strut force.
Fig.14(a)–(c) are strokes of the first,second and third touchdown main strut,respectively.From the figure,the simulation results match well with the experimental results in tendencies and magnitudes during the first compressionrebounding period.The maximum strokes in simulation are 26.83 mm,17.91 mm and 24.67 mm,and the corresponding maximum strokes in experiment are 26.12 mm,18.49 mm,17.67 mm and 24.62 mm,respectively.Additionally,the rebounding distance of experiment are generally smaller than the simulation,which is possibly because the test friction force of damper is larger than that in simulation.

Fig.14 Comparison of main strut stroke.
Fig.15(a)–(c) are the damper forces versus damper stroke curves of the first,second and third touchdown dampers,respectively.From the figures,larger oscillations are observed in buffering force of experiment than simulation,which is due to the simplification of structural flexibility in simulation.During the compression period,differences are observed between the forces of dampers 2 and 4.This probably results from the error-induced asymmetric landing of test,which is similar to 2-2 landing mode.In addition,the force overshoot is observed in dampers 1 and 2,which represents the maximum force occurs before the maximum piston velocity is reached.30The reasons for this phenomenon possibly come from the intrinsic stiffness-damping-inertial properties of liquid spring damper and the measurement errors of displacement and force sensors brought by the high-frequency oscillations in struts and wire vibrations.

Fig.15 Comparison of buffering efficiency curves for dampers.
Fig.16(a)–(c) are the forces of each auxiliary strut.Similar to main strut,high-frequency oscillations are also recorded in the test curves.From the figures,the auxiliary strut is first subject by compressive load at the touchdown instant and then the tensile load.During touchdown,the force valleys of simulation are generally smaller than those of experiments.After entering the tension period,the force peak for damper 1 in simulation(4.27 × 10³N) is larger than that of experiment(4.06 × 10³N),while the peaks of damper 2-4 in simulation(2.94 × 10³N,4.90 × 103N,2.94 × 103N) are smaller than those of experiment (3.56 × 10³N,5.27 × 103N,3.25 × 103N).Besides,from Fig.16,the force of third auxiliary strut also experiences two peaks at approximately 0.276 s and 0.337 s,which is due to the influence of the third main strut.

Fig.16 Comparison of auxiliary strut force.
Fig.17 shows the vertical acceleration of the main body along the body axis.From Fig.17,both simulation and experimental curves of acceleration experience three peaks after contact,which correspond to the touchdown of first,second and third landing leg,respectively.The simulation reaches the peaks 1.51 m/s2,27.89 m/s2and 25.81 m/s2at 0.921 s,0.198 s and 0.249 s respectively.Comparing with simulation,the experiment gets to the smaller peaks (6.29 m/s2,28.34 m/s2and 30.57 m/s2) at the later time (0.106 s,0.212 s and 0.265 s).After around 0.34 s,the simulation and experiment start to decrease and eventually approach to 0 m/s2.Additionally,slight oscillations are observed before touchdown due to the sudden release of the electromagnet,which is similar to the acceleration of 2-2 landing.Fig.12 demonstrates the entire movement of RLV during landing,with the wireframe changing from light to deep in time sequence.From Fig.12,footpads 1,2/4 and 3 contact with ground successively,and the main body basically remains at a stable altitude after 0.6 s.
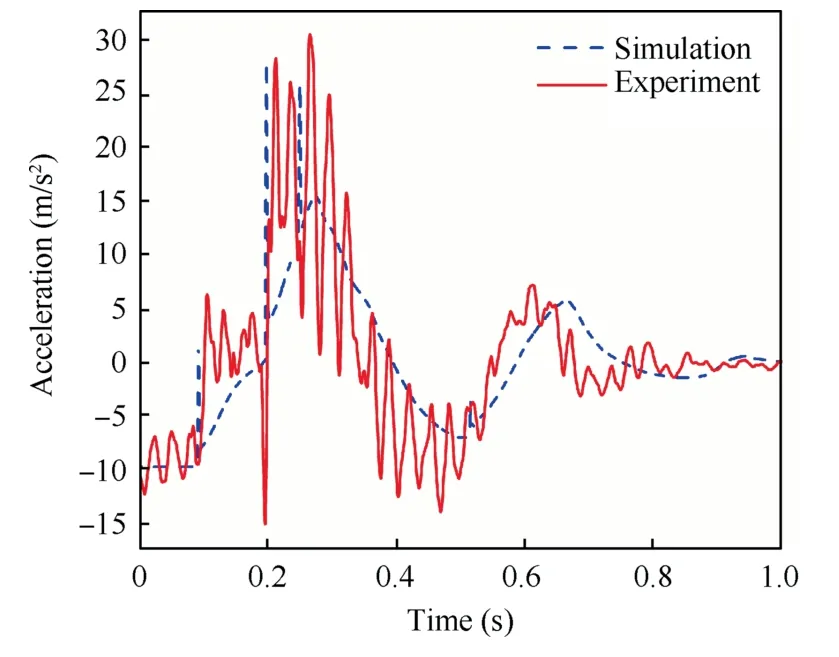
Fig.17 Comparison of vertical acceleration.
5.3.Simulation model validation
Based on the dynamic responses shown in Figs.7–18,the simulation results are further compared with the experimental results.To analyze the discrepancy quantitatively,the relative Root Mean Square value (RRMS) is introduced as index of comparison in strut forces and strokes.31As for the energy comparison,the energy absorbed at the maximum stroke of first compression period and the energy dissipated after the first compression-rebounding period are employed as standards in this paper.32
The energy absorbed or dissipated by the damper can be denoted as:

whereT1andT2represent the starting and ending time of damper for different periods.
Based on this,the energy discrepancy between simulation and test is defined as:
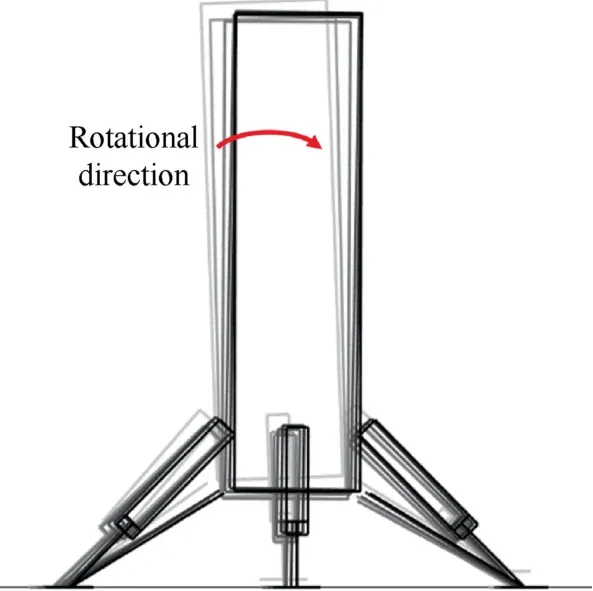
Fig.18 Movement of RLV during landing.

whereEsis the energy absorbed or dissipated in experiment andEeis the energy absorbed or dissipated in simulation.
Fig.19(a) shows theRRMSvalues of the strut forces and strokes.From the figure,the discrepancy of auxiliary strut force between simulation and experiment is slightly large.The discrepancy of auxiliary strut 4 under 2-2 landing mode reaches 33.71%,and the discrepancy of auxiliary strut 1 under 1-2-1 landing mode gets to 40.01%,which is because some nonlinear contact factors,such as the overlap at the connection joints,is neglected in the simulation model.The simulation-experiment difference of damper stroke is relatively small,which are below 18%,while the difference of main strut force is between [16.9%,22.4%].In Fig.19(b),energy 1 and energy 2 represent the energy absorption of first compression period and the energy dissipation after the first compressionrebounding period,respectively.From Fig.19(b),the energy absorption discrepancy between simulation and experiment is small,which are under 22% for both landing modes.But the discrepancy of energy dissipation is relatively larger,which is between [20.9%,37.5%].This is caused by the difference in damper axial force during the initial rebounding period brought by the simplified modeling of friction force and oleo damping force.Additionally,the tendency of main body acceleration between simulation and experiment is consistent for both landing modes,with peak error being small (6.62% and 7.29%).But theRRMSvalues reach 55.85% and 65.95%,respectively.This is due to the simplified property of the quasi-3D model which does not contain the elasticity of the main structure and potentially highly influential nonlinear contact between different parts.In general,the quasi-3D dynamic model has good predictive capability to reflect the transient responses of RLV under symmetric landing.
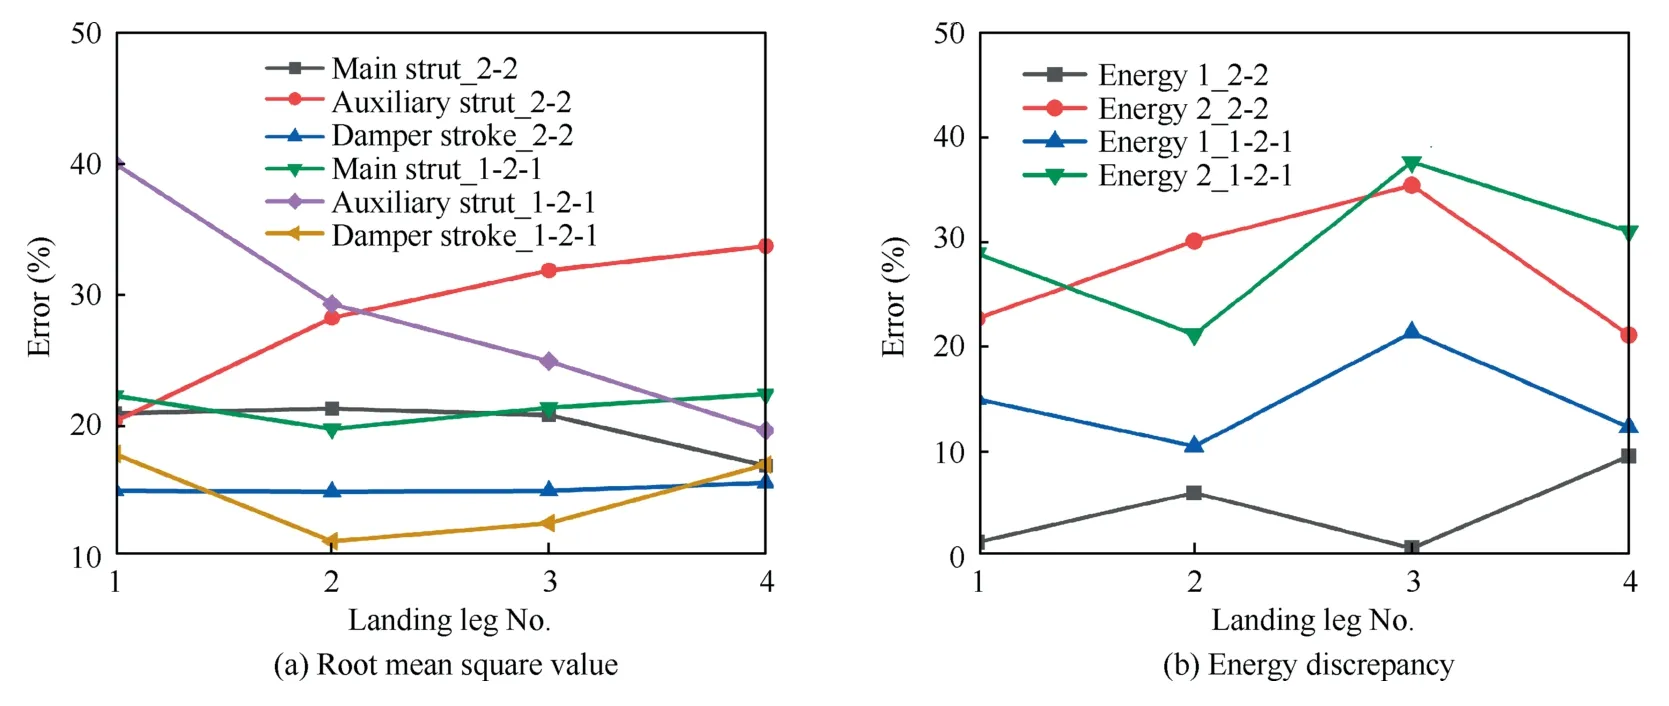
Fig.19 Quantitative analysis of discrepancy between simulation and experiment.
6.Conclusions
(1) A new quasi-3D dynamic model of RLV under symmetric landing modes is established in this paper.This model considers the planer motion of main body and the spatial motion of footpads,which are employed for the calculation of strut force and footpad-ground contact force.A landing impact system is then developed and used for transient dynamic tests under 2-2 and 1-2-1 landing modes.The quasi-3D RLV simulation model is researched and compared with the impact test in the strut force,damper stroke and vertical accelerations under two different landing conditions.
(2) The predictive capability,denoted in terms of the relative RMS error,increases from lower than 18% for the liquid spring damper stroke predictions to 16.9%–22.4% for the main strut force predictions to 20.2%–40.0% for the auxiliary strut force predictions and then to 55.9%–66.0%error range for the acceleration predictions.The lower ends of the error ranges are dominated by the force and stroke predictions of main strut,while the higher errors are related with the auxiliary strut forces and main-body vertical accelerations.Besides,the energy absorption error is under 22%and the energy absorption error is between [20.9%,37.5%] for both landing modes.The main source of the quasi-3D landing model prediction errors,between 1%and 66%,is attributed to unmodelled physics,e.g.structural elasticity and nonlinear contact of joints.Additionally,an excessive effective stiffness in this model induces the unrealistic touchdown force responses which can be alleviated by increasing fidelity of the whole landing model.
(3) The quasi-3D dynamic model proposed and validated in this work can represent the recorded experimental responses under symmetric landing modes with acceptable discrepancies.The adopted quasi-3D modeling approach offers the efficient RLV dynamic models while maintaining close connections with the physical behaviors,which makes them suitable for future more detailed studies such as critical condition analysis.
Declaration of Competing Interest
The authors declare that they have no known competing financial interests or personal relationships that could have appeared to influence the work reported in this paper.
Acknowledgements
This study was co-supported by the National Natural Science Foundation of China (No.52102436);the Fundamental Research Funds for the Central Universities,China (No.30920021109);the Natural Science Foundation of Jiangsu Province,China (No.BK20200496);the China Postdoctoral Science Foundation (No.2020M681615);the Project of Key Laboratory of Impact and Safety Engineering (Ningbo University),Ministry of Education,China (No.CJ202107);and the State Key Laboratory of Mechanics and Control of Mechanical Structures (Nanjing University of Aeronautics and Astronautics),China (No.MCMS-E-0221Y01).
 CHINESE JOURNAL OF AERONAUTICS2022年12期
- CHINESE JOURNAL OF AERONAUTICS的其它文章
- Control and utilization of range-dependent beampattern with waveform diverse array radars
- Airside pressure drop characteristics of three analogous serpentine tube heat exchangers considering heat transfer for aero-engine cooling
- Numerical analysis of deflection control of a gas plasma jet based on magnetohydrodynamic staggered electrode configuration
- Neural network-based model predictive control with fuzzy-SQP optimization for direct thrust control of turbofan engine
- Method for utilizing PIV to investigate high curvature and acceleration boundary layer flows around the compressor blade leading edge
- Experimental investigation of expansion effect on shock wave boundary layer interaction near a compression ramp
