Method for utilizing PIV to investigate high curvature and acceleration boundary layer flows around the compressor blade leading edge
Baojie LIU ,Xiaobin XU ,Xianjun YU,* ,Guangfeng AN
a Research Institute of Aero-Engine,Beihang University,Beijing 100083,China
b National Key Laboratory of Science &Technology on Aero-Engine Aero-Thermodynamics,Beihang University,Beijing 100083,China
c School of Energy and Power Engineering,Beihang University,Beijing 100083,China
Abstract Particle Image Velocimetry(PIV)is a well-developed and contactless technique in experimental fluid mechanics,but the strong velocity gradient and streamline curvature near the wall substantially limits its accuracy improvement.This paper presents a data processing procedure combining conventional PIV and newly developed Mirror Interchange (MI) based Interface-PIV for the measurement of the boundary layer parameter development in the blade leading edge region.The synthetic particle images are used to analyze the measurement errors in the entire procedure.Overall,three types of errors,namely the errors caused by the Window Deformation Iterative Multigrid (WIDIM) algorithm,the discrete data interpolation and integration,and the wall offset uncertainty,comprise the main measurement error.Specifically,the errors due to the discrete data interpolation and integration and the WIDIM algorithm comprise the mean bias,which can be corrected through the error analysis method proposed in the present work.Meanwhile,the errors due to the WIDIM algorithm and the wall offset uncertainty contribute to the measurement uncertainty.Computational fluid dynamics-based synthetic particle flows were generated to verify the newly developed PIV data processing procedure and the corresponding error analysis method.Results showed that the data processing method could improve the accuracy of PIV measurements for boundary layer flows with high curvature and acceleration and even with significant flow separation bubbles.Finally,the data processing method is also applied in a PIV experiment to investigate the boundary layer flows around a compressor blade leading edge,and several credible boundary flow parameters were obtained.
KEYWORDS Boundary layer measurement;Compressor blade leading edge;Mirror interchange method;Particle image velocimetry;Planar cascade experiment
1.Introduction
The compressor performance is remarkably sensitive to the blade leading edge geometry.1–6Hence,a detailed experimental investigation of the boundary layer flow around the compressor blade leading edge is crucial.However,accurately measuring the boundary layer flows near the compressor blade leading edge is considerably difficult due to the small scale and large curvature change and the possible appearance of flow separation.
Compared with pointwise measurement techniques,such as pneumatic probe,7hot-wire,2and laser Doppler velocimetry,8Particle Image Velocimetry(PIV)is a substantially appropriate technique for the measurement of boundary layer flows because it can simultaneously capture all the flow structures in the velocity field with high spatial resolution.However,the strong velocity gradient and laser reflection near the wall significantly limit the measurement accuracy.
Many studies have been conducted to reduce the influence of velocity gradient on the measurement accuracy of PIV.For example,Huang et al.9proposed the iteration Particle Image Distortion(PID)method by eliminating the local deformations of the particle images to overcome the limitations of the conventional PIV.Based on the work of Huang et al.9,Lecordier and Trinite10added the iterative sub-pixel algorithm into the PID method to further improve its performance.Scarano11then raised the Window Deformation Iterative Multigrid (WIDIM) algorithm,which considers the local velocity derivatives to perform a local increase in the interrogation spatial density,to enhance the spatial resolution.These methods generally improve the accuracy of PIV in highvelocity gradient environments.
However,except for the velocity gradient,the existence of the wall also has a prominent influence on the measurement accuracy of PIV in the boundary layer flows.Nguyen et al.12,13introduced the Interface-PIV (IPIV) algorithm,which transforms the fluid flow along the curvilinear coordinates into Cartesian coordinate,through the application of the image transform technique on the curved wall image.Jeon and Sung14applied the texton method in interface tracking,which significantly improved the accuracy of curve wall recognition in particle images.Zhu et al.15developed a near-wall particle image pre-processing method named Synthetic Particles (SP)method,which replaced the mask-out method in the solid region with stationary particle images,to improve the accuracy of data processing near the wall.Jia et al.16provided further efforts by combining the SP IPIV methods for good robustness for measuring velocity profiles near moving interfaces.Zhu et al.17introduced another method of the iterative PIV algorithm to investigate transitional wall-bounded flows,which presented a superior behavior in evaluating the transitional complex wall-bounded flows.Liu et al.18presented an effective image pre-processing method,namely the Mirror Interchange(MI) method,to eliminate the calculation error of the discrete velocity gradient in the normal direction near the wall.Masullo and Theunissen19recently focused on Laplace smoothing on the mapping grid in the image transform process,which could reduce the error caused by the image transformation.
The accuracy of PIV measurements in the boundary layer flows can be markedly improved by using the abovementioned advanced PIV image processing methods for the velocity gradient and the existing solid wall.However,the thin boundary layer thickness for the boundary layer flow around the compressor blade leading edge can lead to a low tracing particle distribution density and a considerably high velocity gradient,thus complicating the problems.Moreover,the rapid change in the blade surface curvature leads to a strong velocity gradient in the streamwise direction,which results in a violent variation of the boundary layer shape factor.Thus,this phenomenon complicates the measurement of the boundary layer flow around the compressor blade leading edge.Unfortunately,studies concerning this question can be rarely seen in published literature.
The present work aims to develop a credible particle image data processing procedure to measure the boundary layer parameters near the compressor blade leading edge.Combined procedures,including the conventional PIV and IPIV methods,will be used to deal with the complicated factors,which influence the measurement accuracy of the boundary layer parameters.Except for the image and data processing procedure,the comprehensive analysis method of the measurement uncertainty will also be developed.Synthetic particle images will be processed and analyzed before the experimental application in a planar compressor cascade experiment to verify the developed particle image data processing procedure and the comprehensive analysis method of the measurement uncertainty.
2.Particle image processing procedure
As mentioned above,large curvature,rapid thickening of the boundary layer,and the occurrence of backflows are the main features of the flow near the compressor blade leading edge.At the typical inflow condition with positive incidence,Fig.1(a)exhibits the boundary layer flows in leading edge region,and Fig.1(b) shows the quantified values of the boundary layer thickness (δ) and the shape factor (H) along the arc length from leading edge (s,normalized with the arc lengthS0from leading edge to trailing edge).A particle image processing procedure combining the conventional PIV with IPIV is presented in Fig.2 to measure the complicated flow field accurately.This procedure includes the following six steps.
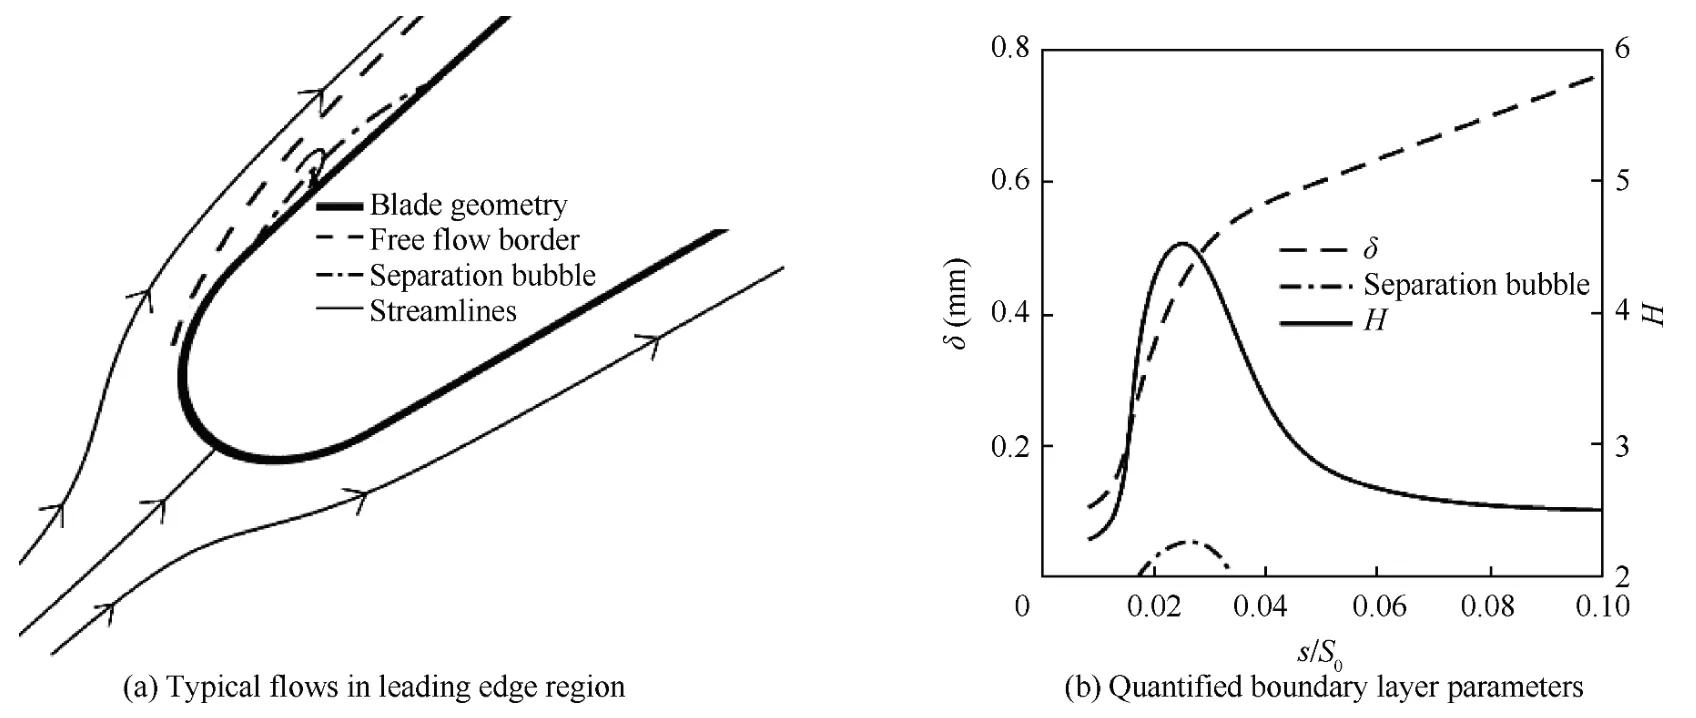
Fig.1 Schematic of typical boundary layer flows in leading edge region.
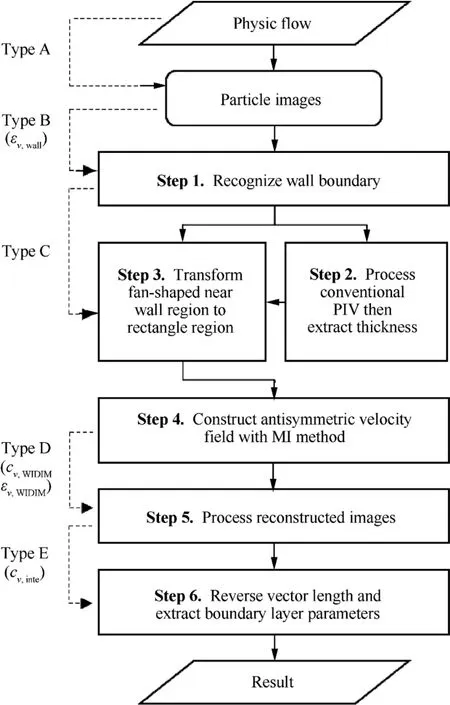
Fig.2 Proposed particle image processing procedure.
Step 1.Recognize the wall boundary in the particle image.
Step 2.Process conventional PIV for the entire particle image and extract the boundary layer thickness.
Step 3.Find the blade boundary layer region base on the wall curvature and the boundary layer thickness and then transform the particle images in this region into Cartesian coordinates.
Step 4.Construct antisymmetric velocity fields by using the MI method to increase the accuracy near the wall.
Step 5.Calculate the velocity field with the transformed reconstructed images.
Step 6.Reverse calculate the vector length in the streamwise direction with the compression ratio and then compute the boundary layer parameters based on the reversed velocity profiles.
2.1.Recognition of wall boundary
The method proposed by Jeon and Sung,14which was developed from texture analysis,20was used to recognize the wall boundary.This method focuses on the construction of the texton image and the image registration between the original image (Fig.3(a)) and the texton image (Fig.3(b)).The crosscorrelation coefficient presents the level of similarity between the texton and original images.The generation of the texton image in the present study depended on the following five characteristics of the light line: intensity distribution in the normal direction,It;tangent angle of the texture in the texton image,θt;width of the texture,ct;the radius of curvature of the line,rt;and the pixel scale,lt,as shown in Fig.3(b).Moreover,a circular mask is executed on the texton image to consider the uniform length weights of the textures with different θt.
The ‘‘wall location procedure” can be executed after the generation of the texton image.In the ‘‘wall location procedure”,a series of cross-correlation coefficients were calculated between the texton image and the selected part of the original image(shown as the red dashed box in Fig.3(a),which moves into the wall-normal direction).A peak locating method based on the sub-pixel interpolation technique was then employed to find the peak position of the cross-correlation coefficients.Consequently,the peak position indicates the wall position.

Fig.3 Schematic of wall boundary recognition.
In the ‘‘wall location procedure”,the accuracy of the wall position is relevant to the parameters of the texton image.A two-pass procedure is employed for any particle image with reflect line to obtain the texton parameters and the wall geometry.
Initial pass.AssumeItsatisfies Gaussian curve andrttrends toward infinity,and θt(as well asct)is equal to the nearest recognized wall point.Then,
Step 1.Generate the texton image with previous θtandct,and then find the wall position imprecise with the ‘‘wall location procedure”.
Step 2.Pick the partial image from the original image bases on the wall position.
Step 3.Generate a series of texton images with variable θt,and then calculate the cross-correlation coefficients between the texton and partial images to find the best-match θtthat provides the maximum coefficient.
Step 4.Generate a series of texton images with variablectto find the best-matchctin the similar method in Step 3.
Step 5.Generate the texton image with the best-match θtandct,and process the‘‘wall location procedure”for the accurate wall position.
Step 6.Move the interest area along the direction base on θt,and then process another loop of Steps 1–5.
Final pass.Select a part of the reflect line as straight as possible (as shown in Fig.4(a)).Calculate the average intensity distribution in the normal direction base on the extract lines on the wall geometry (the distances between each extract line are 1 pixel),and then determine the approximate function of the intensity distribution (as shown in Fig.4(b)).In Fig.4(b),the gray lines denote the intensity of the original image at different streamwise locations;the red dot denotes the average of the gray lines;the blue dot line is the approximate function of the red dot.In the present work,the approximate function of the intensity distribution in the normal direction can be described by Eq.(1),wherehis the distance to the wall,Ais the amplitude constant,and two constant parameters are selected asm=2.5 andp=2.2.The pixel scale of the texton images depends on the effect of the average length while calculating the approximate function,as shown in Fig.4(c).The correction factor slightly increases,while the average length is larger than 32 pixel.Thus,the scale of the texton image is chosen as 32 pixel×32 pixel in the present work.In addition,the radius of curvature can be calculated from the wall geometry from the initial pass.On these bases,Steps 1–6 in the initial pass will be processed again for the final result of the wall geometry.

The cross-correlation method applied to calculate the displacement of the particle pairs in the WIDIM algorithm of the IPIV data processing is used for image registration between the texton and original images.Therefore,with the application of the high-order peak location method,the accuracy of the wall boundary recognition can be estimated through associated studies of PIV;that is,approximately 0.5 pixel for the large particles (particle diameterdp=12 pixel).21The thickness of the reflective band in Fig.4(b) is approximately 12 pixel.Hence,the standard deviation of the wall boundary recognition error is 0.5 pixel in the present work.

Fig.4 Acquirement of approximate function of intensity distribution.
2.2.Processing conventional PIV
The solid region in the particle images is marked and replaced by the digital mask in the conventional PIV procedure after the wall boundary recognition.Three passes 32 pixel × 32 pixel and three passes 16 pixel×16 pixel interrogation windows are employed while processing the particle images to achieve the WIDIM algorithm with 50% overlap.The boundary layer thickness can be extracted with the discrete result of the velocity field.Moreover,only the boundary layer thickness is needed in this step to determine the near-wall boundary layer region.
2.3.Transformation of blade boundary layer region
The IPIV algorithm transforms the near-wall fan-shaped region in original images into Cartesian coordinates by utilizing image resampling.Following the work of Kim and Sung,22the ‘‘cubic” scheme is selected as the interpolation scheme in the transformation of particle images.The original image and the leading edge part of the transformed image are shown in Figs.5(a)and 5(b)respectively,in whichnshows the normal direction andSshows the streamline direction.The circular particles in the fan-shaped region will turn into elliptical particles in the regular region after the transformation,as shown in Figs.5(c) and 5(d).While transforming the image,the deformation strength in the streamwise direction can be expressed as compression ratio (CR,in Eq.(2)),in which ρ is the curvature(pixel-1)of the wall.In the wall-normal direction,CR=1 owing to the uniform spacing.
The effect of the image compression on the vector length has been considered,but the compression will affect the particle diameter in the streamwise direction,which will influence the solving precision.21Hence,if the deformation of the particle shape is substantially strong,then the accuracy of the PIV process would significantly decrease.The limit of the wall curvature and employing super resolution resampling can induce the phenomenon.The limit of the particle diameter is expressed as Eq.(3),wheredpis the particle diameter (pixel)in the original image,dp,limitedis the smallest particle diameter(pixel) limited by the PIV algorithm (dp,limitedis estimated as 0.8 pixel in the present work),SF0is the scale factor(mm·pixel-1)of the original image,and SF1is the scale factor(mm·pixel-1) of the transformed image.Therefore,the height of the transformed region in the present study is set to 1.5–2 times of the maximum boundary layer thickness,and SF1on the wall is set as equal to SF0.This setting considers the accuracy and computation time.

2.4.Construction of antisymmetric velocity fields
The MI method proposed by Liu et al.18is used as the preprocessing method of the IPIV.This method not only matches the non-slip wall boundary condition by constructing an antisymmetric velocity field(as shown in Fig.6,uandU0mean the steamwise velocity and the mainstream velocity respectively) but also eliminates the calculation error of the discrete velocity gradient in the normal direction.Hence,the accuracy of the IPIV result can be further improved.

Fig.6 Schematic of mirror interchange method.18
2.5.Processing of reconstructed images
A standard WIDIM algorithm is employed to process the reconstructed images,and the setup of the WIDIM algorithm is similar to that used in Section 2.2.
2.6.Reversal of vector length and extraction of boundary layer parameters
The CR value of each pixel was recorded in the image transformation in Step 3(Fig.2),and the averaged value of CR in each interrogation window will be used to calculate the real velocity vector length for the final result.The real velocity profile is obtained by considering the scale factor of the particle image and the reference time,and the boundary layer parameters are calculated.
3.Error analysis
Synthetic particle images were employed as the study object to analyze the measurement error of the aforementioned particle image processing procedure,and the parameters of the synthetic particle images were introduced in Section 3.2.The velocity field of the synthetic particle images,which is extracted from the CFD results of CDA(Controlled Diffusion Airfoil)compressor airfoils,was obtained in accordance with a series of velocity profiles as shown in Fig.7.Table 1 shows the typical parameters of the airfoil.ANSYS CFX 18.0 was used as the CFD solver.Additional details regarding the CDA airfoils and the CFD setup are presented in Ref.23.

Table 1 Typical parameters of planar cascade.
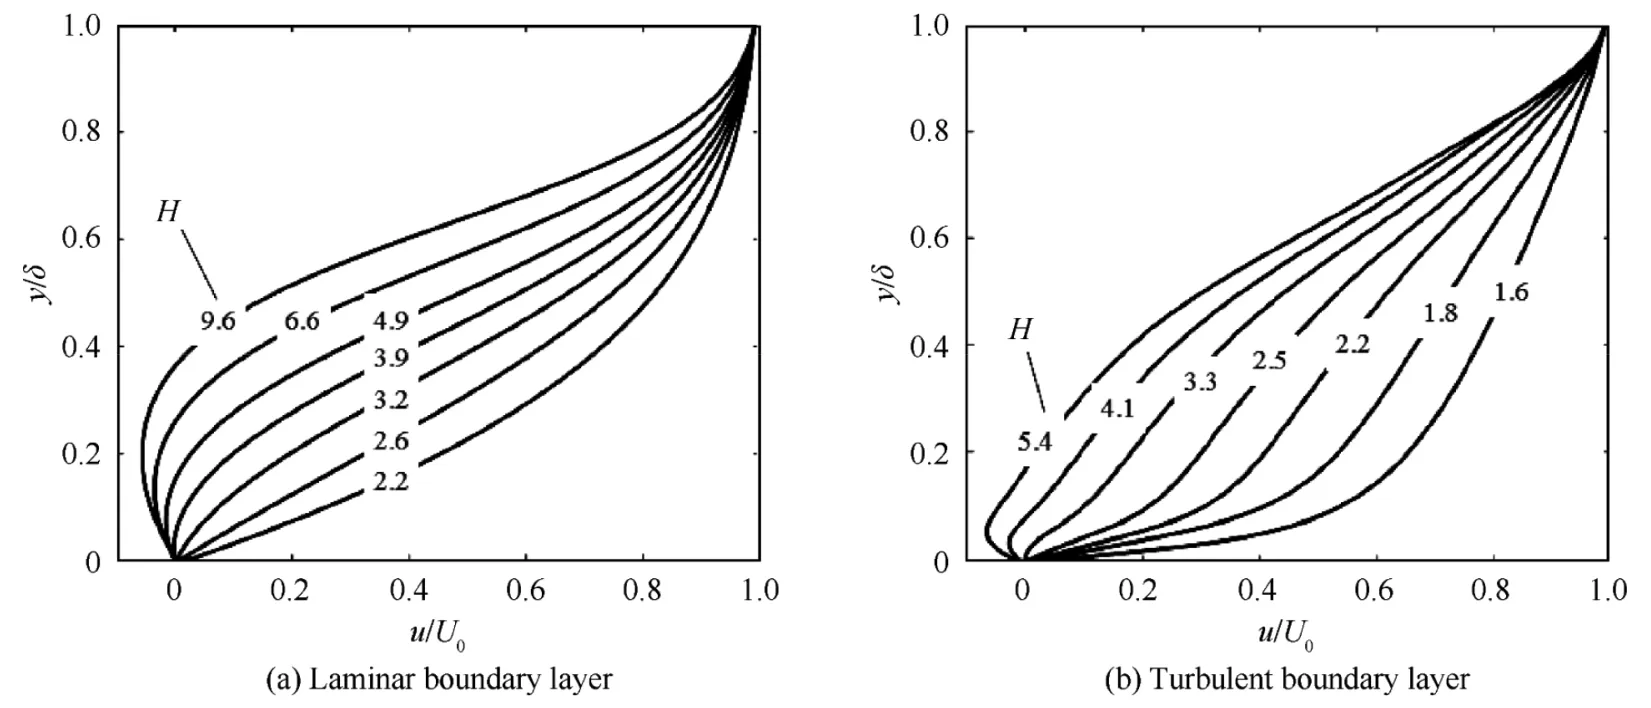
Fig.7 Series of boundary layer velocity profiles with different shape factor H.
Titchener et al.24revealed that the measurement error for different turbulent boundary layer flows is identical as long as they have the same shape factor,H.This conclusion should be also applicable for the laminar boundary layer because it follows the same kinematic equation with the turbulent boundary layer.25Except for the shape factor of the boundary layer,another factor that may significantly influence the measurement error is the measurement resolution,24which could be quantified by the ratio of the boundary layer thickness,δ,and the grid spacing in a square grid,ΔL,defined asNin Eq.(4).Hence,the error analysis will be discussed in this section under different shape factors and grid densities.
3.1.Error decomposition
Five main sources of errors could be determined on the basis of the boundary layer flow data processing procedure proposed in Section 2 (Fig.2),and the corresponding error propagation method is shown as the dashed line in Fig.2.The five error types are as follows.
Type AError in particle image capturing procedure,which is based on particle tracking capability.
Type BError caused by the uncertainty of the wall boundary recognition (Step 1 in Fig.2).
Type CError due to the transformation of the blade boundary layer region from fan-shaped into a rectangle (Step 3 in Fig.2).
Type DError resulting from the IPIV data processing,that is,the error due to the WIDIM algorithm (Step 5 in Fig.2).
Type EError originating from the interpolation or integration in the calculation of the boundary layer parameters (Step 6 in Fig.2).
Among these types,A,C,and D belong to the error caused by the bias between the acquired velocity field and the real one;Types B and E belong to the error resulting from the extraction of the boundary layer parameters from the velocity field.The Stokes number of the particles satisfiesStk<0.1,which presents the flow tracing accuracy with errors below 1%.26Type A is ignored in the present work due to the workability of the small value ofStkin the experiment.According to Kim and Sung,22the error of Type C using the cubic interpolation method in the transformation is considerably small and negligible compared with other errors.Hence,only Types B,D,and E will be comprehensively analyzed in the present work.
Moreover,each error for Types B,D,and E could be divided into bias error and measurement uncertainty.21The bias error is mainly caused by the system or known algorithm errors.The measurement uncertainty mainly comes from a probabilistic basis or other random errors.In this paper,symbol ‘‘v” stands for any boundary layer parameter in general formula.In the particle image processing procedure,the error Type D can be divided into the bias error εv,bias,WIDIMand the measurement uncertainty εv,rms,WIDIM.21However,the error Type E only contains the bias error εv,bias,inte,and the error Type B only contains the measurement uncertainty εv,rms,wall.15As the bias error can be corrected through the error analysis,thus,in this papercvis used to express the correction factor of bias errors instead of εv,bias,and εvis used to instead of εv,rmsfor short.Moreover,in this paper,the subscript‘o’means the truth value,and the subscript ‘r’ means the result value without error correction.Hence,for any boundary layer parameter,the calculation of the measurement uncertainty,εv,follows Eq.(5),and the correction factor of bias errors,cv,follows Eq.(6).The final measured boundary layer parameters are expressed as Eq.(7).


3.2.Generation of synthetic particle images
Compared with experimental images,synthetic particle images have advantages in investigating the PIV algorithm because they can easily gain numerous images with specified velocity fields.Raffel et al.21revealed that the particle image features,such as the diameter,shape,and spatial density,should be considered when generating the synthetic particle images.Parameters of the synthetic particle images in this study are determined as follows after analyzing the experimental images:the particle diameter is 1.5–2.5 pixel,the particle distribution density is 0.021–0.048 particle/pixel,the background random noise is set as (0.1 ± 0.05)It,max,and the Gaussian bellshaped curve is chosen to simulate the particle intensity distribution.
3.3.Interpolation and integration errors
A series of one-dimensional discrete velocity profiles are generated by interpolating from the continuous velocity profiles shown in Fig.7 to analyze the interpolation and integration error.In this section,vrandvoin Eq.(6) respectively denote the boundary layer parameters calculated from the discrete and continuous velocity profiles.In addition,Titchener et al.24proposed that linear interpolation and first-order integration are more robust than high-order interpolation or integration.Hence,linear interpolation and first-order integration are used in the present work.
Fig.8 shows the variation ofcδ,intealong with the shape factor (H) and grid density (N) for the laminar and turbulent boundary layers.The calculated δ for a continuous or a discrete velocity profile with an infiniteNwill generally be equal to the ideal value.However,for a discrete velocity profile with a finiteN,the calculated δ is no longer equal to the ideal value because the value ofcδ,inteis also related to the shape factor of the boundary layer and the second derivation of the velocity profile near the border of the boundary layer varies with the shape factor.A large second derivation of the velocity profile results in a large linear interpolation error.Consequently,the recognition error of the boundary layer border varies with the shape factor when linear interpolation is used.This phenomenon can be observed in Fig.8(a) for the laminar boundary layer.
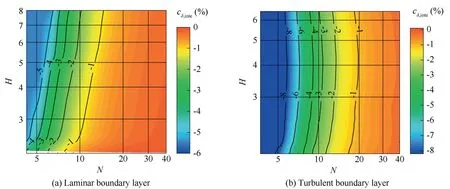
Fig.8 Variation of cδ,inte along with H and N.
Fig.9 shows the variation ofcH,intealong with the shape factor (H)and the grid density (N) for the laminar and turbulent boundary layers.The following observations are noted: whenHis constant,cH,intedecreases with the increment ofN;whenNis constant,the absolute value ofcH,intedecreases to zero around a critical value and then increases with the increment ofH.The analysis on the displacement thickness of boundary layer,δ*,and the momentum loss thickness of boundary layer,θ,can explain the tendency.Fig.10 shows the variation ofcδ*,inte,cθ,inte,andcH,intealong with the shape factor with a constantN.Results reveal thatcδ*,inteincreases whilecθ,intedecreases with the increment ofH.Therefore,whencδ*,inteis smaller thancθ,inte,cH,intewill be negative,and vice versa.This finding can explain the variation ofcH,intealong withH.In addition,His calculated by δ*and θ;thus,only the error of δ andHwill be analyzed in this paper due to limited space.
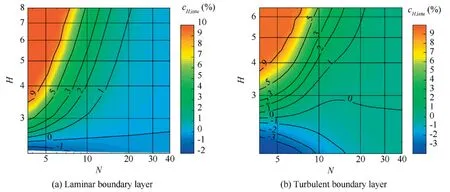
Fig.9 Variation of cH,inte along with H and N.
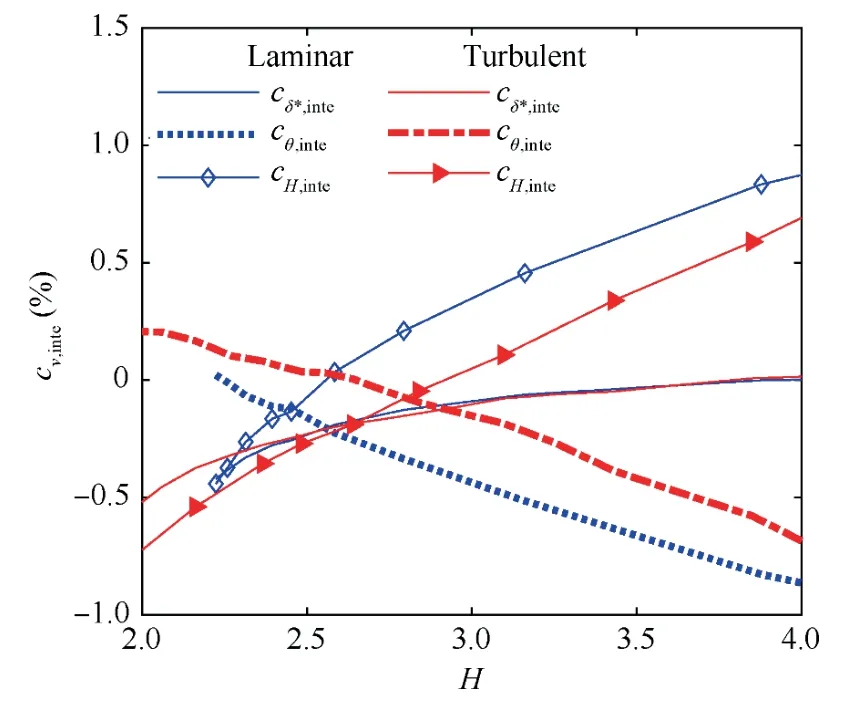
Fig.10 Variation of cv along with shape factor while N=15.
3.4.Error due to WIDIM algorithm of IPIV data processing
A series of synthetic particle images with different δ andHare generated to analyze the error caused by the WIDIM algorithm.The velocity profile along the streamwise direction is set to be fixed for any synthetic particle image.In this section,thevrin Eqs.(5)and(6)means the boundary layer parameters calculated from the discrete velocity profiles through the IPIV data processing;vodenotes the boundary layer parameters calculated from the discrete velocity profiles generated by interpolation from the known continuous velocity profiles;and ΔLis identical for the two discrete velocity profiles.
Figs.11 and 12 show the variation ofcv,WIDIMand εv,WIDIMalong with the shape factor and the grid density respectively.Notably,these results are closely associated with the particle image features.Hence,the error analysis results may be different for PIV particle images with varying features.
3.5.Error due to recognition of wall boundary
Unlike error Types D and E,the influence of the wall boundary recognition on the accuracy of the calculated boundary layer parameters mainly reflects on the shift of the velocity profile in the normal direction.For example,the relationship between the measured and actual velocity profiles when the recognized wall boundary invades into the solid region can be expressed as the results shown in Fig.13.Profiles 2 and 3 respectively show the effect of the wall offset on the conventional single-point boundary layer measurement and PIV.The redistribution of discrete spacing points induces uncertainty on the different wall offset responses on PIV and other conventional single-point boundary layer measurements.For the calculation of δ*,the error equals to the area of the shadow region.The error for the other boundary layer parameters is also due to the existence of the shadow region.
Δx0is the distance between the recognized wall boundary and its actual location,and Δx0>0 means that the recognized wall boundary invades into the solid region.Fig.14 shows the relationship between the change of the boundary layer parameters and Δx0of a laminar boundary layer profile withH=2.4,N=10.For δ,Δδ is equal to Δx0because the wall boundary recognition does not affect the velocity profile near the boundary layer border.For δ*,the relationship between Δδ*and Δx0is almost linear because the area of the shadow region shown in Fig.13 is only slightly smaller than that of the region between Profile 1 and Profile 2,that is,Δδ*is also equal to Δx0.For θ,the relationship between Δθ and Δx0is no longer linear because its calculation is the quadratic function of the velocity.However,the relationship between εHand Δx0is also almost linear when the value of Δθ is considerably smaller than Δδ*.

Fig.11 Variation of cv,WIDIM along with H and N.

Fig.12 Variation of εv,WIDIM along with H and N.
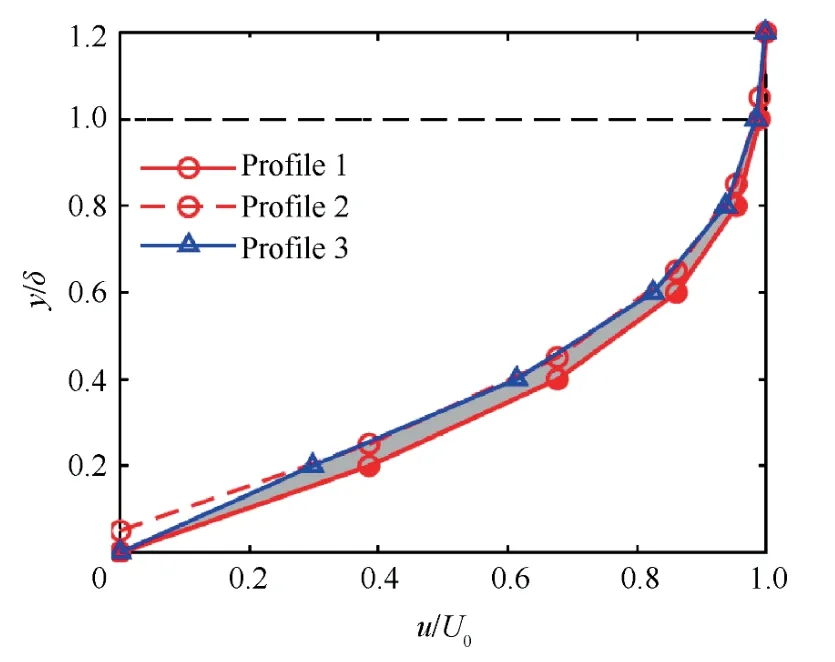
Fig.13 Influence of wall offset with discrete boundary layer(Profile 1: Discrete velocity profile without wall offset;Profile 2:Translation of Profile 1;Profile 3: Discrete velocity profile with wall offset).

Fig.14 Variation of parameter changes along wall offset(H=2.4, N=10).
Considering that δ andHare linear relating to Δx0,the measurement uncertainty of the calculated boundary layer parameters due to the recognition of the wall boundary could be expressed as Eq.(8),wheresv,walldenotes the change in the calculated boundary layer parameters when the change in Δx0is equals to 0.01δ.The above analysis indicates thatsδ,wallis equal to 1/101,andsH,wallis related toNandH.For example,sH,wall=1/0.4 whenH=2.4,N=10,as shown in Fig.14.sH,wallfor differentHandNcan be found in Fig.15.An infinity-greatNresults in a constantsH,wallfor continuous velocity profile.However,the value ofsH,walldecreases significantly asNis much small.This phenomenon indicates that a smallerNvalue has advantages in the calculation error of shape factor.This is because that whenNis smaller,the displacement between the first discrete point and the real position of the wall boundary is larger.Consequently,the ratio of the shadow region area (shown in Fig.13) to the region between Profile 1 and Profile 2 decreases.Hence,sH,wallbecomes smaller.
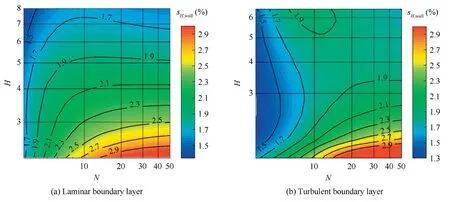
Fig.15 Correction factor of wall offset on H.

3.6.Comprehensive analysis of measurement uncertainty
Overall,the bias error could be corrected with the application of an appropriate method.Therefore,the final measurement accuracy is evaluated by the measurement uncertainty.Fig.16 shows the total measurement uncertainty ofHcomposed by εH,WIDIMand εH,wall(with the experimental scale factor and the IPIV setup,as described in Section 4.2).The minimumNshould be approximately 7 for a credible measurement (the standard deviation of error lower than 2.5%).IfNis larger than 20,the accuracy benefit for the increase inNis substantially small.
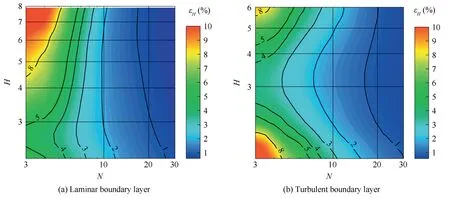
Fig.16 Comprehensive measurement uncertainties on H.
4.Application of particle image processing procedure
The above analysis reveals that the particle image processing procedure and the error analysis method were applied to an experimental investigation of the flow field around the CDA blade mentioned in Section 3 (Table 1) in a planar cascade by using PIV.Fig.17 shows the schematic of the blade and the camera range of the PIV measurement.The accurate camera field-of-view shown in Fig.17 is calculated on the basis of the boundary layer thickness obtained in the CFD results,and the physical size is 14.5 mm × 14.5 mm.The error analysis is first verified by using the CFD method.Different incidence angles and Reynolds numbers are considered to create different boundary layer flows to cover sufficient camera field-ofview.
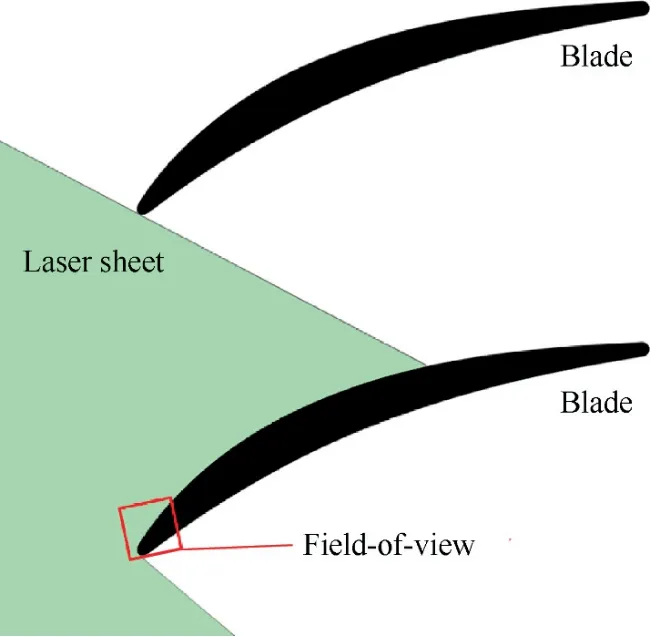
Fig.17 Schematic of camera field-of-view on blade.
4.1.Verification of error analysis based on CFD results
Instead of the experiment images,synthetic particle images generated by using the velocity field of the CFD results are used to process the procedure raised in Fig.2 to verify the error analysis.The CFD velocity field has a considerably high spatial resolution,and the mesh grid near the wall is orthogonal.Therefore,the calculated boundary layer parameters using the CFD results are sufficiently credible to be taken as the truth value of the synthetic particle images.Hence,the difference between the results from the procedure and those from the CFD results could be used to assess the validity of the error analysis.
4.1.1.Verification at design incidence angle with well-developed laminar boundary layer
When the blade works at the design incidence angle,that is,the incidence anglei=0°,the boundary layer on the blade suction side near the leading edge region is characterized by its thin thickness and rapidly growing procedure.The Reynolds number is set as 1.2×10⁵in this section to investigate the laminar boundary layer without separation bubbles.Investigating the variation response ofNis applicable while the boundary layer shape factor changes slightly at the design incidence angle.A 1.5 times camera field-of-view (22 mm × 22 mm) is employed for the investigation of the minimum credible value ofNin this section.With the selecting of 12 pixel ×12 pixel interrogation window,the grid spacing ΔLis 0.06445 mm,resulting in a variation ofNfrom 3.1 to 12 at different streamwise locations.
In the investigated incidence condition,the boundary layer flow keeps laminar in the camera field-of-view.Fig.18(a)shows the post-processed results of δ by using IPIV data processing method.The non-corrected value δr,the corrected value δcorr(the error bars correspond to the standard deviation of 68% confidence probability,which will be adopted in the following analysis),and the truth value δoare compared in this figure.Fig.18(b)shows the relative error for the non-corrected and corrected values of δ.The boundary layer at the blade leading edge region is remarkably thin but grows rapidly.Hence,the error of δ rapidly decreases from 20%to lower than 5%and then gradually approaches zero.The error of δ significantly decreases after the correction,and the truth value is covered by the error band.The existing high error of the start point is due to a substantially smallN(approximately 3.1,considerably less than 7).
Fig.19(a)shows the post-processed result ofHand the corresponding corrected and truth values.Fig.19(b) shows the error distribution for the non-corrected and correctedH.The results indicate that the corrected results coincide well with the truth value.Hence,the correction method is effective,which reduces the maximum relative error from 10% to less than 1.0%.
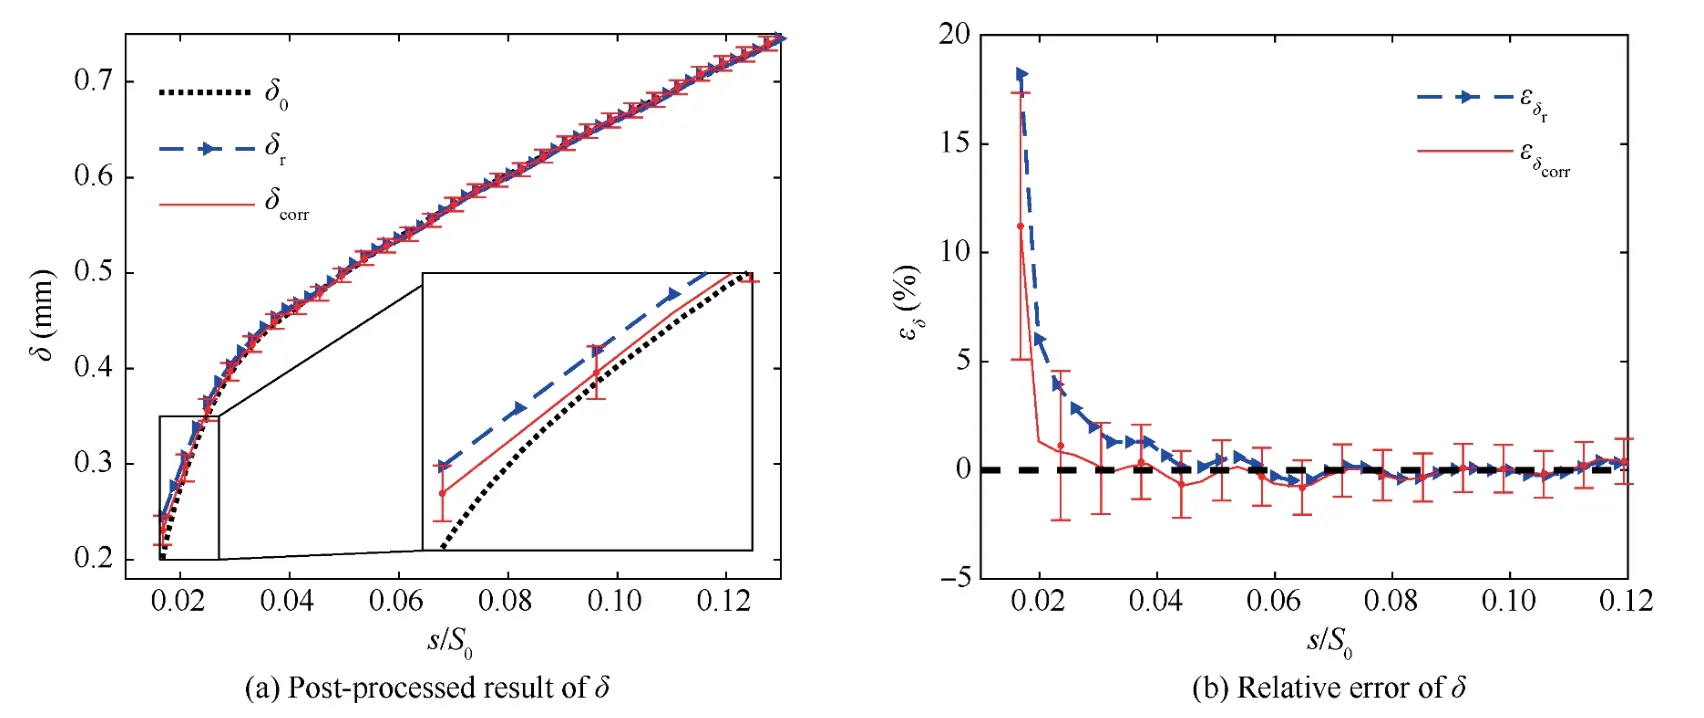
Fig.18 Post-processed result and relative error of δ at i=0°.

Fig.19 Post-processed result and relative error of H at i=0°.
εHris higher than εδrbased on the comparison results shown in Figs.18(b)and 19(b).The correction factors utilized to calculateHcorrare plotted in Fig.20,which also presents the main factors that influence the calculation accuracy of boundary layer shape factor.cH,WIDIMand εH,WIDIMcomprise most of the measurement error and decrease with the thickening of the boundary layer.cH,inteis also remarkable,whileNis substantially small (such asN=3.4 ats/S0=0.019).However,Nbecomes remarkably small when the boundary layer is sufficiently thick downstreams/S0=0.04.Unlike the above errors,εH,wallbarely changes with the streamwise location and comprises most of the measurement uncertainty.The error analysis method could effectively predict the error level of the boundary layer measurement at the design condition.
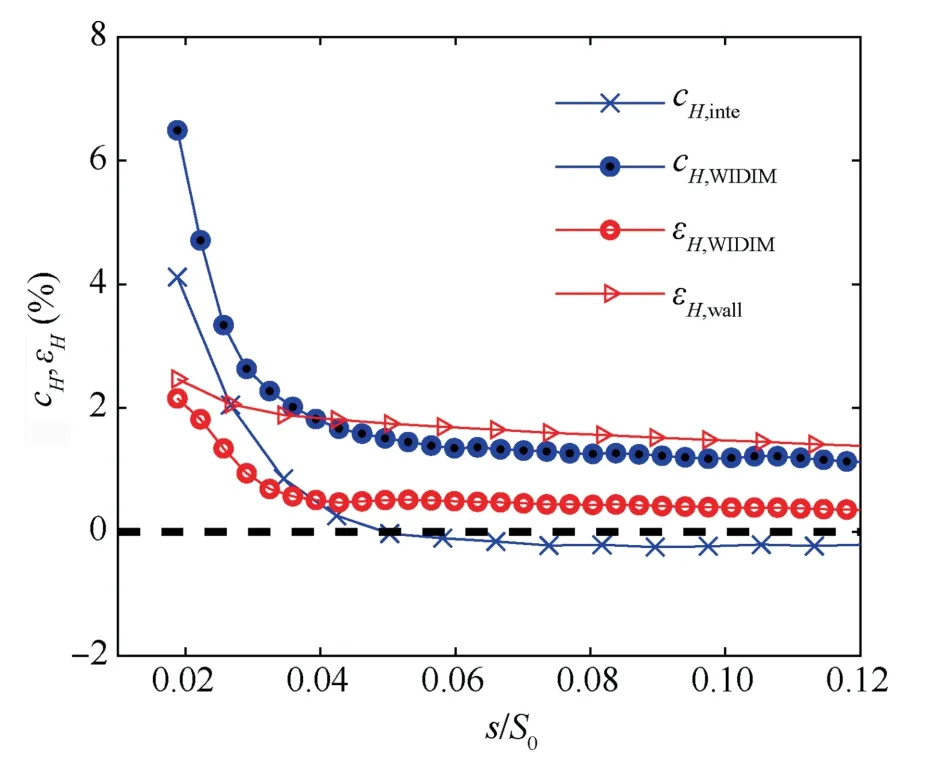
Fig.20 Distribution of each errors of H along streamwise location at i=0°.
4.1.2.Verification at positive incidence angle with a small separation bubble
When the blade works at a critical positive incidence angle(i=icr),the boundary layer on the blade suction side near the leading edge region features a rapidly growing procedure and the generation of a small separation bubble.The boundary layer shape factor rapidly grows (larger than 4) near the separation bubble and then drops to its usual value(less than 3)in the streamwise direction.The standard camera field-of-view mentioned in Fig.17 is employed in this section to focus on the separation bubble,the grid spacing ΔLis 0.04248 mm,resulting in a variation ofNfrom 6 to 14 at different streamwise locations.Even a small separation bubble exists at this condition,the boundary layer flow remains laminar in the entire camera field-of-view.
Fig.21(a)shows the post-processed result of δ by using the IPIV data processing method and plotted as the non-corrected value δr,the corrected value δcorr,and the truth value δoversus the normalization arc length.The development of the boundary layer thickness is quite similar to that plotted in Fig.18(a).Fig.21(b) shows the relative error for the non-corrected and corrected values of δ.The error of δ significantly decreases after the correction,which is similar to the results shown in Fig.18(b).
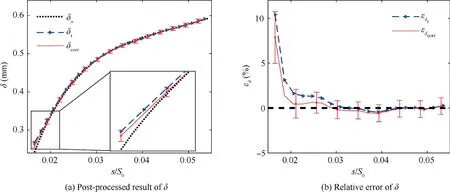
Fig.21 Post-processed result and relative error of δ at i= icr.
Fig.22(a)shows the post-processed result ofHand the corresponding corrected and truth values.Fig.22(b) shows the error distribution for the non-corrected and correctedH.At this condition,the small separation bubble leads to the backflow near the blade suction side,that is,the backflow region shown in Fig.1(a),and the boundary layer shape factor rapidly grows to a maximum value and then gradually drops.However,the backflow does not affect the correction of the shape factor because the error ofHafter correction is less than 1%in Fig.22(b).Hence,the final results coincide well with the truth value.Therefore,the error analysis method could also effectively predict the error level of the boundary layer measurement at this condition.
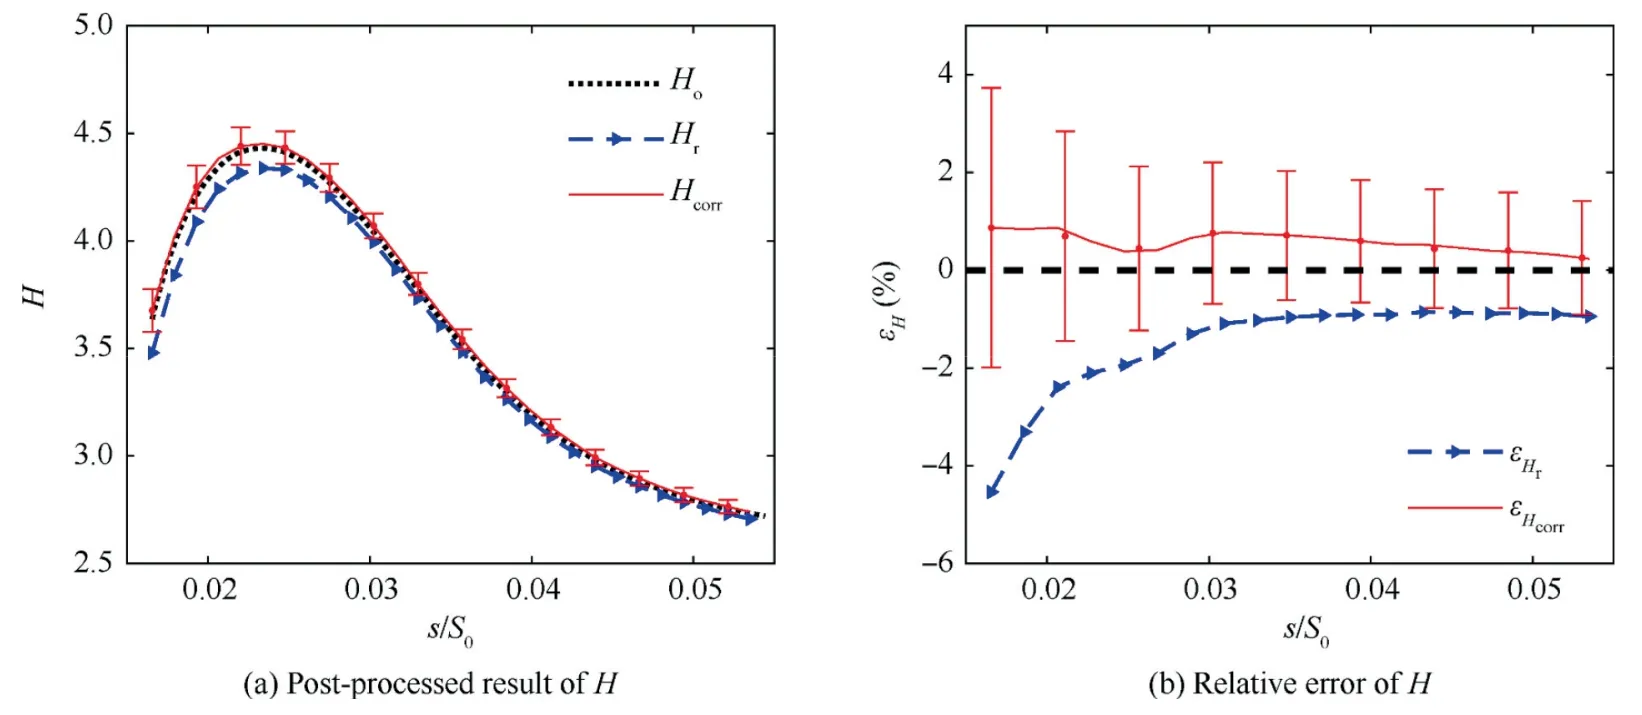
Fig.22 Post-processed result and relative error of H at i= icr.
4.1.3.Verification at substantially large positive incidence angle with a huge separation bubble
In Sections 4.1.1 and 4.1.2,the work conditions are set at a low Reynolds number.Hence,the boundary layer flow in the camera field-of-view remains laminar.To verify the error analysis in the turbulent boundary layer,the Reynolds number is increased to 5.5 × 10⁵,and the incidence angle is set to +6°.At this condition,the stagnation point moves toward the blade pressure side and the boundary layer on the suction side has a violent reverse flow,hence,the boundary layer thickness is much thicker than the results shown in Sections 4.1.1 and 4.1.2.As a grid spacing ΔLof 0.04248 mm,Nvaries from 4.5 to 18 at different streamwise locations.Consequently,the laminar boundary layer flow transforms into the turbulent boundary layer near the leading edge,resulting in a remarkably large variation of the shape factor.
Figs.23 and 24 show the data processing results of δ andH,respectively.The development procedure of δ andHis similar to the results shown in Section 4.1.1 but with a rapid growth speed.The shape factor at this condition exceeds the range of the investigated velocity profiles above due to the transition of the boundary layer.Hence,a linear extrapolation is employed in the separated region(shown as the shadow region in Figs.23 and 24).With the utilization of the extrapolation,the correction method is still effective.After the transition of the boundary layer,the error of the corrected parameters becomes very small.Hence,the error analysis method for the flow with a huge separation bubble and the turbulent boundary layer is also effective.
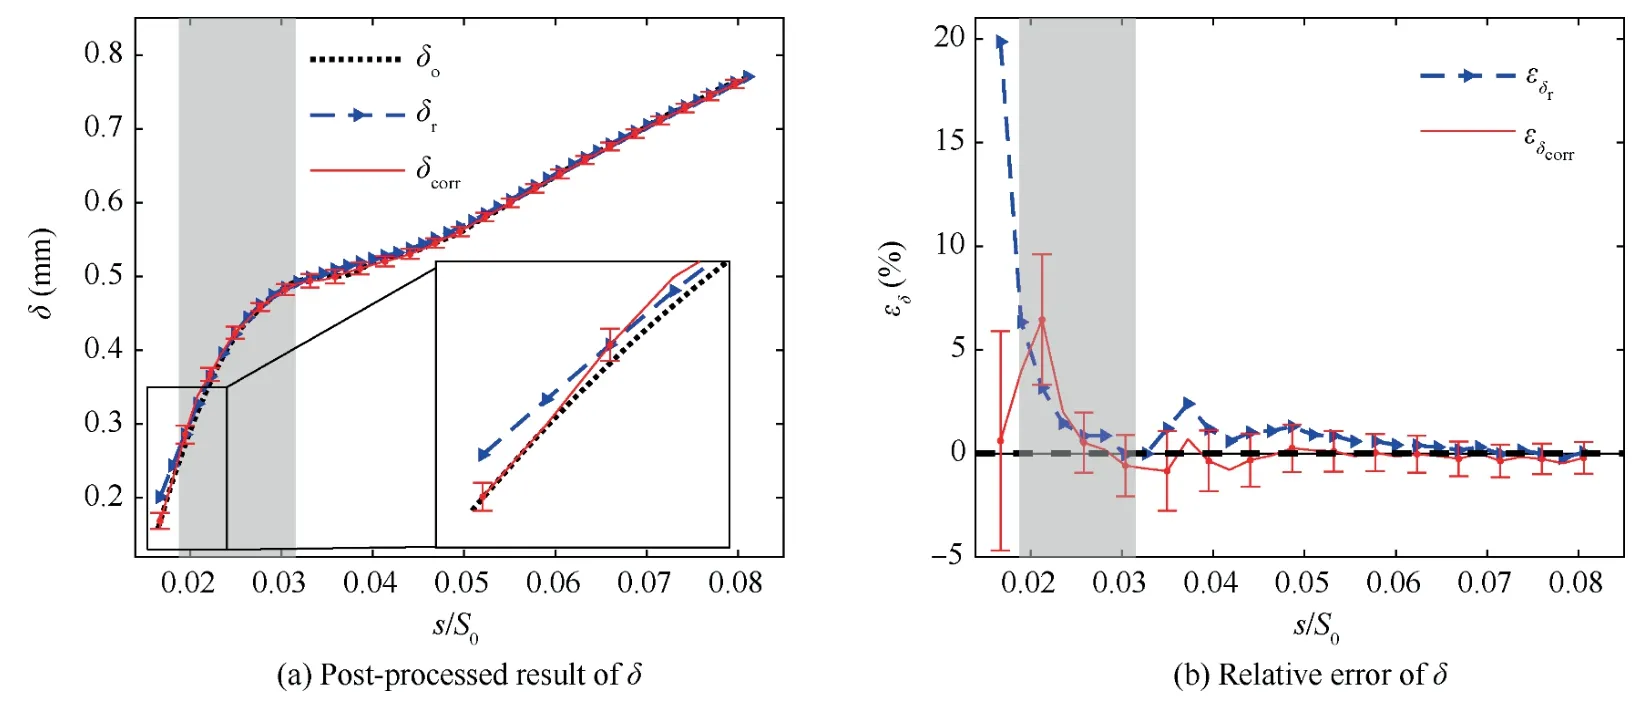
Fig.23 Post-processed result and relative error of δ at i=+6°.
4.2.Experimental application in a compressor cascade
4.2.1.Experiment setup
The experiment was conducted at the low-speed planar cascade wind tunnel located in Beihang University.The wind tunnel has a rectangular cross-section of 120 mm × 420 mm,and the typical parameters of the cascade are listed in Table 1,additional details regarding the experiment facility are presented in Ref.23.The blade incidence angle condition was+3.5°,and the Reynolds number was 2.73×105.A small separation bubble could be observed at this condition near the leading edge.A 140 mJ/Pulse Nd:YAG laser was employed,and the light sheet thickness was approximately 1 mm.ImagerProX-4M camera with a Nikon Micro 105 mm lens and a resolution of 2048 pixel×2048 pixel(at 4 Hz recording rate) were used for image capturing,which resulted in a 14.2 2 mm×14.22 mm camera field-of-view,and the magnification factor of the lens was approximately 1.0.The time interval of two laser beams was set as 2.5 μs,resulting in a maximum particle displacement of about 9.8 pixel.
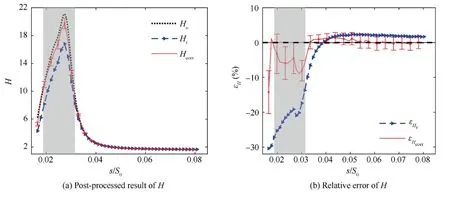
Fig.24 Post-processed result and relative error of H at i=+6°.
Dioctyl sebacate and a Laskin nozzle-based particle generator were used to generate the seeding particles.The limitation of the particle diameter was determined by the Stokes number(Eq.(9)),which satisfiesStk<0.1.In Eq.(9),ρpis the density of Dioctyl sebacate,μ is the dynamic viscosity of air,andlis the characteristic length of the main flow.In the present experiment,lis the curvature radius of the streamline,which is similar to the curvature radius of the surface near the blade leading edge.In the transformation range in Step 3,the curvature radius of the surface is approximately 0.01–0.135 m.Hence,the limitation of the particle diameter isdp<4.06μm.Finally,the particles with diameters around 1 μm were employed in the present work.

For the captured particle images,the particle diameter is approximately 1.5–3.0 pixel,the particle distribution density is approximately 0.021–0.048 particle/pixel,and 648 highquality snapshots(shown as Fig.5)were obtained in the experiment.While processing the pre-processed transformed images,three passes 32 pixel × 32 pixel and then three passes 12 pixel × 12 pixel interrogation windows are employed to achieve the WIDIM algorithm with 50% overlap.
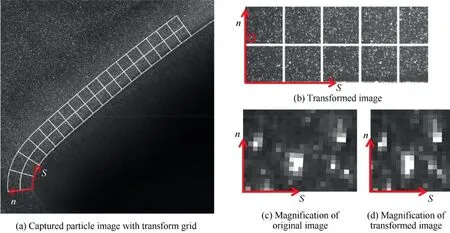
Fig.5 Transformation of particle images.
4.2.2.Experiment result
The result of the velocity field obtained by conventional PIV(Step 2 in Fig.2)is plotted in Fig.25(a),and the reverse transformed velocity field obtained by IPIV(Step 6 in Fig.2)is plotted in Fig.25(b).Four typical streamwise locations (P1–P4)are shown in Fig.25(b),and the blowup images of the region between P1 and P2 are placed alongside.These results presented the difference between the conventional PIV and IPIV.With the digital mask execution on the slant wall,the saw teeth of the velocity field border were unavoidable and would also affect the processing of the WIDIM algorithm.Consequently,the velocity profiles of the boundary layer in Fig.25(a)demonstrate discontinuity.IPIV can almost perfectly resolve the near-wall issues with the MI method used in the image preprocessing.
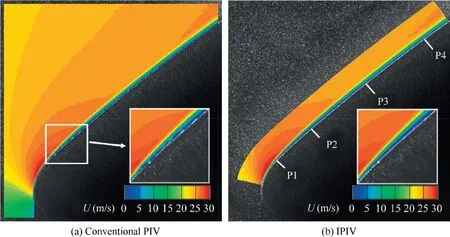
Fig.25 Results of experimental velocity field (contoured with velocity U).
The measured velocity profiles obtained by IPIV at the typical locations are plotted in Fig.26(a).These profiles revealed that the boundary layer thickness rapidly increases while the flow passes through from P1 to P2,and the boundary layer profile develops to a laminar separation profile in the same region.The increase in the boundary layer thickness is gradually slow while the flow passes through from P2 to P4,but the near-separation velocity profile becomes increasingly abundant.The friction coefficient (Cf) could indicate the tendency of boundary layer separation,as shown in Fig.26(b).In Fig.26(a),the estimated continuous velocity profile at P2(red thick line in the blowup region) should be separated.However,the calculation of the friction coefficient depended on the discrete velocity profile(black dot in the magnification);thus,the minimum value of the friction coefficient remained to be larger than zero.The shape factor of P2(H=3.88),which showed that the boundary layer did not separate,is smaller than the threshold value of the separated laminar boundary layer (H=3.9–4.0,shown in Fig.7(a)).
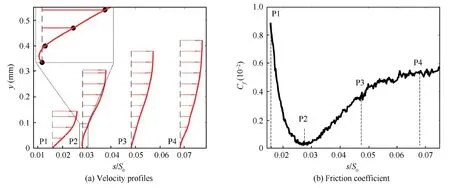
Fig.26 Properties of boundary layer flow.
After the vector reverse and the extraction of the experimental boundary layer parameters in Step 6 (in Fig.2),the velocity profiles in the field of view were investigated to show the characteristic of the laminar boundary layer.While the experiment setup had been determined,ΔLcould also be obtained from the resulted discrete field.Considering the value of Δx0is defined equal to the standard deviation of the wall boundary recognition error,the estimation of comprehensive correction factors and measurement uncertainties could be plotted in Fig.27,following Eq.(7).With the identification ofNandHof the boundary layer flow,the tracks of the data correction parameters for boundary layer flow along the streamwise direction could be plotted as the red lines in Fig.27,and the four typical locations were marked as the black dots.With the tracks shown in Fig.27,the tendencies of the correction factors and measurement uncertainties along the streamwise direction could be determined.For any position located ahead P2,the standard error deviation of boundary layer parameters was larger than 2.5%becauseNis smaller than 7,and the results of boundary layer parameters in these regions should be cautiously used.

Fig.27 Comprehensive correction factor map and measurement uncertainty map.
Fig.28 shows the measured results of boundary layer parameters.To restrain the influence of noise in the experiment result,the correction was processing on the smoothed values(given subscript‘‘smooth”).It can be seen that the distribution of δ is much similar to that shown in Fig.21(a),and both the mean bias and the measurement uncertainty for δ are much smaller than that ofH.The shape factor of P2 is 4.09 after the correction,which is higher than the separation threshold.The corrections of the boundary layer parameters were acceptable in the typical streamwise location and other areas.These results are helpful for quantitative analysis of the boundary layer development procedure and geometry optimization near the compressor blade leading edge.
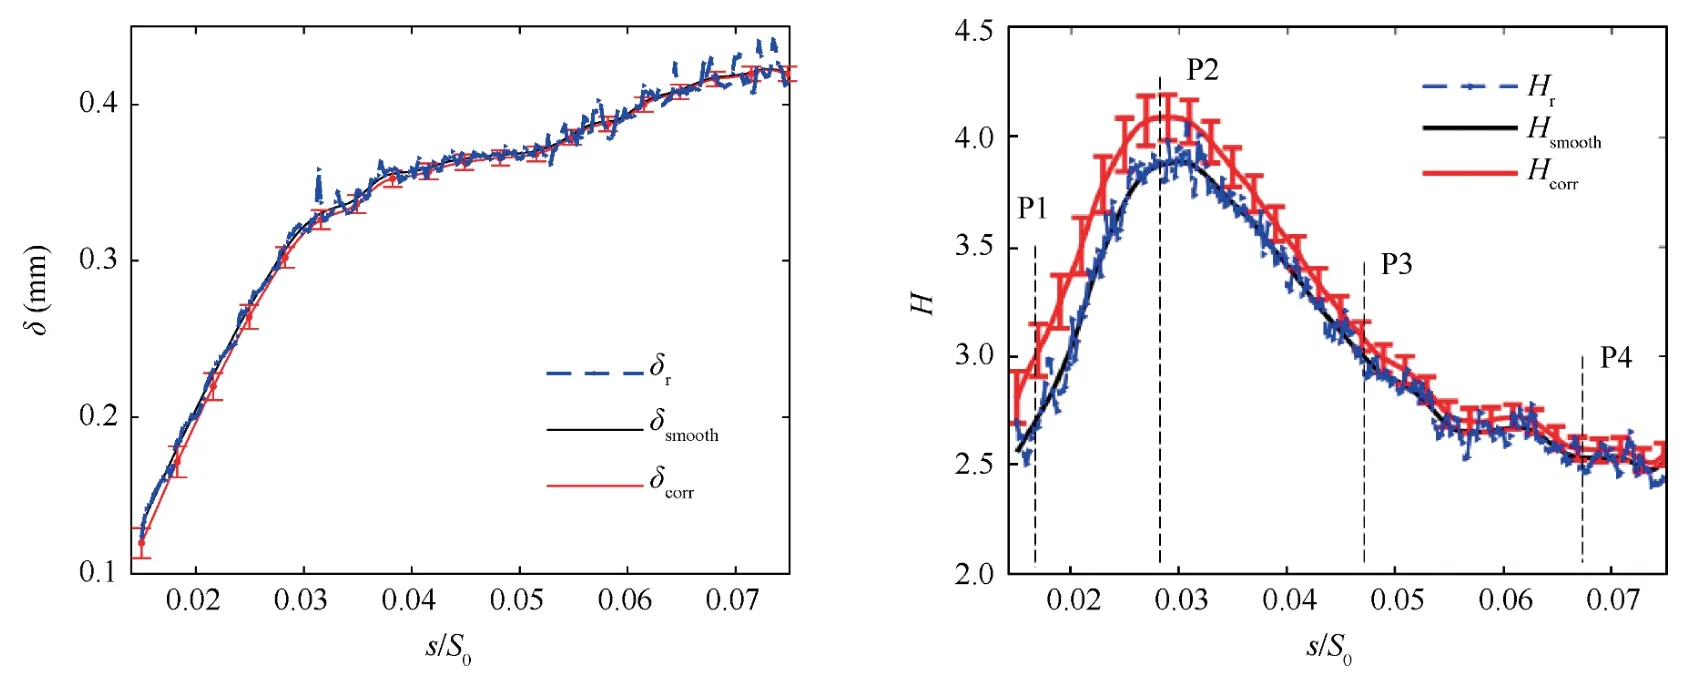
Fig.28 Experimental boundary layer results and errors bar at i=+3.5°.
5.Conclusions
To solve the low accuracy problem in the measurement of the blade leading edge boundary layer flow,which features with high flow acceleration and curvature effects,by using particle image velocity technique,an innovative data processing procedure was proposed.The procedure combined with the conventional PIV and newly developed MI based Interface-PIV methods.For the data processing method,factors for influencing the accuracy of the boundary layer parameters were analyzed in detail.The results showed that some measurement errors could be reduced by experiment setup optimization,and some other errors could be eliminated by proper data correction.Finally,the data processing and correction methods were applied for extracting boundary layer parameters in both numerical-based virtual experiments and a low-speed planar cascade experiment.Based on the above studies,the following conclusions could be obtained:
(1) With the application of the MI method,IPIV can perfectly resolve the saw teeth phenomenon of the near-wall velocity field and improve the measurement accuracy of boundary layer parameters.
(2) For the combined PIV processing procedure,a strict error evaluation method is proposed.The measurement errors in the data processing procedure could be divided into five types,among which the most important types are the errors caused by the WIDIM algorithm,the discrete data interpolation and integration processes,and the wall offset uncertainty.
(3) Accuracy correction factors and measurement uncertainties are quantitatively analyzed by using CFD based synthetic images.Errors due to the discrete data interpolation and integration and the WIDIM algorithm comprise the mean bias,which can be corrected through the proposed error analysis method in this paper.Meanwhile,the errors due to the WIDIM algorithm and the wall offset uncertainty comprise the measurement uncertainty.Comprehensive analyses of the measurement uncertainties reveal that the grid density should be larger than 7 for the laminar and turbulent boundary layer flows in the high-quality experimental measurement.This critical value could guide the balance between the measurement accuracy and the measurement cost.
(4) The error analysis method is verified in boundary layer flows with varied shape factors by using synthetic particle images based on simulated flow field with CFD method.Moreover,the particle image processing procedure is also applied for measuring the boundary layer parameters around the blade leading edge of a compressor CDA airfoil.The result reveals a significant improvement of the boundary layer parameters around the blade leading edge,particularly for the flow around the blade leading edge flow separation bubble,by using the newly proposed data processing method.
Declaration of Competing Interest
The authors declare that they have no known competing financial interests or personal relationships that could have appeared to influence the work reported in this paper.
Acknowledgements
This research was funded by the National Natural Science Foundation of China (Nos.51790511 and 51806004) and the National Science and Technology Major Project,China (No.2017-II-0001-0013).
 CHINESE JOURNAL OF AERONAUTICS2022年12期
- CHINESE JOURNAL OF AERONAUTICS的其它文章
- Effect of variable-angle trajectory structure on mechanical performance of CF/PEEK laminates made by robotic fiber placement
- An efficient hyper-elastic model for the preforming simulation of Carbon-Kevlar hybrid woven reinforcement
- Tribological performance of hydrogenated diamond-like carbon coating deposited on superelastic 60NiTi alloy for aviation selflubricating spherical plain bearings
- Multi-parameter load sensing pump model simulation and flow rate characteristics research
- A modified forward and backward reaching inverse kinematics based incremental control for space manipulators
- A novel strategy for fine-grained semantic verification of civil aviation radiotelephony read-backs
