An efficient hyper-elastic model for the preforming simulation of Carbon-Kevlar hybrid woven reinforcement
Ss GAO ,Zhengto QU ,Yunjie ZHANG ,Zizho ZHAO ,Bio LIANG,*
a College of Mechanical &Electrical Engineering,Shaanxi University of Science &Technology,Xi’an 710021,China
b State Key Laboratory of Applied Optics,Changchun Institute of Optics,Fine Mechanics and Physics,Chinese Academy of Sciences,Changchun 130033,China
c School of Mechanical Engineering,Northwestern Polytechnical University,Xi’an 710072,China
KEYWORDS Constitutive law;Finite element analysis;Hybrid woven reinforcement;Hyper-elastic;Preforming
Abstract An efficient hyper-elastic model that can reflect the primary mechanical behaviors of Carbon-Kevlar hybrid woven reinforcement was developed and implemented with VUMAT constitutive code for preforming simulation.The model parameters were accurately determined through the uniaxial and bias-extension tests.To calibrate the simulation code,preforming experiments of hybrid woven reinforcement over the hemisphere mold and tetrahedron mold were respectively conducted to validate the proposed hyper-elastic model.The comparison between the simulations and experiments shows that the model can not only accurately capture shear angle distribution and geometry shape after deformation,but also accurately predict the force–displacement curve and potential fiber tensile failure during the preforming process.This result indicates that the proposed model can be used to predict the preforming behavior of Carbon-Kevlar hybrid woven reinforcement,and simulate its manufacturing process of complicated geometry.
1.Introduction
Polymeric composites nowadays have been widely used to replace the traditional metal materials in the aerospace,automotive and other industry sectors due to their excellent mechanical properties and relative low weight.1Mechanical properties of polymeric composites depend on their reinforcement.It has been found that the weaving type and fiber properties of reinforcement have significant impact on the performance of polymeric composites.2–6For instance,the plain weave reinforcement offers mechanical resistance in both the warp and weft yarn directions;therefore,plain weave composites have better anti-delamination and impact strength than the nonwoven composites due to their yarn’s interlacing.7,8
Besides the weaving type,hybridizing two or more fiber materials within one single reinforcement is another popular method to enhance the mechanical properties of reinforcement.9It is generally known that the carbon fibers have very high tensile stiffness,but owing to its brittle nature,it is prone to the impact damage.10In order to improve the impact resistance,carbon fibers are usually hybridized with Kevlar fibers to form the Carbon-Kevlar hybrid reinforcement,which has both good strength and well anti-impact properties.11,12Consequently,Carbon-Kevlar hybrid reinforcement is increasingly used in the cases where there are both strength and anti-impact requirements,such as the car bumper,the motorcycle helmet and optical lens barrel.
To manufacture the fabric reinforced polymeric composite part,Resin Transfer Molding (RTM) is one of the most popular processing methods due to its high product quality and relative low cost.Preforming is the first step of RTM to obtain the preform of final composite part before the resin injection,and is influenced by many processing factors and defects which would be easily occurred in this process,such as fiber breakage and wrinkles,which result in a decrease in mechanical properties of the final composite part.13,14To predict the possible defects in the preforming and to optimize the processing parameters,numerical simulation models have been developed to investigate the feasibility of woven reinforcement preforming.
There exist kinematic,discrete and continuous models for the forming analysis of woven reinforcements.15The kinematic,also called fishnet models,is very fast in computing but unable to consider the material’s mechanical behaviors,confining their applications.16,17The discrete approaches represent high fidelity models but are computationally expensive and therefore,not a satisfactory choice for designers to carry out global preforming simulations.18–21The continuous models consider the reinforcement as equivalent homogenized continuous materials and can be easily combined with commercial finite element codes.22–28Moreover,the models have relatively high computational efficiency;and therefore,they are currently the most popular method for the preforming analysis.Several excellent continuous models were proposed by global scholars.Khan et al.27have extended the hypo-elastic constitutive law for forming simulation of woven reinforcement.Peng and Cao22developed a non-orthogonal constitutive model that can accurately track the reorientation of the weft and warp yarns.The rationality of this model was validated through the bias-extension and in-plane shear tests.Then Peng and Rehman29applied this model to simulate the anisotropic mechanical behavior of textile composites under large deformation during double-dome stamping.Based on Peng and Cao’s work,22Zhang et al.24developed a fully tension-shear decoupled non-orthogonal model for the preforming of woven thermoset prepregs.Experimental comparisons show that this model works very well.
The mechanical behavior of woven reinforcements during preforming can also be described by the hyper-elastic constitutive models.Peng et al.25have developed a hyper-elastic constitutive model to characterize the anisotropic and large deformation behavior of 2D textile fabrics.In their model,the strain energy function was decomposed into two parts representing fiber stretches and angle change between the weft and warp yarns(in-plane shear).The two deformation modes were assumed to be independent to each other and there has no coupling.To include the coupling effect,Yao et al.30proposed a hyper-elastic constitutive model considering the tension inplane shear coupling effect.It is found that this coupling has very limited impact on the prediction of the maximum shear angle and the orientation of fibers.For 3D textile reinforcements,Charmetant et al.31developed hyper-elastic model,six deformation modes were considered,and the comparison shows it has very good prediction accuracy.
From the above literature review,it can be found that these works are all for preforming of reinforcement with single fiber type,few works are available for researching the preforming behavior of hybrid reinforcement,particularly for the Carbon-Kevlar hybrid reinforcement.There are some works relating to the mechanical behavior characterization of hybrid composites;however,they are primary focused on the hybrid composites instead of hybrid reinforcements,and their interests are evaluating how the reinforcement hybridization impacts the mechanical performance.For instance,Valenc¸a et al.32evaluated the impact behavior of epoxy composites reinforced with glass-Kevlar hybrid reinforcement.Hashim et al.33have investigated the effect of fiber loading directions on the low cycle fatigue of intra-ply Carbon-Kevlar hybrid reinforced composites.Srivatsava and Sreekanth34conducted experiments to characterize the dynamic mechanical properties of hybrid Carbon-Kevlar reinforced composites.As mentioned previously,preforming is the first step of manufacturing the hybrid fabric reinforced composites and has non-negligible impact on their final mechanical performance.Therefore,researching the preforming of hybrid woven reinforcement is very necessary for the reliable and high quality applications.
However,currently there are few works researching the preforming modeling of hybrid reinforcement.This paper aims to explore whether the preforming process of Carbon-Kevlar hybrid woven reinforcement can be accurately modelled.Due to the brittleness of carbon fiber,its tensile fracture strain(about 1.0%) is much smaller than then Kevlar fiber (about 3.5%),leading to the carbon fiber more likely damaged in the preforming of Carbon-Kevlar hybrid woven reinforcement.Therefore,there is a strong need for the fiber tensile failure prediction in the preforming of hybrid reinforcement,while this point is usually neglected in most current preforming models of normal fabric(single fiber type)as they assume there is no fiber tensile failure in the preforming (despite this assumption is true in most cases).
In this paper,an anisotropic hyper-elastic constitutive model is developed firstly for the preforming modeling of Carbon-Kevlar hybrid woven reinforcement and fiber tensile failure after preforming can be predicted with this model.Then the deformation energy of Carbon-Kevlar hybrid woven reinforcement is divided into three parts:two fiber tension energies and one in-plane shearing energy.Uniaxial tension and biasextension tests are designed and conducted to identify the materials parameters in the model.The maximum strainbased failure criteria are used to evaluate fiber damage onset.The uniaxial tension and bias-extension deformations are simulated to validate the model.Finally,hemispherical and tetrahedron preforming experiments are carried out and compared with the preforming simulations to demonstrate the effectiveness of the proposed model.
2.Framework of preforming model for Carbon-Kevlar hybrid woven reinforcement
2.1.Anisotropic hyper-elastic constitutive model with large deformation
The weaving pattern of the Carbon-Kevlar hybrid woven reinforcement is shown in Fig.1.As shown from Fig.1,the pattern is composed of two yarn networks in two directions(warp and weft),and in each direction there are both carbon fiber yarns and Kevlar fiber yarns.Therefore,this hybrid reinforcement has both very good mechanical strength and antiimpact resistance.The two yarns are interlaced together at the cross-over points,therefore they can easily rotate to each other.In the preforming process,yarn’s longitudinal tensile deformation and in-plane shearing deformation between the two yarn directions are the two primary deformation modes.Due to the in-plane shearing,the two yarn directions would deform from the orthogonal to the non-orthogonal.Tracing yarn directions accurately in the preforming process is a prerequisite for computing the right stress state (Fig.2).
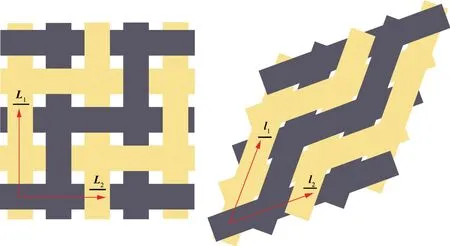
Fig.2 Yarn rotations caused by in-plane shearing in preforming.
Accounting for the specific internal weaving structure and deformation behavior,the strain energy of Carbon-Kevlar hybrid woven reinforcement in the preforming is supposed to be only dependent on the yarn tensile deformation and inplane shear deformation between two direction yarns.Two complementary assumptions are also made: (A) Tensions along the warp and weft yarn directions are uncoupled(biaxial tension decoupling) and (B) Yarn tension and in-plane shear are independent.Biaxial tension coupling and tension-shear coupling indeed affect the prediction accuracy of simulations,particularly on the draw-in distance and shear angle distributions.30,35According to Ref.35,the model with tensionshear coupling has only 4% and 5% improvement for the draw-in and average yarn angle at certain critical locations over the decoupled model.Therefore,the two decoupling assumptions made are accepted.Consequently,the strain energy of Carbon-Kevlar hybrid woven reinforcement can be decomposed into three parts and expressed as the scalar function of the principal invariants of the right Cauchy–Green strain tensor:

with
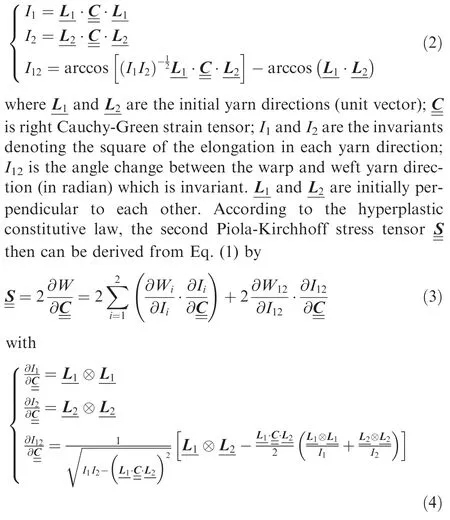
where the symbol ⊗denotes the tensor product.Substituting Eq.(4) into Eq.(1):
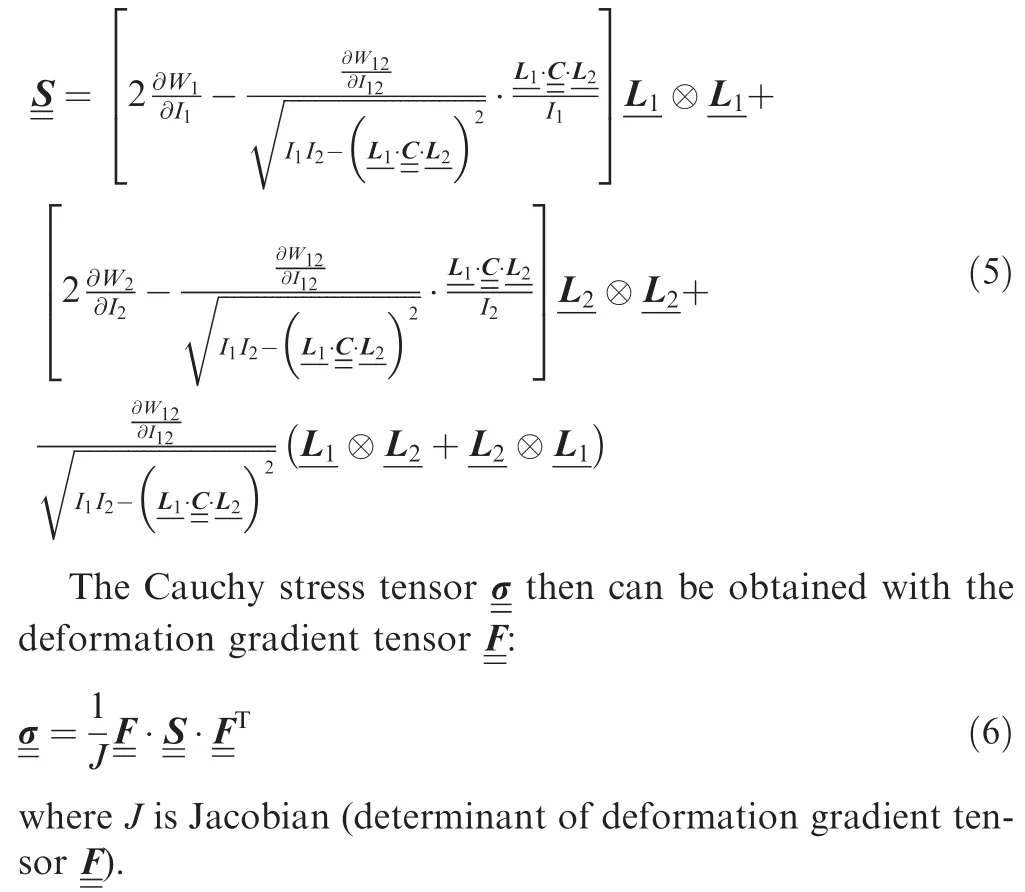
To get the explicit expression of Cauchy stress tensor in Eq.(6),the function form of strain energy should be known.Following the previous works,25polynomial functions of the invariants are considered for the strain energy of hybrid woven reinforcement and it is expressed as

whereki–1andti–1are the material parameters relating to the tensile energy in the two yarn directions,i=2,3,4;si–1is material parameters relating to the in-plane shear energy,i=2,3,4.The unit of the above material parameters is MPa.These material parameters can be identified with the specific mechanical tests and the detailed identification procedure will be given in Section 3.
2.2.Implementation of constitutive model
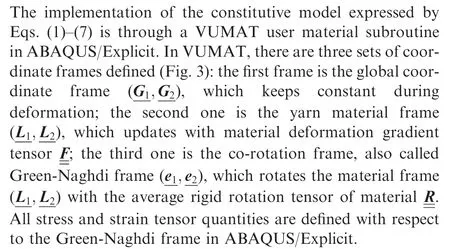
The algorithm to implement the hyper-elastic constitutive model at each Gauss point is as follows:28
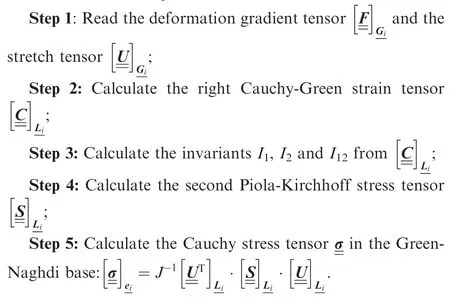
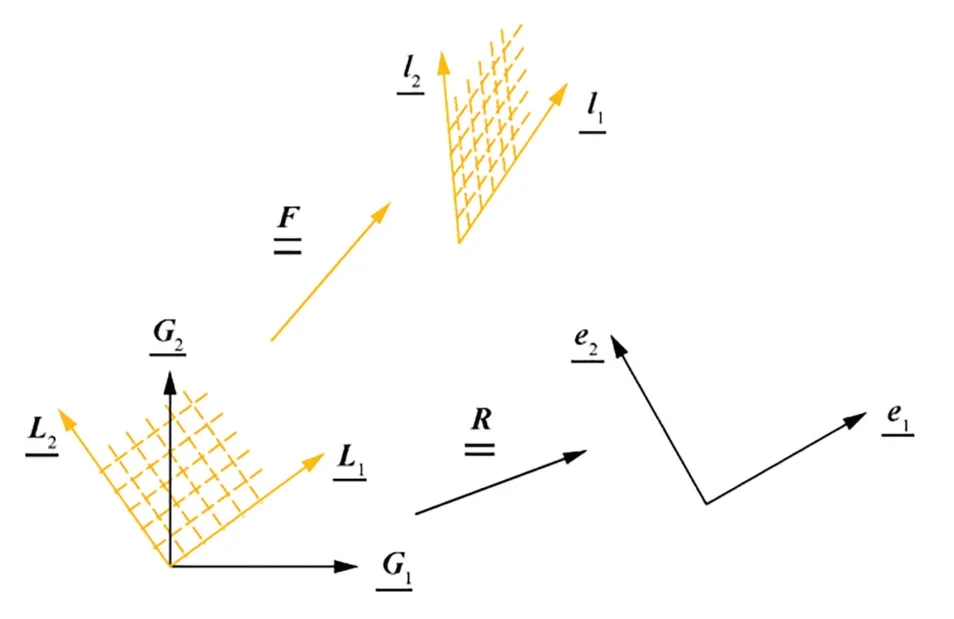
Fig.3 Three sets of coordinate frames defined in implementation of hyper-elastic model with large deformation.

3.Material parameters identification
3.1.Materials and experimental set-up
The primary material parameters of tested Carbon-Kevlar hybrid woven reinforcement are given in Table 1.All the tests were performed on a universal testing machine with closedloop displacement control,as shown in Fig.4.The device starts after installing the sample with preset loading rate.The triggered force of the sensor was set as 0.01 N,that is,when the force reaches 0.01 N,the system begins to record the experimental force and displacement.The deformation and shear angle evolution of the specimens were recorded by the high resolution camera.
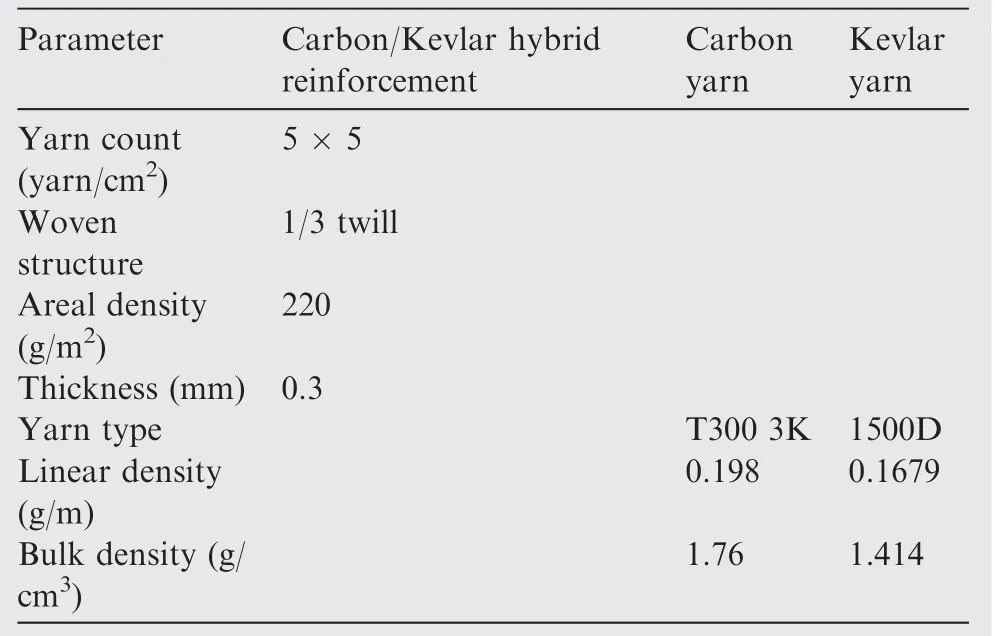
Table 1 Material parameters of hybrid woven reinforcement.
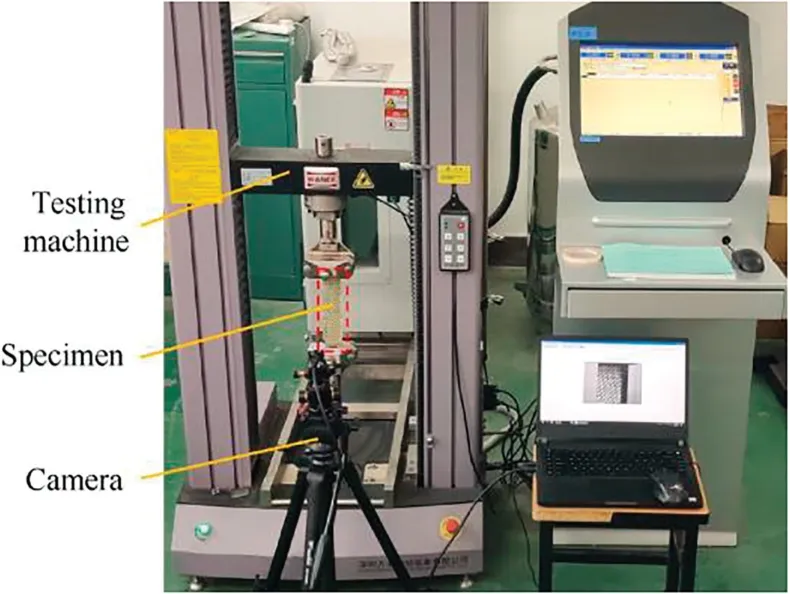
Fig.4 Experimental set-up used in uniaxial and bias-extension test.
3.2.Uniaxial tensile test
Uniaxial tensile test was firstly conducted to determine yarn tensile deformation related parameters in the hyper-elastic constitutive model.The configuration of tested specimen was shown in Fig.5.The effective area of the specimens was 200 mm × 40 mm,which contains 10 carbon yarns and 10 Kevlar yarns along the width direction (the dashed red line is the gauge region).The average tensile deformation in the gauge region was selected to characterize the tensile deformation.Different loading rates(2,10,50,100,200,400 mm/min)were selected to research the loading rate sensitivity of the hybrid woven reinforcement.Three tests were carried out for each loading rate to guarantee the repeatability of tested results.
Based on the force–displacement curves from the universal testing machine,the stress–strain curves can be obtained by dividing the force to the initial cross-sectional area of specimen and the strain measured from the camera.The camera here is used to take images of tensile deformed specimen with two gauge lines drawn on the two ends of gauge region during loading (see Fig.5).The average tensile strain is then calculated through image processing to acquire the distance change between the two gauge lines.Compared to the strain derived directly from the clamp-end displacement of testing machine,the camera can rule out the influence of clamp slippage occurred in the test.Fig.6(a) shows the tensile stress–strain curves at different loading rates until the complete fiber failure(as Fig.6(b) shows).A two-peak phenomenon can be noted,which is primarily due to the carbon fiber and Kevlar fiber have different fracture strain (about 1.0% for carbon fiber and 3.5%for Kevlar fiber).The tensile test curves can be simply split into 4 stages: in Stage 1,there is no damage for both type of fibers and they sustain the tensile load together;in Stage 2,carbon fibers are firstly damaged,a quick load drop then can be noted due to the complete failures of carbon fibers;in Stage 3,only the Kevlar fibers can continue to sustain the load and therefore there is a significant stiffness reduction compared to Stage 1;in Stage 4,Kevlar fibers are damaged and there is no longer any load carrying capability for specimen.In addition,the tensile curves show an insensitivity to loading rate.Therefore,it can be assumed that the tensile behavior of the hybrid woven reinforcement is independent of the loading rate in the preforming since these loading rates completely cover the potential deformation rate in preforming process.The stress–strain curve at the loading rate of 10 mm/min was selected for determining the tensile parameters.
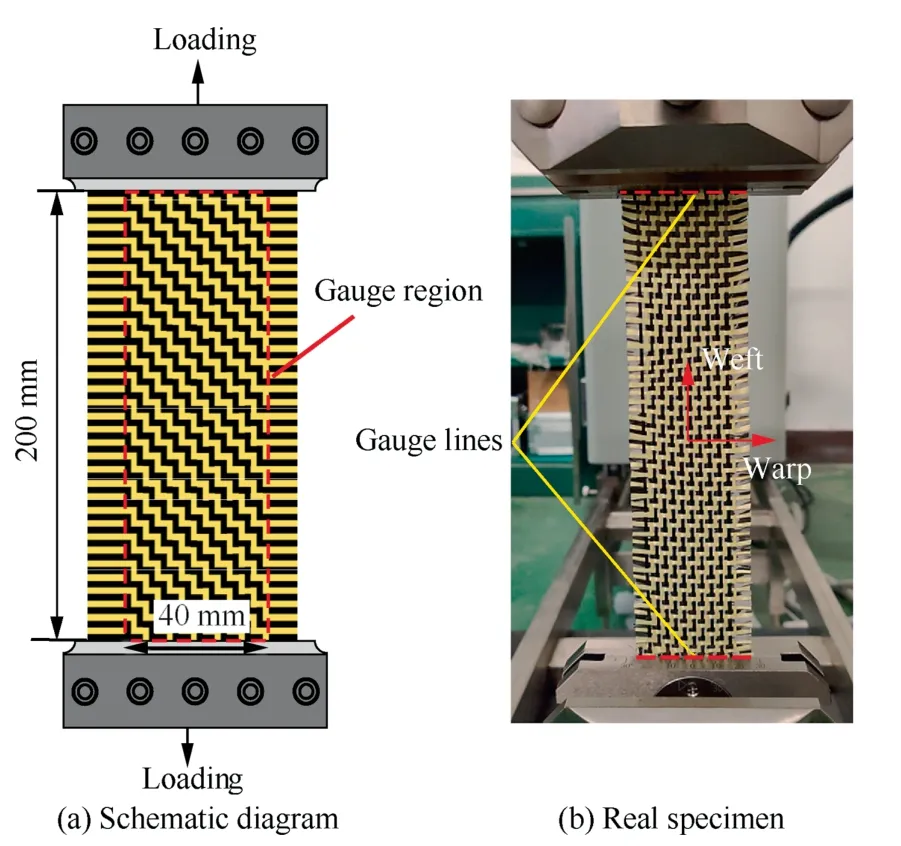
Fig.5 Specimen used in uniaxial tensile test of Carbon-Kevlar hybrid woven reinforcement.
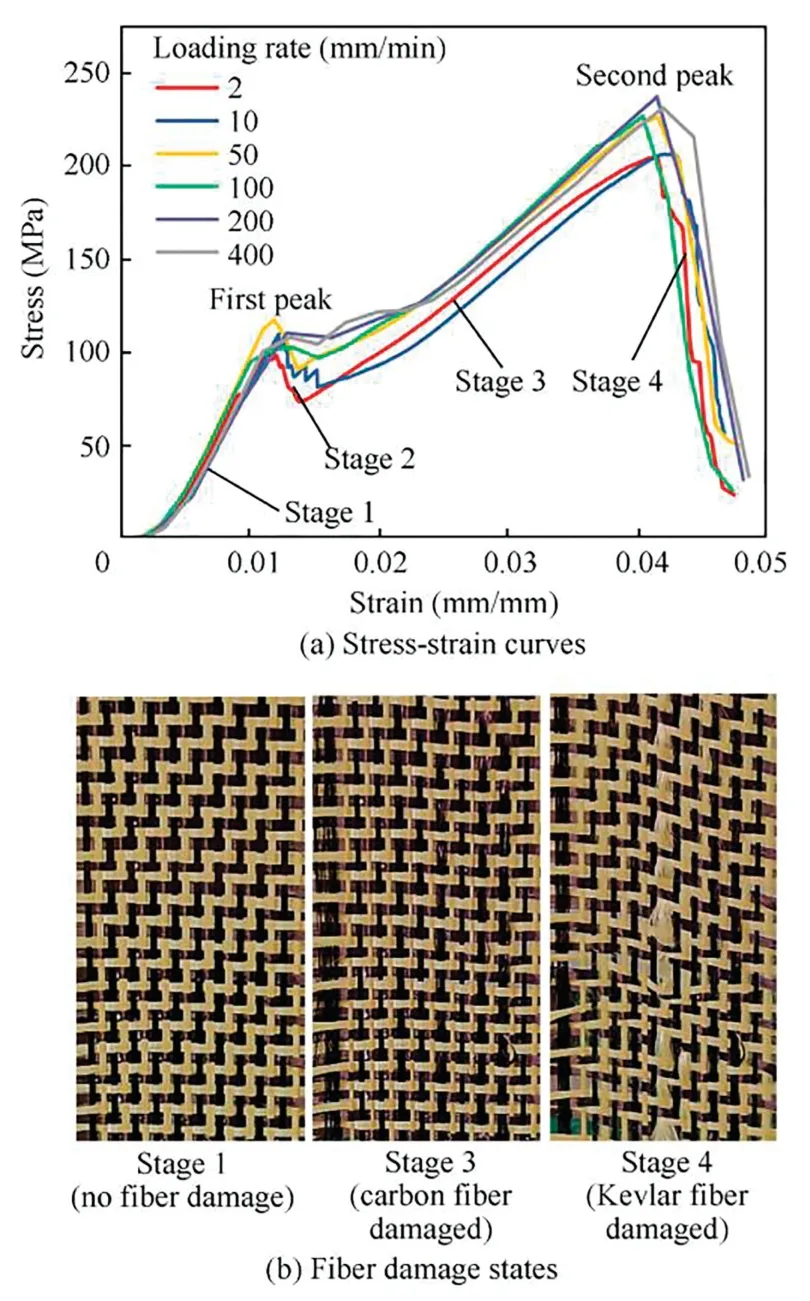
Fig.6 Uniaxial tensile test results until failure for hybrid woven reinforcement at different loading rates.
Here it should be noted that in the actual preforming process,the value of fiber strain after preforming is generally very small and is within Stage 1 in most cases,but there still has the possibility that fiber tensile deformation goes into Stage 3,in which carbon fiber is damaged.Therefore,stress–strain curve from Stage 1 to Stage 4 would all be used as input to predict the possible carbon fiber failure in the preforming modeling.The nonlinear stress–strain curve of Stage 1 is seen as hyperelastic and used to derive the tensile strain energy density function.Stiffness reduction is used to describe stress–strain curve in Stage 2 and Stage 4,and linear elastic is used to describe the stress–strain relation in Stage 3.The strain energy densityWper unit undeformed volume can be obtained by integrating stress (S) with strain (ε):

Taking the warp yarn direction as an example,the relationship between the tensile strain ε1and the invariantI1in Eq.(2)is as

where λ1is the fiber tensile ratio.The stress–strain curve of Stage 1 in Fig.6 then can be transformed into the strain energy density functionW1versusI1–1 curve,as shown in Fig.7.Since the hybrid reinforcement is a balanced one,the tensile properties are equivalent in the warp and weft yarn directions.By fitting the curve of Stage 1 with loading rate 10 mm/min in Fig.6,the tensile deformation related material parameters in Eq.(7) then can be identified:k1=t1=78.63 MPa,k2-=t2=16000 MPa,k3=t3=759900 MPa.
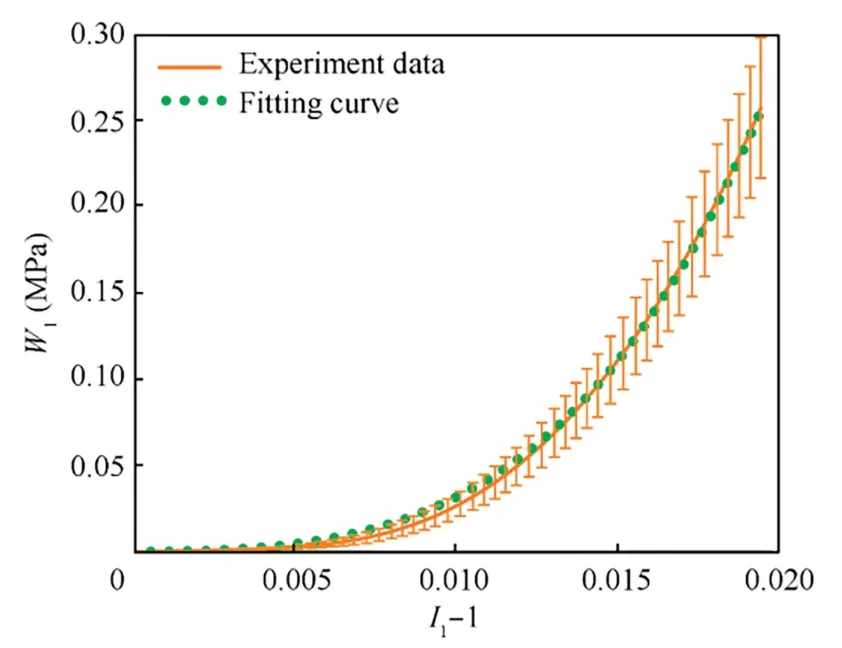
Fig.7 Tensile strain energy density W1 versus I1–1.
The maximum strain-based failure criteria is adopted to evaluate fiber tensile damage.As shown in Fig.6,carbon fiber tensile damage onset strain is 0.012 and the completely failure strain is 0.015.The elastic modulus of Stage 3 is 4400 MPa,and Kevlar fiber tensile damage onset strain is 0.041.All these identified material parameters will be used in the following tensile deformation modeling.
3.3.Bias-extension test
The shearing related parameters in the hyper-elastic constitutive model are identified by the bias-extension test.While the picture frame test can also be used to shear the hybrid reinforcement,its device is a little complicated compared to the bias-extension,and there is a high skill requirement in clamping the specimen to the picture frame to ensure the fiber alignment.8,36In contrast,the bias-extension test is relatively simple,which does not require any special device and the test can be carried out on any tensile machine.Therefore,biasextension is selected.The dimension of tested specimens is shown in Fig.8(a) and its size is 160 mm × 80 mm.Red marker lines have been drawn on the specimens,which would be used for tracking shear angle evolution.To rule out the influence of yarn slippage on the shear angle that is directly determined from the displacement,high resolution camera was used to take the images.Shear angle can then be accurately measured with ImageJ software to process images taken by the camera.
Fig.8(b)presents the curves of the clamp force versus shear angle at different loading rates.Two obvious deformation phenomena could be noted:(A)At the initial stage the force resistance primarily comes from the friction between yarns,and yarn free rotation can be seen at this stage;(B)As the rotation continues,the gap between adjacent yarns decreases,yarns come to contact and compress each other,the load increases significantly with the increase of shear angle.As Fig.8(b)indicates,the shear behavior is also insensitive to the loading rate.The curve with loading rate of 10 mm/min is selected for the shearing related material parameters.
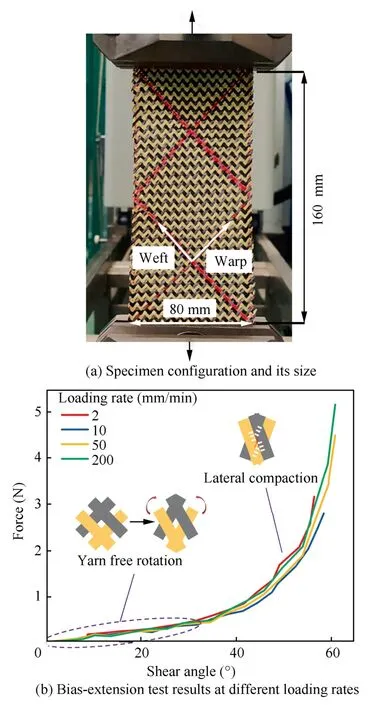
Fig.8 Bias-extension test of Carbon-Kevlar hybrid woven reinforcement.
According to the method proposed by Cao et al.,8the normalized shear forceFsh(γ) can be calculated following

whereLanddare the initial length and width of specimen;Fis the clamping force recorded by the testing machine;γ is the shear angle in ZoneC;Fsh(γ)is the corresponding normalized shear force (Fig.9).
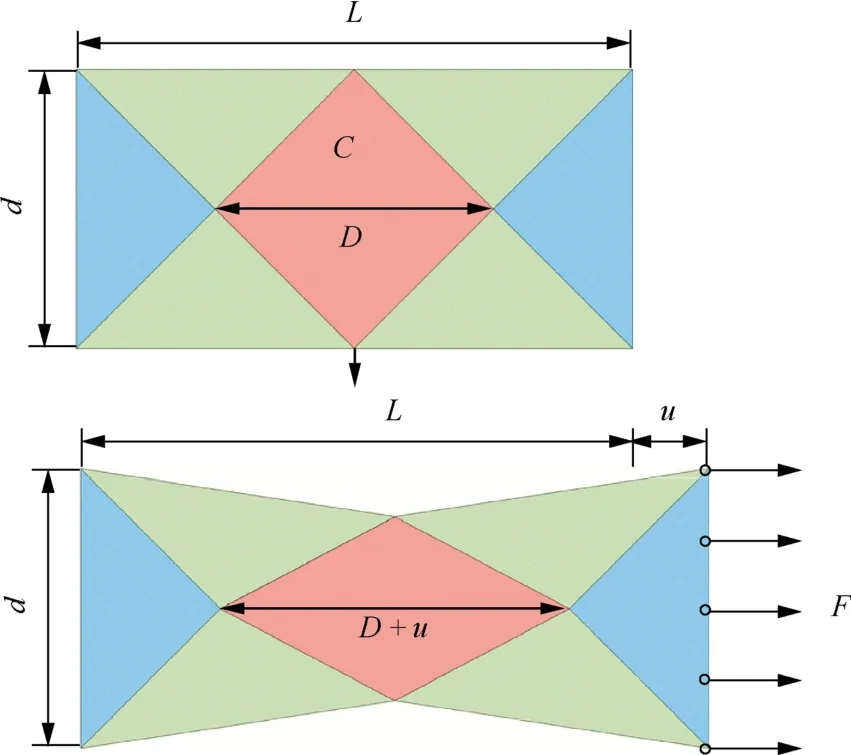
Fig.9 Illustration of hybrid woven reinforcement under biasextension test.
The unit torqueCson the initial unit area of specimen can be related to shear forceFsh(γ) as

Then the shear strain energy density per unit undeformed volume can be expressed as

wheretis the initial thickness of specimen.With Eqs.(10)–(12),the experimental force versus shear angle curve can be converted to shear strain energyW(γ) versus shear angle γ curve.As Section 2.1 mentioned,invariantI12in Eq.(2)denotes the shear angle.Therefore,the shear strain energy functionW12versusI12curve can be got and is presented in Fig.10.The shearing related parameters in Eq.(7)can be identified ass1=0.01028 MPa,s2=–0.01465 MPa,s3=0.01387 MPa.
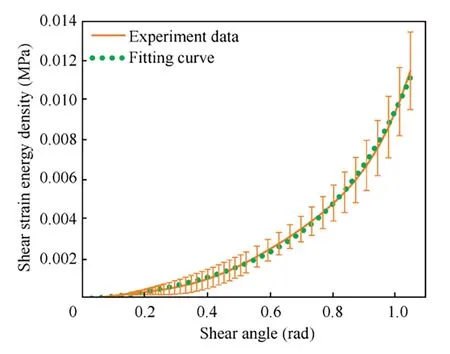
Fig.10 Shear strain energy density W12 versus I12.
4.Model validations
To validate the proposed hyper-elastic constitutive model,uniaxial tensile and bias-extension deformations were simulated with the conventional shell elements S4R in ABAQUS.Fig.11 presents the stress–strain curves and carbon fiber tensile failure for uniaxial tension test.The simulation results preliminarily verify the accuracy of the model,despite there has some slight deviations.These deviations are primarily attributed to the error of material parameters identification in the curve fitting and the neglected poison’s effect.In addition,choosing a more accurate form of strain energy function can also reduce the generation of such deviation to a certain extent.31
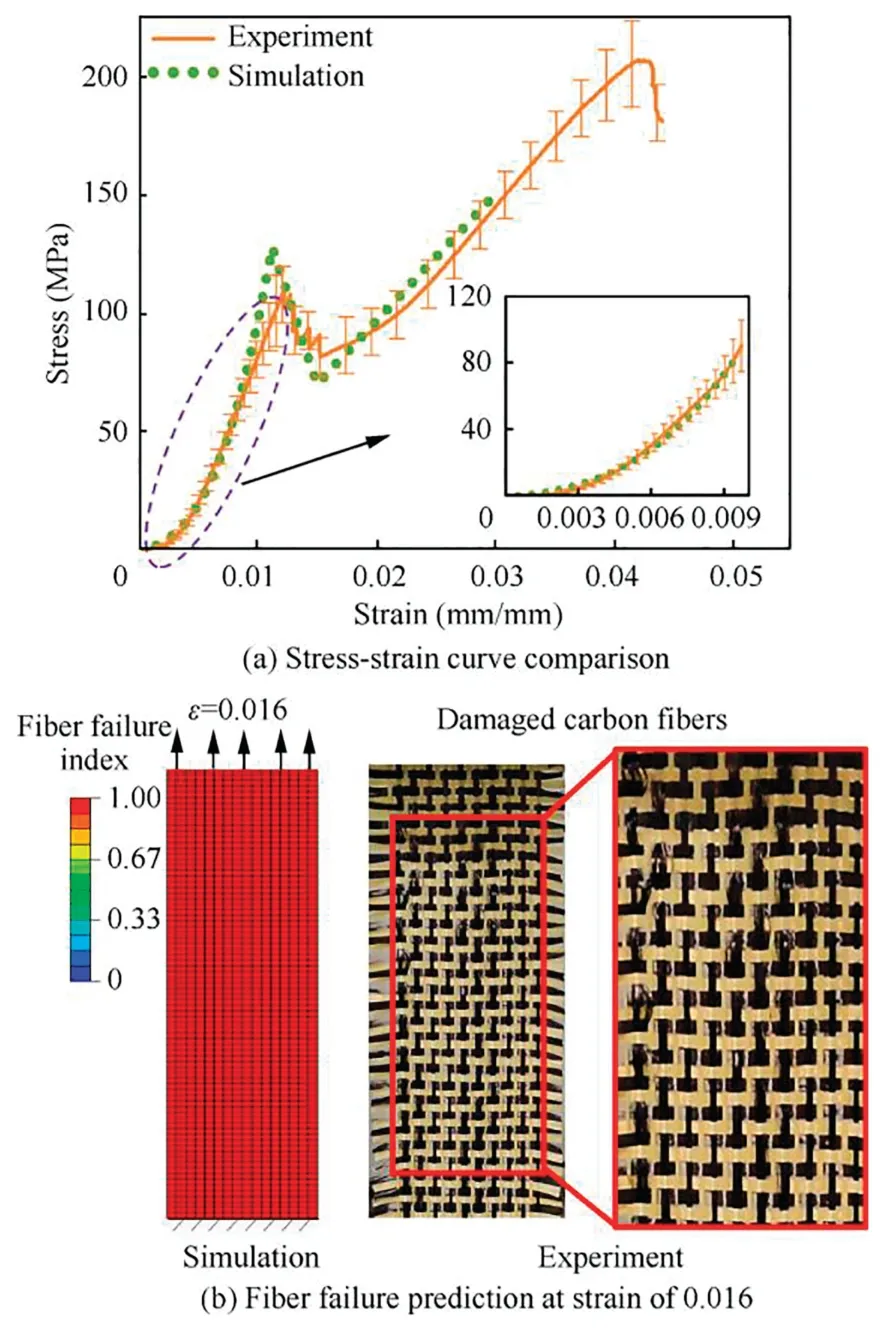
Fig.11 Simulation verification of uniaxial tensile deformation.
Comparison of force-shear angle curve and deformation mode in bias-extension test is shown in Fig.12.The loadshear angle curve obtained from the simulation is fairly close to that obtained from the experimental measurements(Fig.12(a)),and the macroscale shear deformation mode of simulation is also consistent with experiment observation(Fig.12(b)).In addition,it can be observed in Fig.12(b) that the shear angle measured is smaller than that simulated.This is due to the free boundary conditions that cause the yarns to slip.On the whole,the simulation results have an acceptable accuracy.Besides,the aligned mesh configuration is used in the mesh discretization to avoid the tension locking problem in the bias-extension simulation.37
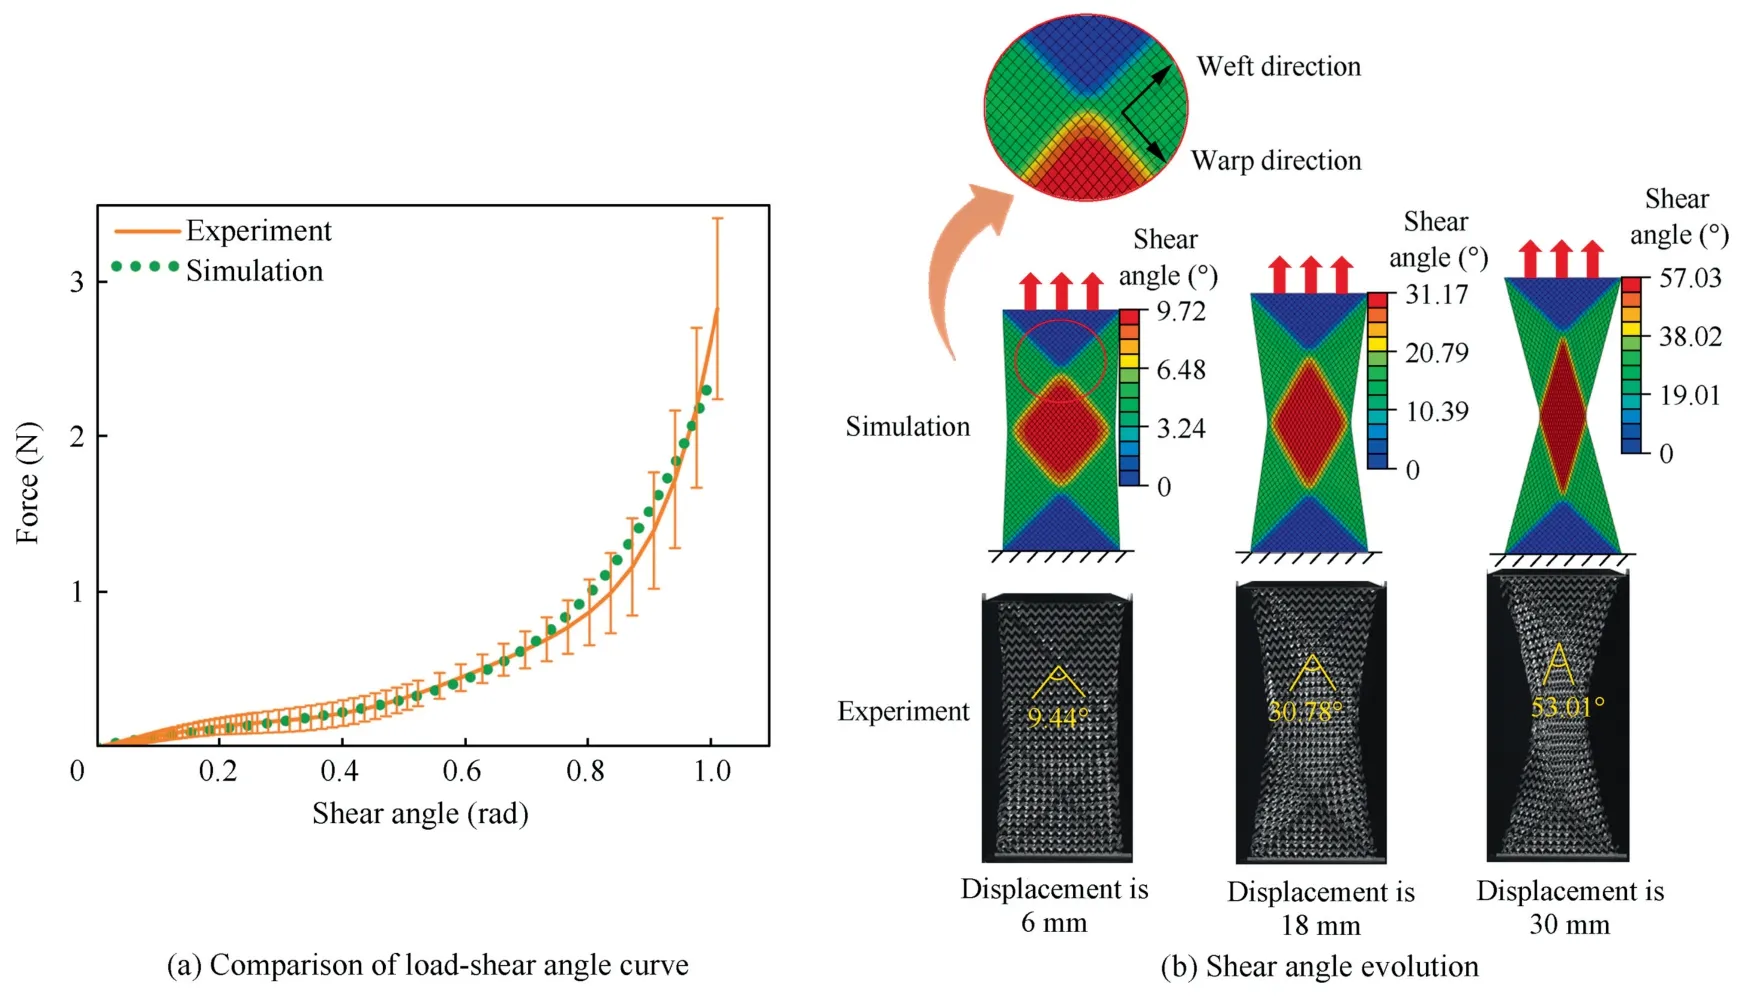
Fig.12 Simulation verification of bias-extension deformation.
5.Preforming experiments and simulation
To further validate the proposed model,hemispherical and tetrahedral preforming were designed and conducted,since these two geometry shapes have the typical features of most actual engineering structures and are widely used as benchmark shape for preforming model validation.These two preforming experiments would be simulated and comprehensively compared with simulation results.
5.1.Hemispherical preforming
The experimental setup of hemispherical preforming is shown in Fig.13(a).The hemispherical punch with diameter of 150 mm was moved down at constant speed of 10 mm/min and the punch depth was 75 mm.The gap between the punch and die was 3 mm.4 springs whose compression length can be regulable were used to impose the blank holder force.The blank holder pressure on the material specimen was 0.08 kPa in the experiment.The material specimen was 280 mm × 280 mm × 0.3 mm square shape with 4 corners removed to prevent from being affected by the 4 springs(Fig.13(b)).To facilitate checking shear deformation and comparing with simulations,red dashed lines were drawn along the two yarn directions of the specimen and the blank holder was made of transparent acrylic plate.Prior to the blank holder was removed,ambient curable resin was used to maintain the deformed state of the deformed specimen and to enable accurately measure the local shear angle and profile after preforming.
In the preforming simulations,all the parts of experimental setup were modeled.Fig.13(c) shows the Finite Element (FE)model of the hemispherical preforming setup.Accounting for the structure symmetry,only one quarter of the set-up was built to save the calculation time.The specimen was discretized by S4R shell elements and has initial fiber direction 0° with respect to the global frameXYZ.Other parts were discretized by rigid elements R3D4.The friction between the specimen and other parts was simplified as Coulomb friction and the friction coefficient was selected as 0.2 according to Ref.38.The preforming simulation was carried out in ABAQUS/Explicit with the constitutive model mentioned in Section 2.
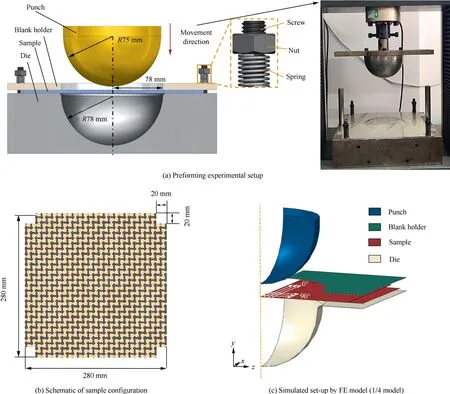
Fig.13 Experimental set-up and FE model for hemispherical preforming.
After the preforming experiment and simulation,the deformed shape was firstly compared.Fig.14(a) presents the global deformed shape comparison,a good global shape consistency can be noted.To quantitatively compare the deformed shape,deformed boundary profile(perimeter of specimen)was compared as shown in Fig.14(b).Some deviations between the experiment and simulation can be noted.This is due to the boundary conditions difference.In the preforming experiment,the blank holder pressure imposed on the specimen is by the 4 springs as shown in Fig.13,which cannot fully guarantee that there is uniform blank holder pressure on the specimen.However,uniform blank holder pressure is applied on the specimen in the simulation.On the whole,the simulation profile is very close to the experiment.Shear angle distribution within deformed shape was also compared since this value was closely related to the wrinkle occurrence.Shear angle was measured in the direction of 45° of hemisphere that has large shear deformation as shown in Fig.15(a).The simulation follows the distribution pattern of the experiment and shows a continuously increased shear angle from the top to the skirts of hemisphere.Five small regions were selected and their shear angle would be used to characterize the shear angle of corresponding point located at this position.Fig.15(b) presents the shear angle comparison for these five points.A good agreement can be noted,demonstrating the effectiveness of proposed model.The predicted fiber tensile damage state after preforming is shown in Fig.16.There is no tensile failure for both carbon and Kevlar fibers,which agrees well with the experimental observations in Fig.14.
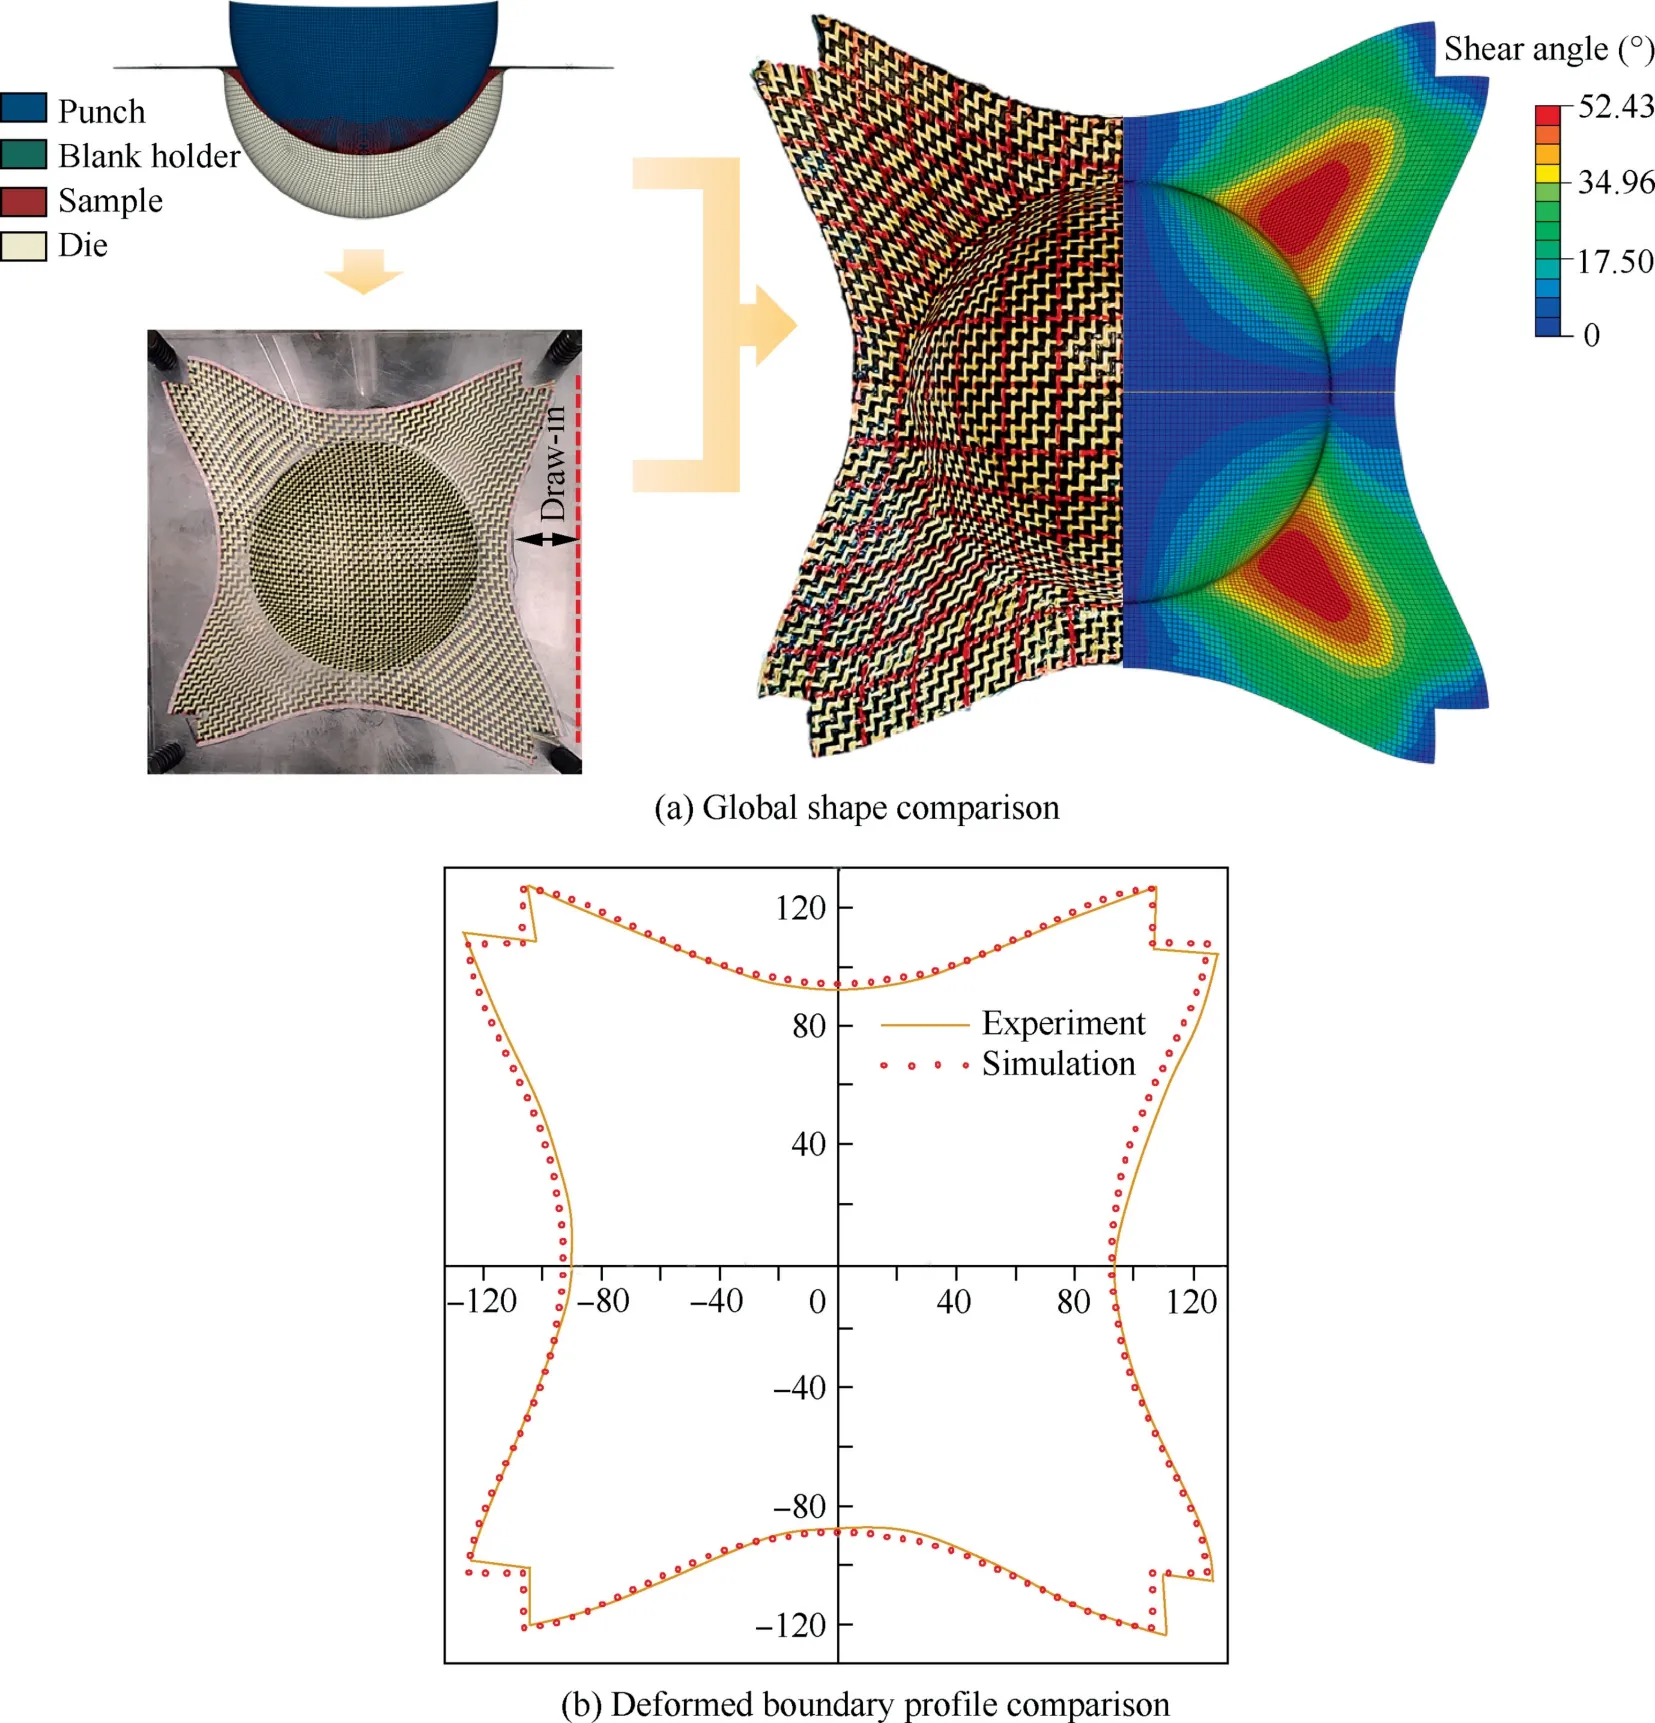
Fig.14 Deformed shape comparison between experiment and simulation for hemispherical preforming.
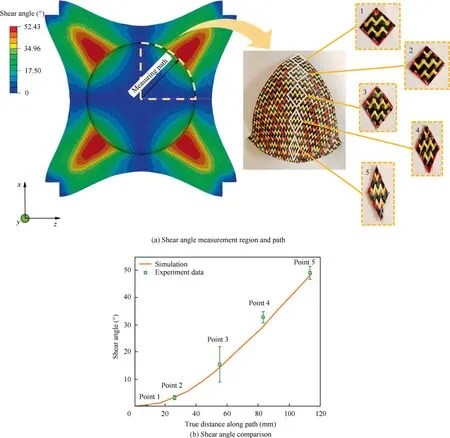
Fig.15 Shear angle comparison for measured points in hemispherical preforming.
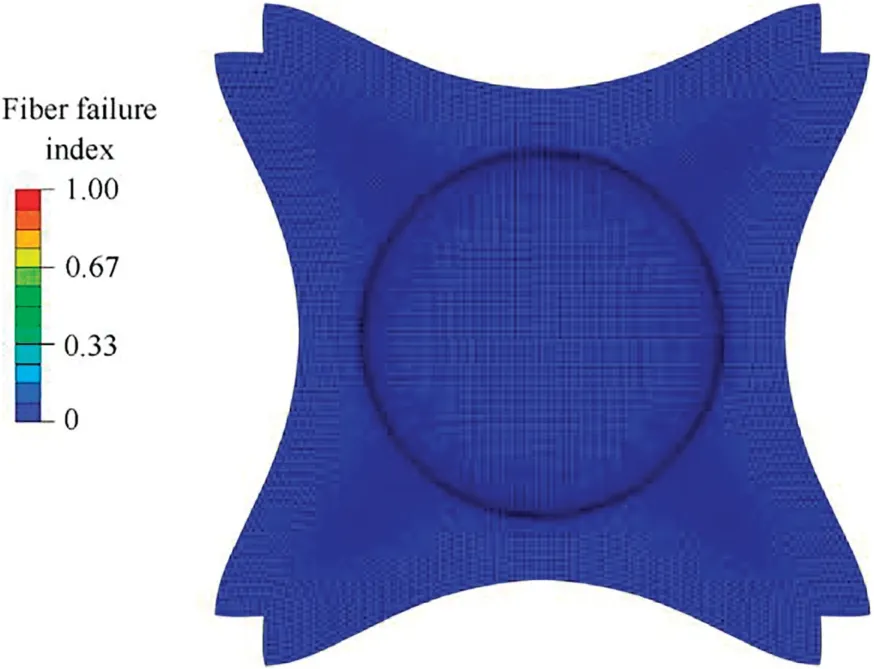
Fig.16 Fiber tensile failure prediction in hemispherical preforming.
5.2.Tetrahedral preforming
The dimension diagram of tetrahedral preforming setup is shown in Fig.17(a).The shape of the tetrahedral punch was the part cut on a cube with edge length of 103.9 mm and a radius of 7.5 mm at its edge corner.The gap between the punch and die was 1.5 mm.The blank holder force was imposed the same way as in the hemispherical preforming.The geometry shape of the specimen is shown in Fig.17(b).The pressure on the sample was 0.25 kPa and the punch depth was 54.5 mm with a punch speed of 10 mm/min.Other processing operations are the same as the one in the hemispherical preforming.
Fig.17(c) presents the FE model of the tetrahedral preforming setup.The specimen was discretized by S4R shell elements.Other parts were discretized by rigid elements R3D4.The friction between the specimen and other parts was also simplified as Coulomb friction,and the friction coefficient was selected as 0.2.Fig.18(a)shows the global deformed shape comparison,a good agreement can be noted(Dis the vertex of tetrahedron).The deformed boundary profile (perimeter of specimen) was compared with the experiment as shown in Fig.18(b).Slight asymmetry is observed in the deformation profile of the woven reinforcement from experiment.This is maybe due to the boundary conditions.When placing the blank specimen on the mold,it is very difficult to make the woven reinforcement perfectly symmetric on the mold,which can result in the deformed shape a little asymmetric as shown in Fig.14(a) and Fig.18(a).
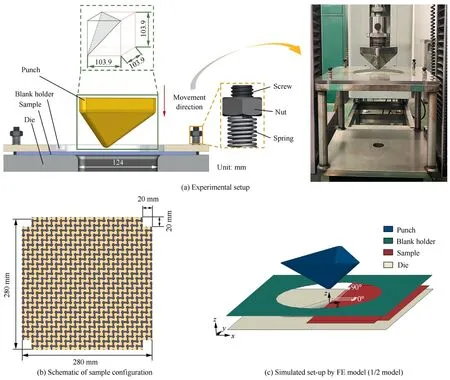
Fig.17 Experimental set-up and numerical model for tetrahedral preforming.
Fig.19(a) shows the shear angle distribution within the deformed specimen.The shear angle in the narrow regions near the two symmetry lines of the square specimen is close to 0.A significant shear angle variation can be noted in the neighborhood of the tetrahedron edgeAD,ACandAB(Fig.19(a)),which is partly attributed to the shape discontinuous at the corner.However,a smooth shear angle transition can be noted at the tetrahedron edgeDC,BCandBD,which implies that shear angle discontinuous may not be solely caused by the geometry shape discontinuous.Shear angle at some specific positions were also checked and compared as shown in Fig.19(a).Fig.19(b) presents shear angle comparison at six selected locations,a good agreement can be noted.The load–displacement curve during the punching process has also been checked.As shown in Fig.20,there has a good agreement in global,but the simulated punch force is underestimated compared to experiment.This is maybe due to the impact of tension-shear coupling as stated in Ref.35.The predicted fiber tensile damage state after preforming is shown in Fig.21.There is no tensile failure for both carbon and Kevlar fibers,which agrees well with the experimental observations in Fig.18.
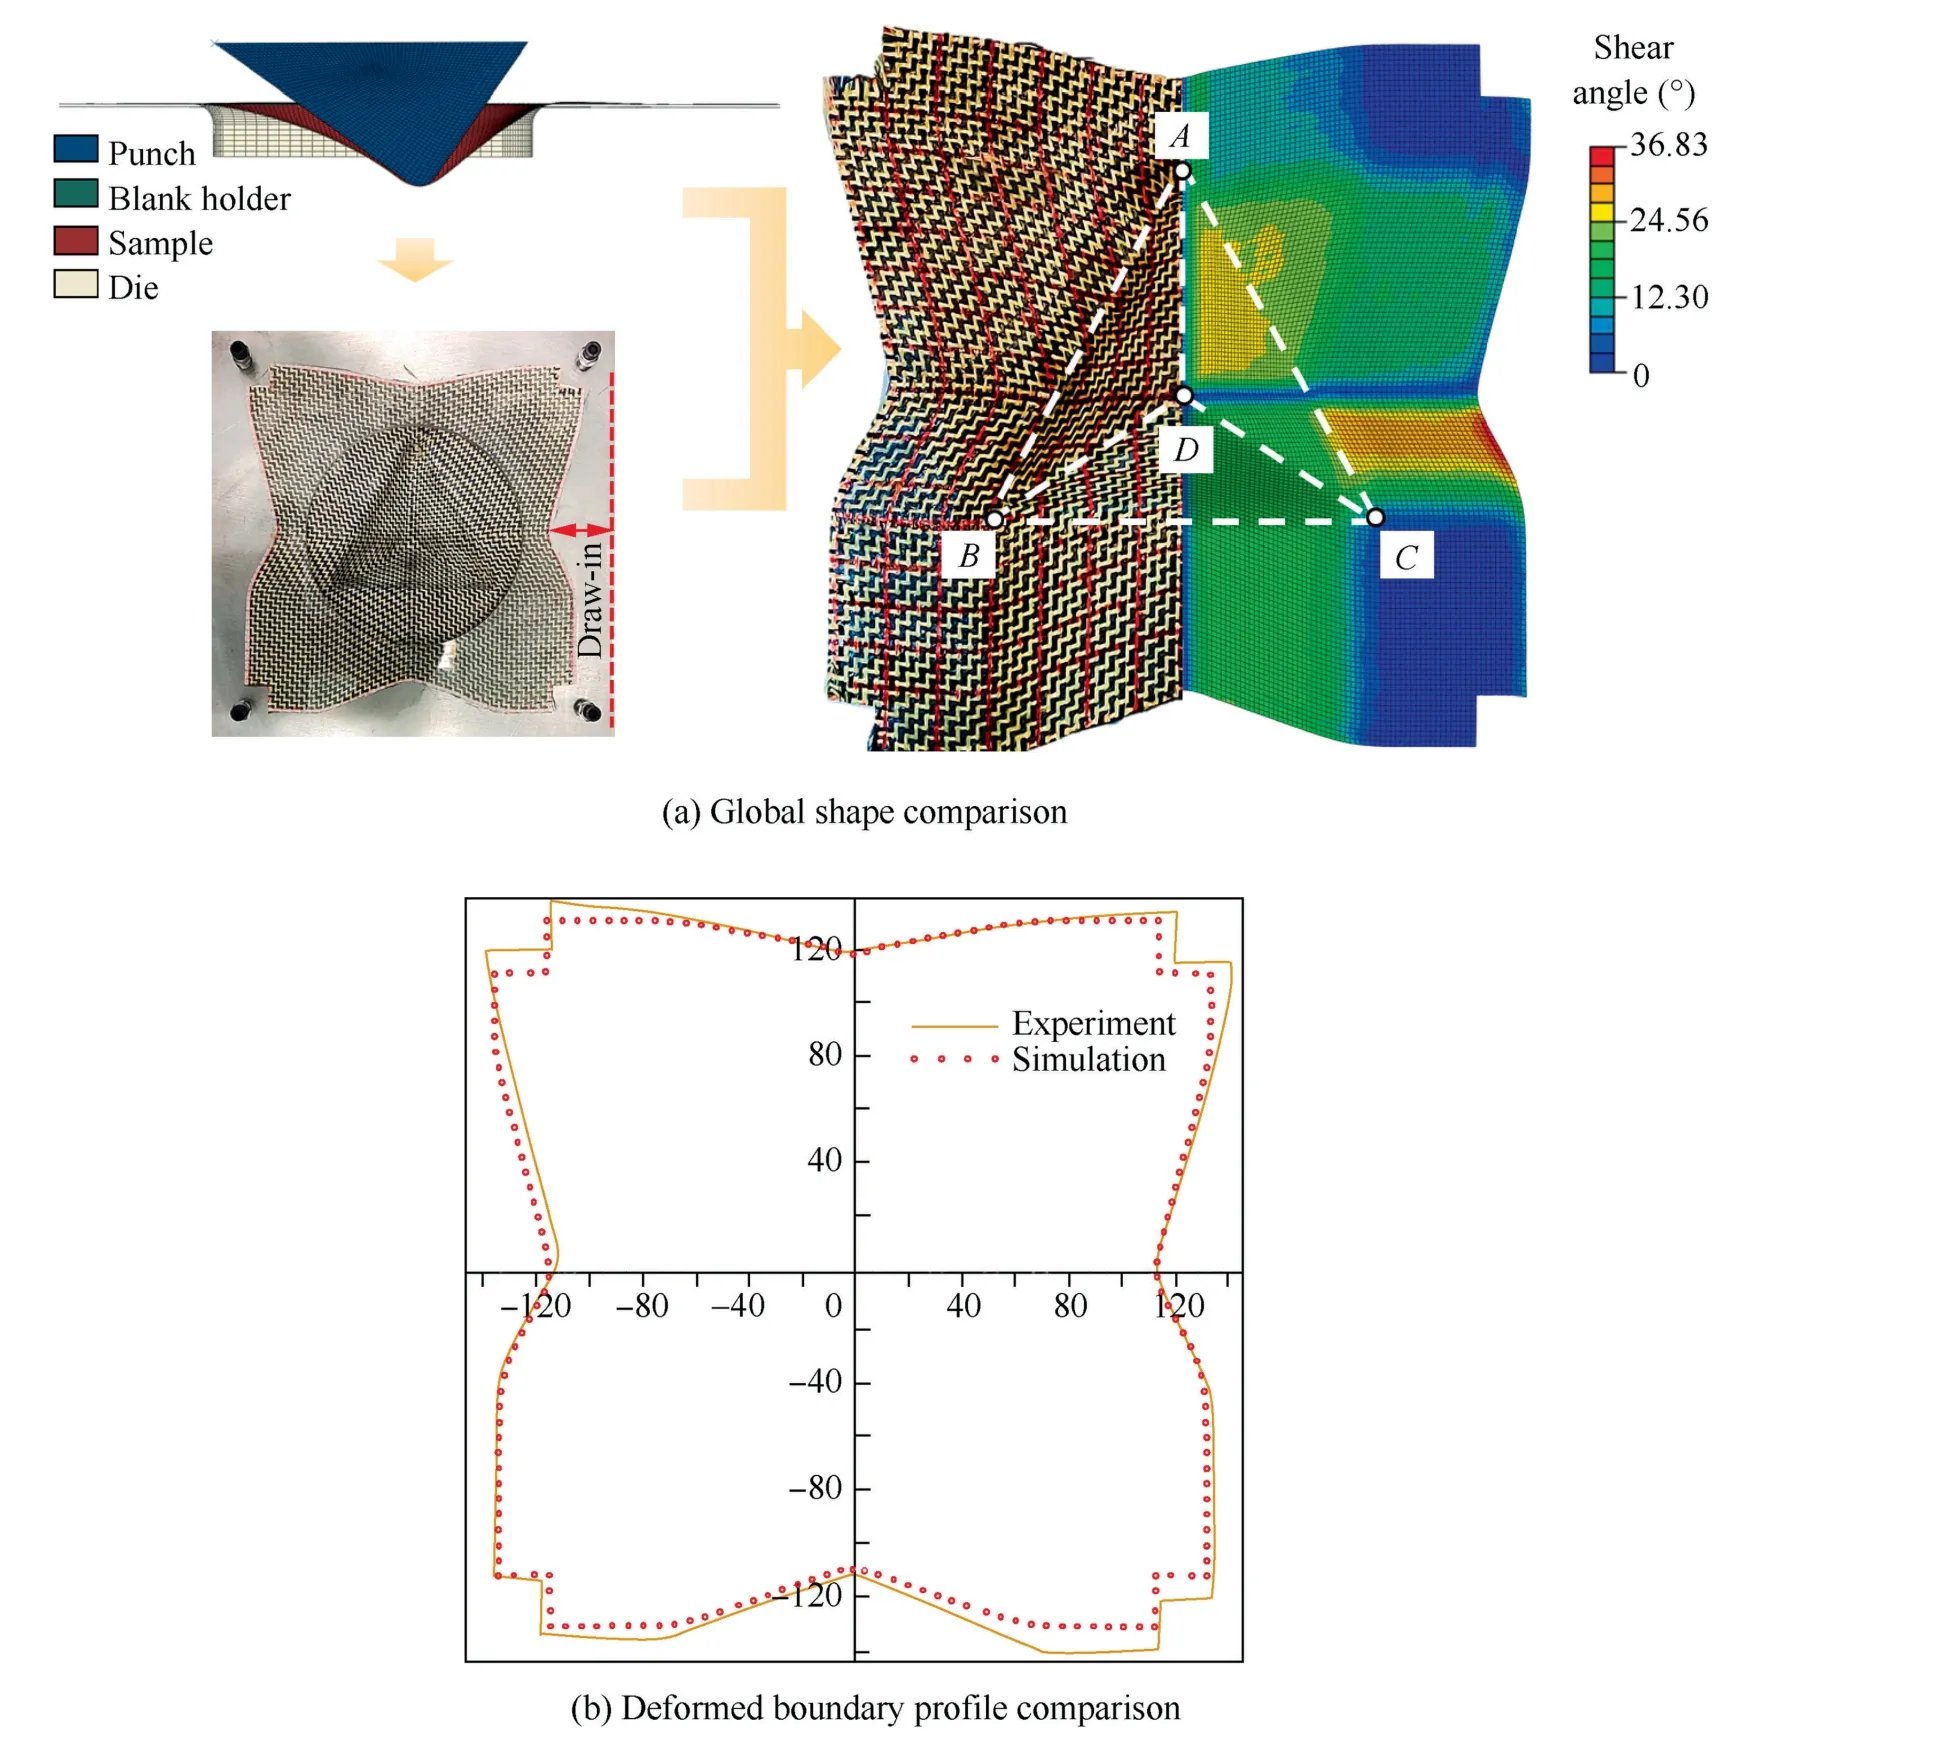
Fig.18 Deformed shape comparison between experiment and simulation for tetrahedral preforming.
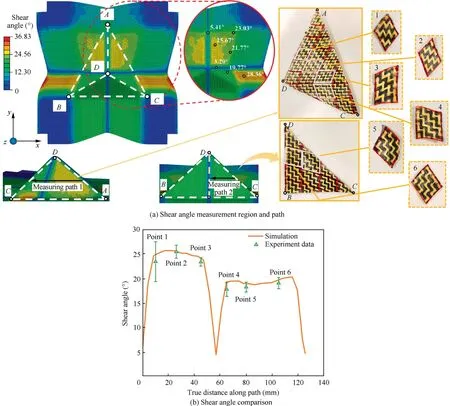
Fig.19 Shear angle comparison for measured points in tetrahedral preforming.
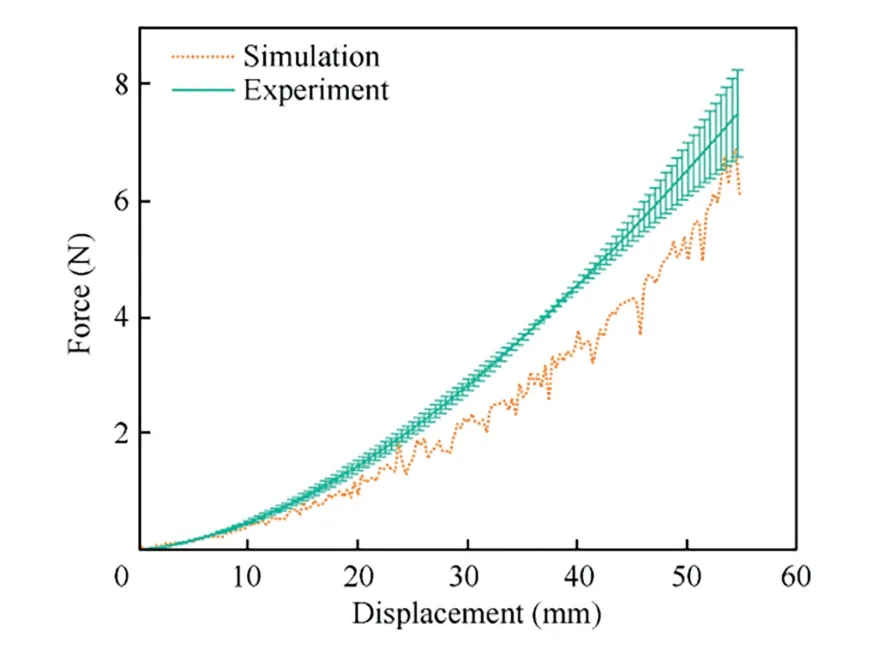
Fig.20 Comparison of punching force between experiment and simulation.
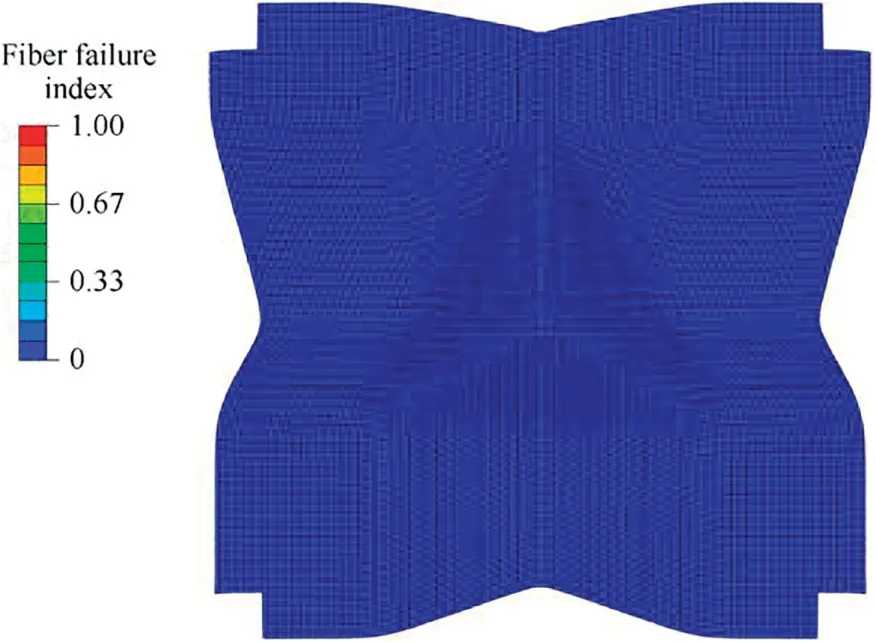
Fig.21 Fiber tensile failure prediction in tetrahedral preforming.
6.Conclusions
An efficient hyper-elastic constitutive model was proposed for the preforming simulation of Carbon-Kevlar hybrid woven reinforcement.Experimental characterization of its mechanical properties shows that its tensile and in-plane shear properties are almost loading rate insensitive within the deformation rate of preforming process.First,the model was validated by the tensile and bias-extension deformation tests,then simulations of hemispherical and tetrahedral preforming were conducted and compared with preforming experiments.The prediction accuracy for the shear angle,geometry shape,punch force and fiber tensile failure is very well and acceptable,demonstrating the effectiveness of the proposed model.In the future,based on this work,the bending deformation energy of woven reinforcement would be derived and added into the current model to enhance its capability to accurately predict the wrinkles shape.The tension-shear coupling would also be included to further improve the prediction accuracy.In addition,multiscale modeling would be conducted to explicitly research the influence of the constituents of the hybrid woven reinforcement on the deformation behavior.
Declaration of Competing Interest
The authors declare that they have no known competing financial interests or personal relationships that could have appeared to influence the work reported in this paper.
Acknowledgements
The authors appreciate greatly the financial support from the Young Fund of Natural Science Foundation of Shaanxi Province,China(Nos.2020JQ-701 and 2020JQ-121)and the Open Fund of State Key Laboratory of Applied Optics,China (No.SKLAO2020001A09).
 CHINESE JOURNAL OF AERONAUTICS2022年12期
- CHINESE JOURNAL OF AERONAUTICS的其它文章
- Effect of variable-angle trajectory structure on mechanical performance of CF/PEEK laminates made by robotic fiber placement
- Tribological performance of hydrogenated diamond-like carbon coating deposited on superelastic 60NiTi alloy for aviation selflubricating spherical plain bearings
- Multi-parameter load sensing pump model simulation and flow rate characteristics research
- A modified forward and backward reaching inverse kinematics based incremental control for space manipulators
- A novel strategy for fine-grained semantic verification of civil aviation radiotelephony read-backs
- Dynamic neighborhood genetic learning particle swarm optimization for high-power-density electric propulsion motor
