Multi-parameter load sensing pump model simulation and flow rate characteristics research
ZongXia JIAO ,Zhnyu WANG ,Xiaochao LIU ,HuJiang WANG ,Pngyuan QI ,Wizhi QIAO
a School of Automation Science and Electrical Engineering,Beihang University,Beijing 100083,China
b State Key Laboratory of Fluid Power and Mechatronic Systems,Zhejiang University,Hangzhou 310027,China
c Research Institute for Frontier Science,Beihang University,Beijing,100083,China
d Science and Technology on Aircraft Control Laboratory,Beihang University,Beijing 100083,China
e Science and Technology on Vehicle Transmission Laboratory,China North Vehicle Research Institute,Beijing 100072,China
f Ningbo Institute of Technology,Beihang University,Ningbo 315800,China
KEYWORDS Flow rate characteristics;Frequency analysis;Hydraulic;Load sensing pump;Nonlinear
Abstract Load sensing pumps have been widely used in diverse hydraulic systems.Studies show that structural parameters have undeniable impacts on the characteristics and efficiency of the load sensing pump.The main purpose of this article is to study the influence of load sensing pump structure parameters on flow characteristics.In the present study,a nonlinear multi-parameter model is proposed for this type of pump.In this model,different parameters,including spool clearance,spool covering amount,internal leakage are considered to reflect the displacement adjustment process of the load sensing pump.Moreover,a frequency sweep method is proposed to analyze the frequency domain of the nonlinear mathematical model.An experiment rig was built to study the influence of key structural parameters on the dynamic follow-up characteristics of the pump flow.The obtained results show that the diameter of the orifice d can significantly affect the working characteristics of the pump.It is found that a large diameter of the orifice d can improve the phase following ability of the system,while a small diameter of the orifice d can reduce the bypass flow rate and increase the amplitude following ability.This paper provides a new consideration to study the dynamic follow-up characteristics of the load sensing pump.
1.Introduction
With the rapid development of the economy and increasing demand for energy around the world,the energy crisis has become an important challenge.1Moreover,Li et al.1adapted proportional load sensing control technology and designed an energy-saving hydraulic pumping unit.Aiming at the investigation of load sensing systems.Hydraulic systems are widely adopted driving systems.Accordingly,designing energy-saving hydraulic systems has attracted many scholars and has been a hot research topic.Casoli et al.2compared the performance of load sensing and zonal hydraulic systems.Considering the high power-to-volume ratio,energy-saving hydraulic systems have been widely applied in the aviation industry.3Accordingly,improving energy-saving systems is of significant importance to further develop the hydraulic industry.
Recently,load sensing technology has been developed as an effective energy-saving system.Accordingly,numerous energysaving hydraulic systems have been developed based on loadsensing technology.Shi et al.4proposed a transient lubrication model to analyze the variable load failure mechanism in highspeed pumps used in the Load Sensing Electro-Hydrostatic Actuator (LS-EHA).Cheng et al.5proposed a flow matching system based on load sensing technology and found that the proposed system can improve the system from a dynamic point of view.Lovrec et al.6utilized a hydraulic pump with adjustable swept-volume-principle of volumetric control,proposed an electro-hydraulic load sensing system equipped with a speedcontrolled system,and improved the power efficiency rate.The performed investigations reveal that load sensing technology plays a very important role in hydraulic energy-saving systems.
In a hydraulic energy-saving system,load sensing pumps play a core role in converting the mechanical power into the hydraulic power.4This pump is an axial piston variable pump,which can realize the compound proportional control of pressure and flow simultaneously.7The piston displacement can be adjusted by changing the swashplate angle.4During the operation of the system,the pump outlet pressure depends on the system load.Moreover,constant pressure and flow rate can be achieved,thereby avoiding waste of energy and improving the pump efficiency.7,8Wagner and Fales9combined linear and nonlinear mathematical models to study different load sensing pumps,and used the nonlinear model to evaluate the stability of a particular load sensing system.Accordingly,several functions were defined to characterize the system stability.However,no analysis was carried out on the structural parameters of load sensing pumps,and only the system-level characteristic was analyzed.Roccatello et al.10,Jayaraman and Lunzman11,and Yin et al.12simulated load sensing pumps to study the working characteristics of these devices.Roccatello et al.10performed a joint simulation on axial piston variable displacement pumps using the co-simulation environment.Accordingly,an innovative method was provided to analyze complex fluid power systems.Hu et al.13modeled the load sensing pump and analyzed it in detail.Then the model was simplified and showed that the obtained simulation results are consistent with the experiment.However,variable structural parameters were not considered in the simulations.Reviewing the literature indicates that there is a lack of detailed research on the influence of different structure parameters on the dynamic characteristics of the load sensing pumps.
The nonlinear model of load sensing pumps has a complexity so that it is an enormous challenge to design closed-loop controllers for these pumps.Jayaraman and Lunzman11established a third-order linearized model to replace the nonlinear one and then verified the model through test data and a promising consistency was achieved.However,the proposed model has certain limitations on some design parameters.Ding et al.14studied the synchronization characteristics of load sensing pumps.In this regard,a load sensing synchronous control valve was designed and verified through experiments.The obtained results showed that the proposed load sensing synchronous control has high synchronization accuracy and high energy efficiency.However,the characteristics of the load sensing pump were not studied.
Cheng et al.15,16proposed the Electronic Load Sensing(ELS) system to adjust the pump piston displacement by switching between pressure control and flow control.Accordingly,the load sensing hydraulic system can be applied to resolve the flow mismatch problem while ensuring high control characteristics.Hansen et al.17designed a preliminary control system and tested it on the machine.The obtained results in this regard showed that compared with the Hydraulic Load Sensing (HLS) system,the ELS system can improve energy efficiency.
Li et al.18applied linearization and simplified models and studied the influence of the structural parameters of the load sensing pump on the operating characteristics.Moreover,Jayaraman and Lunzman19uses the Recursive Least Squares(RLS) algorithm to estimate the parameters of an ELS pump in real-time.The obtained results showed that this linear model can be used to design a robust adaptive controller for a load sensing system and monitor the dynamic performance of this system.Corvaglia et al.20used 3 dimensions Computational Fluid Mechanics (CFD) models to simulate the load sensing proportional valve.However,not all structural parameters were considered on the flow characteristics of load sensing pumps.Zhao et al.21and Gao et al.22applied optimal design and control technologies to improve the characteristics of the hydraulic pump.23–25
Based on the performed literature survey,it is to propose a reliable nonlinear model for load sensing pumps that cover different working conditions.The main objective of the present study is to provide a reliable method to investigate the influence of multiple structural parameters on the working characteristics of load sensing pumps in the frequency domain.Then an experiment rig is designed to verify the numerical simulation.
This article is organized as follows: In Section 2,the working principle of the load sensing pump is introduced and the mathematical model is discussed.Base on the proposed model,parameter analysis is described in Section 3,and then the frequency sweep method is introduced in Section 4.Characteristics of the frequency domain are analyzed and the obtained results are discussed in Section 5.Finally,the main achievements are conclusions are summarized in Section 6.
2.Principles and model establishment of the load sensing pump
2.1.Model description
Fig.1 illustrates the internal structure of the load sensing pump,indicating that the pump mainly consists of two control valves,including a Load Sensing Valve (LSV) and a Pressure Cut-off Valve (PCV).The left side of the LSV is connected to the pump outlet pressure,and the right side is connected to the load pressure.Fig.1 shows that the displacement of the swash plate of the variable pump and outlet flow can be adjusted through the piston and the throttle valve s2,respectively.Throttle valve s1 is used to generate load pressure,change the load pressure by changing the opening value of throttle valve s1,the opening value of throttle valve s1 is denoted byx1.Moreover,four orifices a,b,c,and d control the flow leakage of the system.
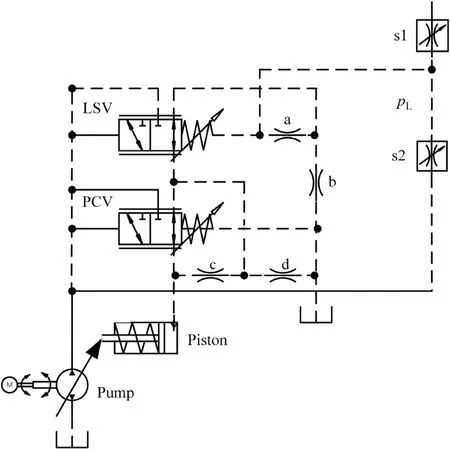
Fig.1 Schematic of simplified internal structure of load sensing pump.
It is worth noting that the proposed mathematical model conforms to the actual working conditions of the studied load sensing pump (Bosch Rexroth’s A10V28/52,Germany).The flow leakage occurs in the gap between the spool and the valve sleeve of the pressure shut-off valve is analyzed,the load sensing valve covering amount is added to the model,and the flow rate of the bypass orifice a,b,c,d is also reasonably analyzed.
2.2.Establishment of governing equations
2.2.1.Load sensing valve model
The structure of LSV is shown in Fig.2,indicating that the load sensing spool has a positive covering.It is observed that Port P,Port A,and Port T are connected to the pump outlet,variable adjustment piston control chamber,and the tank,respectively.
When oil flows from the pump outlet(Port P)into the variable piston control chamber(Port A),effective interactive displacement can be calculated from the following expression:

wherexeis the effective displacement between Port P and Port A,xvis the displacement of the LSV spool,rvis LSV hole radius,Δxvis the spool covering amount,it is worth noting that Δxvis positive when the spool covering amount is positive and otherwise it is negative.
The function of the shaded part in Fig.2 is to change the spool displacement.This can be mathematically expressed as follows:
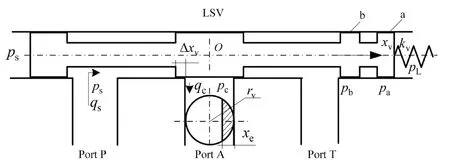
Fig.2 Schematic of simplified internal structure of LSV.

whereAedenote the effective flow area of the LSV.
Moreover,the control flow rate from Port P to Port A is:

whereqcdenote the control flow rate from Port P to Port A,Cvpis the flow coefficient of the LSV port,pcis the control chamber pressure,psis the pump outlet pressure,ρ is the oil density.
The flow passing through orifices a,b,c,d can be obtained from the following equations:
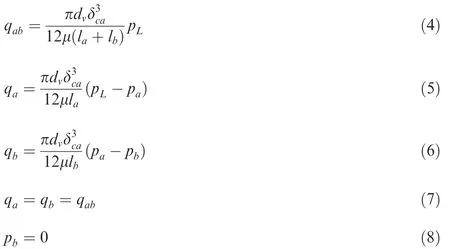
whereqabis the total flow through the gaps a and b,dvis the LSV spool diameter,δcadenotes the concentric annular gap,μ is the dynamic viscosity of the oil,lais the length of the gap a,lbis the length of gap b,pLis the load pressure,qaandqbdenote flows through the gaps a and b,respectively.Moreover,paandpbare the oil pressure after the gaps a and b,respectively.
LSV spool force balance can be mathematically expressed in the form below:

whereAvis the LSV spool cross-sectional area,mvis the LSV spool mass,bvis the LSV spool movement damping,kvis the LSV spring rigidity,Fvois the LSV spring preload.
2.2.2.Model of the variable adjustment mechanism
Fig.3 illustrates the schematic diagram of the swash plate moment balance.The installation of the swash plate in the axial piston variable pump is biased,thereby generating a paranoid hydraulic torque and helping the return spring of the swash plate to perform the reset function.The swashplate generates a hydrodynamic moment,and the established swashplate moment balance equation covers these two moments.
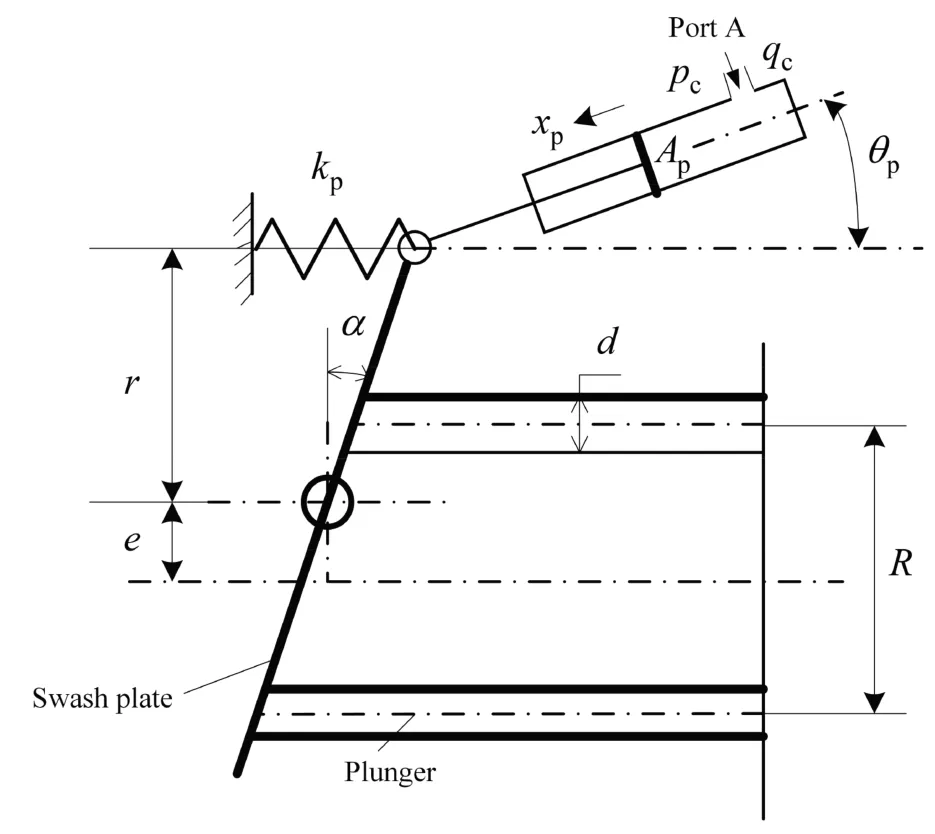
Fig.3 Schematic of swash plate moment balance.
Compared with the bias moment on the swashplate,the applied deflection moment and sliding shoe friction torque on the gravity center of the swash plate can be ignored.Under this assumption,the swash plate moment of inertia mainly includes the swash plate moment of inertia,hydraulic pressure moment caused by the swash plate bias,and hydraulic torque generated by the closing dead angle of the valve plate.In order to limit the sheet angle to a maximum value,the reverse torque generated by fixing the pump housing is considered in the calculations.Accordingly,the torque balance equation of the swash plate can be expressed in the form below:
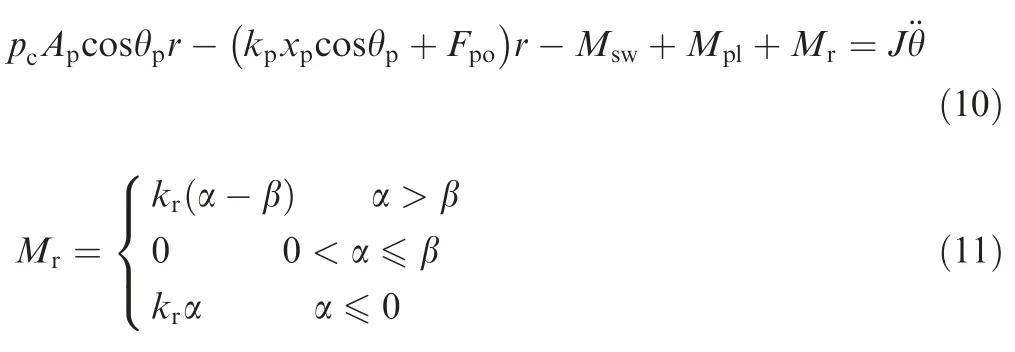
whereApis piston cross-sectional area of the variable adjustment mechanism,θpis the tilt angle of the piston chamber of the variable adjustment mechanism,ris the vertical distance between the variable adjustment mechanism and the center of the swashplate,kpis the spring stiffness of the variable adjustment piston,xpis displacement of piston,Fpois the spring preload of the variable adjustment piston,Mswis the bias moment of the swashplate,Mplis the hydraulic torque of the plungers,Mris the pump housing reverse torque,Jis the swash plate moment of inertia,θ is the swash plate angular displacement;kris the reverse torque equivalent rotational stiffness,α is the rotation angle of the swashplate,β is the maximum inclination angle of the swashplate.
The hydraulic torque produced by the bias of the swash plate can be expressed in the form below:

wherezis the number of plungers,eis the swash plate installation offset distance,dis the plunger diameter.In order to simplify the calculation,it is assumed that half of the plungers are in the high-pressure zone.
The hydraulic torque produced by the closing dead angle of the valve plate can be calculated through the following expression:

where δ is the dead angle of the valve plate,Ris the radius of the plunger hole pitch circle.
Outlet flow of the pump can be is given by:

whereqsis the pump outlet flow,Vmaxis the maximum displacement of the pump,nis the pump rotating speed,η is the leakage coefficient.
The geometric relationship between the piston displacement and the swashplate rotation angle of the variable mechanism can be mathematically expressed in the form below:

2.2.3.Pressure cut-off valve model
Fig.4 shows the schematic of the simplified PCV,where e and f denote the gap between the valve spool and the valve sleeve,respectively.It should be indicated that in the established model,the leakage flow through these two gaps is considered in the calculations.
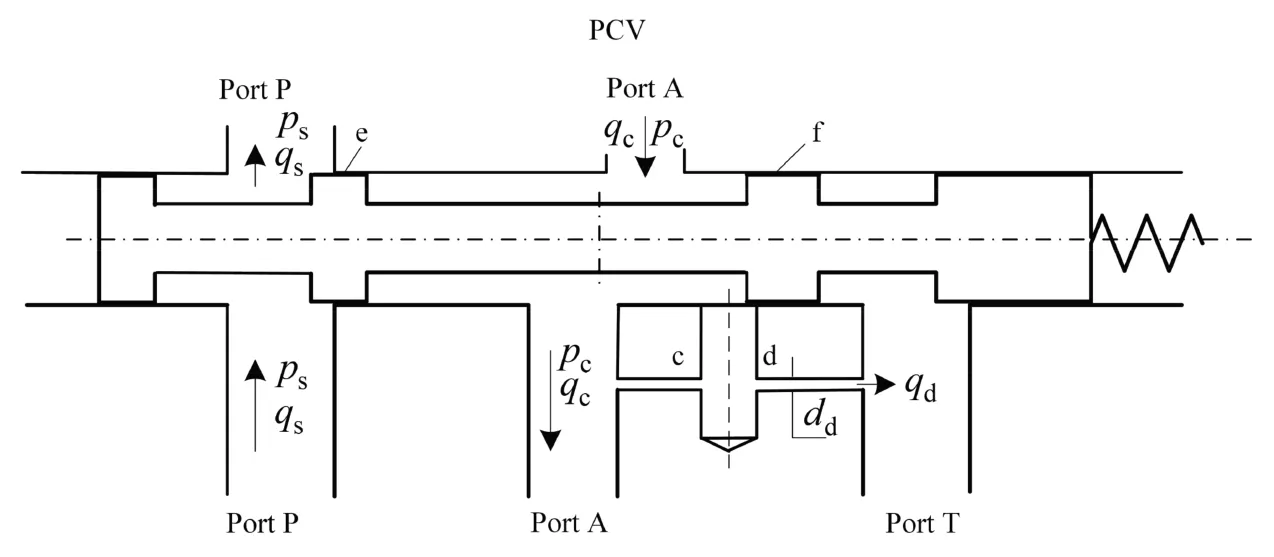
Fig.4 Schematic of simplified PCV.
Cavity transient pressure of the variable piston can be expressed in the form below:

where βeis the bulk modulus of the oil,Vpis the dead zone volume of the LSV port to the variable piston pipeline,qeis the flow passing through the variable pump to the control chamber through gap e,qdis the flow into the tank through the orifice d,andqfis the flow passing through the control chamber leaking to the tank through gap f.
The orifice d is a long slender damping hole,and the passing flow can be obtained from the following expression:

whereddandldare the diameter and length of the orifice d,respectively.
2.2.4.Flow continuity equation of the system
The transient pressure control equation at the pump outlet can be expressed as follows:

whereVs2is the dead zone volume between the pump outlet and the throttle valve s2,q2is the flow rate of the throttle valve s2.
Moreover,the flow rate passing through the throttle valve s2 can be calculated from the following expression:

where Cs2is the flow coefficient of the throttle valve s2;Ws2is the area gradient of the throttle valve s2;x2is the opening value of the throttle valve s2.Load transient pressure control equation is given by

whereVs1is the volume from the load sensing cavity to the throttle valve s1,andq1is the flow rate of the throttle valve s1.
2.3.Flow characteristic analysis
When the load sensing pump reaches a stable operation,the pump flow of each channel of the system can be calculated from the following expression:

Eq.(3)indicates that during the stable operation of the system,there is a constant differenceqcbetween the pump outlet pressure and the loading pressure.Under this circumstance,Eq.(19) reveals thatq2is also constant.Since the gaps e and f are small,qeandqfcan be ignored.Accordingly,the tracking characteristic of the pump outlet flow mainly depends on the flow passing through the orifice d.Based on Eq.(17),qdis proportional to the fourth power ofdd.Therefore,variations of theddhave a significant impact on the tracking characteristics of the pump outlet flow.
3.Parameters analysis
In order to verify the proposed model,it is applied to the opening of throttle valve s2 fromx2=0 mm tox2=10 mm,and the ideal flow rate of the throttle valve s2 is obtained.Then the simulation is repeated with different structural parameters and the same input signal.Finally,the obtained results are compared with the ideal curve to evaluate the model accuracy.
Fig.5 indicates that the operation of the load sensing pump can be mainly divided into two stages.In the first stage,the pump outlet flow rate increases uniformly along thex2-direction,and the load sensing pump provides the required flow rate for the load.In the second stage,the output flow reaches saturation and the outlet flow of the pump does not change along thex2-direction.In this stage,the flow rate reaches the maximum.
In this section,three structural parameters,including the diameter of the orifice d (dd),the spool covering amount of the LSV(Δxv),and the LSV spool diameter(dv)are considered to investigate the impact on system flow.
Fig.5 shows the correlation between the pump output flow and the ideal curve for different diameters of the orifice d.It is observed that whenddis smaller than 0.6 mm,the flow rateq2passing through the throttle valve s2 approaches the ideal flow rate.This may be attributed to the small flowqdpassing through the orifice d.In this case,Eq.(21) indicates that the flow curve of the system approaches the ideal flow curve,and the obtained results from the model are consistent with the theoretical analysis.
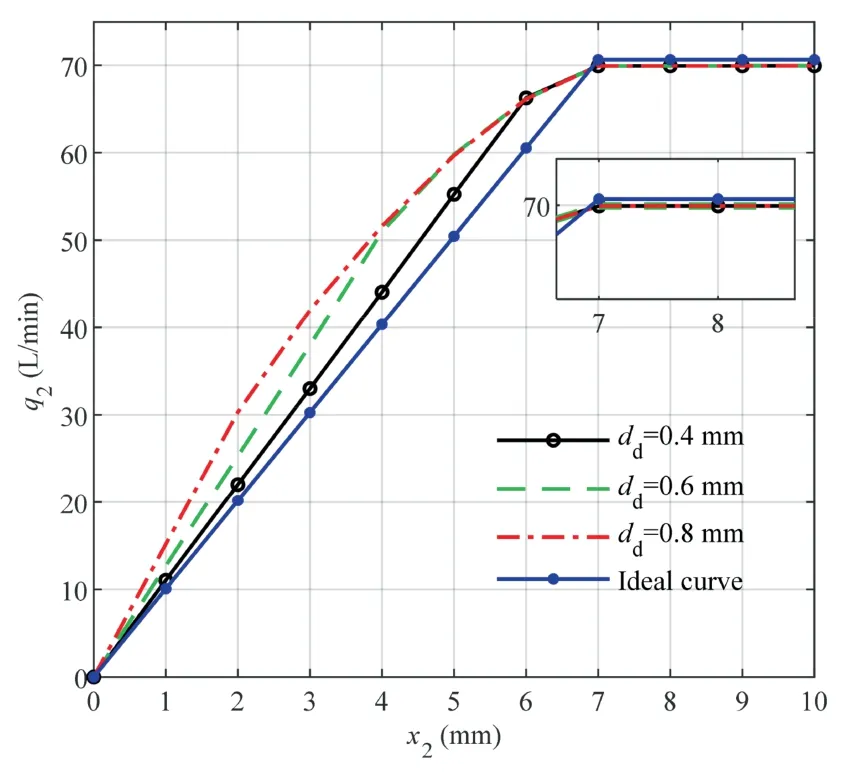
Fig.5 Flow rates for different values of the parameter dd.
When the load sensing pump is in a stable operation,the output flow satisfies Eq.(21).According to Eq.(17) and Eq.(21),as the diameter of the orifice d increases,the flow passing through the orifice d increases,thereby increasing the outlet flow of the pump.
Fig.6 shows the correlation between the simulated output flow and the ideal curve for different values of Δxv.It is found that the LSV spool covering amount has a negligible impact on the flow rate of the pump.However,Δxvhas a remarkable influence on the system response time.Fig.2 shows the schematic of the LSV structure.When oil flows from the pump outlet(Port P)to the variable piston control chamber(Port A),its effective interactive displacement can be obtained from the static Eq.(1).Assuming a constant displacement for the LSV spool (xv),thenxewith a negative spool covering amount reaches the maximum,whilexewith a positive spool covering amount reaches the minimum.Therefore,the highest and lowest pump outlet flow rate can be obtained for a negative and positive covering,respectively.
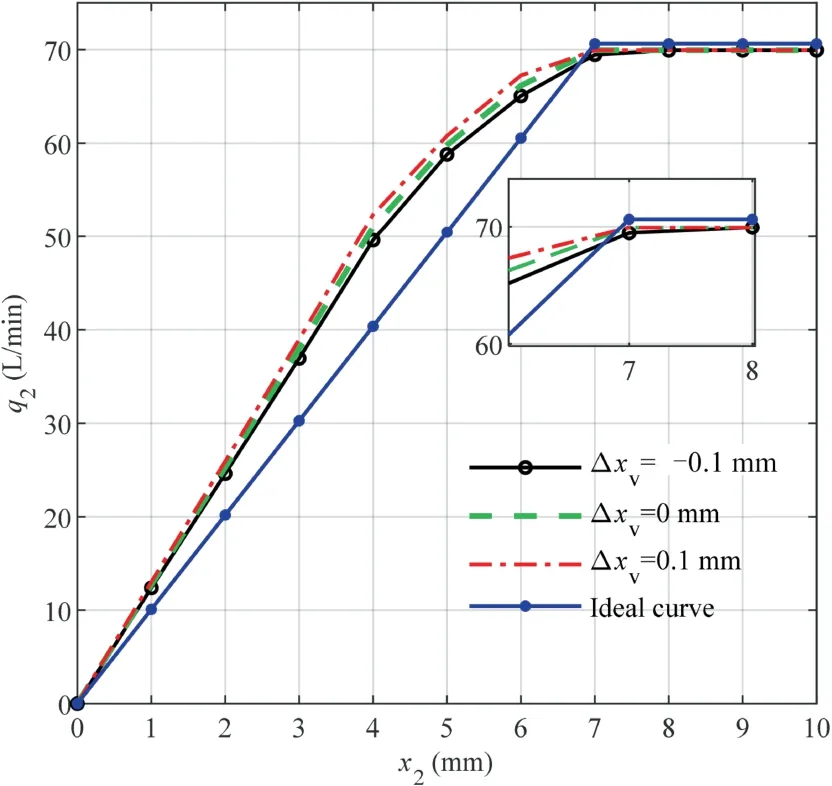
Fig.6 Flow rates for different values of the parameter Δxv
Fig.7 illustrates the correlation between the output flow of the simulation and the ideal curve for different values of the parameterdv.In this regard,Eq.(9) indicates that when the difference between the pump outlet pressurepsand the load pressurepLremains constant,the greater the value ofdv,the larger the applied force on the LSV spool,and the closer the output flow to the ideal flow rate.
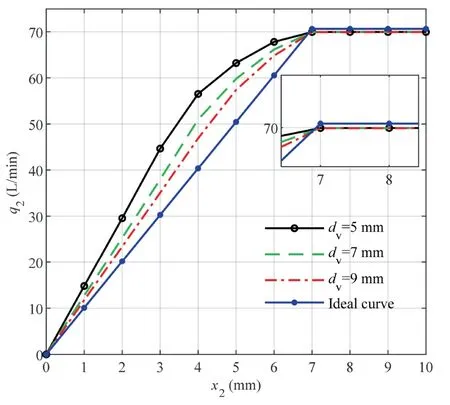
Fig.7 Flow rates for different values of the parameter dv
When the load sensing pump is working in a stable state,the spool of the LSV meets the following equation:

Eq.(22) indicates that when the difference between pump outlet pressurepsand load pressurepLis constant,the greater the value of the parameterdv,the greater the displacement of the LSV spool,and the greater the outlet flow rate to the piston chamber.Consequently,the angle of the swash plate increases and the output flow of the pump outlet increases.
Based on the obtained results,the present study is expected to provide a reliable reference for matching the design parameters of the load sensing pump.
4.Frequency sweep method and frequency domain analysis
The established model contains nonlinear equations so that the standard Bode diagram cannot reflect the true frequency characteristics of load sensing pump.
Accordingly,the frequency sweep method is applied to draw the Bode diagram of the system.To this end,the opening of the throttle valve s2 is used as the input signal.Meanwhile,signals have sine waveforms of different frequencies.Then the proposed model is applied to calculate the flow rate of the throttle valve s2 as the output signal.It is found that at different frequencies,the output signal has different amplitude attenuations and phase delays compared with the input signal.The amplitude-frequency characteristic curve can be obtained considering the correlation between the amplitude attenuation and frequency,and the correlation between the phase delay and frequency.
Fig.8 shows the response of the flow rate of the throttle valve s2 signal under different frequencies of the throttle valve s2 opening signals.It is observed that when the signal frequency is less than 1 Hz,the flow rate of the throttle valve s2 follows the input signal.Fig.8(d) shows that when the signal frequency increases to 6.3 Hz,the flow rate of the throttle valve s2 still follows the control command of the throttle valve s2 very well,but a phase lag and amplitude attenuation occur.Fig.8(e) reveals that when the signal frequency further increases to 10 Hz,the flow rate of the throttle valve s2 still follows the control command of the throttle valve s2,but the output waveform significantly distorts,indicating that nonlinear characteristics of the system have a significant impact on the control characteristics of the system.When the control signal frequency of the throttle valve s2 exceeds 15.8 Hz,the output signal cannot effectively follow the input signal.
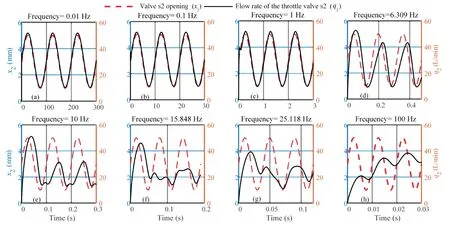
Fig.8 Obtained results from frequency sweep method.
In the present study,the influence of different structural parameters on the flow following characteristics of load sensing pumps is studied using the frequency sweep method.The frequency-domain analysis of different parameters,includingdd,Δxvanddvis carried out.
Fig.9(a) and Fig.9(b) show the amplitude-frequency and phase-frequency curves of the load sensing pump for different values ofdd,respectively.Fig.9(a) indicates that the bandwidth of the load sensing pump is about 10 Hz,and asddincreases,the corresponding bandwidth of the system increases too,and the signal following ability improves.Moreover,Fig.9(b) reveals that there is no phase lag in the output of the low-frequency system,while the phase lag in the midfrequency range becomes more significant asdddecreases.
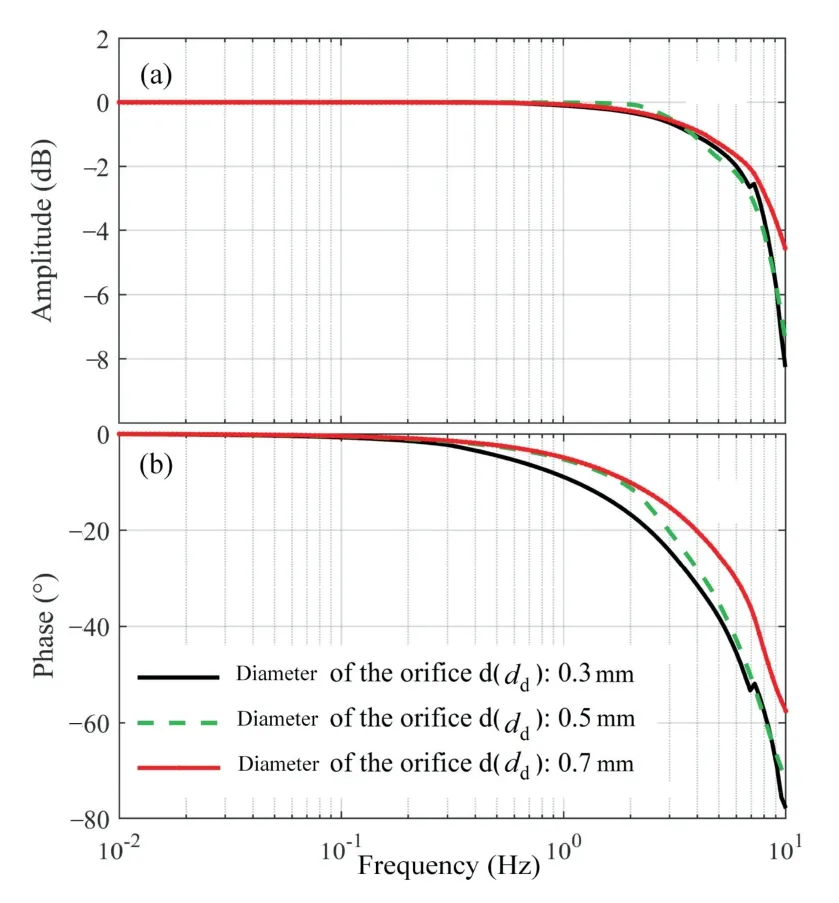
Fig.9 Frequency domain characteristics for different values of the parameter dd.
Fig.10(a)and Fig.10(b)represent the amplitude-frequency and phase-frequency curves of the load sensing pump for different values of Δxv,respectively.Fig.10(a) indicates that when the spool is negative covering amount (Δxv<0),the bandwidth of the system increases and the following characteristic of the output flow improves.On the other hand,when the spool is positive covering amount(Δxv>0),the bandwidth of the system decreases and the following characteristics of the output flow deteriorate.Fig.10(b) shows that when Δxv<0,the phase lag of the system output flow is small,while the phase lag of the output flow increases when Δxv>0.This is because a valve spool with a positive covering amount requires a longer displacement,so the following characteristics deteriorate.
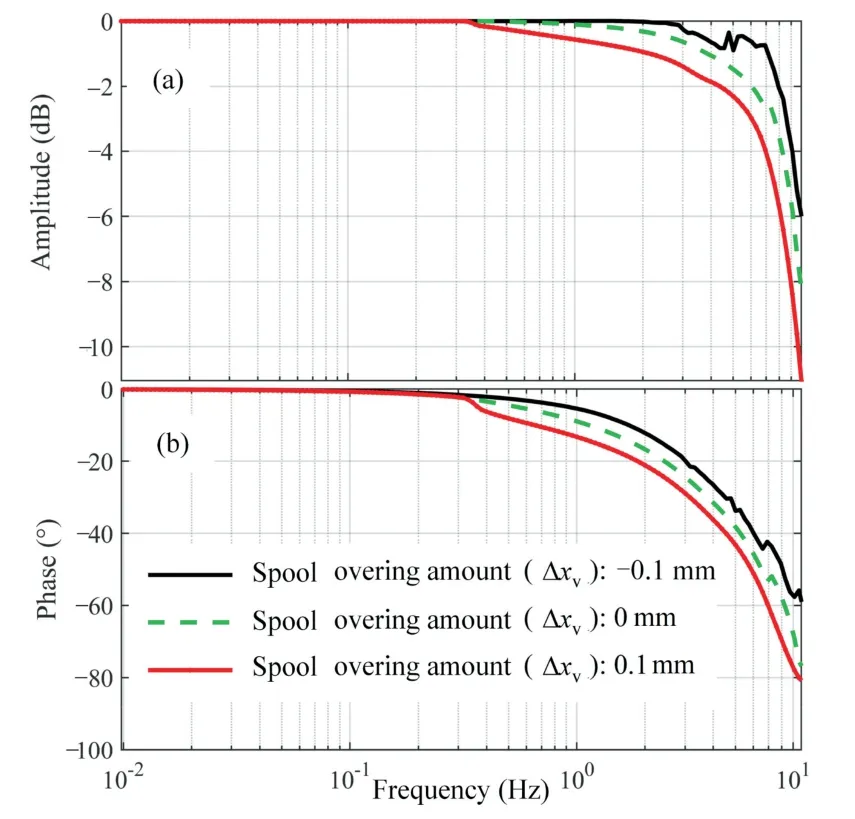
Fig.10 Frequency domain characteristics for different values of the parameter Δxv.
Fig.11(a)and Fig.11(b)represent the amplitude-frequency and phase-frequency curves of the load sensing pump for different values ofdv,respectively.Fig.11(a) shows that a largerdvcan increase the bandwidth of the system and improve the following characteristics of the output flow.Moreover,Fig.11(b) reveals that a largerdvcan reduce the phase lag of the system output flow.This is because a largerdvenables the spool to obtain greater driving force and improves the flow following ability of the system.

Fig.11 Frequency domain characteristics for different values of the parameter dv
In this section,a novel method is introduced to analyze the frequency domain characteristics of nonlinear systems.The influence of different structural parameters on the flow characteristics of load sensing pumps is studied from the perspective of the frequency domain,which has a good reference value.
5.Simulation and experiment
5.1.Simulation model
Fig.12 illustrates the simulation model of the load sensing pump,which is developed in the MATLAB Simulink environment.

Fig.12 Schematic of simulation model.
It is observed that the leftmost part is the initial input of the model.The throttle valve s1 is utilized to simulate the load of the system andx1is the opening of the throttle valve s1.The model reflects the calculation results of different equations as input variables to form a closed loop.Finally,the results of the different variables of the load sensing pump during a normal working situation are obtained.
5.2.Simulation results
In order to study the follow-up characteristics of the load sensing pump output flow,the abovementioned simulation model is used to calculate the flow rate through the throttle valve s2 (see Fig.1).The initial input parameterx2changes the frequency value as 0.02 Hz,0.05 Hz,0.1 Hz,1 Hz,2 Hz and10 Hz.Moreover,ddis set as 0.4 mm,0.6 mm,0.8 mm and 1.0 mm,respectively.Then,the simulation results are compared with the theoretical flow value.
In Fig.13,the black curve represents the theoretical flow rate,the simulated flow atdd=0.4 mm,dd=0.6 mm,dd=0.8 mm,which are illustrated by the green,blue and pink curves,respectively.It is observed that asddvalue increases,the simulated flow increases too,which is consistent with the theoretical analysis.
Fig.13(f) shows that when the changing frequency ofx2increases to 10 Hz,the system flow rate following characteristic is bad.As the value ofdddecreases,the phase delay between the simulation result and the theoretical flow rate gradually increases,especially whendd=0.4 mm.The red curve in Fig.13(f) shows that there is a larger phase delay and amplitude difference between the simulated flow and the theoretical flow.Therefore,the load sensing pump can no longer meet working conditions.
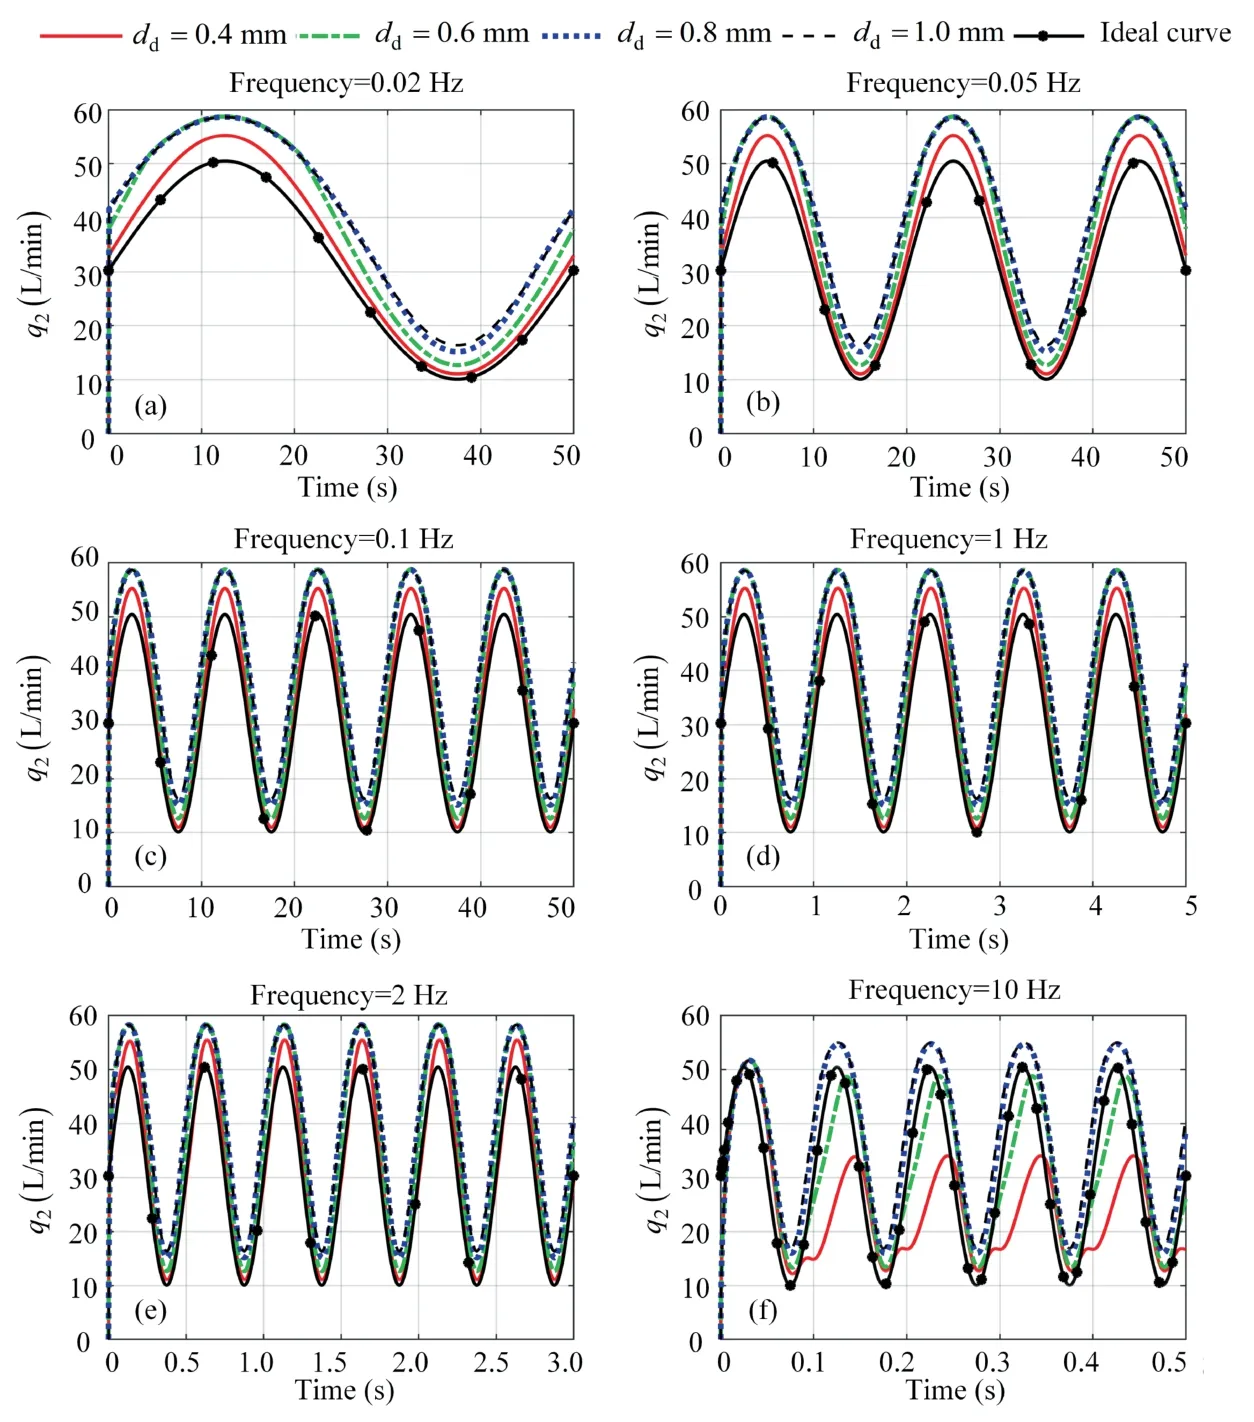
Fig.13 Simulation results under different dd and frequencies
Whenx2changes slowly,a smallerddcauses the flow of the system to be very close to the theoretical flow,and the performance of the load sensing pump is ideal.
Whenx2changes rapidly,a smallerddcauses the response speed of the pump to decrease.Therefore,the variable piston(Piston in Fig.1) cannot adjust the swashplate rotation angle quickly,and the pump output flow cannot meet the working conditions.It should be indicated that the simulation results are consistent with the theoretical analysis.
5.3.Experiment and results analysis
5.3.1.Experimental rig
An experimental rig is constructed to study the influence of the diameter of the orifice d on the flow following characteristics of the load sensing pump and to verify the correctness of the simulation mathematical model.Fig.14 shows the hydraulic schematic of the experiment.Moreover,Fig.15 shows the photograph of the experimental rig.
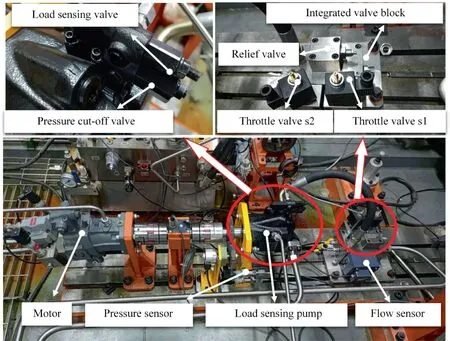
Fig.15 Photograph of experiment rig.
It should be indicated that a hydraulic motor is used to drive a load sensing pump.Moreover,the throttle valve s1 and the throttle valve s2 are utilized to simulate the system load and to control the flow rate of the throttle valve s2,respectively.Furthermore,one flow sensor and two pressure sensors are used to measure the flow through the throttle valve s2 and to measure the pressure of two ends of the throttle valve s2,respectively.Fig.14 shows that throttle valves s1,s2,flow sensors,and relief valves are all integrated on the integrated valve block.
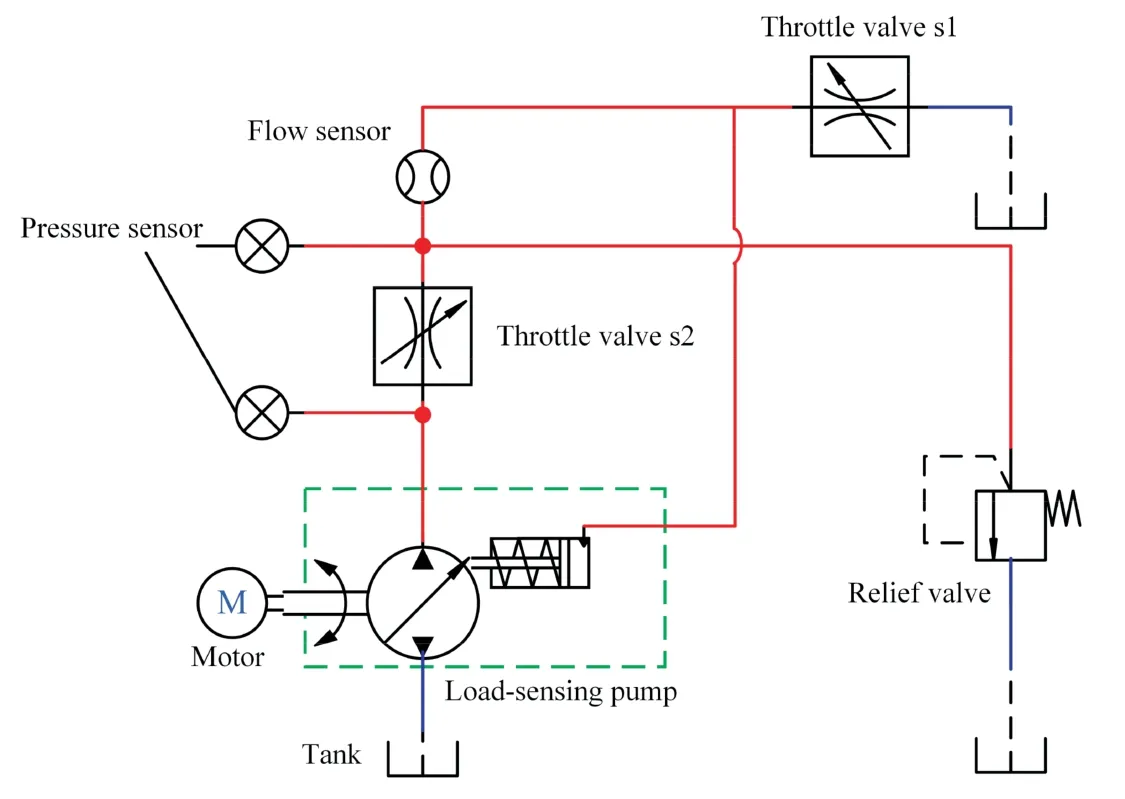
Fig.14 Experimental hydraulic schematic diagram.
In order to study the flow characteristics of load sensing pumps under differentdd,different sizes of orifices d are processed.Fig.16 shows that the PCV of the load sensing pump is removed and the orifices d of different sizes are replaced for the comparison experiment.
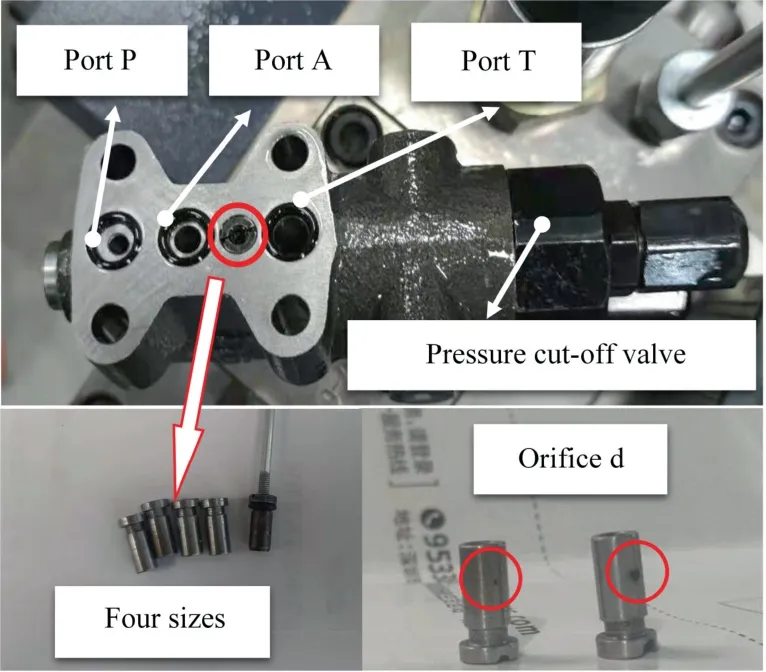
Fig.16 Photograph of installation position and four sizes of orifice d.
5.3.2.Experimental results
In this section,a series of experiments are conducted using the abovementioned experimental rig.The sine curve is selected as the initial input of the system,and the flow following characteristics of the load sensing pump are studied by changing the frequency of the sine curve.Figs.17–21 represent the comparison of the theoretical flow and experimental flow through throttle valve s2 under the frequencies of 0.02 Hz,0.05 Hz,0.1 Hz,1.0 Hz and 2.0 Hz,respectively.It should be indicated that the red solid line and the black dotted line represent the experimental flow and the theoretical flow,respectively.It is observed that at each frequency,the influence of four different sizes of orifices d on the system flow is also tested.
In order to quantitatively analyze the influence of different orifice d diameters on the flow following characteristics of load sensing pumps,two parameters are calculated to represent the amplitude deviation and phase delay of the system flow,which are represented by amplitude deviation and phase lag,as shown in blue in Figs.17–21.
Figs.17–19 show that when the signal frequency is as low as 0.02 Hz,0.05 Hz and 0.1 Hz,the flow following characteristic of the load sensing pump is reasonable.Moreover,Fig.17 shows that the flow rate increases asddincreases.These results are consistent with simulation results and the theoretical analysis.It is observed that another function of the orifice d is to reduce the fluctuation of the flow rate.This is because the orifice d improves the stability of the system flow through the leakage.
According to the experimental results,it is found that when the input signal frequency is the same,the flow phase lag under different orifice diameters is the same.However,the amplitude deviation of the flow rate increases as the diameter increases.For example,Fig.17(a) and Fig.17(d) show that when the input signal frequency is 0.02 Hz,and whendd=0.4 mm,the flow phase lag of the system is 0.96%.Moreover,whendd=1.0 mm,the phase delay of the flow is 1.02% and the difference between the two is small.However,whendd=0.4 mm anddd=1.0 mm,the flow amplitude deviations are 5.84% and 9.82%,respectively.Therefore,the difference between them is significant.
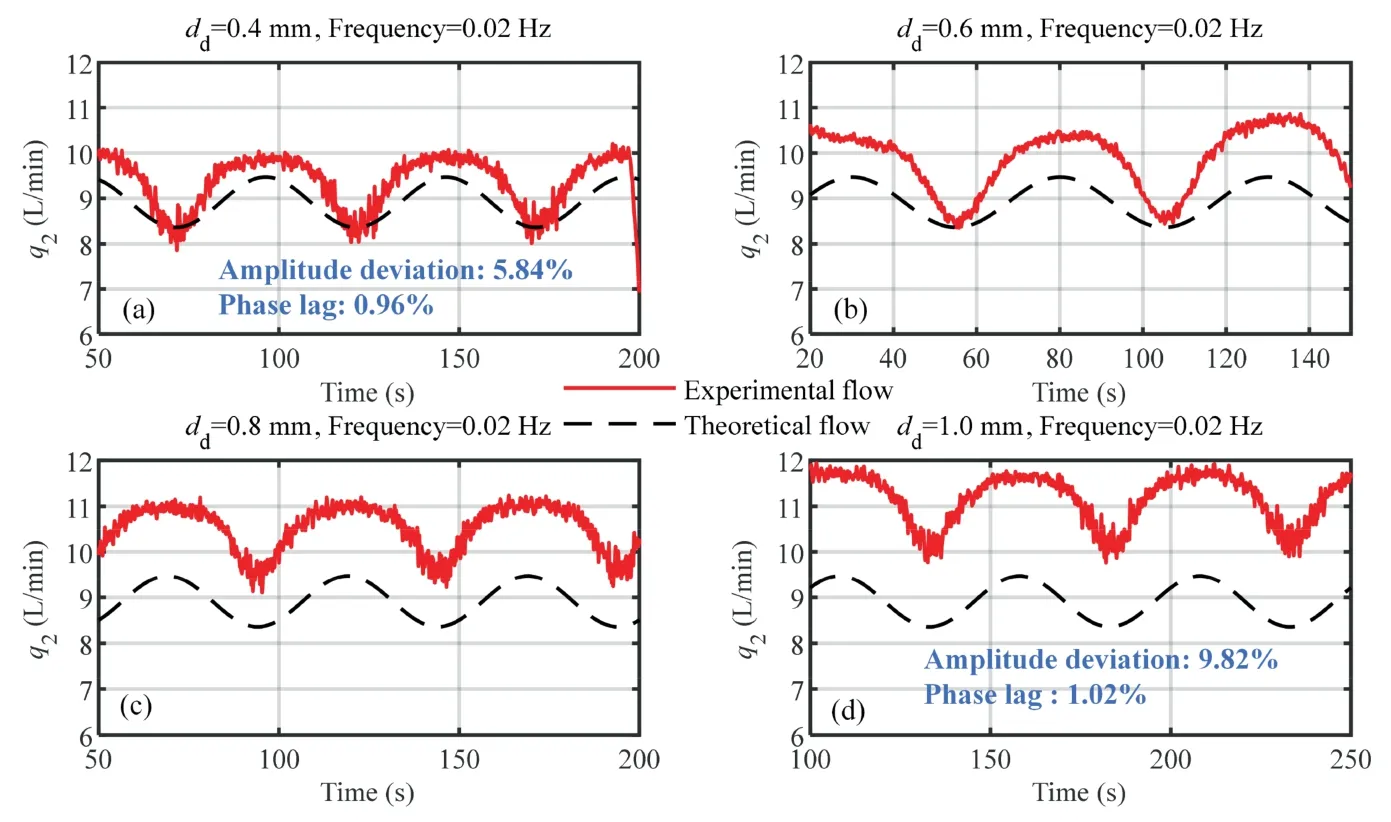
Fig.17 Experiment results under 0.02 Hz.
At the same orifice diameter,the higher the frequency of the input signal,the greater the amplitude deviation and phase lag of the output flow rate.For example,Fig.22(a)and Fig.23(a)show that fordd=0.4 mm,when the input signal frequency is 1 Hz,the amplitude deviation of the output flow rate and the Phase lag are 5.2%and 13%,respectively.When the input signal frequency is 2 Hz,the amplitude deviation of the output flow increases to 11.19%,and the Phase lag increases to 28%.
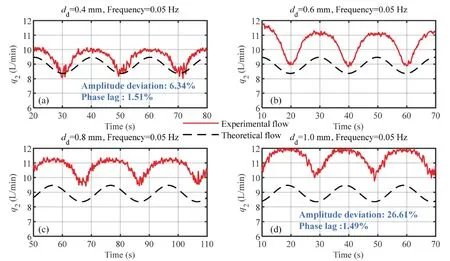
Fig.18 Experiment results under 0.05 Hz.
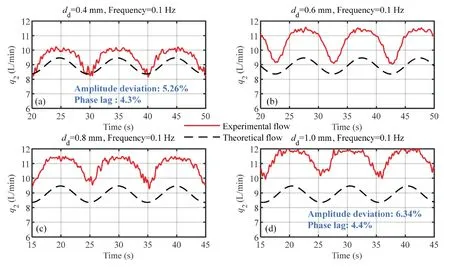
Fig.19 Experiment results under 0.1 Hz.

Fig.21 Experiment results under 2 Hz.
Fig.20 illustrates the flow characteristics of the system when the frequency of the input signal is high.It is observed that that under the condition of higher frequency,the load sensing pump has a significant phase delay following the flow.Moreover,the higher the frequency,the greater the phase delay.
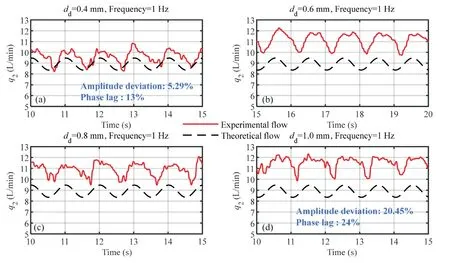
Fig.20 Experiment results under 1 Hz.
About the choice of the orifice d diameter value,it mainly depends on the frequency of the flow rate of the throttle valve s2 change.If the change frequency is low,it is recommended to select the orifice diameter of 0.4–0.6 mm,which can obtain a smaller phase delay and amplitude error.On the other hand,when the change frequency is high,it is recommended to select the orifice diameter of 0.6–0.8 mm,which will help reduce the fluctuation of the system flow.Considering the difficulty of processing and cost,the diameter of the orifice can generally be selected as 0.6 mm.
6.Conclusion
In the present study,a correct and reliable nonlinear multiparameter model of the load sensing pump is established.The proposed model can reflect the displacement adjustment process of the load sensing pump,including spool clearance,spool covering amount,internal leakage and other parameters,which is convenient to study the influence of different structural parameters on the dynamic follow-up ability of the load sensing pump.Moreover,a frequency sweep method is proposed for the frequency domain analysis of the nonlinear mathematical model of load sensing pumps.According to the frequency-domain response curves of the flow under different structural parameters,the influence trend of different structural parameters on the working characteristics of the load-sensitive pump is analyzed.A load sensing pump experiment rig is constructed to study the influence of key structural parameters(orifice d diameter)on the dynamic follow-up characteristics of the load sensing pump flow.The following conclusions are drawn from the present study:
(1) The smaller diameter of the orifice d reduces the bypass flow rate of the system and increases the amplitude following ability of the system flow rate.Moreover,the orifice d can stabilize the output flow of the system and reduce the fluctuation of the output flow of the system.
(2) The combined effect of structural parameters has an important influence on the flow rate characteristics of the load sensing pump.
(3) When the change frequency of the load required flow is low,the output flow of the load sensing pump can match the flow rate of the throttle valve s2 reasonably.
In future studies,coupling analysis and optimization of more parameters are recommended to be performed.Therefore,the influence of structural parameters on the overall operating characteristics of load sensing pumps can be better studied.Moreover,more structural variables for comparative experiments should be considered in future studies.
Declaration of Competing Interest
The authors declare that they have no known competing financial interests or personal relationships that could have appeared to influence the work reported in this paper.
Acknowledgements
This work was funded by the National Key R&D Program of China under Grant (No.2021YFB2011300),and Science and Technology on Aircraft Control Laboratory,Innovation Foundation of CAST (No.CAST-2021-02-02),and Open Foundation of the State Key Laboratory of Fluid Power and Mechatronic Systems (No.GZKF-202010).
 CHINESE JOURNAL OF AERONAUTICS2022年12期
- CHINESE JOURNAL OF AERONAUTICS的其它文章
- Effect of variable-angle trajectory structure on mechanical performance of CF/PEEK laminates made by robotic fiber placement
- An efficient hyper-elastic model for the preforming simulation of Carbon-Kevlar hybrid woven reinforcement
- Tribological performance of hydrogenated diamond-like carbon coating deposited on superelastic 60NiTi alloy for aviation selflubricating spherical plain bearings
- A modified forward and backward reaching inverse kinematics based incremental control for space manipulators
- A novel strategy for fine-grained semantic verification of civil aviation radiotelephony read-backs
- Dynamic neighborhood genetic learning particle swarm optimization for high-power-density electric propulsion motor
