Experimental investigation of expansion effect on shock wave boundary layer interaction near a compression ramp
Junjie HUO,Shihe YI,Wenpeng ZHENG,Haibo NIU,Xiaoge LU,Dundian GANG
College of Aerospace Science and Engineering,National University of Defense Technology,Changsha 410073,China
KEYWORDS Boundary layers;Flow visualization;Fluid dynamic;Pressure measurement;Shock waves;Supersonic aerodynamics;Velocity measurement
Abstract The experiment is conducted to investigate the effect of expansion on the shock wave boundary layer interaction near a compression ramp.The small-angle expansion with an angle degree of 5° occurs at different positions in front of the compression ramp.The particle image velocimetry and flow visualization technology show the flow structures,velocity field,and velocity fluctuation near the compression ramp.The mean pressure distribution,pressure fluctuation,and power spectral density are measured by high-frequency response pressure transducers.The experimental results indicate that the expansion before the compression ramp position affects the shock wave boundary layer interaction to induce a large-scale separation.But the velocity fluctuation and pressure fluctuation are attenuated near the large-scale flow separation region.When the expansion occurs closer to the compression ramp,the expansion has a more significant impact on the flow.The fluctuation of velocity and pressure is significantly attenuated,and the wall pressure rise of the separation point is reduced obviously.And the characteristic low-frequency spectrum signal related to the unsteadiness of the shock wave boundary layer interaction is significantly suppressed.In addition,variation of the separation region scale at different compression angle degrees is distinctive with the effect of expansion.
1.Introduction
Shock Wave Boundary Layer Interaction (SWBLI) is a classical problem in supersonic and hypersonic aerodynamics.The SWBLI exists on the rudder,engine inlet,and other positions of the high-speed aircraft.1The surface pressure,friction,heat flux,and other physical quantities change significantly in the process of SWBLI.If the shock wave intensity is large enough,large-scale flow separation is induced by SWBLI,which changes the velocity field and flow structure characteristics.And the SWBLI has a great adverse effect on the performance of high-speed aircraft.2,3Typical two-dimensional models for the study of SWBLI include incident oblique shock reflection,compression ramp induced shock wave,and normal shock wave.And threedimensional models include swept compression ramp,single fin,double fin,blunt fin,and swept blunt fin.4A large number of experiments and computations have been carried out for the study of SWBLI.5,6In addition,studies have found that when large-scale separation occurs in the process of SWBLI,unsteadiness of the separated flow is induced,and low-frequency fluctuation signals appear at specific positions.7Unsteadiness of the flow is one of the most concerned physical phenomena in the study of SWBLI.
The expansion angle exists in the internal and external flow at many positions of the aircraft.The expansion has a significant influence on the boundary layer due to the favorable pressure gradient and volume expansion.Arnette8and Humble9et al.studied the effect of expansion by flow visualization technology.And Goldfeld10has measured the velocity profile of the boundary layer with the effect of expansion.The experiments indicated that the thickness of the boundary layer increases obviously when the flow passes over an expansion corner.And the flow turbulence intensity decreases obviously with the disappearance of small-scale turbulent structures.In addition,the phenomenon of re-laminarization is observed,showing the double-layer structure of the boundary layer near the expansion corner.Chung and Lu11has measured the wall pressure with the effect of expansion,which shows that the mean value and fluctuation of the pressure decrease downstream of the expansion corner.The computation of the boundary layer near the expansion corner has been conducted by Sun12using direct numerical simulation,and large eddy simulation by Teamoto et al.13And the similar phenomenon of re-laminarization is observed in the computation.The SWBLI is closely related to the flow conditions of the coming boundary layer,such as the thickness of the boundary layer,turbulence intensity,and scale of the structure.Therefore,with the effect of expansion,SWBLI shows many distinctive characteristics compared with that without expansion.Due to the widespread existence in the flow near the hypersonic inlet,the previous researches focus on the interaction between the incident shock wave and boundary layer with the effect of expansion.14The experimental result of Chung15shows that when the expansion occurs after the incident position of the shock wave,the peak value and fluctuation of wall pressure are reduced.And the decrease is more obvious if the expansion angle degree is larger.Zhang16showed that when the expansion occurs at the incident position of the shock wave,the size of the separation area decreases obviously.And when the expansion occurs in front of the incident position,large-scale separation is induced by the expansion.Recently,Tong17investigated the expansion effect on SWBLI with direct numerical simulation.The results have indicated that when the expansion occurs near the incident point,the dimension along the flow direction and the normal dimension of the separation region are reduced obviously.And the scale of separation is decreased dramatically when the expansion angle degree increases.The results also show that different positions of expansion have distinctive effects on SWBLI.18In addition,Tong19and other researchers also found that the lowfrequency fluctuation of SWBLI was suppressed significantly with the effect of expansion.
The SWBLI near the compression ramp has some similarity to the incident shock wave,from the view of the response of the boundary layer to a strong negative pressure gradient.But it still has many unique flow characteristics due to the difference in the boundary conditions.At present,there are few studies on the SWBLI near the compression ramp with the effect of expansion.The researches focus on the SWBLI near the compression ramp combined with expansion corner at equal angle degree.20The velocity profile,streamline distribution and Mach number in the process of SWBLI with the effect of strong expansion are obtained in those researches.5With direct numerical simulation,Fang et al.21found the doublelayer structure of the boundary layer near the compression ramp combined with the expansion corner,as well as the variation of boundary layer thickness and turbulence intensity.There are few studies on the effect of small-angle degree expansion on the SWBLI near the compression ramp.However,the small expansion angle often exists in front of the control rudder of real high-speed aircraft,due to the practical demands of design.And the expansion would affect the SWBLI near the ramp.It is similar to the effect of small-angle degree expansion on the SWBLI near the incident shock wave.With the effect of small-angle degree expansion,the influence of free stream streamline bending and Mach number changing is not significant.Small-angle degree expansion mainly affects the SWBLI by changing the flow state of the boundary layer near the wall.With the effect of expansion,the size of flow separation region,mean value and fluctuation of pressure,and unsteadiness in the process of SWBLI show distinctive characteristics.And if the expansion occurs at different positions in front of the compression ramp,the effect of the expansion is distinctive.
In this paper,the effect of expansion in the process of SWBLI near compression ramp is studied by experimental investigation.The flow process is shown in Fig.1.The results of the velocity field are obtained by particle image velocimetry technology.High-resolution flow visualization results are obtained by nanoparticle-tracer-based planar laser scattering.And the variation of the size of the separation region and the velocity fluctuation near the compression ramp are investigated when the expansion occurs at different positions with the results.Through the high-frequency response pressure measurement technology,the effect of expansion at different positions on the mean value and fluctuation of pressure is obtained.In addition,the effect of the expansion on the unsteadiness in the process of SWBLI is investigated with the studies of velocity and pressure fluctuation.
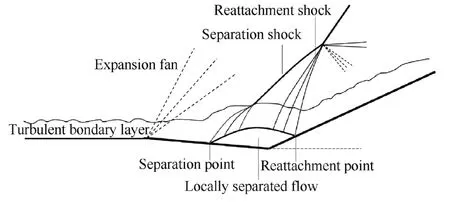
Fig.1 Schematic diagram of the process of SWBLI with effect of expansion.
2.Experimental equipment,models,and measurement technology
2.1.Wind tunnel
The wind tunnel used in the experiment is a vacuum-indraft supersonic wind tunnel of the Aerodynamics Laboratory located at the National University of Defense Technology.A schematic diagram of the wind tunnel structure is shown in Fig.2.It mainly includes a mixing chamber,setting chamber,nozzle,test chamber,and vacuum tank.The size of the test chamber is 100 mm wide and 120 mm high.The experiment was carried out in the incoming free stream with a Mach numberMa=3.4,stagnation pressurep0=1 MPa,and stagnation temperatureT0=300 K.

Fig.2 Schematic diagram of supersonic wind tunnel structure.
2.2.Model and test cases
The model is installed in the test chamber of the wind tunnel,and the schematic diagram is shown in Fig.3.During the experiment,the distance from the model to the upper and lower walls of the wind tunnel needs to be adjusted reasonably to ensure the normal start of the wind tunnel.A rough strip with a length of 50 mm is placed 10 mm away from the front edge of the model to make the incoming flow develop into a turbulent state.
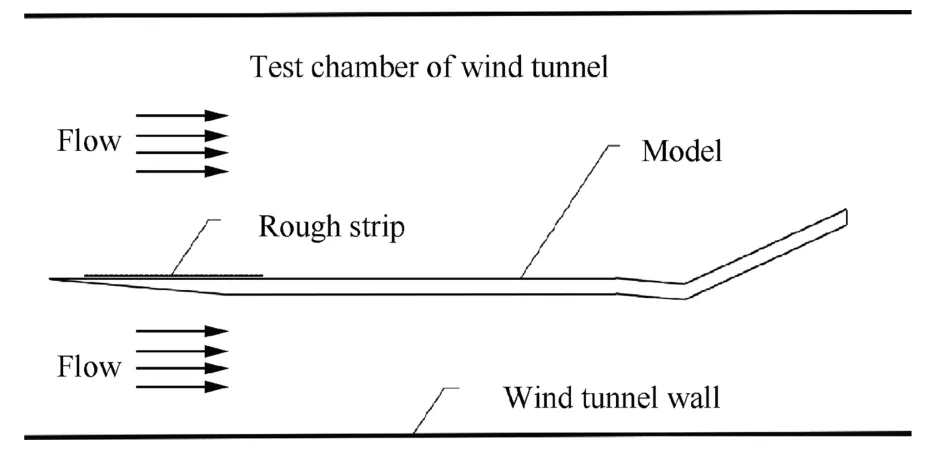
Fig.3 Schematic diagram of experimental model installation.
To study the expansion effect on the SWBLI near a compression ramp when the expansion angle occurs in different locations,three experimental cases are set up.For each case,the compression degree α=25°,and the expansion degree θ=5°.L0is the dimension of the horizontal section of the model,andL1is the dimension of the expansion section along the flow direction.With differentL0andL1in each case,the location where the expansion occurs in Case 1 is farther from the compression ramp,and in Case 2 is closer.Case 3 is an experimental case without an expansion effect.The model parameters for each case and coordinate system are illustrated in Fig.4.
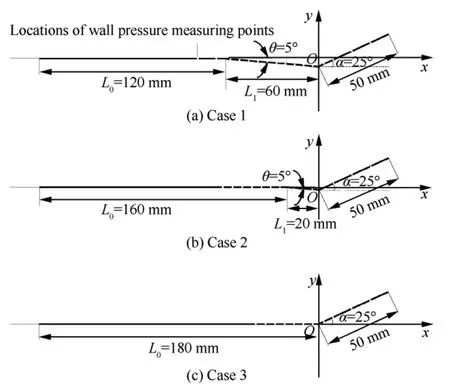
Fig.4 Experiment parameters and coordinate system.
2.3.Measurement technology
2.3.1.PIV and nanoparticle-tracer-based planar laser scattering
The Particle Image Velocimetry (PIV) system consists of a laser light source,synchronizer,double exposure camera,data acquisition and processing system,and particle generator,as shown in Fig.5.Through the PIV system,the flow velocity field information such as velocity distribution cloud diagram,streamline,velocity profile,and velocity fluctuation distribution can be measured.22Nanoparticle-tracer-based Planar Laser Scattering (NPLS) technology is a high-resolution flow visualization technology.The composition of the NPLS system is the same as that of the PIV system,but the particle size of the tracer used in the NPLS system is smaller.The NPLS system has been successfully applied to supersonic mixed layer flow,supersonic and hypersonic boundary layer flow,23and SWBLI.24,25And high-resolution imaging of the flow structure has been achieved in the previous research.
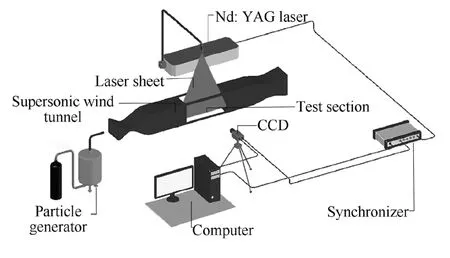
Fig.5 Composition of PIV and NPLS system.
2.3.2.High-frequency response pressure measurement
By arranging high-frequency response pressure sensors at specific locations of the model,the fluctuating wall pressure can be measured,and the statistical information of the pressure signal such as mean pressure coefficient and variance,and frequency information such as the power spectral density can be obtained.The natural frequency of the high-frequency response pressure sensor used in the experiment is greater than300 kHz,and the sampling frequency of the dynamic signal test and analysis system is256 kHz,which can achieve effective measurement of the pressure fluctuation signals with a frequency lower than100 kHz.26,27
3.Experimental results and analysis
3.1.Incoming turbulent boundary layer
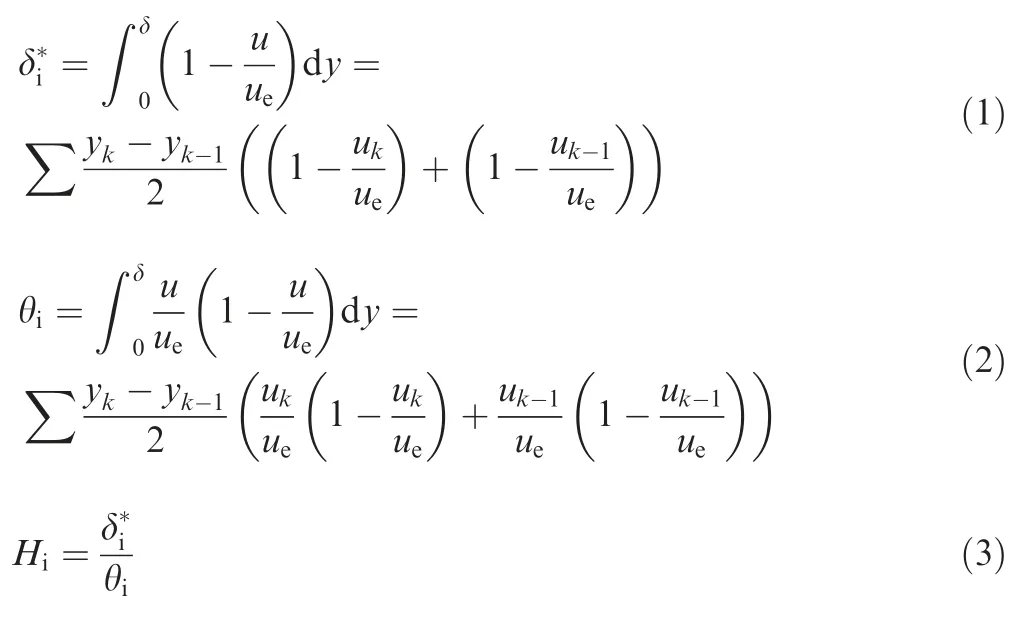
The research of Quan28and Wu29et al.indicated that the interaction of shock wave with laminar and turbulent boundary layer shows distinctive flow characteristics.And the thickness of the undisturbed boundary layer before the initial position of interaction is an important factor affecting the flow separation.Therefore,the PIV technique is used to measure the velocity field near the boundary layer of the incoming flow.And the mean velocity profile at a distance of 50 mm from the compression ramp is obtained.As shown in Fig.6,compared with the turbulent and transitional boundary layer obtained by Wu and the turbulent boundary layer obtained by Ringuette et al.,30the mean velocity profile obtained in this experiment is fuller than Ringette’s results.And it is similar to the fully developed turbulent mean velocity profile obtained by Wu.But in Wu’s experiment,the distance of boundary layer development is longer,so the boundary layer is thicker.The nominal thickness of the boundary layer is δ0.99=5.25 mm at this position which is obtained from the velocity profile measurement.And the reference value δ0=δ0.99is used to make other parameters dimensionless.The incompressible displacement thickness,incompressible momentum thickness,and incompressible shape factor of the boundary layer can be calculated by Eqs.(1),(2),(3) and the composite trapezoid formula.The calculated value of these parameters are incompressible displacement thickness=0.627 mm,incompressible momentum thickness θi=0.445 mm,and incompressible shape factorHi=1.41.The value ofHialso indicates that the incoming boundary layer is an undisturbed fully developed turbulent boundary layer.In addition,the flow visualization result obtained by NPLS technology (Fig.7) also shows the typical flow structure of the fully developed incoming turbulent boundary layer.Thus,the problem discussed in this paper is the interaction of the turbulent boundary layer with the shock wave near the compression ramp.
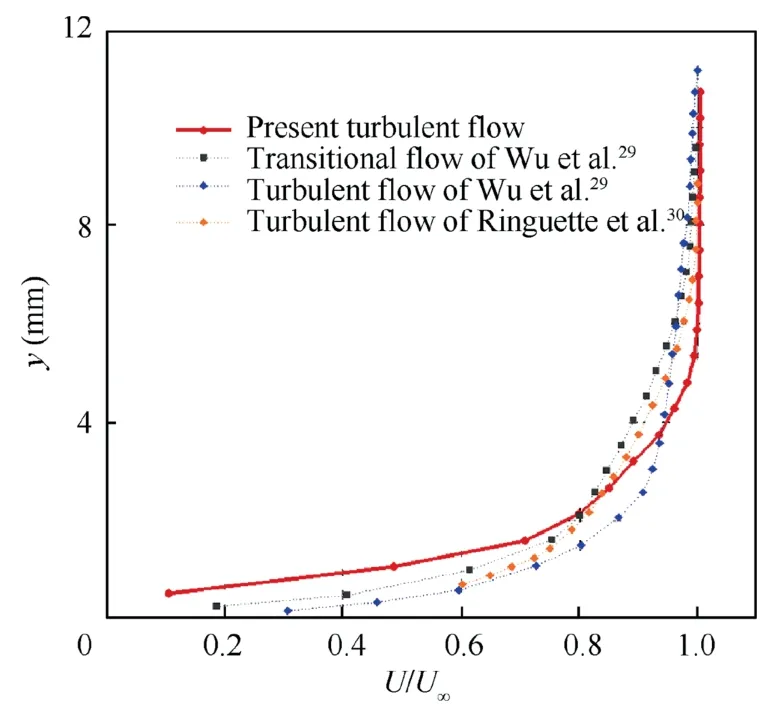
Fig.6 Velocity profile of turbulent boundary layer.
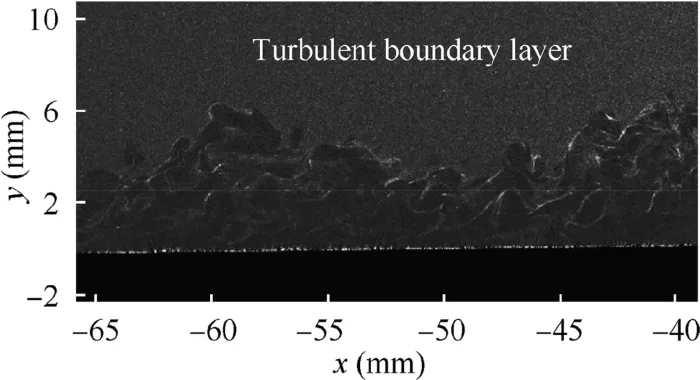
Fig.7 Flow structure of turbulent boundary layer.
3.2.Flow structure of SWBLI near a compression ramp with effect of expansion
Obtained by NPLS flow visualization technology,the highresolution imaging of the flow structure is shown in Fig.8.The dimensionless range in horizontal and vertical directions of the flow visualization results is demonstrated by the coordinates in Fig.8.The typical flow structure without the effect of expansion is shown in Fig.8(c).In Case 3,there is no obvious locally separated flow region,but the shock wave deflects at a distance from the boundary layer,and the extension line of the front edge of the shock wave is not near the foot of the ramp.In this case,small-scale flow separation occurs near the compression ramp.If the expansion occurs in the incoming flow(Case 1 and Case 2),a typical large-scale flow separation phenomenon will occur near the compression ramp.A locally separated flow region is generated near the ramp,a separation shock wave is generated at the leading edge of the separation region,and a reattachment shock wave is generated near the reattachment point.When the expansion occurs at a distance of 60 mm from the compression ramp (Case 1),the size of the separation region is larger.When the expansion occurs near the compression corner (Case 2),as shown in Fig.8 (b),the separation point is near the expansion position,and the size of the separation region is smaller than that in Fig.8 (a).
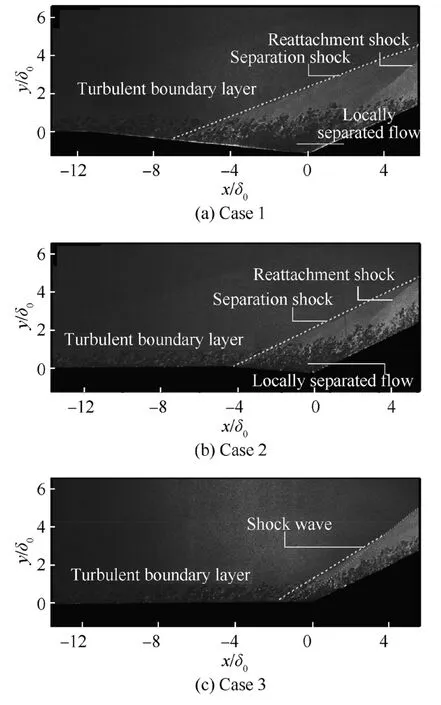
Fig.8 Flow visualization results of typical flow structure in each case.
The high-resolution imaging of the typical flow structure obtained by NPLS technology can show the characteristics clearly,while the measurement of flow velocity by PIV technology can show the characteristics of flow structure quantitatively.
The time-averaged velocity distribution contour and streamline can be obtained by PIV technology as shown in Fig.9.If large-scale flow separation occurs near the compression ramp,there are distinct recirculation streamlines near the separation region.The dimensionless velocityU/U∞is reduced to 0 in the separated region and a negative velocity value appears.There is no recirculation streamline near the ramp without the effect of expansion (Case 3).But negativeU/U∞value within a certain range near the ramp indicates the emergence of small-scale separation.The time-averaged velocity field obtained from previous studies(Fig.10,Case 0)indicates large-scale separation occurring when the compression degree α=26°without the effect of expansion.Considering the normal size of the low-speed region and the flow structure obtained by NPLS technology,it can be indicated that the small-scale flow separation occurs when the compression degree α=25°.And α=25°is the critical degree of largescale separation occurring.As shown in Fig.9,the dimension of the separation region along the flow directionLSis the horizontal distance from the separation point to the ramp foot.And the normal dimension of separation regionLHis the vertical distance from the ramp foot to the outer edge of the separation region.The dimensionless dimensions of the separation region indicated by the time-averaged velocity field in each case are shown in Table 1.And the dimensionless coordinates of the expansion occurring positions in Case 1 and Case 2 arex/δ0=11.4 andx/δ0=3.8.With the effect of expansion,the dimension of separation region along the flow directionLSand normal dimensionLHwill increase obviously.Large-scale flow separation occurs near the ramp,and the recirculation region appears obviously.If the expansion occurs near the compression ramp (Case 2),the separation point of large-scale separation is behind the expansion position,and the dimension along the flow direction approaches the length of expansion sectionL1.And if the expansion occurs far from the ramp,the dimensions of the separation regionLSandLHare larger.
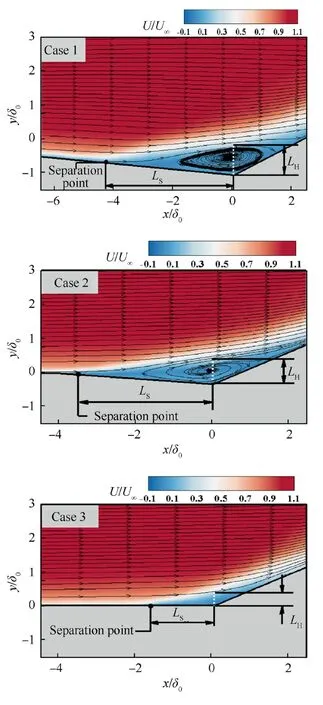
Fig.9 Time-averaged velocity distribution contour and streamline obtained by PIV technology.
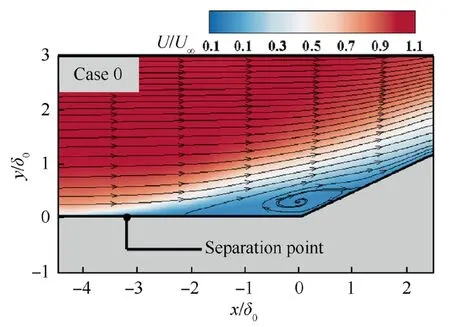
Fig.10 Time-averaged velocity field with typical large-scale separation obtained from previous studies.

Table 1 Dimensions of separation region in each case.
The results of the time-averaged velocity field have shown the flow structure characteristics of the separated flow quantitatively near the compression ramp.And the statistics of velocity field results at different time can show the unsteadiness of the flow.The dimensionless Root Mean Square Error(RMSE)of the velocity in y-directionvRMSE/U∞can be calculated by.

And the distribution contour of dimensionless RMSE is shown in Fig.11.Without the effect of expansion,the largescale flow separation occurs when the compression degree α=26°(Fig.12,Case 0).And in contrast to small-scale flow separation(Fig.11,Case 3),dimensionless RMSE of the velocity iny-directionvRMSE/U∞increases obviously within the region of SWBLI.Two regions with larger velocity fluctuation amplitude appear after shock wave and near the separation region,which indicates the unsteadiness of SWBLI related to large-scale flow separation.Compared with the fluctuation distribution obtained by Sun et al.31through high-speed schlieren and the analysis of the velocity field given by Dupont et al.,32it can be concluded that Region Ⅰwith largevRMSE/U∞value near shock wave is related to the low-frequency motion of separation shock wave.And Region Ⅱis associated with the unsteadiness of the separated flow and the shear layer near the region.Region III with a largevRMSE/U∞value observed downstream of the separation region is related to the reattachment shock and the variation of flow structure in the process of SWBLI.If the expansion occurs far from the compression ramp (Case 1),there is a region with a smallvRMSE/U∞value before the shock wave.And perhaps this is caused by the action of a weak expansion wave system.With the effect of the expansion,large-scale flow separation occurs near the compression ramp.But the distribution ofvRMSE/U∞is different from the typical results of large-scale separation without the effect of expansion (Case 0).In Case 1,there is no region(Region Ⅰin Case 0) with large velocity fluctuation related to the low-frequency motion of the shock wave,and the velocity fluctuation near the separation region (Region Ⅱin Case 0) is reduced.The velocity fluctuation downstream of the separation region(Region III in Case 0)is also reduced.If the expansion occurs near the compression corner (Case 2),the expansion fan will interact with the shock wave near the compression ramp directly.So,there is a more significant influence on the SWBLI in Case 2.In Case 2,despite the large-scale separation occurring near the ramp,in contrast to Case 1 and Case 0,the dimensionless RMSE of the velocity iny-directionvRMSE/U∞decreases obviously in the whole flow field.The velocity fluctuation is reduced obviously with the effect of the interaction between the expansion fan and the shock wave.The large velocity fluctuation region related to the lowfrequency shock wave motion no longer appears,which is similar to Case 1.And the velocity fluctuation associated with unsteadiness of the separated flow and the shear layer near the region is no longer present in contrast to Case 1.And the velocity fluctuation downstream of the separation region(Region III in Case 0) is attenuated more significantly in contrast to Case 1.
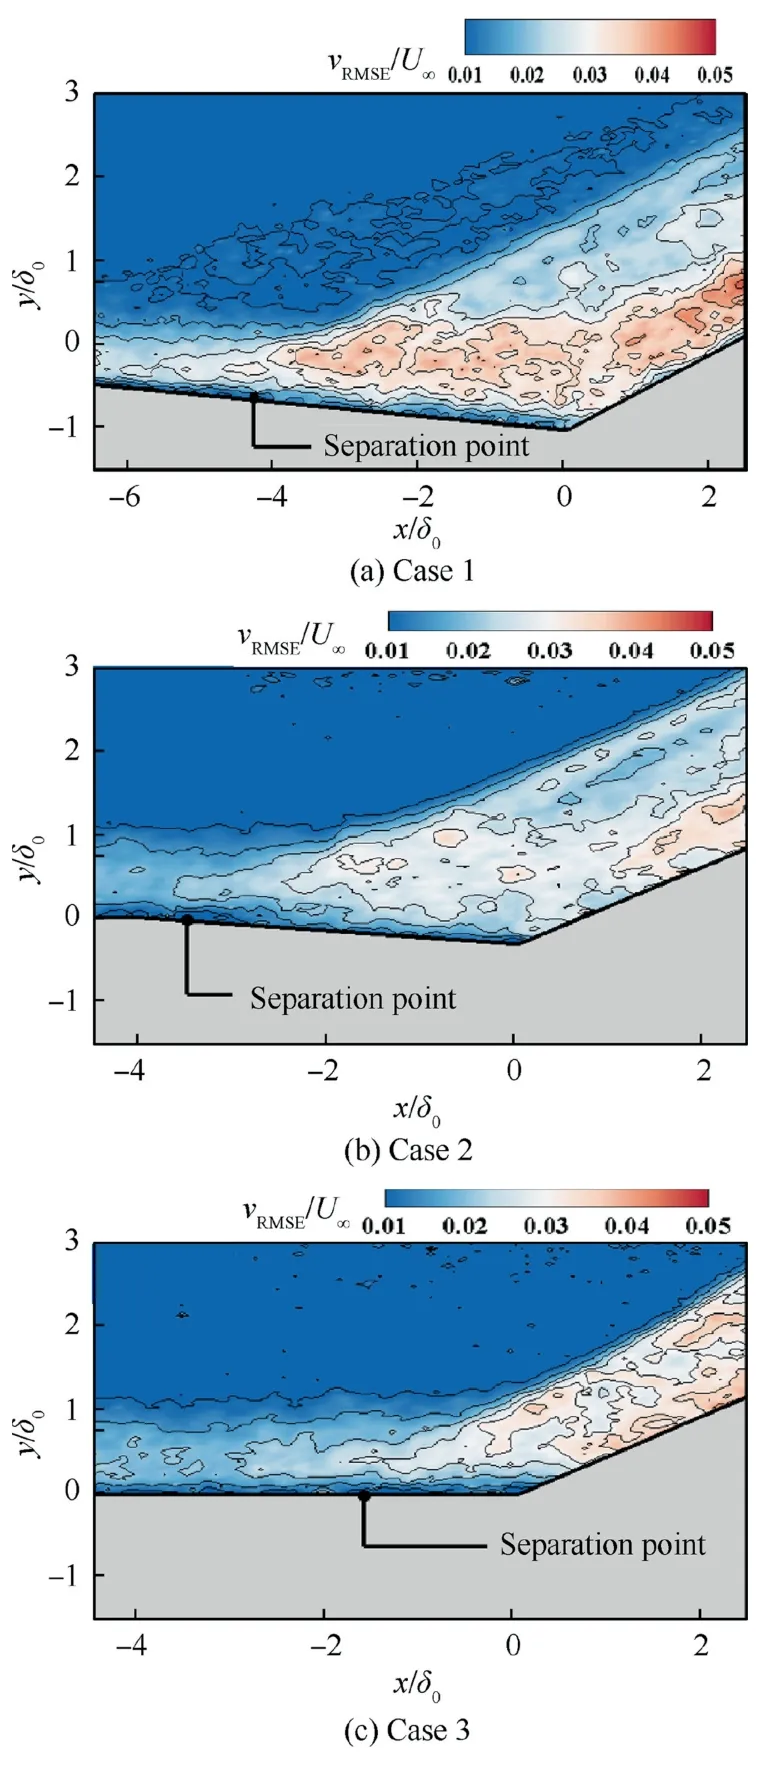
Fig.11 Distribution contour of dimensionless RMSE of velocity in y-direction obtained by PIV technology.
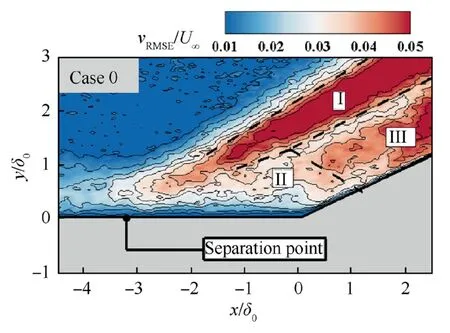
Fig.12 Dimensionless RMSE of velocity in y-direction with typical large-scale separation obtained from previous studies.
3.3.Pressure distribution and fluctuation of SWBLI with effect of expansion
As a result of the decrease of static pressure,there is a favorable pressure gradient along the flow direction near the expansion position.The physical essence of the SWBLI is the interaction between the boundary layer with variable parameters and the negative pressure gradient induced by a shock wave.The flow separation in SWBLI is associated with the negative pressure gradient near the shock wave.It is generally believed that the total pressure rise in SWBLI induced by shock wave is Δp=Δps+△pr.Δpsis the pressure rise at the separation point,and Δpris the pressure rise at the reattachment point.The interference starting point is the position where the pressure begins to rise.And the wall pressure remains unchanged in the region of separated flow.According to the free interference theory of SWBLI,33the rise of pressure Δpsat the separation point and the position of the interference starting point are determined by the incoming flow state.Therefore,with the effect of expansion,the flow parameters before the position of the interference starting point change significantly.And the value of Δpsand Δprchange with the incoming flow,which causes the change of flow separation phenomenon.If the negative pressure gradient is large enough,large-scale flow separation occurs near the shock wave.And the pressure fluctuation shows a specific frequency characteristic due to the unsteadiness of SWBLI.The fluctuation wall pressure signals are measured by high-frequency response pressure sensors in the experiment.As shown in Fig.4,the sensors are located in different parts of the model in each case.There are 16 measuring points in Case 1,by contrast with 14 points in Case 2 and 11 points in Case 3.And the values ofx/δ0which are the dimensionless coordinates inx-direction of the wall pressure measuring points are shown in Table 2.
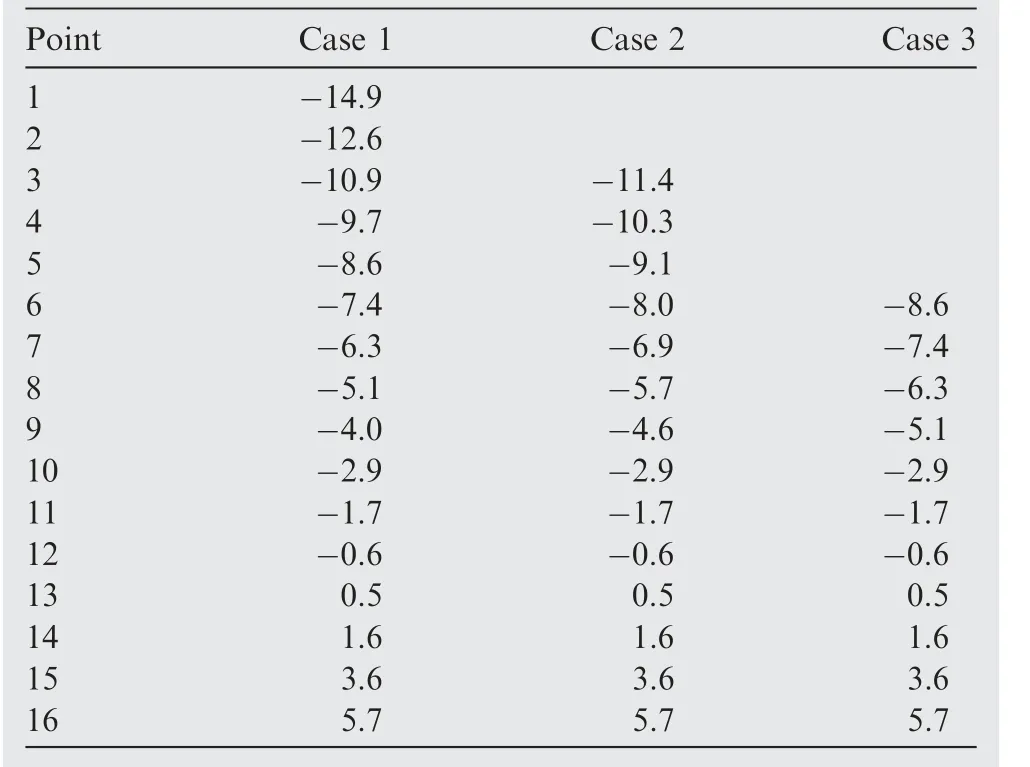
Table 2 Dimensionless coordinates of wall pressure measuring points in each case.
As shown in Fig.13,the pressure coefficientCpcurves at different locations are calculated by Eq.(5).
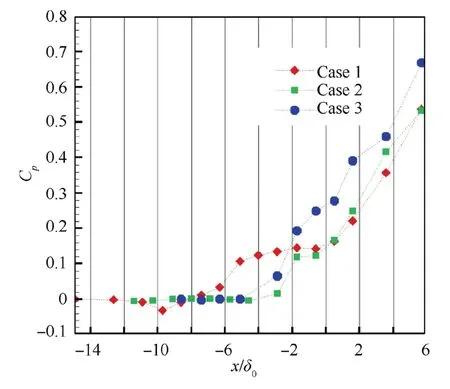
Fig.13 Curves of pressure coefficient at different locations in each case.

If there is no expansion effect (Case 3),small-scale separation occurs near the compression ramp.There is no obvious plateau on the pressure coefficient curve,but the value of the pressure coefficient varies a little near the ramp(x/δ0=-1.7 -0.5).The location of the interference starting point isx/δ0=-2.9,and the pressure rise at the separation point is ΔCps,3≈0.24.If the expansion occurs far from thecompression corner(Case 1),the pressure coefficient decreases with a value of ΔCpe≈-0.03 near the location of expansion.And behind the interference starting point,the pressure coefficient begins to rise.The interference starting point is at the location ofx/δ0=-8.6.From the location ofx/δ0=-5.1 tox/δ0=0.5 is the plateau range of the pressure coefficient,corresponding to the large-scale separation region.And the pressure rise at the separation point is ΔCps,1≈0.13,which is less than the value of ΔCps,3in Case 3.The distance between the interference starting point and the separation point isLs0,1≈24 mm=4.6δ0.When the expansion occurs near the compression corner (Case 2),due to the direct interaction of the expansion fan and shock wave near the compression ramp,the pressure coefficient does not decrease obviously near the location of expansion.The location of the interference starting point isx/δ0=-2.9.And the location range of the pressure coefficient plateau isx/δ0=-1.7 tox/δ0=0.5.The interference starting point is after expansion location,and the distance between the interference starting point and the separation point isLs0,2≈6 mm=1.1δ0.And the value ofLs0,2is smaller than that ofLs0,1in Case 1,despite the occurrence of largescale separation in Case 2.The pressure rise at separation point is ΔCps,2≈0.12,which is less than the value of ΔCps,3in Case 3,and approximates to ΔCps,1in Case 1.
The dimensionless pressure variance distribution curve at different locations obtained by Eq.(6) is shown in Fig.14.
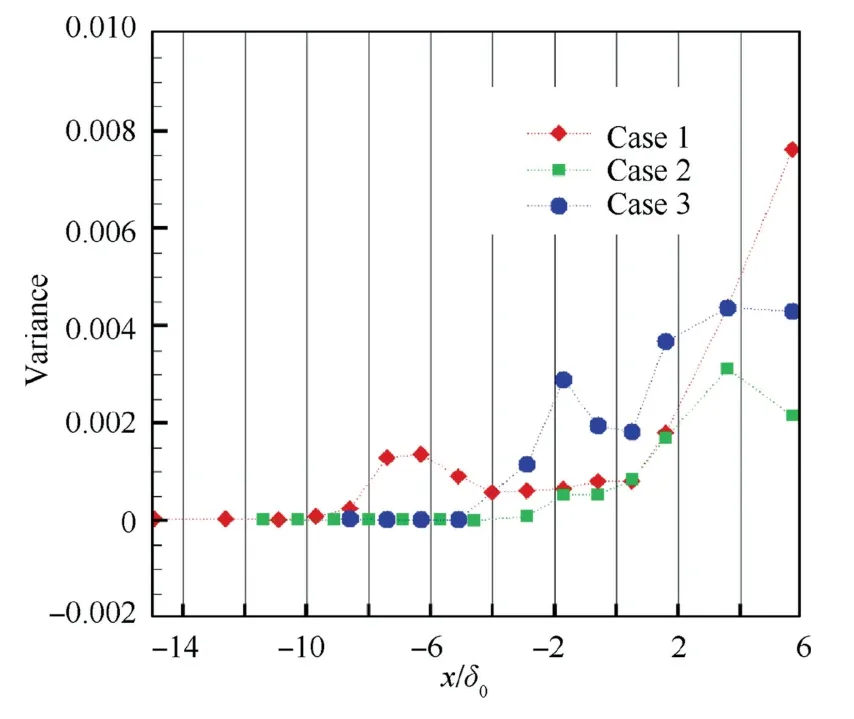
Fig.14 Curves of wall pressure variance at different locations in each case.

The variance can indicate the pressure fluctuation and the unsteadiness of SWBLI.At the locations unaffected by SWBLI,the pressure variance approximates to 0.If there is no expansion effect (Case 3) or the expansion position is far from the compression ramp (Case 1),the variance increases after the location of the interference starting point,which indicates the increase of pressure fluctuation.After the location of the separation point,the fluctuation is attenuated.And the variance of each measuring point in the separation region is approximately equal,which is greater than the variance of the incoming flow but less than the variance before the separation point.And compared to Case 1,the variance near the separation point in Case 1 is slightly smaller with the effect of expansion.If the expansion occurs near the ramp (in Case 2),there is a more significant impact on the pressure fluctuation distribution,as shown in the figure.Between the location of the interference starting point and separation point,the variance does not increase in contrast to Case 1 and Case 3.And the variance in the separation region increases to a value that is approximated to Case 1 and slightly lower than that in Case 3.The fluctuation of the wall pressure in the range between the interference starting point and separation point is associated with the unsteadiness of SWBLI.And the variation of variance indicates that the unsteady low-frequency motion of the shock wave is suppressed significantly in Case 2.
As shown in Fig.15,the kurtosis distribution curve of pressure at different locations is calculated by Eq.(7).

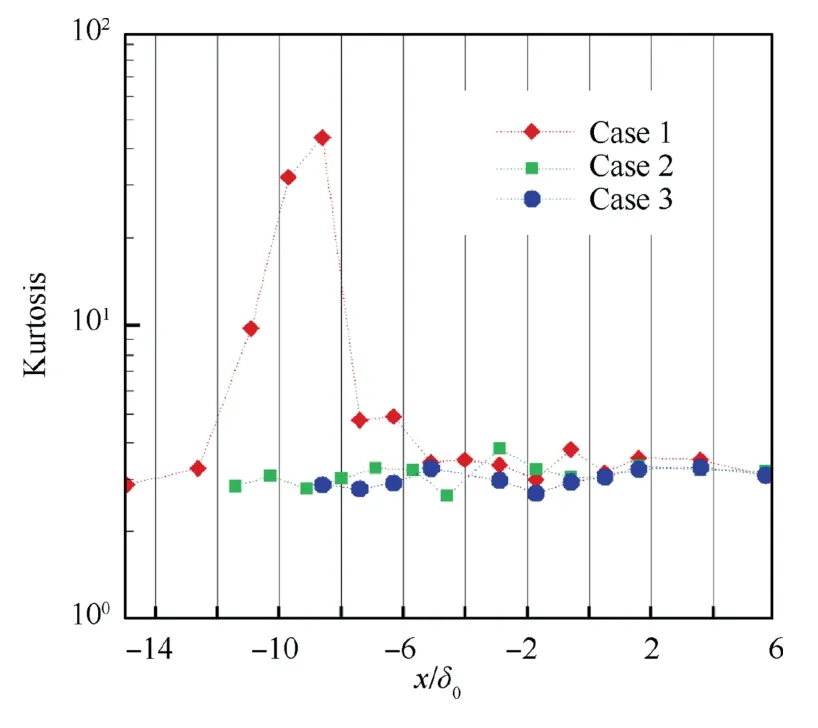
Fig.15 Curves of wall pressure kurtosis at different locations in each case.
The kurtosis is the physical quantity indicating extreme value distribution of the data.When the kurtosis value is equal to 3,the distribution of data is the standard normal distribution.According to the curves shown in the figure,the kurtosis values in the separation region are approximately equal to 3,which means that the wall pressure data at these locations conform to the standard normal distribution.In Case 1,the kurtosis value between the interference starting point and separation point is greater than 3 and approximates to 5.Compared with the standard normal distribution,the pressure data distribution is steeper near the mean value.And the kurtosis value shows that the higher value than mean pressure appears at a low frequency near these measuring points,which indicates the unsteadiness associated with the low-frequency motion of the shock wave near the separation point.The kurtosis is far greater than 3 in front of the interference starting point,which is caused by the low-frequency motion of the shock wave.When the expansion position is close to the compression ramp (Case 2),the kurtosis values approximate to 3 near the interference starting point and separation point.The pressure distribution conforms to the standard normal distribution characteristics which indicate that the unsteadiness related to the low-frequency motion of shock wave does not appear in Case 2.
Typical results of the power spectrum of pressure fluctuation at different locations in each case are shown in Fig.16.The ordinate of the power spectrum is the weighted power spectral densityf·G(f),whereG(f)is the power spectral density.And the ordinate at different locations is in the free linear coordinate.The abscissa is the frequencyf,and the logarithm coordinate is adopted.
If the expansion position is far away from the compression ramp(Case 1),the power spectrum distribution of the pressure fluctuation at different locations presents the typical characteristics of SWBLI when large-scale separation occurs.34,35At each measuring point located in the process of SWBLI,there is a high-frequency peak in the range off>10 kHz,which is associated with the characteristic frequency of the incoming turbulent boundary layer (such asx/δ0=-12.6,which is the power spectrum distribution of incoming turbulent boundary layer).At the downstream position of the ramp(x/δ0=0.5 -3.6),the frequency peak is about30 kHz,while at the upstream (x/δ0=-7.4 to-0.6),it is about40 kHz.At the locations before the separation point(x/δ0=-5.1,-6.3,-7.4),there is a second obvious peak of the power spectral density in the range off<1 kHz.This peak is the low-frequency fluctuation caused by the motion of the shock wave.And it indicates the typical unsteadiness of SWBLI in the case of large-scale separation occurring.At the locations in the separation region (x/δ0=-0.4 to 0.5),the relative amplitude of the low-frequency signal is low.And between the separation point and the interference starting point,the relative amplitude of this signal increases obviously and is larger than the characteristic high-frequency signal.The characteristic low-frequency signal also exists in a certain range before the interference starting point and after the expansion position (x/δ0=-8.6,-9.7).However,because it is not in the process of SWBLI,the high-frequency signal shows the characteristics of the turbulent boundary layer.
The characteristic frequency of the low-frequency signal in the process of SWBLI isfl≈400 Hz obtained by weighted power spectral density.The characteristic frequency is dimensionless,which is calculated by.

whereLlis the distance from the interference starting point to the compressed ramp foot,andU∞is the mainstream velocity measured by PIV.The dimensionless characteristic frequency Strouhal numberSl=0.026,which is approximate to the typical value.36
Since the occurrence of small-scale separation near the compression ramp,there is no obvious characteristic lowfrequency signal in the power spectrum as shown in Fig.16(c).But near the small-scale separation point(x/δ0=-2.9,-1.7),the amplitude of the low-frequency signal increases slightly.As shown in Fig.16 (b),if the expansion occurs near the compression corner(Case 2),the pressure fluctuation power spectrum near the separation region shows no peak value of the characteristic low-frequency signal,despite the occurrence of large-scale separation in Case 2.And it indicates that the low-frequency movement of the shock wave is significantly suppressed.With the effect of the interaction of the expansion fan with the shock wave near the compression ramp,the unsteadiness of large-scale separation flow in the process of SWBLI is attenuated significantly.
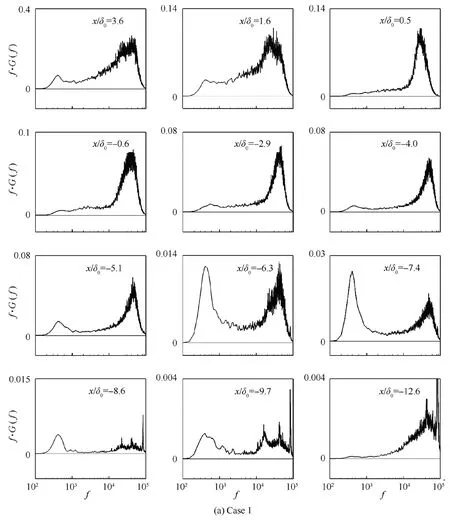
Fig.16 Power spectrum of pressure fluctuation at typical locations in each case.
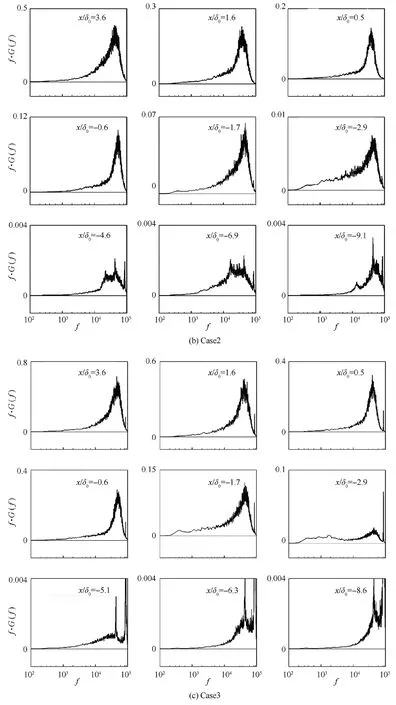
Fig.16 (continued)
In addition,the power spectrum of pressure fluctuation upstream of the interference starting position in Case 1(x/δ0=-12.6 to-8.6) and Case 2 (x/δ0=-9.1 to-4.6) is not the same as Case 3 exactly.With the effect of expansion,the characteristic frequency of the turbulent boundary layer decreases,and the frequency distribution range is wider.There are two peak frequencies with the value of 10 kHz and40 kHz.The appearance of the characteristic frequency with the value of 10 kHz is probably associated with the change of turbulent boundary layer flow structure with the effect of expansion.And this is related to the effect of expansion on SWBLI.
3.4.Flow separation of SWBLI at different compression degrees with effect of expansion
With the varying compression ramp angle degree α,the shock wave intensity changes.And the SWBLI near the compression ramp shows distinctive characteristics.It is generally believed that when the ramp angle degree α >αi,l,large-scale flow separation occurs near the ramp.And the value of αi,lis the critical degree of large-scale separation occurring.The normal dimension of separation regionLHis approximate to the thickness of the incoming boundary layer.And the size of the separation region increases rapidly with the increase ofα.When the ramp angle degree αi,l>α >αi,s,small-scale separation occurs in the inner layer of the boundary layer near the wall.The value of αi,sis the critical degree of small-scale separation occurring.The normal dimensionLHof the separation region is less than the thickness of the boundary layer.The size of the separation region increases slowly with the increase of α.And there is no flow separation if αi,s>α.37,38
As shown in Fig.17,the size of the separation region at different compression ramp angle degrees can be determined by PIV technology.The point named ‘S’ is the separation point in each case.And the relationship between the size of the separation region and the angle degree is shown in Fig.18.The experimental results show that αi,l≈25°without the effect of expansion (Case 3).When α >25°,LSincreases rapidly to 3.3δ0with the occurrence of large-scale separation.And when α <25°,as the angle degree increases from 15°to25°,the length of separationLSincreases from 0.4δ0to 1.6δ0,with the emergence of small-scale separation.And this is consistent with the general rule of the varied size of the separation region with the change of compression ramp angle degree.
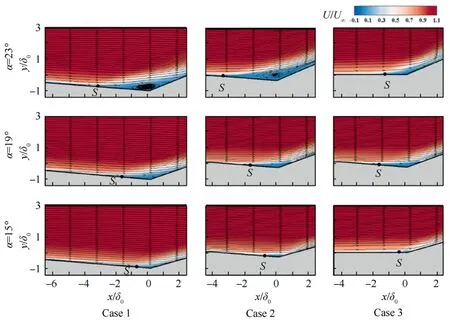
Fig.17 Time-averaged velocity field results at different compression ramp angle degrees.
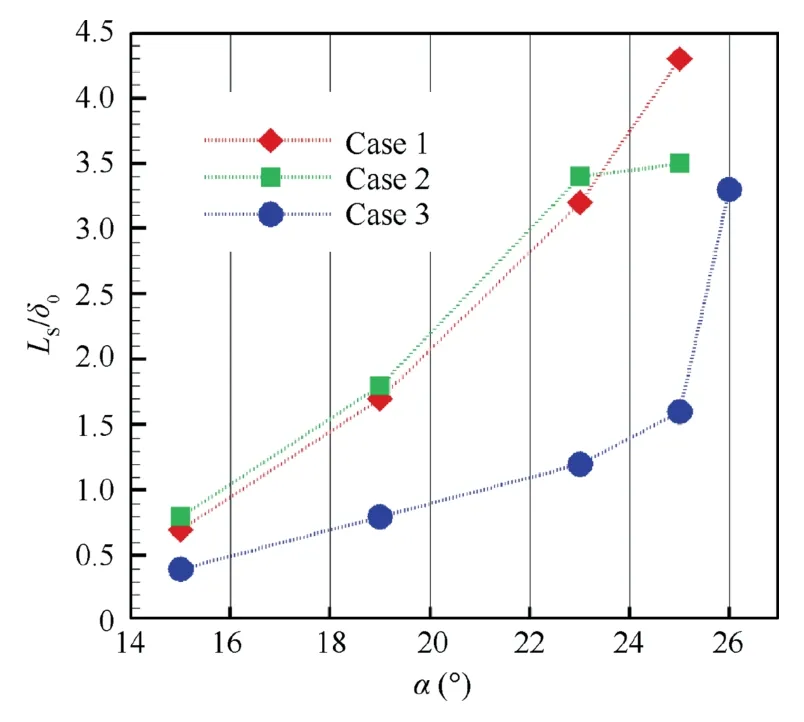
Fig.18 Curves of the size of separation region at different compression ramp angle degrees in each case.
If the expansion occurs far away from the compression corner (Case 1),the degree of αi,lis between 15°and 23°.When α=23°and 25°,large-scale separation occurs near the ramp.And when α=25°,the length of separation region isLS=4.3δ0,which is larger than that when α=23°(LS=3.2δ0).When α=15°and 19°,small-scale separation emerges near the ramp.As the angle degree increases from 15°to 19°,the length of separation regionLSincreases from 0.7δ0to 1.7δ0,and the increment ofLSis 1.0δ0.In Case 3,the increment ofLSis 0.4δ0as the angle degree increases from 15°to 19°,which is smaller than that in Case 1.
If the position of expansion is close to the compression ramp (Case 2),large-scale separation occurs when α=23°and 25°.The length of the separation region isLS=3.4δ0when α=23°,approximate to that when α=25°(LS=3.5δ0).The size of the separation region does not increase with the increase of angle degree,despite the occurrence of large-scale flow separation,which is different from Case 3.As the angle degree increases from 15°to 19°,the length of separation regionLSincreases from 0.8δ0to 1.8δ0,and the increment ofLSis 1.0δ0.And the value of the increment is equal to Case 1,which is larger than Case 3 without the effect of expansion.
4.Conclusions
In this paper,PIV technology,NPLS technology,and highfrequency response pressure measurement are adopted to investigate the effect of expansion on the flow separation region,velocity fluctuation,pressure distribution,and fluctuation in the process of SWBLI near a compression ramp.And the effect of expansion occurring at different positions is investigated.The investigations indicate,with the effect of expansion,the following:
(1) Large-scale flow separation occurs near the compression ramp.And the dimension of the separation region along the flow direction and normal dimension is larger if the expansion location is farther from the compression ramp.
(2) If large-scale separation occurs near the ramp with the effect of expansion,the velocity fluctuation after the shock wave and near the separation region is lower than that without the effect of expansion.And if the expansion occurs close to the ramp and near the position of large-scale separation point,the attenuation of velocity fluctuation is more significant,which indicates the suppression of low-frequency motion of the shock wave and unsteadiness of flow separation.
(3) The pressure rises at the separation point and pressure fluctuation is attenuated with the effect of expansion.And the attenuation is more significant if the expansion is located closer to the ramp.In addition,the distance between the interference starting point and the separation point is smaller if the expansion is located closer to the ramp.
(4) If the expansion is close to the ramp and near the position of large-scale separation point,despite the occurrence of large-scale flow separation,the characteristic low-frequency signal of pressure fluctuation caused by the unsteadiness of shock wave boundary layer interaction is attenuated significantly.
(5) The critical angle degree of large-scale separation occurring is smaller in contrast to that without the effect of expansion.And if the ramp angle degree is less than the critical angle and small-scale separation occurs,the size of the separation region varies more with the change of angle degree.if the expansion occurs close to the ramp and near the position of large-scale separation point,the size of the separation region approximates to others at different compression ramp angle degrees.
Declaration of Competing Interest
The authors declare that they have no known competing financial interests or personal relationships that could have appeared to influence the work reported in this paper.
Acknowledgements
This work was supported by the National Key Technology Research and Development Program of China (No.2019YFA0405300),and the National Natural Science Foundation of China (No.11902354).
 CHINESE JOURNAL OF AERONAUTICS2022年12期
- CHINESE JOURNAL OF AERONAUTICS的其它文章
- Control and utilization of range-dependent beampattern with waveform diverse array radars
- Airside pressure drop characteristics of three analogous serpentine tube heat exchangers considering heat transfer for aero-engine cooling
- Numerical analysis of deflection control of a gas plasma jet based on magnetohydrodynamic staggered electrode configuration
- Neural network-based model predictive control with fuzzy-SQP optimization for direct thrust control of turbofan engine
- Method for utilizing PIV to investigate high curvature and acceleration boundary layer flows around the compressor blade leading edge
- Experimental study on dynamic behavior of mechanically pumped two-phase loop with a novel accumulator in simulated space environment
