Lean blowout characteristics of spray flame in a multi-swirl staged combustor under different fuel decreasing rates
Qianpeng ZHAO ,Jinhu YANG ,Cunxi LIU ,Fuqiang LIU ,Shaolin WANG ,Yong MU,* ,Gang XU,Junqiang ZHU
a Laboratory of Light-Duty Gas-Turbine,Institute of Engineering Thermophysics,Chinese Academy of Sciences,Beijing 100190,China
b University of Chinese Academy of Sciences,Beijing 100049,China
c Innovation Academy for Light-duty Gas Turbine,Beijing 100190,China
KEYWORDS Blowout;Combustors;Flame dynamics;High-speed imaging;POD
Abstract Lean Blow Out (LBO)poses a significant safety hazard when occurring in aero-engines.Understanding the lower stability limits of gas turbine combustors and the characteristics of spray flame close to LBO are imperative for safe operation.The objective of this work is to evaluate the effects of fuel decreasing rates and pressure drops of the injector on LBO performances in a multiswirl staged combustor equipped with an airblast injector.A set of hardware and control system was developed to realize a user-defined fuel supply law.High-speed imaging was applied to record complete LBO processes under the conditions of linear fuel reduction and stable airflow.Partical Image Velocimetry (PIV) and Planar Mie (PMie) scattering were used to acquire the flow fields and spray fields under non-reacting conditions.Experimental results have shown that LBO limits extend to leaner conditions as the pressure drop of the injector increases.With an increase of the fuel decreasing rate,the exhaust temperature before flame extinction increases,and the LBO Fuel-to-Air-Ratio (FAR) decreases.The time evolution of the integral CH* intensity conforms to a linear function during the LBO process.Proper Orthogonal Decomposition (POD) was used to analyze the dynamic characteristics of lean-burn flames.Under different fuel decreasing rates and pressure drops of the injector,flames close to LBO present similar modal spatial distributions,alternately appearing axial,radial,high-order axial,and high-order radial oscillations.
1.Introduction
Having a good LBO performance is the premise for stable operation of a combustor.Currently,due to increasingly stringent emission requirements for aero-engines,advanced combustor designs prefer lean combustion concepts,in which the centrally staged technology is widely employed for its capability in effectively reducing NOxemissions,such as Twin Annular Premixing Swirler (TAPS)1and lean-burn2combustor.Centrally staged combustion is characterized by coaxial multi-swirlers and staged fuel supply (pilot and main fuel).However,due to the large proportion of air entering a combustor through the injector,combustion is usually in quite lean conditions compared with those of conventional combustors,3which makes it difficult to stabilize the flame under low operating conditions,and further leads to deterioration of LBO performances.
LBO is a transitional process along with dynamic combustion.Many studies have focused on the LBO performances of combustors and dynamic characteristics of lean-burn flames,as well as LBO prediction methods.Sto¨hr et al.4studied the LBO characteristics of a partially premixed swirl flame with the methods of simultaneous stereo-PIV and OH-Planer Laser Induced Fluorescence (PLIF).It was reported that near LBO there were two main reaction regions including the helical zone along the Processing Vortex Core (PVC) and the flame root around the lower stagnation point.The flame was unstable,featuring frequent extinction and reignition.Esclapez et al.5evaluated the effects of fuel properties on LBO characteristics in an Rich burn-Quick quench-Lean burn (RQL)-designed combustor through experiments and Large Eddy Simulation(LES) simulations.It was found that the flame at the nearblow-out condition consisted of diffusion combustion around dense droplets and the premixed flame sustained by the recirculation of hot gas.The LBO limits of different types of fuel were sensitive to the Sauter Mean Diameter (SMD).Bhattacharya et al.6established a Fast Fourier Transform (FFT)-based method to detect and classify whether a combustion was in an LBO state or a stable operation.This method was also able to predict blowoff and thermoacoustic instability.Chang et al.7experimentally studied the bluff-body stabilized flame at the condition of a low Reynolds number and proposed an index for detection of blowout.It was observed that an increase in the airflow could cause flame lift-offreattachment events,and a further increase of the airflow could lead to a complete liftoff and even blowout.Zubrilin et al.8researched the influence of the fuel distribution ratio between pilot and main circuits on LBO limits.A numerical simulation method combining Reynolds-Averaged Navier-Stokes (RANS) and LES was used to give predicted values of LBO limits.Wang et al.9–10developed an LBO prediction method based on meshed Damko¨hler (Da),which could capture LBO characteristics under different inlet conditions.Recently,POD methods were used to analyze spatial CH* or OH* chemiluminescence images under different combustion states.11–13Modal spatial and energy distributions were able to identify the flame dynamics including the oscillation direction and combustion patterns under near-lean blowout conditions or unstable combustion states.However,due to the complexity of the swirling and spray processes as well as the imperfection of the multi-component turbulent combustion model,the above-mentioned numerical and experimental studies were mostly based on gaseous fuels and concise geometric configurations,4,6–8,11–14which was quite different from a practical multi-swirl staged combustor.
In engineering applications,the LBO performances of realistic combustors are greatly affected by swirl structures and operating conditions.For a staged combustor,Liu et al.15experimentally studied the ignition and LBO performances in a multi-sector combustor,and it was found that the centrally staged design extended the LBO limits to leaner conditions.Based on high-speed imaging and CFD methods,Kobayashi et al.16clarified the relationship between the burner geometry and ignition/LBO characteristics in a typical multi-staged lean injector.Analogously,Lazik et al.17–18reported the effects of basic fuel injector parameter variations on LBO and other combustion performances for low NOxcombustors.Structure optimization was helpful to improve the LBO performances.Mongia et al.19reported a series of cases of high temperature rise combustors,in which the design requirements of LBO limits were realized by improving the structures of swirlers and nozzles.For different inlet airflow conditions,Colborn et al.20carried out LBO experiments for fuel with varying chemical and physical properties.It was found that at relatively low pressure drops of a combustor,the LBO performance correlated with physical properties,while at higher pressure drops,the LBO performance became sensitive to chemical properties.
From the literature review,it can be found that current studies focus on identifying the precursors of blowout events based on combustion phenomena,as well as the effects of geometric configurations and operating conditions on LBO performances.However,research findings still cannot meet the requirements due to the large number of influencing factors in LBO processes of staged combustors.In particular,there have been few reports focusing on the study of transitional combustion characteristics during the process of fuel reduction to flame extinction in a staged combustor.Therefore,in the present work,a realistic multi-swirl staged combustor was used to carry out LBO experiments,which were conducted under different fuel decreasing rates and pressure drops of the injector aiming to acquire the transitional characteristics of leanburn flames and capture the precursors of impending LBO under different operating conditions.
2.Experimental set-up and diagnostics
2.1.Experimental apparatus
The experimental apparatus employed in this study was designed by Institute of Engineering Thermophysics21to study ignition/LBO characteristics of multi-swirled spray flame,representative of realistic gas turbines.A schematic is depicted in Fig.1,and design parameters are listed in Table 1,in which the definition of swirl number can be found in Ref.22.Along the airflow direction,the clockwise rotation is marked as ‘+’,while the counter-clockwise rotation is marked as ‘–’.The model combustor adopts a centrally staged concept,and the injector is comprised of a pilot stage and a main stage.The pilot stage contains dual counter-rotating axial swirlers and a pre-filming airblast atomizer.In a working mode,the pilot fuel forms an annular thin liquid film on the trailing edge of the atomizer.Subsequently,the film is sheared by two counterrotating streams and breaks up into a spray cone comprised of a large number of droplets.The combustion mode in the pilot stage is expected to be fuel-rich combustion aiming to form a robust flame.The main stage contains one axial swirler and one radial swirler.Plain-orifice atomizers are equidistantly arranged on the sidewall of the 4th swirler.In a working mode,the injected fuel impinges on the inner surface of the stratifier between the 3rd and 4th swirlers,and then bursts into small droplets when interacting with the counter-swirling air streams.The air split ratio in the main stage is relatively high,and the combustion mode is expected to be lean premixed combustion aiming to reduce NOxemissions.The present work focuses on the fuel-lean condition when only the pilot atomizer works.
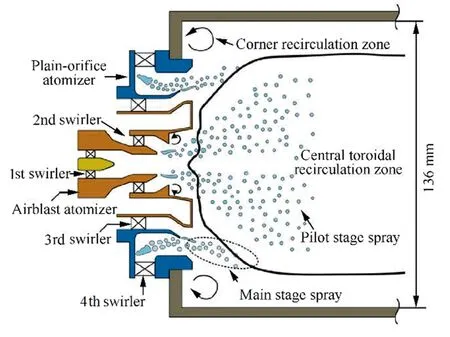
Fig.1 Schematic of a multi-swirl airblast injector.

Table 1 Design parameters of the injector.
An LBO test system is shown in Fig.2.Air was supplied by a compressor.Before entering the model combustor,the air was stabilized by a surge tank and dried by an adsorption dryer.The air mass flow ratewas measured by a Coriolis mass flow meter with an uncertainty of ±1%.The fuel used was Chinese aviation kerosene RP-3,whose physicochemical properties are similar to those of Jet A-1.Detailed fuel properties can be found in Ref.23.The fuel was pumped into the combustor by a gear pump,and the mass flow ratewas measured by a Coriolis mass flow meter with an uncertainty of ±0.1%.The inlet total pressure (P3*) and the outlet total pressure (P4*) of the model combustor were both measured by Pressure System Inc.(PSI)Model 9116 with an uncertainty of ±0.05%.The relative pressure drop (σ) of the injector is defined as (P3*–P4*)/P3*.In non-reacting measurements(PIV and PMie),the air and fuel temperatures (T3,T4,andTf)were measured by Pt100 RTD sensors with a measurement range of 223–523 K.In LBO tests,the air temperatures(T3andT4) were measured by K-type thermocouples with a measurement range of 273–1373 K.In order to reduce the error of measurement,the Coriolis mass flow meter and PSI Model 9116 were zero calibrated before formal experiments and checked by the weighing method and a pressure calibrator(DPI 610),respectively.A spark igniter was situated on the sidewall with an axial distance of 40 mm to the surface of the injector.It could generate sparks at a frequency of 3 Hz and 0.4 J per spark.An optical window was mounted on the sidewall of the model combustor,providing real-time flames for observation and image acquisition.
In order to realize a user-defined fuel supply law,an inhouse program based on the LabVIEW platform was developed to realize hardware control and data acquisition.As shown in Fig.2,the fuel supply system comprises a gear pump,a DC brush motor,a motor driver,a fuel mass flow meter,and a data acquisition card (NI USB6212).The gear pump is driven by the DC brush motor.Its rotate speed is controlled by the motor driver with the method of Pulse Width Modulation(PWM).NI USB6212 is an analog I/O device to communicate with the motor driver and the fuel flow meter.By predefining the timescales of the fuel driving voltage in the LabVIEW program,the data acquisition card could send analog control signals to the motor driver and receive feedback signals from the mass flow meter,thereby realizing the user-defined fuel supply law.
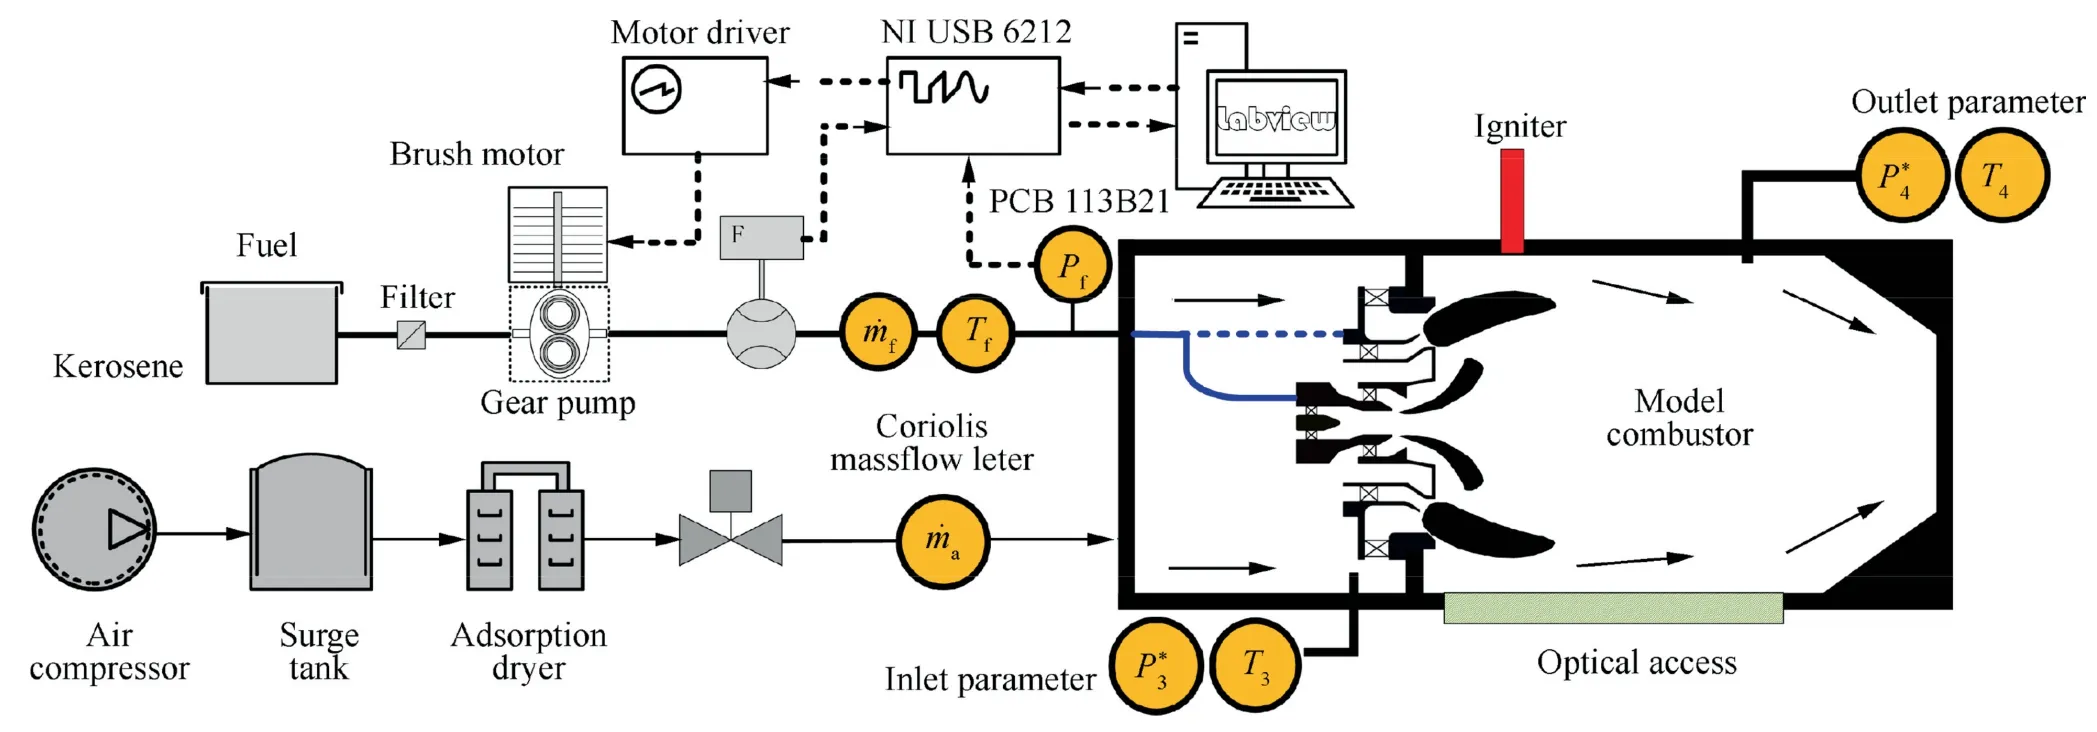
Fig.2 Schematic of an LBO test system.
The experimental procedure for LBO tests is shown in Fig.3.Att=0 s,the spark igniter was turned on.Meanwhile,the fuel mass flow rate increased sharply to 1.5 times the minimum ignition flow rate,and the FAR equals to 1.5 times the Lean Light Off FAR (LLO FAR).After successful ignition,the igniter was turned off,and the fuel mass flow rate remained constant for five seconds.Subsequently,the fuel flow rate was decreased linearly with simultaneous high-speed imaging.The optical window provides real-time flames for observation,and a blowout is defined when the flame is completely extinguished in the primary zone of the model combustor,while the FAR at the moment of flameout is defined as the LBO FAR.
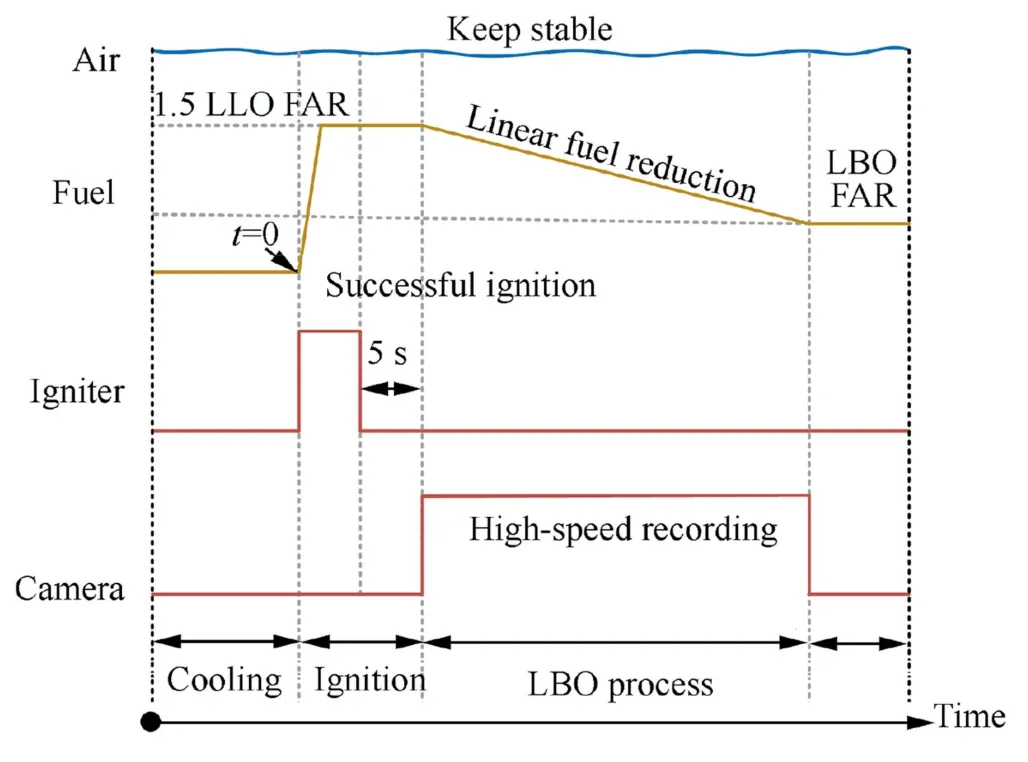
Fig.3 Experimental procedure for LBO tests.
Fig.4 shows realistic changing curves of the fuel mass flow rate under different decreasing rates.As shown,the mass flow rate of fuel increased sharply to a stable value,and then decreased linearly according to different fuel decreasing rates.The delay time of the gear pump and the response time of the flowmeter have influences on the instantaneous measurement of the LBO fuel flow rate.Apparently,the delay time is longest during abrupt start and stop processes.In order to obtain the values of delay times,a pressure sensor (PCB 113B21) was used to measure the dynamic fuel pressure(Pf)before entering the atomizer(shown in Fig.2),which can reflect the delay time of the gear pump.It should be noted that PCB 113B21 is a piezoelectric pressure sensor,which is usually used to measure high-frequency dynamic pressure.When the fuel pressure stabilizes,the pre-accumulated charge will gradually release during its discharge time and pulsate near zero.Fig.5 shows the dynamic pressure and the mass flow rate during typical abrupt start and stop processes,in which τ12and τ45indicate the delay times of the gear pump in start and stop processes,respectively,while τ13and τ44indicate the response times of the flowmeter in start and stop processes,respectively.Table 2 lists the specific values,in which the long response times of the flowmeter (τ13,τ46) will lead to a measurement error of the instantaneous fuel flow rate.Therefore,in order to obtain a correct LBO fuel flow rate,the fuel decreasing process is suspended manually when flameout occurs,the gear pump maintains its rotating speed for multiple seconds,and the steady flow rate is defined as the LBO fuel flow rate.
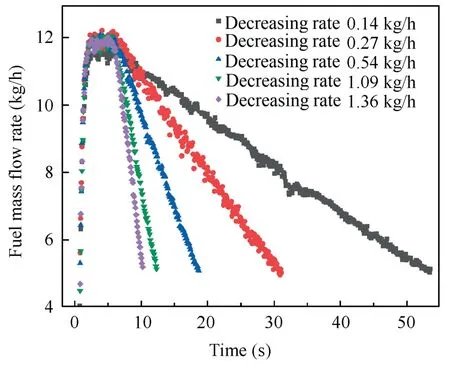
Fig.4 Linear fuel reduction processes with different rates.
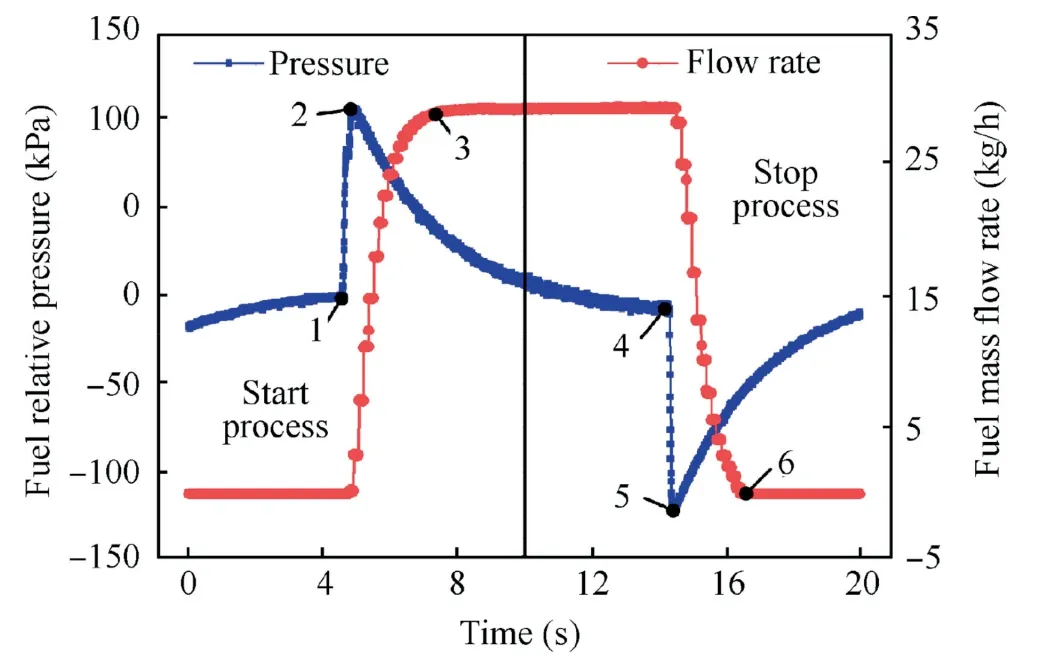
Fig.5 Delay times during abrupt start and stop processes.

Table 2 Values of delay times.
2.2.Diagnostic methods
PIV and PMie measurements were applied to characterize the 2-D velocity distribution and the droplets distribution,respectively.The optical setup of PIV and PMIE,shown in Fig.6(a),consists of a laser system,an image capture and processing system,and a controlling system.The dual-cavity Nd:YAG laser with sheet optics produces laser pulses with a power of 200 mJ,a wavelength of 532 nm,and a thickness of 1 mm.The CCD camera contains a 12 bit,monochrome sensor with a resolution of 1376 pixel × 1024 pixel.A bandpass filter of 532± 10 nm was mounted on the camera to receive scattered light from the laser cross-section.A Programmable Timing Unit(PTU)was used to synchronize the laser and the camera.A laser sheet was placed through the center of the combustor with the CCD camera placed normal to this plane.
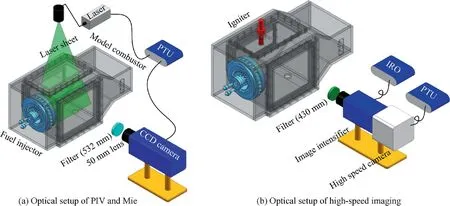
Fig.6 Schematic diagrams of optical diagnosis.
For PIV measurement,the airflow was seeded by TiO2solid particles with a diameter of 3–5 μm and a density of 4.2 g/cm3.The camera worked in a double exposure mode with an image rate of 5 Hz.Velocity fields were calculated by the crosscorrection algorithm with multi-pass iterations.A timeaveraged velocity field was obtained by processing 100 pairs of transient images.For PMie measurement,the fuel was injected into the combustor by the pilot airblast atomizer.The scattered signal from droplets was correlated with the droplet size and fuel concentration,thereby reflecting the instantaneous spray characteristics.24The framing rates of the laserand the camera were 10 Hz.A time-averaged fuel placement was acquired by averaging 100 individual images.
High-speed imaging was also applied to record the reacting flow fields,as shown in Fig.6(b).A lens-coupled image intensifier was connected to a high-speed video camera (Phantom VEO 710).The high-speed imaging system,viewing perpendicular to the flow direction,provided transient flame images of the ignition process and stable combustion.A Nikon UVlens (F=50 mm,f/1.8) with a CH* filter (430 ± 10 nm)was mounted on the image intensifier.The camera contains a 12bit,monochrome sensor with spectral sensitivity ranging from 350–1000 nm.The exposure time of the image intensifier was set to 2 μs,and the frame rate was 0.2–1.3 kHz,depending on the flameout duration.Acquired flame images are the projection of three-dimensional flames on a two-dimensional plane.The inner surface of the model combustor was treated with black oxidation,which could largely avoid measurement errors caused by wall reflection.It is noted that the above optical diagnosis methods are two-dimensional and have been widely used in the studies of realistic combustors.25–27Since the multi-swirl injector is of a centrosymmetric structure,the velocity field and droplet distribution on the central plane as well as the projected flame along the line of sight can reflect the main characteristics of flow,spray,and combustion,respectively.
In the present work,velocity fields and droplet distributions under non-reacting conditions were firstly acquired to provide basic flow and spray features.Then LBO experiments were carried out under various pressure drops and fuel decreasing rates to acquire LBO limits and dynamic flame characteristics.The experimental schemes are given in Table 3,in which σ represents the pressure drop of the injector,defined as(P3* -P4*)/P3*.

Table 3 Experimental schemes.
In order to describe the LBO characteristics of the spray flame systematically,three major parts,i.e.,LBO limits,flame transitional characteristics,and flame dynamics,are discussed with emphasis on the final performance,detailed process,and flameout precursor,respectively.Based on a basic understanding of the flow and spray characteristics inside the multi-swirl staged combustor(Section 3.1),LBO limits are firstly acquiredto quantitatively characterize the LBO performances (Section 3.2).Flame transitional characteristics are followed to be discussed focusing on the detailed LBO process (Sections 3.3 and 3.4),in which flame images visualize the overall LBO process in an intuitive manner aiming to reveal the evolution of flame morphology,while the variations of GCI (global CH* intensity) curves reveal the evolution of the flame intensity during the LBO process.Flame dynamics is lastly analyzed by the POD method focusing on the flame close to LBO (Section 3.5),aiming to find the precursors of flame extinction.
3.Results and discussion
3.1.Velocity and spray fields
Fig.7 shows the time-averaged flow field under a pressure drop of 2%.The color of the vector plot represents the axial velocity,and the color in the streamline plot represents the absolute value of the velocity.The flow field is typical of a confined swirl field and consists of two cone-shaped streams of fresh gas entering the chamber from the Pilot and Main Swirlers(Pilot SWJ and Main SWJ),and a large Central Toroidal Recirculation Zone (CTRZ).The Pilot SWJ is of a strong radial velocity and finally merges into the Main SWJ.The velocity of outer swirling jets decreases rapidly along the axial direction,and the CTRZ is wrapped inside.The orange line in the vector plot indicates the boundary of the CTRZ.The radial width of the CTRZ gradually increases from 27 mm to 93 mm after leaving the swirlers.It is further noted that a region with a low velocity and a high fuel concentration (seen in Fig.8) is located at the pilot outlet (Region A),which is favorable for flame stabilization.
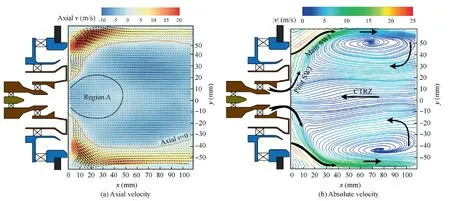
Fig.7 Averaged velocity field under a pressure drop of 2%.
Fig.8 shows the time-averaged spray field under a pressure drop of 2%.The mass flow rate of fuel decreases gradually from 15– 3 kg/h.The original droplet distribution images are 12 bit monochrome images,and the pixel value ranges from 0– 4096.In order to facilitate inter-comparison,the pixel values are mapped to the interval[0,1]through min–max normalization as follows:

where φN(i,j)is the normalized value at the pixel point with coordinates (i,j),φ(i,j)is the original value,and max(φ)and min(φ)are the maximum and minimum values among all the pixel values,respectively.As shown in Fig.8,the droplets are distributed in a solid cone shape,and the fuel concentration decreases layer by layer.The pilot stage adopts an airblast atomizer,which possesses the advantage that the atomization quality is not sensitive to the fuel pressure.The atomization quality mainly depends on the shear force formed by counter-rotating air streams from pilot swirlers.As the fuel mass flow decreases,the droplet distribution pattern does not change much,and only the fuel concentration decreases proportionally.When the fuel mass flow is reduced to 3 kg/h,namely around the LBO fuel mass flow rate,the droplet distribution shrinks greatly in both radial and axial directions,and the fuel concentration in the outer ring of the swirler is approximately zero.As a structure to anchor the flame,the pilot stage maintains a relatively fuel-rich area under all operating conditions.

Fig.8 Averaged spray field for σ=2%.
3.2.LBO limits
Fig.9 shows the LBO limits of the model combustor under different pressure drops of the injector.As shown,the LBO FAR decreases from 0.013 to 0.006 when the pressure drop increases from 1% to 4%,and then remains stable when the pressure drop varies from 4% to 6%.For a multi-swirl combustor equipped with an airblast atomizer,its LBO performance depends on flow field organization and atomization quality.As the pressure drop increases (1%–4%),the aerodynamic shear force of swirling air is enhanced,which helps to improve atomization quality,and the LBO FAR shows a downward trend.However,when the pressure drop exceeds 4%,an increase in the airflow velocity is detrimental to stable combustion of the pilot flame,which offsets the improving effect on atomization,and the LBO FAR stabilizes at 0.006.When the pressure drop reaches 7%,a further increase in the airflow velocity makes the flame hard to anchor,which leads to the LBO limits presenting an upward trend.
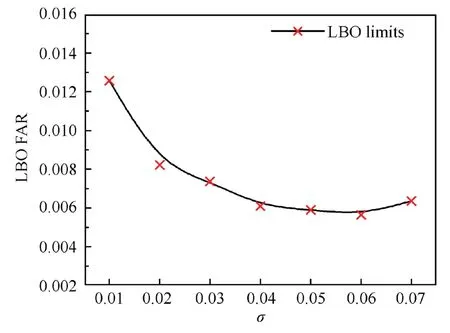
Fig.9 LBO limits under different pressure drops of injector.
Fig.10 shows the LBO limits of the model combustor under different fuel decreasing rates.As shown,the LBO FAR decreases by 0.002 when the fuel decreasing rate increases from 0.14 kg/h to 1.62 kg/h.Fig.11 shows the variations of the exhaust temperature under different fuel decreasing rates during LBO processes.The endpoints of temperature curves correspond to the time of flameout.The LBO process is of an intrinsic transient nature,accompanied by strongly unstable combustion.A lean-burn flame is easily blown off due to accidental large oscillation caused by disturbances of transient flow and spray fields,which means that a flame in an extreme lean condition has a higher probability of extinction and cannot sustain itself for a long time.Under a low fuel decreasing rate,a flame close to LBO lasts for a long time,and the heat accumulated in the initial combustion process gradually dissipates,which results in a relatively low temperature in the combustor (shown in Fig.11).According to the LBO theories proposed by Lefebvre and Mellor,28low temperature conditions are unfavorable for droplet evaporation,atomization,and chemical reaction,thereby leading to relatively high LBO limits.In addition,under the same pressure drop conditions,the reference airflow velocity and the component residence time are similar.Limited by fuel–air mixing and chemical reaction rate,as the fuel decreasing rate increases,the accumulated fuel–air mixture in the combustor is probably richer.Combined with the temperature rise effect in an impending LBO state under high fuel decreasing rates,the LBO limit extends to leaner conditions.
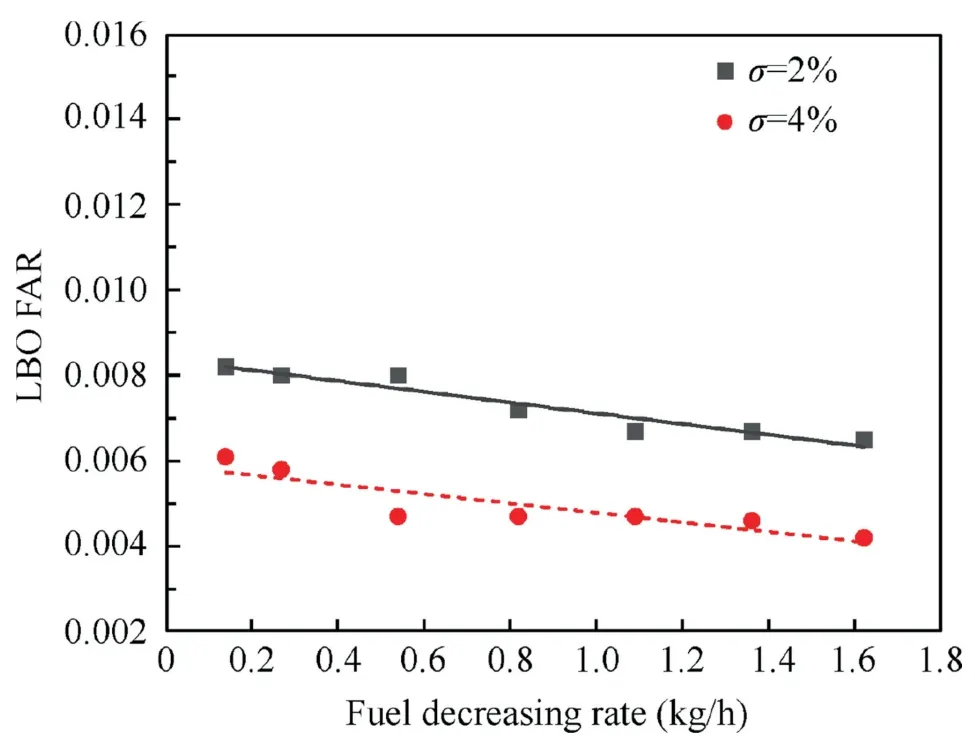
Fig.10 LBO limits under different fuel decreasing rates.
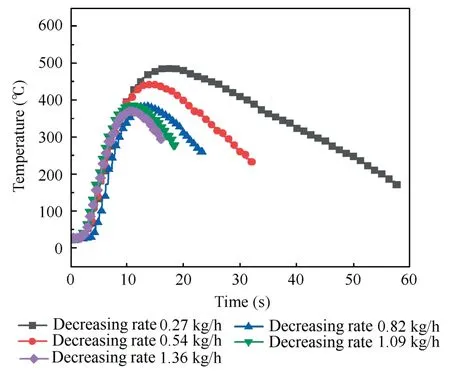
Fig.11 Exhaust temperature under different fuel decreasing rates.
3.3.Overall LBO processes
The overall LBO processes were recorded by high-speed imaging with different frame rates.Due to strong oscillation for transient flames,images were processed by period-timeaverage to reflect the overall evolution characteristics of the flame shape and intensity during the LBO process.Fig.12 shows the LBO processes under different pressure drops.The number in each image indicates the average FAR in its period.Black lines are isolines of intensity representing the outer contour of the time-averaged flame.As shown,the flame intensity decreases with a decrease of the FAR,and the main heat release zone gradually shrinks to the outlet of the pilot stage.Fig.13 shows the evolutions of the axial length and radial width of the time-averaged flame during the LBO process.The radial width of the flame distribution region gradually decreases with time,while the axial length does not decrease monotonously with time.Instead,the flame appears to be elongated,and then quickly shortens in the last 3 seconds before flame extinction,which may result from the axial oscillation of the flame at a near-LBO state.As the pressure drop increases,the flame intensity in the same time period is weakened due to a decrease of the FAR,and the flame axial length and radial width are shortened.
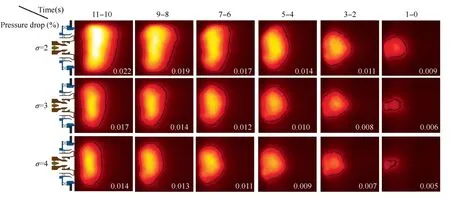
Fig.12 LBO processes under different pressure drops with fuel decreasing rate of 0.54 kg/h.
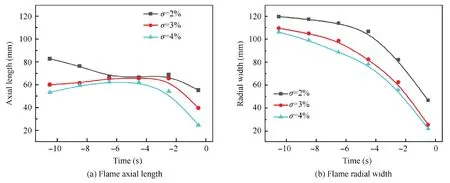
Fig.13 Evolutions of the axial length and radial width of the time-averaged flame with fuel decreasing rate of 0.54 kg/h.
Fig.14 shows the LBO processes under different fuel decreasing rates.The number in each image indicates the time before a blowout event,and black lines represent the outer contour of the flame.As the fuel decreasing rate increases,the structure and intensity of the time-averaged flame do not change much under similar FAR conditions.Only in the near-LBO state(1–0 s),due to strong flame oscillation and frequent extinction and reburning,the flame structure shows differences under various fuel decreasing rates.It can be drawn that in the LBO process,the time-averaged flame shape is dominated by the FAR condition,and not sensitive to the fuel decreasing rate.Fig.15 shows the axial lengths and radial widths of time-averaged flames under different FARs.Under various fuel decreasing rates,the axial length of the flame is always elongated firstly and then shortened before blowout,while the radial width of the flame decreases monotonously with the FAR.
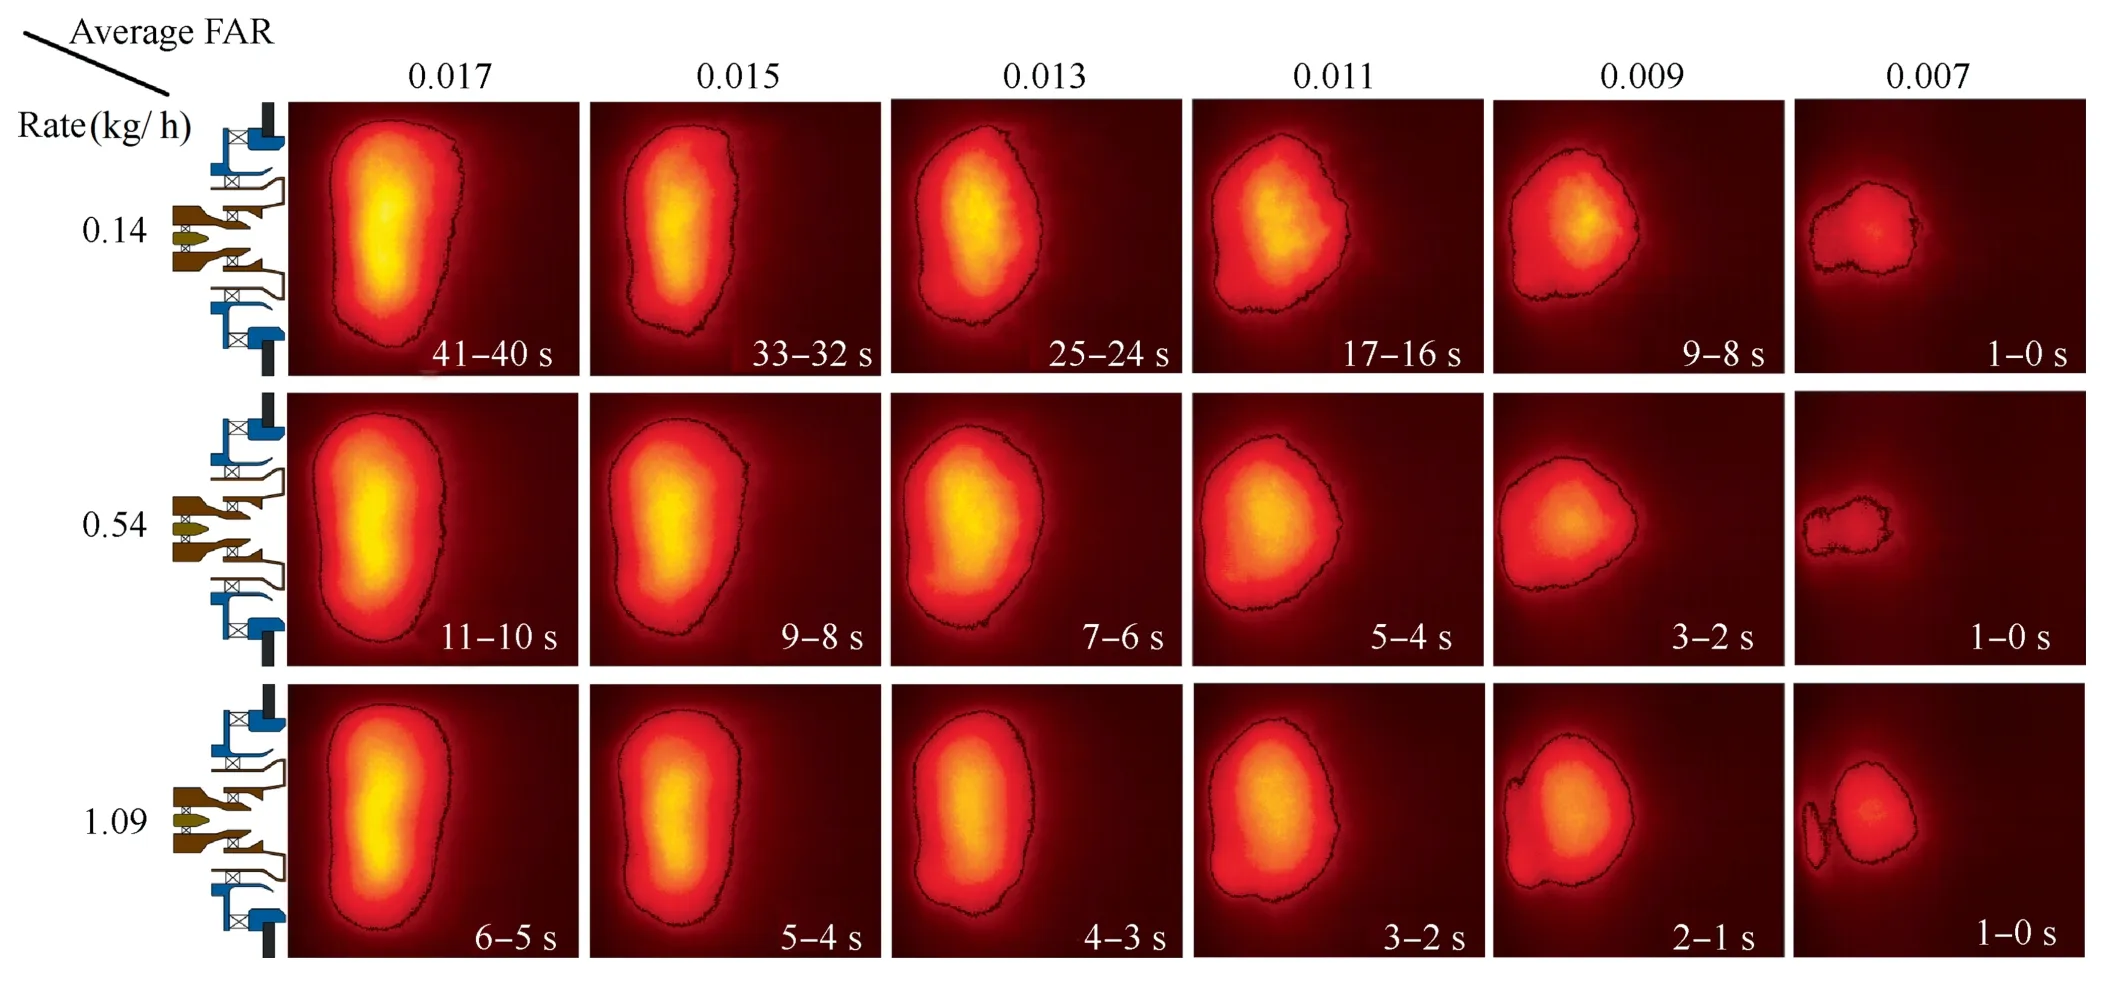
Fig.14 LBO processes under different fuel-decreasing rates with pressure drop of 3%.
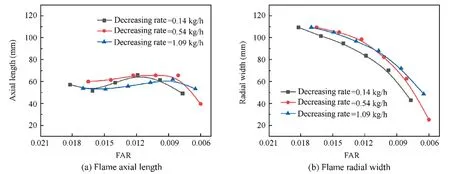
Fig.15 Evolutions of the axial length and radial width of the time-averaged flame with pressure drop of 3%.
From the overall flame evolution,it can be found that the LBO processes share similarities under different pressure drops and fuel decreasing rates.The time-averaged reacting zone is consistent with the droplet distribution at non-reacting conditions,gradually shrinking toward the central axis of the injector as the FAR decreases.The flame close to LBO is anchored in the pilot outlet where the velocity is low and the fuel concentration relatively high,which has been discussed in Section 3.1.It is further noted that the change of the flame length is not monotonous,which may help to identify the precursors of impending blowout.
3.4.Global chemiluminescence intensity
In order to quantitatively analyze the change of the flame intensity with time,the integrated intensity of CH* in the image acquisition area is defined as the Global Chemiluminescence Intensity (GCI).Fig.16 shows the change of the GCI with time during the LBO process.The initial FAR is 0.024,and the fuel is decreased linearly until flame extinction.The scatter points represent transient GCIs.As shown,the amplitude of GCIs oscillates greatly throughout the overall LBO processes,presenting a linear downward trend in general.The GCIs approach zero in the near-LBO state.A linear function (GCI=kt+b) is used to fit the variation of the GCI with time,in whichksignifies the decreasing rate of the GCI,andbsignifies the GCI intensity in the near-LBO state.As shown,under the same fuel decreasing rates,the descent rate of the GCI decreases with an increase of the pressure drop,which is manifested as a decrease in the absolute value ofk,and an increase in the LBO time duration.This is mainly because the air mass flow rate increases with the pressure drop.Under the same fuel-decreasing rate,the descent rate of the FAR decreases with an increase of the pressure drop,which leads to an increase of the LBO time duration under high pressure drop conditions.It is further noted that under the same FARs(e.g.,FAR=0.024),the GCI decreases with an increase in the pressure drop of the injector,which mainly results from poor atomization quality for the airblast injector under low pressure drop conditions,and the insufficient combustion results in a high proportion of soot in combustion products.
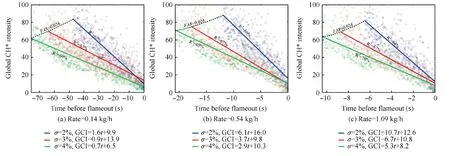
Fig.16 Change of the global chemiluminescence intensity with time during LBO processes.
Fig.17 shows the change of the GCI with the FAR during LBO processes.The GCI in the Y-axis is normalized.And the dotted lines in the figure signify fitted lines under different fuel decreasing rates.As shown,there is little difference in the variation of the GCI with the FAR under different fuel decreasing rates,which further proves that in LBO processes,the GCI is dominated by the FAR,and not sensitive to fuel decreasing rates.The black solid lines represent the overall fitting results under different pressure drops,and the goodness of fit R2≥64.6%.The descent rate of the GCI decreases with an increase of the pressure drop,and the GCI decreases linearly to 7%–9% of the initial intensity when it reaches the impending blowout state.

Fig.17 Change of the global chemiluminescence intensity with FAR during LBO processes.
3.5.Dynamic characteristics of lean-burn flames
From the discussions in Sections 3.2 and 3.3,it is known that transitional combustion with a linear fuel reduction includes the decay of the heat release intensity as well as the contraction of the reacting zone.In addition,under the coupling effects of heat release pulsation and acoustic pulsation,the flame structure oscillates rapidly during the whole LBO process.POD was used to analyze high-speed images and acquire the spatial dynamic characteristics of lean-burn flames.The core of the POD method is to find optimal orthogonal basis functions in flame image sequences,thereby acquiring the dominant dynamic characteristics of the flow field.Detailed methods were introduced in Refs.29–30.
In order to identify the variation of flame dynamics during the LBO process,the whole process is divided into three phases(Phase I,Phase II,and Phase III)with the same time duration,in which Phase I to Phase III gradually approaches flame extinction.The flame images of each phase were analyzed by POD methods.The energies and spatial distributions of POD modes were acquired.Fig.18 shows the energy proportion of the first 15 modes under three phases,and the modal energies are arranged in a descending order.As shown,under different phases of LBO processes,the energy ratio of each mode is approximate,and the total energy proportion of the first 15 modes is 54.8%-57.8%.In Phase III,the energy of the first-order mode accounts for the highest proportion of 18.1%.Fig.19 shows time-averaged flame images and modal spatial distributions under different phases.In modal spatial distribution,a blue region indicates a decrease of the heat release rate,and a red region indicates an increase of the heat release rate.Cyan and yellow regions indicate that heat release pulsations are approximately zero.
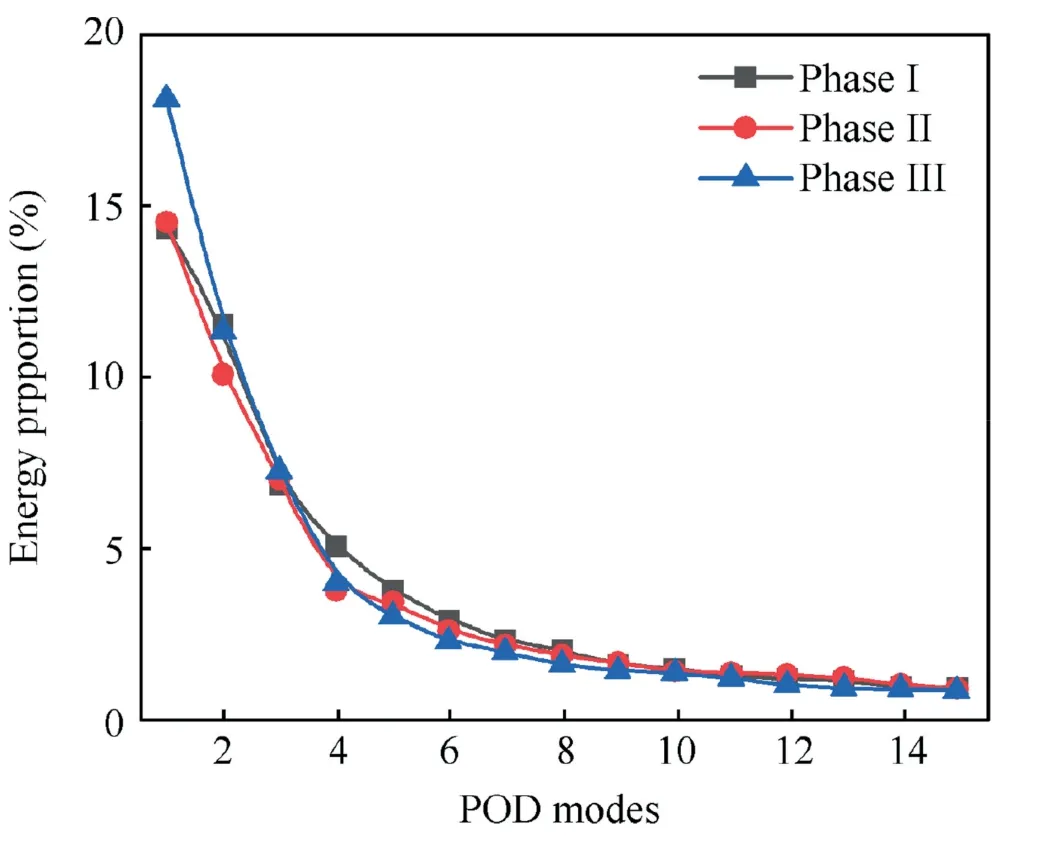
Fig.18 Energy distributions under different phases (σ=2%,Decreasing rate=0.54 kg/h).
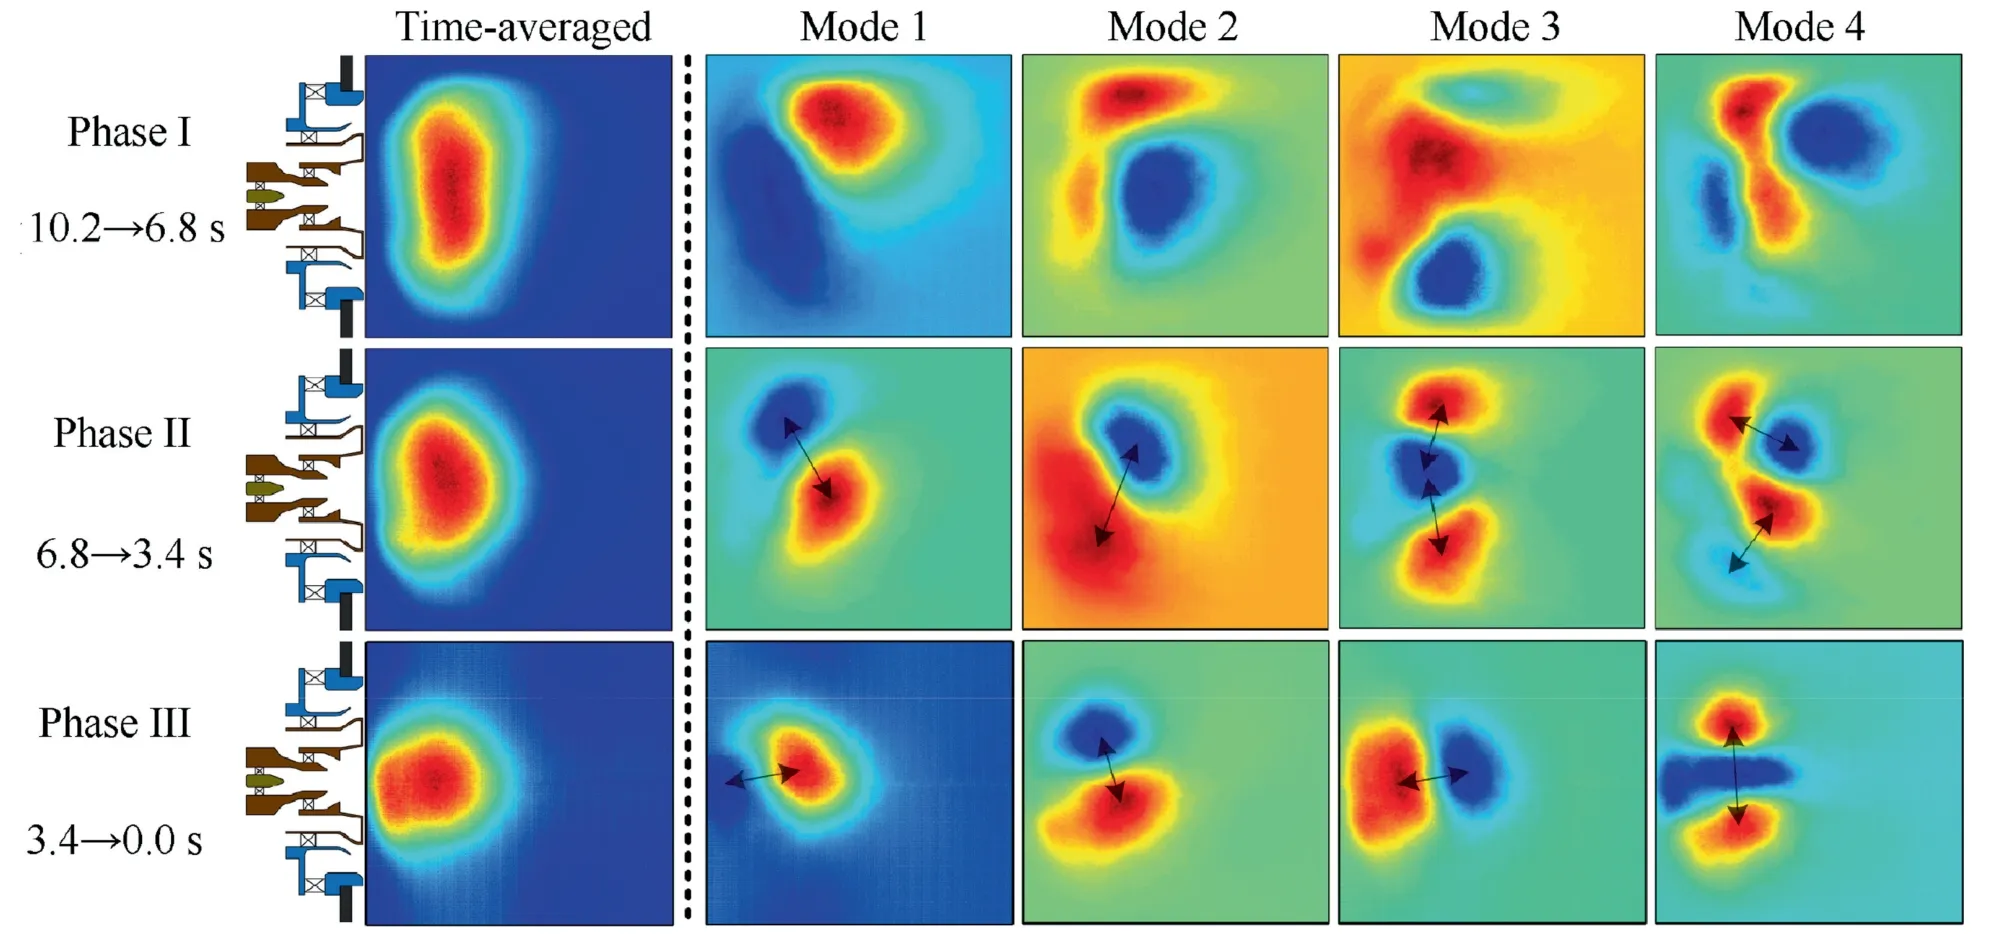
Fig.19 Time-averaged flame images and modal spatial distributions (σ=2%,Decreasing rate=0.54 kg/h).
As shown in Fig.19,in the initial LBO process (Phase I),the FAR is relatively high,the transient flame shape and structure evolve intricately with time,and the main dynamic mode has no clear oscillation direction,while in the middle phase(Phase II),strong reacting regions of Modes 1 and 2 alternately appear up and down.This combustion reaction in space belongs to a radial oscillation mode.Strong reaction regions of Mode 3 alternately appear between the outer ring and the central zone of swirling streams,which may be associated with the combustion differences between the inner and outer swirling areas of the recirculation zone.Mode 4 shows 4 cross pulsations appearing alternately along the radial direction.Modes 3 and 4 both belong to high-order radial oscillation forms.In general,Phase II is dominated by radial oscillations.The timeaveraged flame shows an apparent reduction in the radial width with time evolution.It is further noted that the POD analyses under different cases show that the modal spatial distributions of Phases I and II will change with the variations of pressure drops and fuel decreasing rates,which means that the dynamic characteristics of lean-burn flames are of a stochastic nature.
Capturing the dynamic characteristics of a flame impending LBO is helpful to find the precursors of flame extinction.Fig.20 shows instantaneous flames close to LBO.The time in each picture represents the time before LBO.As shown,the main reaction zone fluctuates along the radial direction at 1–2 s before LBO,and the instantaneous flame intensity increases and decreases regularly.At 0.1 s before LBO,the flame presents prominent axial contraction and stretch,along with local flame extinction and reignition,which is mainly associated with the oscillations in transient aerodynamic and spray fields.With a decrease of the reaction intensity,local flame extinction gradually evolves into global extinction.It is further noted that a flame lift-off-reattachment event does not appear in the LBO process caused by fuel reduction,which is different from the LBO event caused by an increase of air,7and this may result from the facts that the droplet distribution mainly depends on the aerodynamic flow field,and the fuel is transported with a longer axial distance as the air velocity increases.
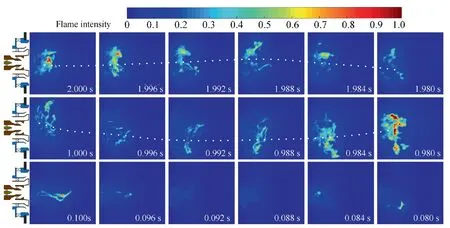
Fig.20 Instantaneous flames close to LBO (σ=2%,Decreasing rate=1.09 kg/h).
Figs.21 and 22 show the modal energy and spatial distributions in Phase III under different fuel decreasing rates and pressure drops.As shown,the energy distribution of the first 15 modes does not change much with fuel decreasing rates,while as the pressure drop increases,the energy proportion of the first mode is gradually reduced from 19.7% to 13.7%.POD analyses under different pressure drops and fueldecreasing rates show that the spatial distributions of POD modes present similar oscillation forms in Phase III.
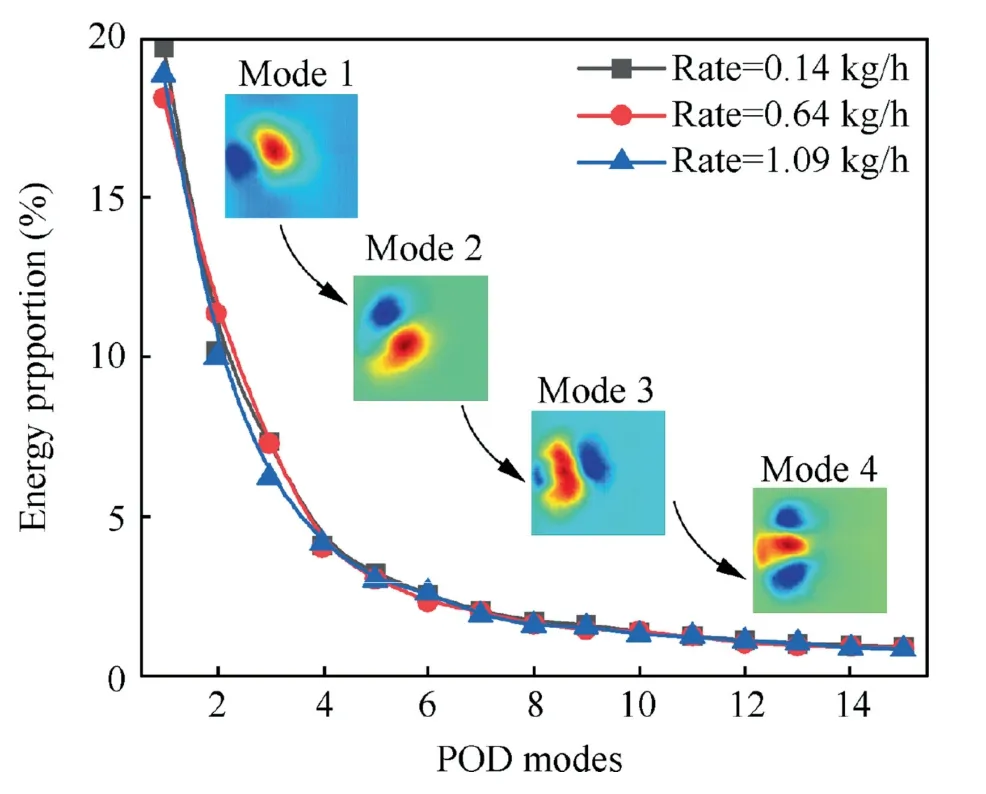
Fig.21 Energy distributions under different fuel decreasing rates(Phase III,σ=2%).

Fig.22 Energy distributions under different pressure drops(Phase III,Decreasing rate=0.14 kg/h).
As shown in Figs.21 and 22,the spatial distributions of mode 1 are similar to the time-averaged flame,and it also shows a decrease of the heat release rate at the flame root,which means that mode 1 retains a degree of the state before pulsation excitation and the dynamic characteristic of axial oscillation.Modes 2 and 3 present radial oscillation and high-order axial oscillation,respectively.Mode 4 shows the difference between the outer swirling streams and the central recirculation area,which is a high-order radial oscillation.In general,at the impending LBO state,the flame dynamics are less affected by the pressure drops and fuel decreasing rates,while more sensitive to the FAR condition and combustion status.The flame is of a clear oscillation pattern,which is dominated by axial oscillation,and alternately appears radial,highorder axial,and high-order radial oscillations.With time evolution,the axial length and radial with of the flame shrink rapidly in the impending LBO state.
4.Conclusions
This work studies the LBO dynamics in a multi-swirl staged combustor under the condition of linear fuel reduction to reveal the transitional characteristics of a spray flame with time evolution.The following conclusions can be drawn:
(1) The flow structure and droplet distribution suggest that a large central toroidal recirculation zone is formed by multi-swirl streams.The region with a low velocity and a high fuel concentration is located at the outlet of the pilot stage,which facilitates the stabilization of the flame close to LBO.
(2) Experiments under different fuel decreasing rates and pressure drops of the injector show that the LBO FAR gradually decreases from 0.013 to 0.006 as the pressure drop increases from 1% to 7%.With an increase of the fuel decreasing rate,the exhaust temperature before flame extinction increases,and the LBO limits extend to leaner conditions.The analysis of overall LBO processes suggests that the average flame structure is sensitive to FAR conditions,and the time evolution of the integral CH* intensity conforms to a linear function during the LBO process.The time-averaged flame close to LBO shrinks to the pilot outlet,accompanied by a decay of the heat release rate and a rapid contraction of the main reacting zone in both axial and radial directions.Meanwhile,instantaneous flames close to LBO present fluctuations of the reaction position and intensity,along with local flame extinction and reignition.
(3) Under different fuel decreasing rates and pressure drops,the flames share similar dynamic characteristics at the near-LBO state,alternately appearing axial,radial,high-order axial,and high-order radial oscillation.
Declaration of Competing Interest
The authors declare that they have no known competing financial interests or personal relationships that could have appeared to influence the work reported in this paper.
Acknowledgments
This work was supported by National Science and Technology Major Project (Nos.2017-III-0007-0032 and J2019-III-0002-0045).
 CHINESE JOURNAL OF AERONAUTICS2022年12期
- CHINESE JOURNAL OF AERONAUTICS的其它文章
- Control and utilization of range-dependent beampattern with waveform diverse array radars
- Airside pressure drop characteristics of three analogous serpentine tube heat exchangers considering heat transfer for aero-engine cooling
- Numerical analysis of deflection control of a gas plasma jet based on magnetohydrodynamic staggered electrode configuration
- Neural network-based model predictive control with fuzzy-SQP optimization for direct thrust control of turbofan engine
- Method for utilizing PIV to investigate high curvature and acceleration boundary layer flows around the compressor blade leading edge
- Experimental investigation of expansion effect on shock wave boundary layer interaction near a compression ramp
