Succession of Aphanizomenon f los- aquae and Microcystis aeruginosa in direct co-culture experiments at diff erent temperatures and biomasses*
Qianzhi WEN , Peng XIAO , Hua LI , Wenke LI , Gongliang YU ,**, Renhui LI ,**
1 Key Laboratory of Algal Biology, Institute of Hydrobiology, Chinese Academy of Sciences, Wuhan 430072, China
2 University of Chinese Academy of Sciences, Beijing 100049, China
3 College of Life and Environmental Sciences, Wenzhou University, Wenzhou 325035, China
Abstract Cyanobacterial blooms have become a serious global environmental issue due to their potential risk for releasing detrimental secondary metabolites into aquatic ecosystems, posing a great threat to water quality management for public health authorities. Aphanizomenon, a common f ilamentous cyanobacterial genus belonging to Nostocales, is under particular concern because its several members are able to form harmful blooms. Furthermore, succession of bloom between A. f los- aquae and Microcystis occurs in many natural lakes. To evaluate the competitiveness of A. f los- aquae vs. M. aeruginosa, two sets of experiments at diff erent ratios of biomass at 15 °C and 25 °C were conducted. Results show that at 15 °C, the two species were able to coexist, and A. f los- aquae showed a specif ic higher growth rate, and its growth was promoted by the presence of M. aeruginosa. At 25 °C, the growth of A. f los- aquae was inhibited by the biomass of M.aeruginosa, and M. aeruginosa suppressed A. f los- aquae in competition. Additionally, the vegetative cell size of A. f los- aquae was signif icantly inf luenced by the co-culture with M. aeruginosa, whereas the f ilament length of A. f los- aquae was not signif icantly aff ected. This study conf irms that temperature is the dominating factor on the succession of A. f los- aquae and M. aeruginosa of a diff erent biomass.
Keyword: cyanobacterial bloom; Aphanizomenon f los- aquae; Microcystis aeruginosa; succession;temperature; biomass
1 INTRODUCTION
Cyanobacteria, a category of earth’s most primitive oxygenic photoautotrophs, are able to adapt to complicated and varied environments on the earth (Paerl and Otten, 2013). Aggravated water eutrophication due to modern anthropogenic activities promoted the proliferation of cyanobacteria,increased the frequency of cyanobacterial bloom outbreak in many freshwater ecosystems (Gehringer and Wannicke, 2014), and damage local aquatic ecosystems, which poses great threats to water quality and challenge to the management (Glibert et al.,2005; Best, 2019; Mushtaq et al., 2020).Microcystis,Dolichospermum,Planktothrix,Raphidiopsis, andAphanizomenonare regarded as the most common bloom-forming cyanobacteria genera (Paerl and Otten, 2016).Aphanizomenonbelongs to the order Nostocales, and contains several members causing harmful blooms (Cires and Ballot, 2016; Codd et al., 1999). It was reported thatAphanizomenonspecies could produce several types of toxins,including paralytic shellf ish poisoning (PSP) toxins,cylindrospermopsins (CYNs), microcystins (MCs),and anatoxins (ATXs) (Rapala et al., 1993; Sabour et al., 2005; Pearson et al., 2010; Rzymski et al.,2011; Cirés and Ballot, 2016). Furthermore, it has been reported that these species can produce odor compounds (Suurnäkki et al., 2015).
The seasonal succession of dominant species is the typical characteristic of phytoplankton assemblages in freshwater ecosystems (Tsukada et al., 2006; Moustaka-Gouni et al., 2007; Messineo et al., 2010). Eukaryotic algae are usually dominant species of phytoplankton in spring, and shortly after is replaced by cyanobacteria in summer (Wang et al., 2021). In addition, cyanobacterial communities undergo successions among diff erent genera (Wu et al., 2016; Shan et al., 2019). Succession of dominant species is controlled by multiple biotic and abiotic factors, including temperature, nutritional levels,light intensity, hydrological conditions, allelopathy,and grazing pressure (Bormans et al., 2005; Smayda,2008; Paerl and Paul, 2012; Tan et al., 2019)
Several f ield studies have reported that the seasonal succession betweenA.f los-aquaeandMicrocystisspecies is a common phenomenon in lakes, such as Dianchi Lake, China (Liu et al., 2006b; Wu et al.,2016) and Ford Lake in the southeastern Michigan(McDonald and Lehman, 2013), showed thatMicrocystiscould become a dominant overA.f losaquaein a warming water.Microcystishas developed several traits to form its ecologically competitive advantages, such as colony formation (Yang et al.,2006), ability to regulate buoyancy (Brookes and Ganf, 2001), secondary metabolites production (Ma et al., 2015), luxury phosphorus uptake (Shen and Song,2007), high affi nity for dissolved inorganic nitrogen(Takamura et al., 1987), and fast growth at warmer temperatures (Carey et al., 2012; Paerl and Otten,2013). However,A.f los-aquaealso posses some of the above-stated features, such as presence of gas vesicles and the formation of fascicles as aggregates in waters (Liu et al., 2006a; Yang et al., 2006). These shared traits betweenA.f los-aquaeandMicrocystisindicate that their niches overlap to some extents.A.f los-aquaeas a common type of f ilamentous heterocystous cyanobacteria, owns some unique traits such as nitrogen f ixation ability and cellular diff erentiation into heterocysts and akinetes, which is distinct from unicellularMicrocystis. Therefore, these unique traits that diff erentiate their niches and ref lect relative f itness may provide the potential for the dominance ofA.f los-aquaeor coexistence betweenA.f los-aquaeandMicrocystis.
There have been many reports about blooms formed byA.f los-aquaein winter (Jones, 1979;Baker, 1981; Üveges et al., 2012). Wu et al. (2010)described thatA.f los-aquaebloomed in the winter and early-spring in Dianchi Lake, showing its tolerance to lower temperature; they also studied the eff ect of environmental factors on the seasonal succession ofMicrocystisandA.f los-aquaein the lake, and suggested that temperature is the most inf luential factor on the initiation of rapid growth and succession betweenA.f los-aquaeandMicrocystis. Ma et al.(2015) demonstrated thatMicrocystisstrains are able to suppress the growth ofA.f los-aquaeas shown inA.f los-aquaeco-culture withMicrocystisf iltrate,and this allelopathic eff ects may partially explain the driving factor for the seasonal succession fromA.f losaquaetoMicrocystisspecies. Apparently, studies in f ield and laboratory experiments have revealed the mechanism for the succession betweenMicrocystisandA.f los-aquaeto some extents (Wu et al., 2010,2016; Ma et al., 2015), but did not set an experimental system on nor explore the direct co-culture of them.Since the indoor co-culture can simulate more precisely the mechanism of the competition between the two species, and help understanding the details of bloom succession for better control of eutrophic water bodies and cyanobacteria blooms. Furthermore,the inf luence of biomass shall be considered in study of the succession of diff erent cyanobacterial species since the biomass is not equal in the natural waters.
In this study, to address the dominant environmental factor on the succession and dominance priority betweenA.f los-aquaeandM.aeruginosa, we performed anA.f los-aquae-M.aeruginosacoculture at 15 °C and 25 °C in diff erent initial biomass gradients. In the co-culture experiment, the characteristics of growth and succession of the two species were studied and the morphological change ofA.f los-aquaewas observed.
2 MATERIAL AND METHOD
2.1 Strain and culture condition
Two strains ofA.f los-aquaeCHAB7452 andM.aeruginosaCHAB7427 were isolated for this study from Meiliang Bay, Taihu Lake, China in May 2019(Fig.1). Strain CHAB7452 was originally in large fascicle-like colonies and composed of several straight trichomes, and the bundle f ilaments could irreversibly transform into solitary trichomes under laboratory conditions. Strain CHAB7427 was unicellular.
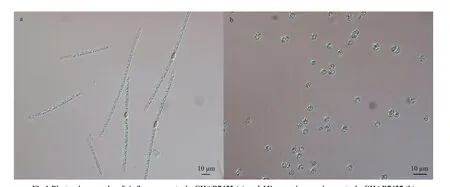
Fig.1 Photomicrographs of A. f los- aquae strain CHAB7452 (a) and Microcystis aeruginosa strain CHAB7427 (b)
The cultures of the both cyanobacterial strains were maintained in BG11 medium in 250-mL f lasks containing 120 mL of the medium, at 25 °C with a 12-h∶12-h light∶dark cycle under a constant white light intensity of 30 μmol/(m2·s). The cultures were manually shaken thrice daily during incubation until the exponential phase.
2.2 Design of the experiment
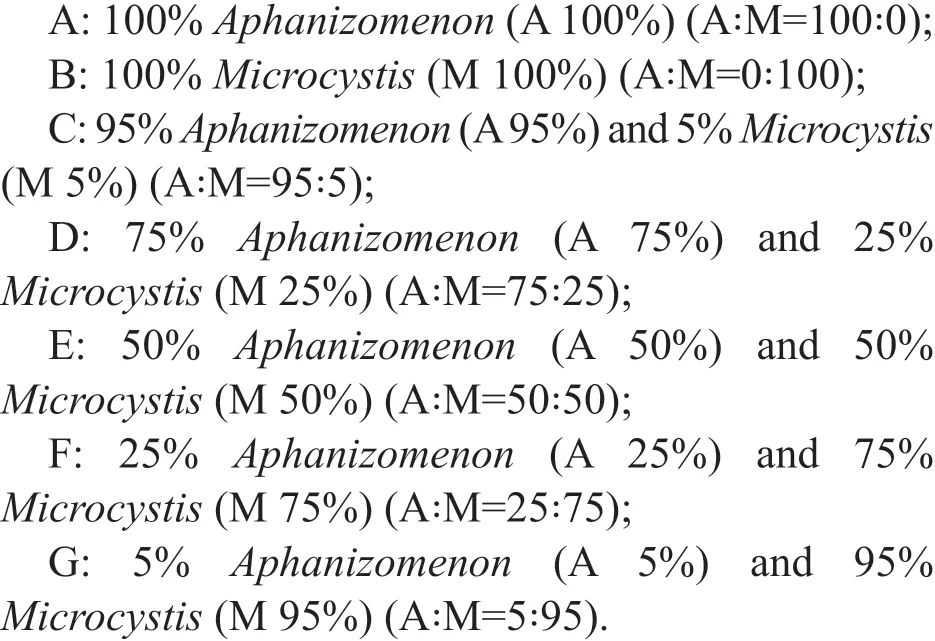
The co-cultured experiment included 7 groups, and each group consisted of triplicate cultures at 15 °C and 25 °C. The f irst two groups, Groups A and B,were set for controls corresponding to monocultures ofA.f los-aquae(CHAB7452) andM.aeruginosa(CHAB7427), respectively. The remaining groups,from C to G, were set for test groups of co-culture ofA.f los-aquae(CHAB7452) andM.aeruginosa(CHAB7427) in diff erent initial ratios of biomass with a total initial biomass of 24.3 mg/mL in 250-mL f lasks as listed below:
All the f lasks were placed in an incubator under the same cultivation conditions except for temperature and manually shaken three times a day and their positions in the incubator were randomly adjusted during incubation. For each group, 10-mL subsamples were collected from the f lasks during the experiment, from which 5 mL was f ixed with Lugol’s iodine solution(1% f inal concentration) for cell counting and the rest 5 mL was used for the morphological observation.Fresh sterile BG11 media were supplemented after sampling to maintain constant 120-mL culture volumes.
2.3 Growth measurement
The subsamples were taken for cell counting under a microscope (Olympus CX21, 400× magnif ication,Olympus, Tokyo, Japan), and specif ic growth rate (μ)was calculated by the equation:

Analyses of the morphology were based on photomicrographs taken with a Nikon eclipse 80i microscope (Japan) equipped with a DS-Ri1 digital camera (Nikon, Japan) photomicrographic system at 400× magnif ication. The cell width, length, and f ilament length ofA.f los-aquaewere measured and analyzed using NIS-Elements D 3.2, in which 360 vegetative cells and 360 trichomes were randomly chosen for the morphological analysis.
2.4 Statistical analysis
All experiments were conducted in triplicate; data were presented in mean±standard deviation. Statistical diff erences were evaluated by Kruskal-Wallis test in SPSS v19.0 software for windows. Diff erences withPvalues less than 0.05 were considered signif icant.Figures were generated using Microsoft Excel and R v3.5.1.
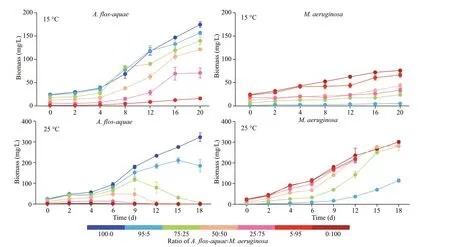
Fig.2 The growth curves of the A. f los- aquae and M. aeruginosa at 15 ℃ and 25 ℃
3 RESULT
3.1 Eff ect of A∶M biomass ratios on the growth of the two cyanobacterial strains at two diff erent temperatures
At 15 °C, biomasses ofA.f los-aquaeandM.aeruginosaall increased during the whole experiment period (Fig.2). After co-culture in diff erent biomass ratios ofM.aeruginosa, all the biomass ofA.f los-aquaein each group increased from initial values of 24.300, 23.085, 18.225, 12.150, 6.075, and 1.215 mg/L in Groups A (A∶M=100∶0), C (A∶M=95∶5),D (A∶M=75∶25), E (A∶M=50∶50), F (A∶M=25∶75), and G (A∶M=5∶95), respectively, to f inal biomass values of 174.489, 156.529, 139.758, 121.345, 70.754, and 15.941 mg/L, respectively (Fig.2).A.f los-aquaein Groups G (A∶M=5∶95), with minimal initial biomass,showed the greatest increase in biomass of 13.12 times.The growth pattern ofM.aeruginosawas similar to that ofA.f los-aquae. The biomass ofM.aeruginosain all of the groups reached the peak value at the end of the experiment, reaching 75.973, 4.913, 23.995, 43.366,33.507, and 66.332 mg/L in Groups B (A∶M=0∶100),C (A∶M=95∶5), D (A∶M=75∶25), E (A∶M=50∶50),F (A∶M=25∶75), and G (A∶M=5∶95), respectively(Fig.2).M.aeruginosain Groups C (A∶M=95∶5) also had the lowest initial biomass and the greatest increaseof 4.04 times in the experiment.
Then they buried Cassim, and Morgiana his slave followed him to the grave, weeping and tearing her hair, while Cassim s wife stayed at home uttering lamentable19 cries
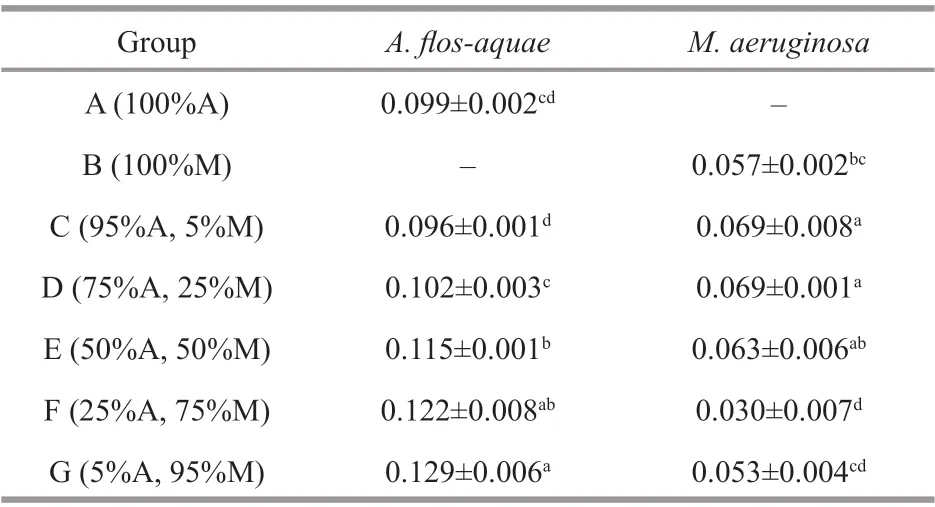
Table 1 The specif ic growth rates ( μ) (/d) of A. f los- aquae and M. aeruginosa at 15 °C
The specif ic growth rates (μ) ofA.f los-aquaein Groups E, F, and G were signif icantly higher than that of Group A (P<0.05) (Table 1). However, there were no signif icant diff erences in Groups A from Groups C and D (P>0.05) (Table 1). In the test groups, theμvalue ofA.f los-aquaein Group C was signif icantly lower than other groups (P<0.05) (Table 1), and those ofM.aeruginosain Groups C and D were signif icantly higher than that of Group B, whereas Group F was signif icantly lower than Group B (P<0.05) (Table 1).In the test groups, there were no signif icant diff erences among Groups C, D, and E (P>0.05) (Table 1).However, theμvalue ofM.aeruginosain the three groups were signif icantly higher than those of Groups F and G (P<0.05) (Table 1).
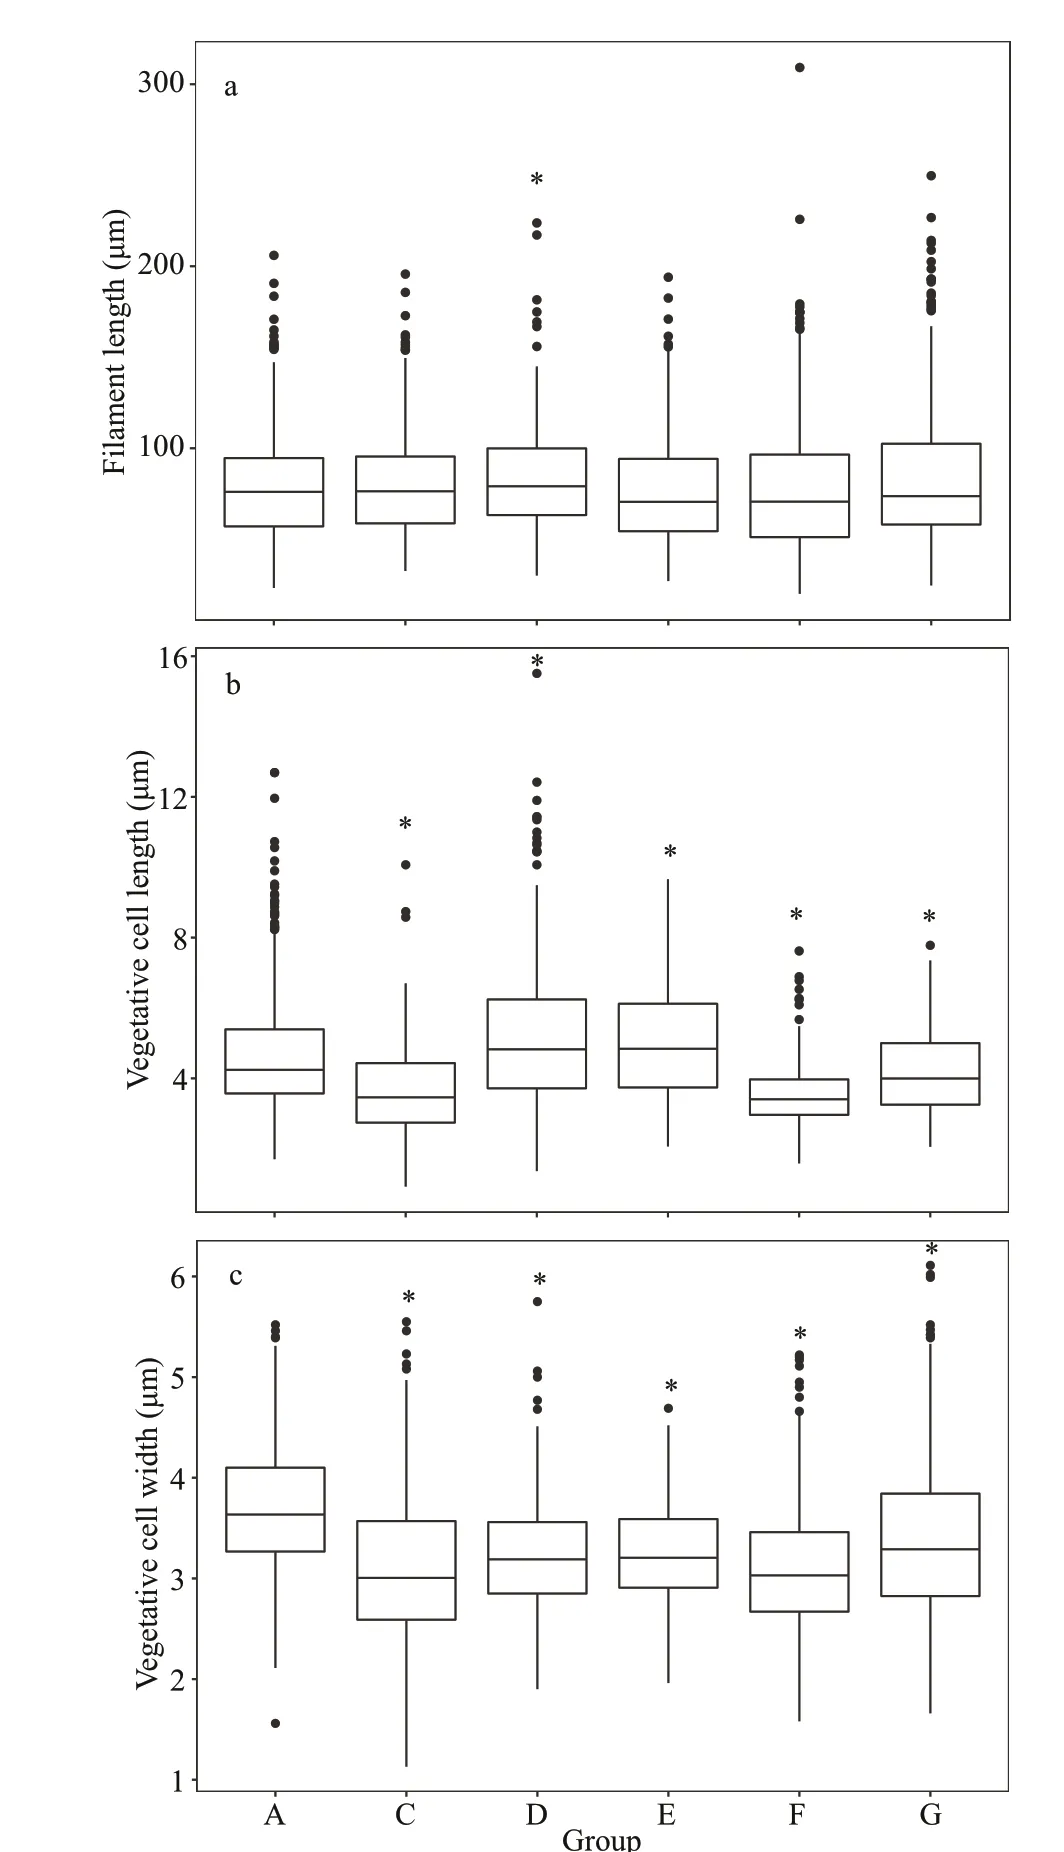
Fig.3 The morphological characteristics of A. f los- aquae in each group on Day 20 at 15 °C
At 25 °C, the results are diff erent from those at 15 °C. The biomass ofM.aeruginosain all groups was sustained to grow over the experiment period,whereas the biomass ofA.f los-aquaepresented a trend of earlier increase to later decrease except for Group A (100% A) (Fig.2). The whole experiment lasted 18 days; however, the f ilaments ofA.f losaquaewere hardly seen in the Groups F and G until Day 12. The biomass ofA.f los-aquaedropped to 5.070 (on Day 18), 0.280 (on Day 18), 0.282 (on Day 12), 0.019 mg/L (on Day 12) from the initial values of 18.225, 12.150, 6.075, and 1.215 mg/L in Groups D, E, F, and G, respectively (Fig.2). The highest biomass ofM.aeruginosareached 300.931(on Day 18), 114.811 (on Day 18), 281.483 (on Day 18), 283.501 (on Day 18), 211.178 (on Day 12), and 219.325 mg/L (on Day 12) in Groups B, C, D, E, F,and G, respectively (Fig.2).
3.2 Eff ect of A∶M biomass ratios on the morphological features of A. f los- aquae
The length and width of the vegetative cell were signif icantly diff erent among groups at 15 °C(Fig.3b-c) (P<0.05). The lengths were 4.76±1.85,3.65±1.24, 5.16±1.97, 5.00±1.57, 3.54±0.86, and 4.20±1.19 μm in Groups A, C, D, E, F, and G,respectively (Fig.3b); and the widths were 3.70±0.61,3.09±0.79, 3.21±0.56, 3.25±0.50, 3.12±0.64, and 3.41±0.82 μm for Groups A, C, D, E, F, and G,respectively (Fig.3c). The vegetative cell widths in the test groups were signif icantly lower than that of control group. In addition, there is no signif icantly diff erence between control group and test group in the f ilament length except for Group D (Fig.3a).
The vegetative cell length and width were signif icantly diff erent among groups at 25 °C(Fig.4b-c) (P<0.05). Comparing with the control group(Group A), the f ilament length in Groups E and F was signif icantly lower, whereas there are no signif icantly diff erences with other test groups (Fig.4a) (P>0.05).The vegetative cell lengths were 3.23±0.83, 4.13±1.16,3.74±1.17, 3.01±0.78, 3.02±0.57, and 3.11±1.15 μm for Groups A, C, D, E, F, and G, respectively (Fig.4b).
The vegetative cell widths in the test groups were signif icantly lower than that of control group(3.49±0.75 μm) except Group C (3.73±0.98 μm),similar to the result at 15 °C (P<0.05) (Fig.4c).
3.3 Eff ect of initial A∶M biomass ratios on f inal biomass percentages of the two cyanobacterial strains
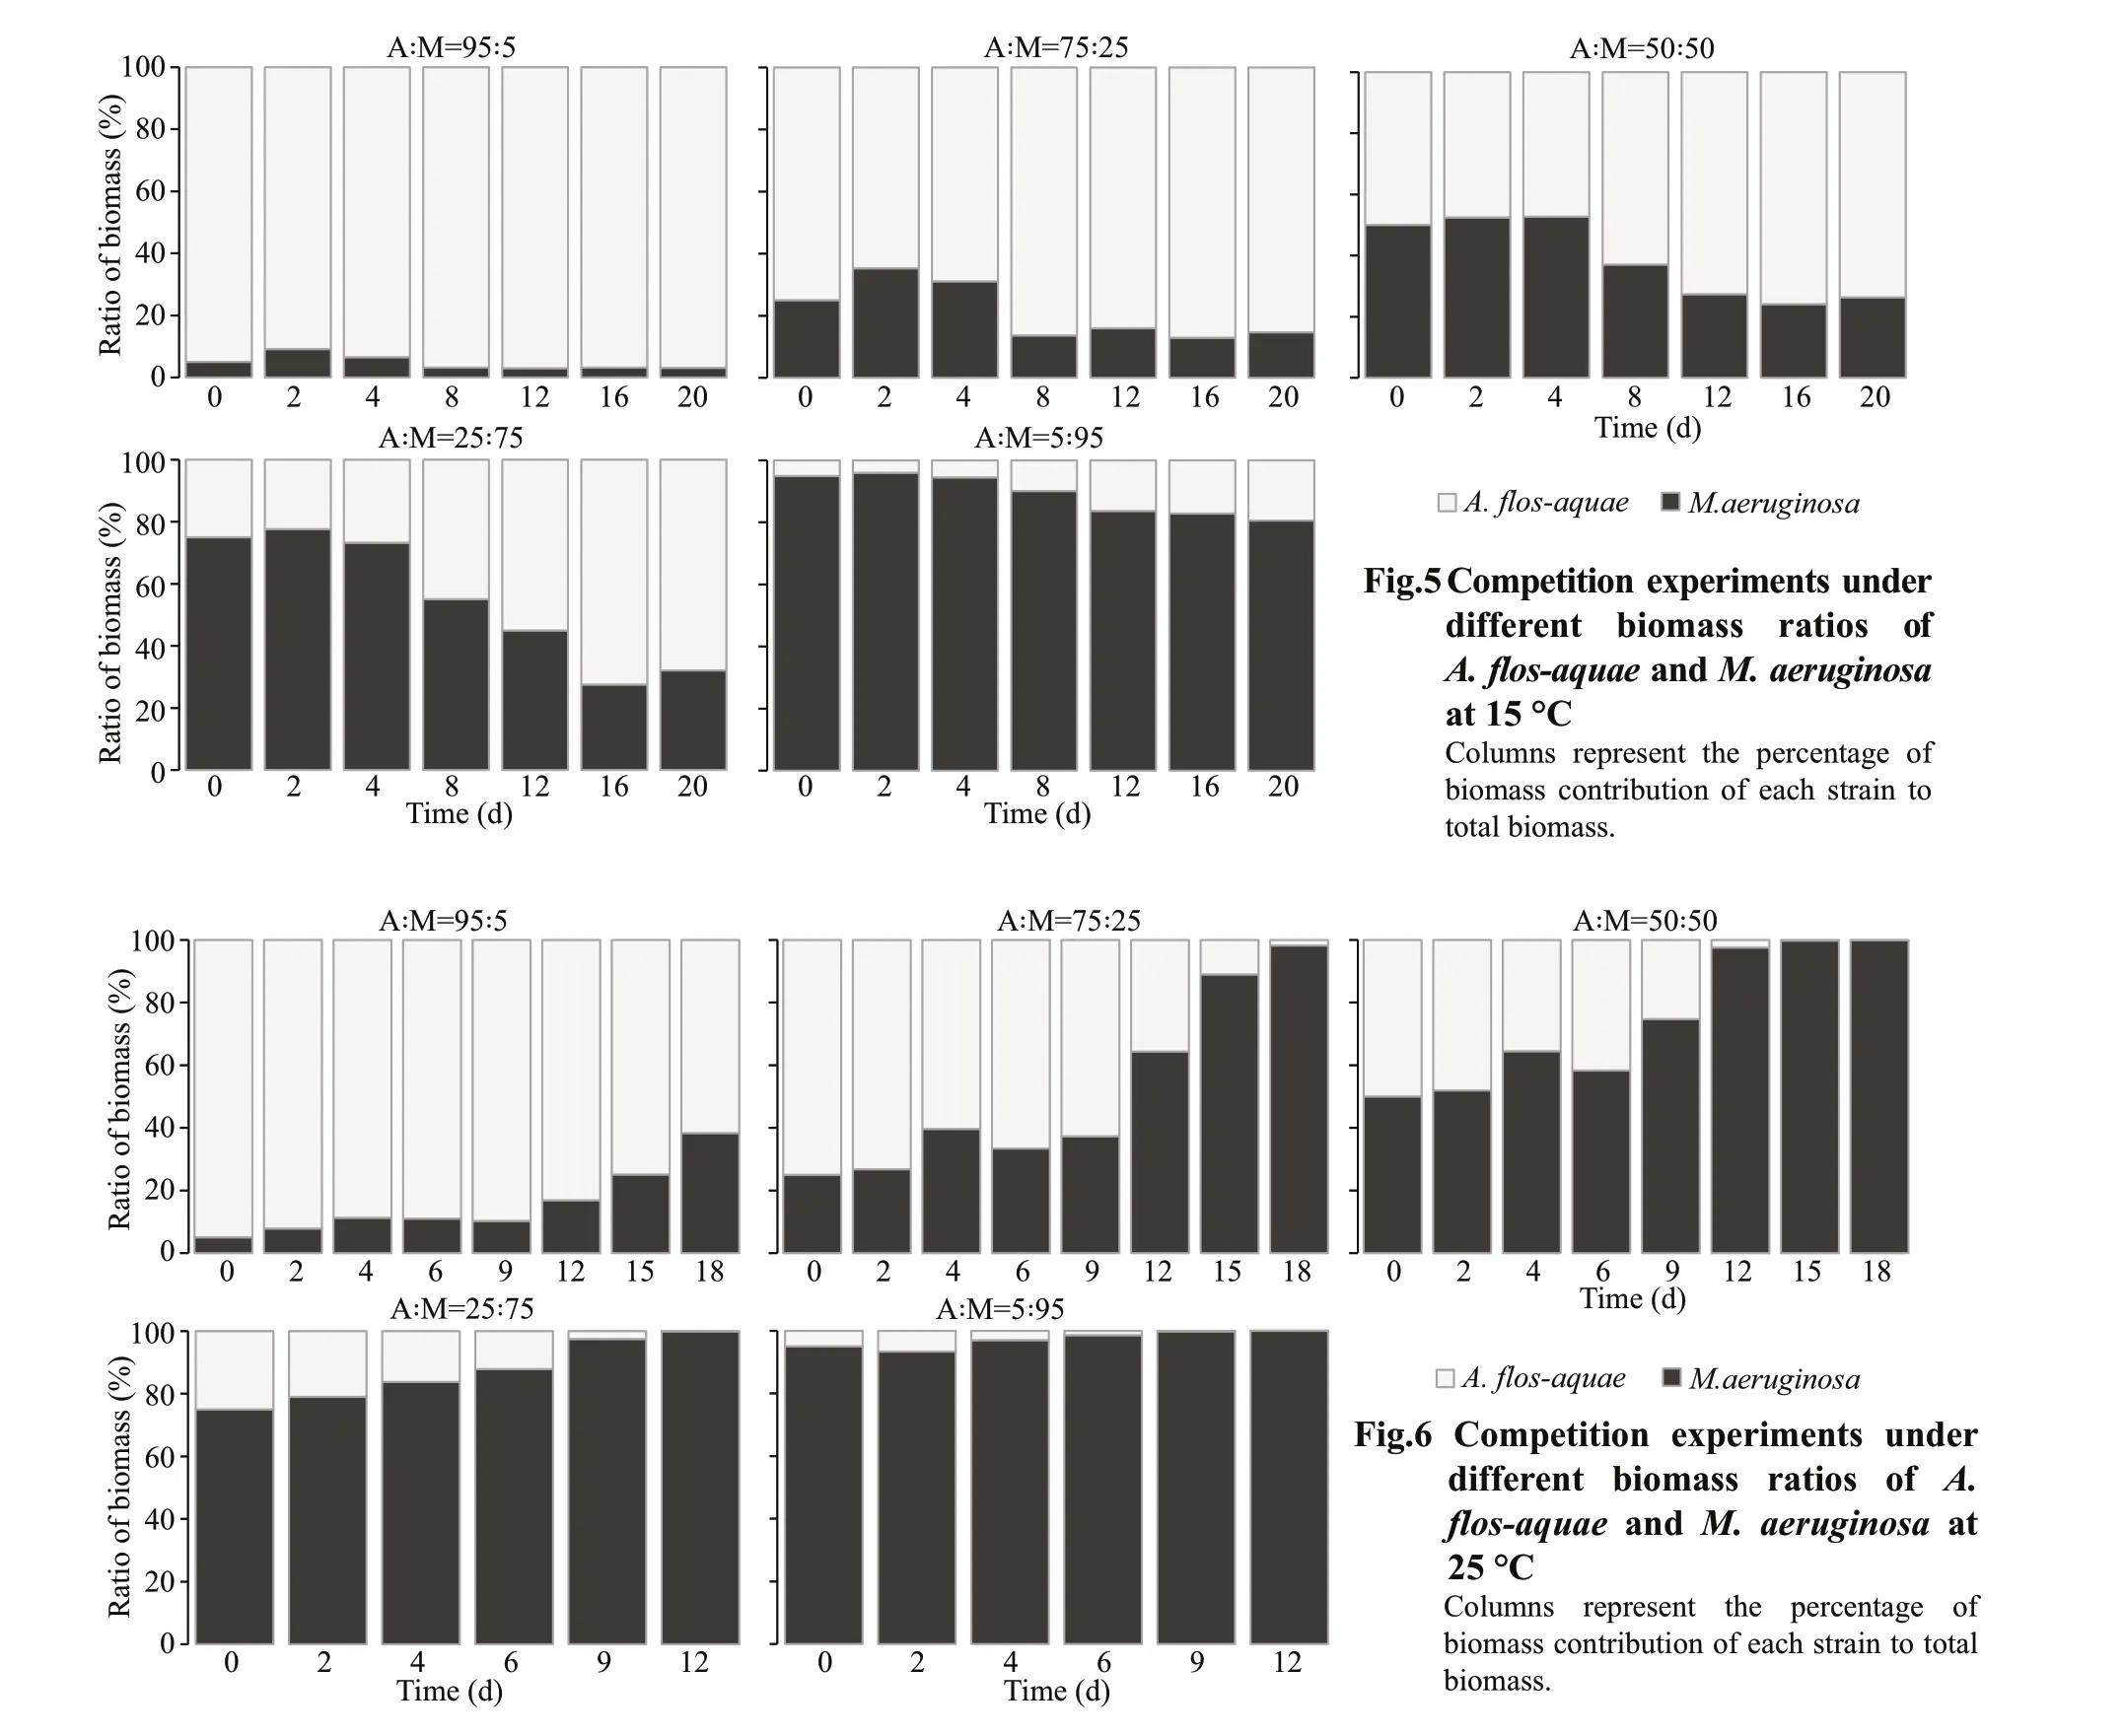
At 15 °C, when the experiment ended, the percentage ofM.aeruginosaas invader dropped to 3.04% from 5.00% in Group C (A∶M=95∶5), compared to the percentage ofA.f los-aquaeas invader up to 19.38% in Group G (A∶M=5∶95) (Fig.5). In Groups D(A∶M=75∶25), E (A∶M=50∶50), and F (A∶M=25∶75),the percentages ofM.aeruginosawent up f irst and then fell to 14.65%, 26.33%, and 32.14%, respectively,whereas the percentages ofA.f los-aquaeincreased up to 85.35%, 73.67%, and 67.86%, respectively on Day 20 (Fig.5). The direct competition experiments betweenA.f los-aquaeandM.aeruginosaat 15 °C indicated that both two species were able to coexist andA.f los-aquaecompletely dominated at the end of the experiment period in the competitive groups.Thus,A.f los-aquaeshowed a stronger competitive ability at 15 °C overM.aeruginosa.
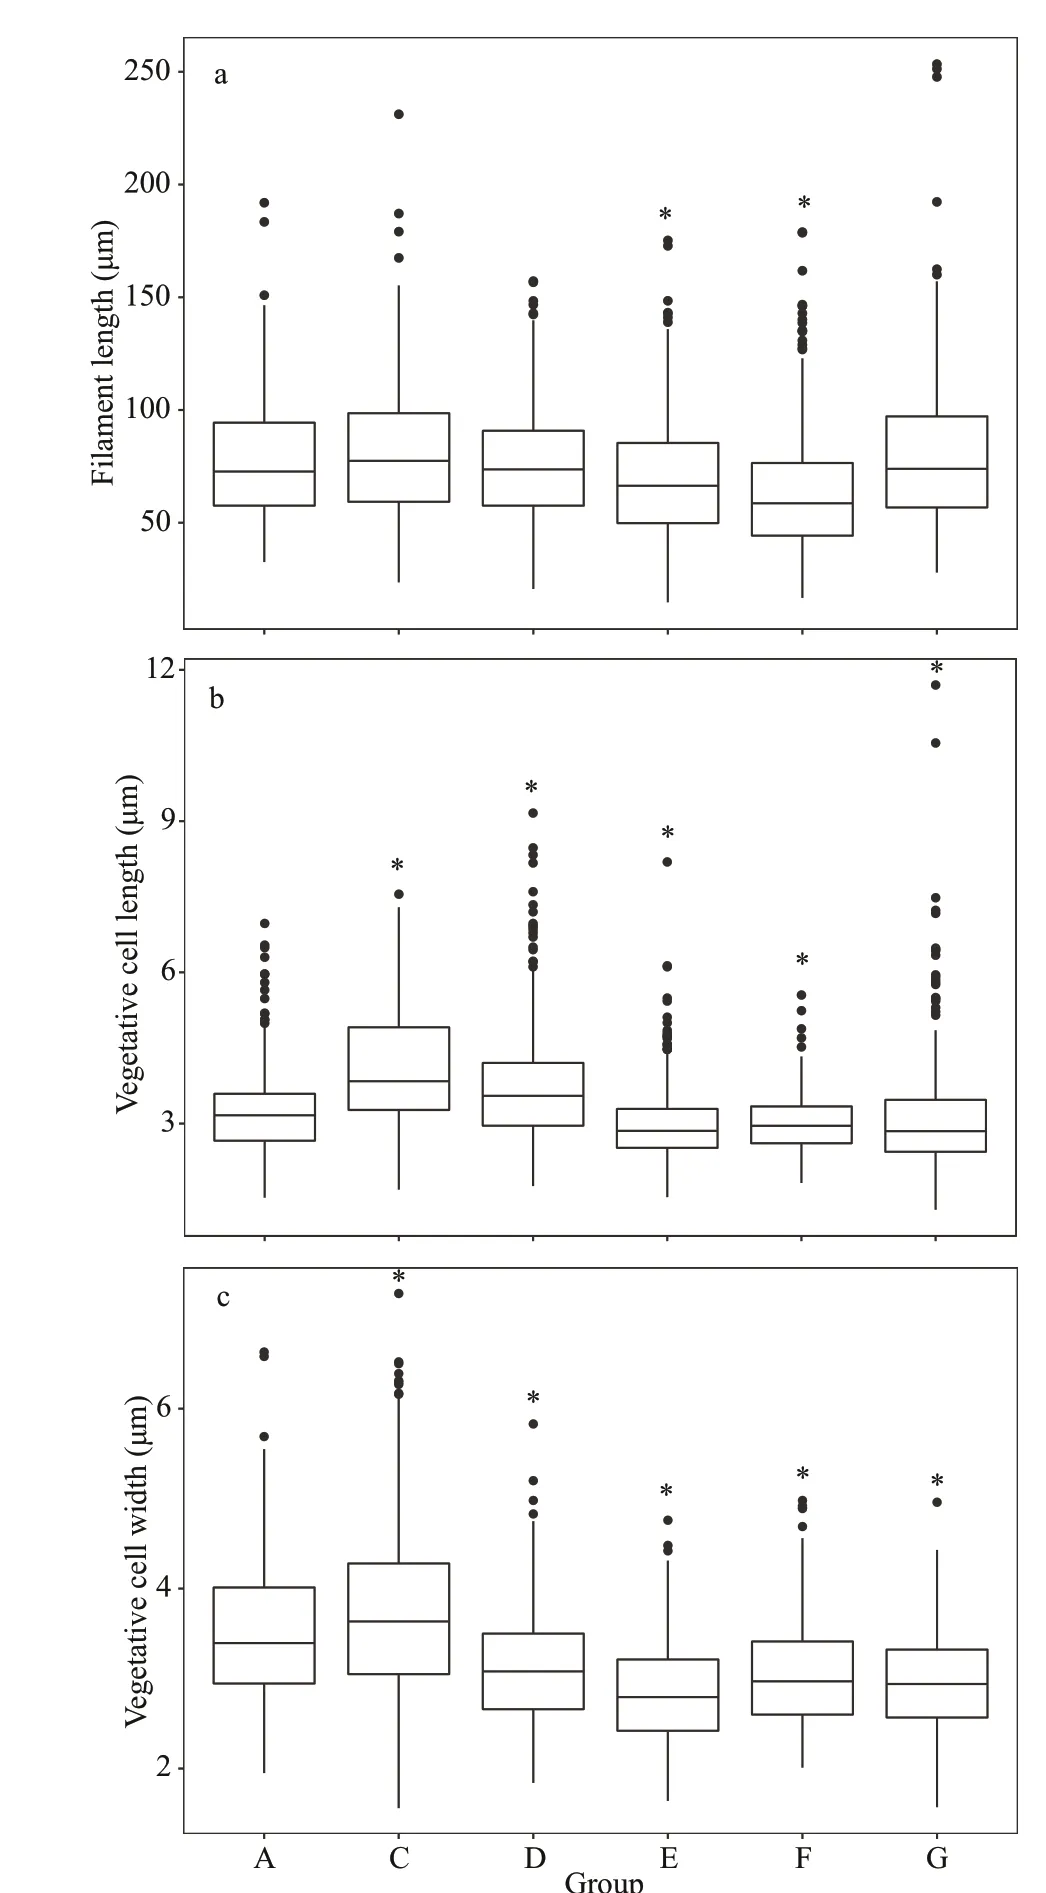
Fig.4 The morphological characteristics of A. f los- aquae in each group on Day 6 at 25 °C
At 25 °C, the relative contribution ofM.aeruginosain total biomass as invader reached 38.34% on Day 18 from initial 5.00% in Group C (A∶M=95∶5), while the percentage ofA.f los-aquaeas invader dropped to nearly zero in Group G (A∶M=5∶95) at the end of experiment (Fig.6). Similarly, in the Groups D(A∶M=75∶25), E (A∶M=50∶50), and F (A∶M=25∶75),the percentages ofM.aeruginosain total biomass increased from 25.00%, 50.00%, 75.00% (Day 0)to 98.23% (Day 18), 99.90% (Day 18), 99.87%(Day 12), completely dominated at the end of the experiment (Fig.6). The competitive outcomes indicated thatA.f los-aquaewas unable to coexist withM.aeruginosain the competitive groups, andM.aeruginosashowed a strong competitive ability at 25 °C.
In the competition experiments betweenA.f losaquaeandM.aeruginosaunder two temperatures, the competitive outcomes were diff erent, and the relative dominance ofA.f los-aquaeandM.aeruginosawas signif icantly aff ected by water temperature (Figs.5-6).
4 DISCUSSION
Understanding the mechanisms of cyanobacterial bloom formation and seasonal succession will help to harness cyanobacterial blooms. Succession of dominant bloom-forming species with seasonal change has frequently occurred in many eutrophic waters worldwide. A large number of studies based on f ield survey have reported the succession from blooms ofA.f los-aquaetoMicrocystisas a typical and common case in the whole bloom period. Researches into the mechanism of the succession have been also conducted based on mainly the monoculture ofA.f los-aquaeorMicrocystis, and co-culture ofA.f losaquaeand ofMicrocystisf iltrates. It was shown that bothMicrocystisandA.f los-aquaewere able to reach optimal growth at 25 °C, butA.f los-aquaeshowed was a stronger competitor againstMicrocystisat 15 °C. On the other hand, the growth ofA.f los-aquaewas signif icantly inhibited byMicrocystisculture at 25 °C in a culture-f iltrate assay system (Ma et al.,2015). Apparently, the results from this study could partially explain the reason for the seasonal succession from blooms ofA.f los-aquaeto those ofMicrocystis,and the mechanisms need to be verif ied in more experiments. Moreover, competition experiments between the two cyanobacterial species shall consider the initial biomass contribution from each of them.
Therefore, we designed an experiment of co-culture system in whichA.f los-aquaewithM.aeruginosawere mixed at 15 °C and 25 °C in diff erent biomasses,to clarify the competition and dominance of the two strains.A.f los-aquaeandM.aeruginosashowed diff erent behaviors in competitiveness at 15 °C and 25 °C. At 15 °C, the two species were more than coexistence, andA.f los-aquaehad a higher specif ic growth rate when its growth was stimulated by the presence ofM.aeruginosa. However, at 25 °C, the growth ofA.f los-aquaewas inhibited by the invasion ofM.aeruginosa, andM.aeruginosacould suppressA.f los-aquaein the competition experiments at last.
Our f indings in the present study showed that the variation of temperature can lead to the succession betweenA.f los-aquaeandM.aeruginosa, and these laboratory results are similar to the seasonal succession ofA.f los-aquaeandM.aeruginosain Dianchi Lake(Wu et al., 2010, 2016). Tsujimura et al. (2001)demonstrated that the optimal temperature forA.f losaquaeranged 23-29 °C and the lowest temperature forA.f los-aquaegrowth was 8 °C and could survive at 5 °C for several days at dim light conditions. Üveges et al. (2012) showed thatA.f los-aquaecould grow over a wide range of temperature, and it could grow slowly in a low-temperature condition and contribute to its succession and dominance in cold ecosystems.
Aphanizomenonf los-aquaeblooms were reported to occur in winter even under the ice cover (Üveges et al., 2012). In this study,A.f los-aquaeshowed quicker growth at 25 °C than at 15 °C. However,A.f losaquaewas depressed byM.aeruginosain co-culture at 25 °C. On the contrary,A.f los-aquaedid not show down the optimal growth at 15 °C, but it still had the competitive advantage overM.aeruginosaat 15 °C in the co-culture. Compared to the previous studies of monoculture and co-culture, this study provided more insight into the low-temperature tolerance ofA.f los-aquaeand its low-temperature intolerance and preference in high temperature withM.aeruginosa(Konopka and Brock, 1978; Robarts and Zohary,1987; Wu et al., 2010; Üveges et al., 2012).
Previous studies have reported that many f ilamentous cyanobacteria have strong phenotypic plasticity, and their morphological characteristics may be inf luenced when exogenous factors changed(Soares et al., 2013; Khan et al., 2017). The competition between diff erent species can also inf luence their morphological traits (Zhu et al., 2015). It has been reported that interactions betweenRaphidiopsisraciborskiiandM.aeruginosacould lead to signif icant changes in f ilament length, cell length, and width ofR.raciborskii(Jia et al., 2020). In this study,A.f losaquaedisplayed certain morphological plasticity in response to the co-culture withM.aeruginosaof a diff erent biomass. All the length and width of vegetative cell were sensitive to the change inM.aeruginosabiomass at two temperatures. At 15 °C,the width of all test groups was signif icantly shorter than that of control group. At 25 °C, the vegetative cell width in all test groups was signif icantly smaller than that of control group except for the Group C. Therefore, the competition betweenM.aeruginosaandA.f los-aquaeshowed a tendency of decrease in the width of vegetative cell ofA.f los-aquae, which contrasts to the result by Jia et al. (2020) showing that the width of vegetative cells ofR.raciborskiiin the test groups were signif icantly greater than that of control group in a competition experiment withM.aeruginosa. Previous studies reported that cell size is a main characteristic that inf luenced the ecological niches of phytoplankton (Litchman et al., 2007; Guan et al., 2020). Nutrient utilization, light utilization,as well as grazer resistance of phytoplankton were proved has a signif icantly correlation with cell size(Bohannan et al., 2002; Finkel et al., 2010; Litchman,2003). To phytoplankton, the trade-off s between these functional traits can improve resource utilization effi ciency and adaptability to environmental changes,thereby facilitating population growth (Violle et al.,2012; Guan et al., 2020). There was also a study reported that small cells had greater competitive advantages than large cells (Grover, 1989), thus we speculated that phenotypic variation maybe was a trade-off strategy adopted byA.f los-aquae. At 15 °C,the signif icant change in f ilament length occurred only in Group F (A∶M=25∶75). Similarly, at 25 °C,the f ilament length ofA.f los-aquaewas signif icantly shorter than that of control group in Groups E and F only. Such results suggested that f ilament length ofA.f los-aquaewas less sensitive to the changes in biomass ofM.aeruginosathan vegetative cells,which is consistent with the study by Jia et al. (2020).Moreover, several previous studies indicated that the changes in f ilament length of cyanobacteria could be aff ected by many factors, for example, turbulence as a main factor could lead to the decrease in f ilament length ofAnabaenacylindricaandA.f los-aquae(Thomas and Gibson, 1990; Xiao et al., 2016).However, the present study did not test the other factors on the morphological changes of f ilaments inA.f los-aquaeduring the co-culture competition experiments, which will be studied in the future.
5 CONCLUSION
Based on direct co-culture experiments, we provide a new insight into the succession betweenA.f los-aquaeandM.aeruginosaduring a whole bloom process, and conf irm that temperature is the dominating factor on the alternant succession ofA.f los-aquaeandM.aeruginosaconsidering the initial biomass ratios of the both strains under specif ic conditions of this study. However, in the f ield, the succession and competition betweenA.f los-aquaeandMicrocystiswere controlled by more environmental factors or combination of these factors, not only by the temperature. Thus, in order to better understand the mechanism of succession betweenA.f los-aquaeandMicrocystisspecies, the nutrition level, especially the nitrogen concentration or total nitrogen : total phosphorus ration should be taken into consideration in terms of N2-f ixing ability forA.f los-aquaeand non-N2-f ixing ability forMicrocystisin the future.
6 DATA AVAILABILITY STATEMENT
All data generated and/or analyzed during this study are available from the corresponding author on reasonable request.
7 ACKNOWLEDGMENT
We thank the Wuhan Branch, Supercomputing Center, Chinese Academy of Sciences, for providing computing facilities, and all staff from the Analysis and Testing Center at Institute of Hydrobiology, CAS,for technical supports.
 Journal of Oceanology and Limnology2022年5期
- Journal of Oceanology and Limnology的其它文章
- Comparison of three f locculants for heavy cyanobacterial bloom mitigation and subsequent environmental impact*
- Eff ect of light intensity on bound EPS characteristics of two Microcystis morphospecies: the role of bEPS in the proliferation of Microcystis*
- Community structure of aerobic anoxygenic phototrophic bacteria in algae- and macrophyte-dominated areas in Taihu Lake, China*
- Tidal water exchanges can shape the phytoplankton community structure and reduce the risk of harmful cyanobacterial blooms in a semi-closed lake*
- Eff ect of random phase error and baseline roll angle error on eddy identif ication by interferometric imaging altimeter*
- Estimating the evolution of sea state non-Gaussianity based on a phase-resolving model*
