Eff ect of light intensity on bound EPS characteristics of two Microcystis morphospecies: the role of bEPS in the proliferation of Microcystis*
Xianzhe WANG , Xingye HAN , Hongmei GE ,**
1 School of Civil Engineering, Architecture and Environment, Hubei University of Technology, Wuhan 430068, China
2 Hubei Key Laboratory of Ecological Restoration for River-Lakes and Algal Utilization, Wuhan 430068, China
Abstract Bound extracellular polymeric substances (bEPS) play an important role in the proliferation of Microcystis. However, the understanding of bEPS characterization remains limited. In this study, threedimensional f luorescence excitation-emission matrix (3D-EEM) spectroscopy and zeta potentiometer were used to characterize the loosely bound EPS (LB-EPS) and tightly bound EPS (TB-EPS) from two dominant Microcystis morphospecies from Taihu Lake (China) at diff erent light intensities. Physiochemical analysis showed that the growth and TB-EPS or bEPS contents in Microcystis aeruginosa were higher than those in Microcystis f los- aquae at each light intensity. The 3D-EEM contour demonstrated that the intensities of peak B (tryptophan-like substances) in the TB-EPS from M. aeruginosa were stronger than those from M. f losaquae when the light intensity was higher than 10 μE/(m 2·s). Zeta potential analysis showed that the absolute values of the zeta potential of TB-EPS in the two species both increased with rising light intensity, except those of TB-EPS in M. aeruginosa at 105 μE/(m 2·s). Moreover, the absolute values of the zeta potential of M. aeruginosa were higher than those of M. f los- aquae at each light intensity. All these results indicated that M. aeruginosa may more quickly proliferate than M. f los- aquae through increased negative charges, bEPS contents, growth, and tryptophan-like substance contents at certain light intensities.
Keyword: Microcystis; bound extracellular polymeric substances; light intensity; zeta potential
1 INTRODUCTION
Cyanobacterial blooms result in disastrous ecosystem eff ects and degrade the water quality in drinking water, recreation, f isheries, and human health(Huisman et al., 2018).Microcystis, one of the most cosmopolitan genera of bloom-forming cyanobacteria,has been found in at least 108 countries worldwide(Harke et al., 2016). Colony formation could provideMicrocystiswith many ecological advantages,including sustained growth under poor nutrient condition, adaption to varying light, protection from grazing, and chemical stressor grazing (Yamamoto et al., 2011; Gan et al., 2012; Li et al., 2016; Xiao et al., 2018). Thus, the colony formation ofMicrocystisis regarded as a contributor to bloom formation and the competitive success of this genus in freshwater ecosystems (Yamamoto et al., 2011; Tan et al., 2020).
The extracellular polymeric substances(EPS) of cyanobacteria are mainly composed of polysaccharides, proteins, amino acids, and humic substances. The contents and compositions of EPS were reported to play an important role in the proliferation ofMicrocystisthrough processes, such as cell adhesion and aggregation (Yang et al., 2008;Xiao et al., 2017). Therefore, insights into EPS characterization are very crucial for an enhanced understanding on the growth, competitive advantages,and proliferation ofMicrocystis.
The EPS ofMicrocystiscould be divided into soluble EPS (SL-EPS) released into the surrounding environment and bound EPS (bEPS) associated with the cell surface. bEPS exhibit a dynamic doublelayered structure (Yang et al., 2008; Qu et al., 2012),and they could be further distinguished into loosely bound EPS (LB-EPS) and tightly bound EPS (TBEPS) (Li and Yang, 2007; Sheng et al., 2010; Xu et al., 2010). These two types are the main contributor to the size and tightness ofMicrocystiscolonies (Li et al., 2013; Tan et al., 2020). Cyanobacterial EPS contain charged groups, such as sulphate groups,uronic acids, hydroxyl, amine, and carboxylic groups,which are all essential for determining their binding capacity, biomineralization, and adhesion properties(Dittrich and Sibler, 2005; Pokrovsky et al., 2008).The electrostatic or hydrophobicity interactions on the surface are the main adhesion mechanism of cell surfaces, and they could be presented by zeta potential and hydrophobicity, respectively (Sirmerova et al., 2013). Recently, protein- and humic acidlike substances have been found in EPS (Xu et al.,2013a; Xiao et al., 2019). Xu et al. (2013a) found that tryptophan- and humic-like substances were associated with the growth ofMicrocystisaeruginosa.Xiao et al. (2019) reported that humic acid-like components were involved in the colony formation and colony-size growth ofMicrocystis.
The light in photoautotrophic metabolism is the energy provider for cyanobacterial growth. Changes in light quality, light intensity, and light/dark cycles have a signif icant inf luence on the production of cyanobacterial EPS (Ge et al., 2014; Han et al., 2015;Xu et al., 2016; Cruz et al., 2020). Continuous light and high light intensities are generally favorable for EPS production (Ge et al., 2014; Han et al., 2015).Some studies found that low light intensity is a good strategy to increase EPS production. In addition,light intensities could signif icantly aff ect the contents of protein and polysaccharides in EPS (Phélippé et al., 2019). However, how light intensity aff ects the EPS characterization ofMicrocystisis yet to be fully understood.
Nutrient concentrations, species density, light,temperature, allelopathy, and dissolved organic/inorganic compounds aff ectMicrocystisspecies competition (Zhai et al., 2013; Yue et al., 2014; Xu et al., 2016). Recent studies focused on the inf luence of zeta potential onMicrocystisspecies competition in Taihu Lake, China (Liu et al., 2016). Some evidence indicated that zeta potential could be used as a good index for cell surface characterization and to studyMicrocystiscolony formation (Liu et al., 2016; Tan et al., 2020). The specif ic composition of EPS could be determined by f luorescence excitation-emission matrix (EEM) spectroscopy. In aquatic environments,Microcystisis exposed to a changing light environment due to mixing events and the vertical migration controlled by its buoyancy regulation (Walsby et al.,1997; Huisman et al., 2004).MicrocystisaeruginosaandMicrocystisf los-aquaeare common dominant bloom morphospecies in Taihu Lake, China. They are the predominant species in May, June, July, and November among diff erent long-term sampling sites, whileM.aeruginosais more dominant thanM.f los-aquaein June and July (Chen et al., 2009).However, the response of growth and proliferation ofM.aeruginosaandM.f los-aquaeto changing light intensities is yet to be fully understood. Therefore, in this paper, the growth, composition, hydrophobicity,and zeta potential of bEPS fromM.aeruginosaandM.f los-aquaewere investigated under diff erent light intensities to provide a new perspective on the role of bEPS inMicrocystisproliferation.
2 MATERIAL AND METHOD
2.1 Algal species and culture conditions
Unicellular cyanobacteriaM.aeruginosa(FACHB-905) andM.f los-aquae(FACHB-1344)were purchased from the Institute of Hydrobiology,Chinese Academy of Sciences. The algal solution was placed in a conical f lask and cultured in BG-11 medium (Stanier et al., 1971) under the conditions of incandescent lamp illumination of 40-μE/(m2·s)light intensity with the light∶dark cycle of 12 h∶12 h at 25 °C. Before culture, the required glassware medium was sterilized at 121 °C for 30 min.
Cells in the exponential growth phase were diluted with BG11 medium to achieve an initial cell density of approximately 5×10⁶cells/mL. Experiments were carried out at light intensities of 10, 35, 70, and 105 μE/(m2·s) on a 12-h∶12-h light∶dark cycle at the temperature of 25 °C±1 °C. All strains were cultured in triplicate and maintained in 250-mL Erlenmeyer f lasks containing 200 mL of sterilized BG-11 medium.The initial pH of the BG-11 medium was adjusted to 7.2. All the f lasks were shaken by hand two times every day to maintain culture homogeneity.
2.2 Growth measurement and morphological observations
Growth was measured at 1-day interval in terms of cell numbers. The cells were counted using a blood-cell counting chamber (Wang et al., 2010).For the specif ic growth rate (μ) ofM.aeruginosaandM.f los-aquaeat diff erent light intensities was calculated according to the method described by Xu et al. (2016). The diameter of the twoMicrocystismorphospecies at the mid-logarithmic growth phase was also observed by transmission electron microscopy (TEM, Hitachi H-7000FA). For TEM observation, samples were processed as described by Chen et al. (2019). First, samples were f ixed with 3%glutaraldehyde in cacodylate buff er and then f ixated in 1% osmium tetroxide. Second, the samples were dehydrated in graded ethanol (30%, 50%, 70%, 90%,95%, and 100%) and then implanted with Epon resin.Last, ultrathin sections were sliced with a diamond knife and stained with 3% uranyl acetate and lead citrate. Thirty measurements of each strain diameter were carried on individual cells to compare the size of the twoMicrocystisspecies.
2.3 Maximal chlorophyll f luorescence of photosystem II (PSII) ( F v/ F m) measurement
Chlorophyll f luorescence was measured using a pulse amplitude modulated f luorometer (WATERPAM, Walz, Germany). The twoMicrocystisspecies were dark adapted for 10 min before determining the f luorescence parameterFv/Fm. The saturating light pulse was 1 500 μE/(m2·s).
2.4 bEPS extraction and measurement
bEPS extraction was performed in accordance with the method reported by Xu et al. (2013a). First,samples (10 mL) were centrifuged at 2 500×gfor 15 min, and the supernatant was removed. Second,the harvested algal samples were suspended in 0.05% NaCl solution and centrifuged at 5 000×gfor 15 min. The supernatant was collected carefully to measure LB-EPS. Third, the remaining algae samples were resuspended in 0.05% NaCl solution and then heated at 60 °C for 30 min. The extracted solutions were centrifuged at 15 000×gfor 20 min,with the supernatant as the TB-EPS fraction. Finally,all the EPS fractions were f iltered out using a 0.45-μm polytetraf luoroethylene (PTFE) membrane. The polysaccharide contents of bEPS were measured by phenol sulfuric acid method (Dubois et al., 1956),using glucose as the standard. The protein contents in bEPS were measured via Bradford method (Bradford,1976), and the standard curve was constructed using bovine serum albumin.
2.5 Fluorescence EEM determination
The bEPS extracted by the above method at day 20 was used for f luorescence EEM spectrum analysis. Fluorescence EEM was measured using a Thermo Scientif ic Lumina f luorescence spectrometer(Thermo Fisher Scientif ic, USA) in scan mode with a 700-voltage xenon lamp at room temperature(25±1 °C). The EEM spectra were used with scanning emission (Em) spectra from 250 nm to 550 nm at 2-nm increments, and the excitation (Ex) wavelengths were set from 200 nm to 450 nm at 10-nm increments. The spectra were recorded at a scan rate of 1 200 nm/min,and the slit bandwidths of Ex and Em were both 5 nm(Xu et al., 2013a). Blank scans were performed using Milli-Q water.
2.6 Hydrophobicity analysis
The hydrophobicity of the cell surface was determined by bacterial-adhesion-to-hydrocarbon method (Fattom and Shilo, 1984). Cultured algal suspension at day 20 was harvested directly, with centrifugation of 12 000×gfor 15 min. Then, the algal cells were washed twice with phosphate-buff ered saline (PBS, 10 mmol/L, pH 7.2) and suspended in PBS until the optical density at 560 nm (OD560) was about 0.9. A volume of 2 mL of xylene was added to 5 mL of cell suspension. The two-phase system was vortexed for 1 min and settled for 10 min. The OD560of the lower aqueous phase was determined. The hydrophobicity of the algal solution is expressed as follows:

whereHrefers to hydrophobicity, ODirepresents the initial algal solution OD560, and ODfrepresents the f inal algal solution OD560.
2.7 Zeta potential analysis
In this study, a laser particle sizer and a zeta potentiometer (NanoBrook ZetaPlus US) were used to determine the zeta potentials of the two types of bEPS (pH 7.0) andMicrocystiscells (pH 7.0) at 25°C. 50 mL of cultured algal suspension at 20 days was used to extract bEPS, and the bEPS extraction was performed as above. Finally, the supernatants containing bEPS were dialyzed using the method reported by Ge et al. (2014). The zeta potentials of the two types of bEPS were determined. The zeta potential ofMicrocystiscells were performed according to Hadjoudja et al. (2010). A volume of 25 mL of algal suspension at day 20 was harvested with centrifugation of 10 000×gfor 10 min and resuspended in 15 mL of 0.1-mol/L NaNO3. The cell suspensions were used to determine the zeta potential ofMicrocystiscells. All measurements were carried out in triplicate.
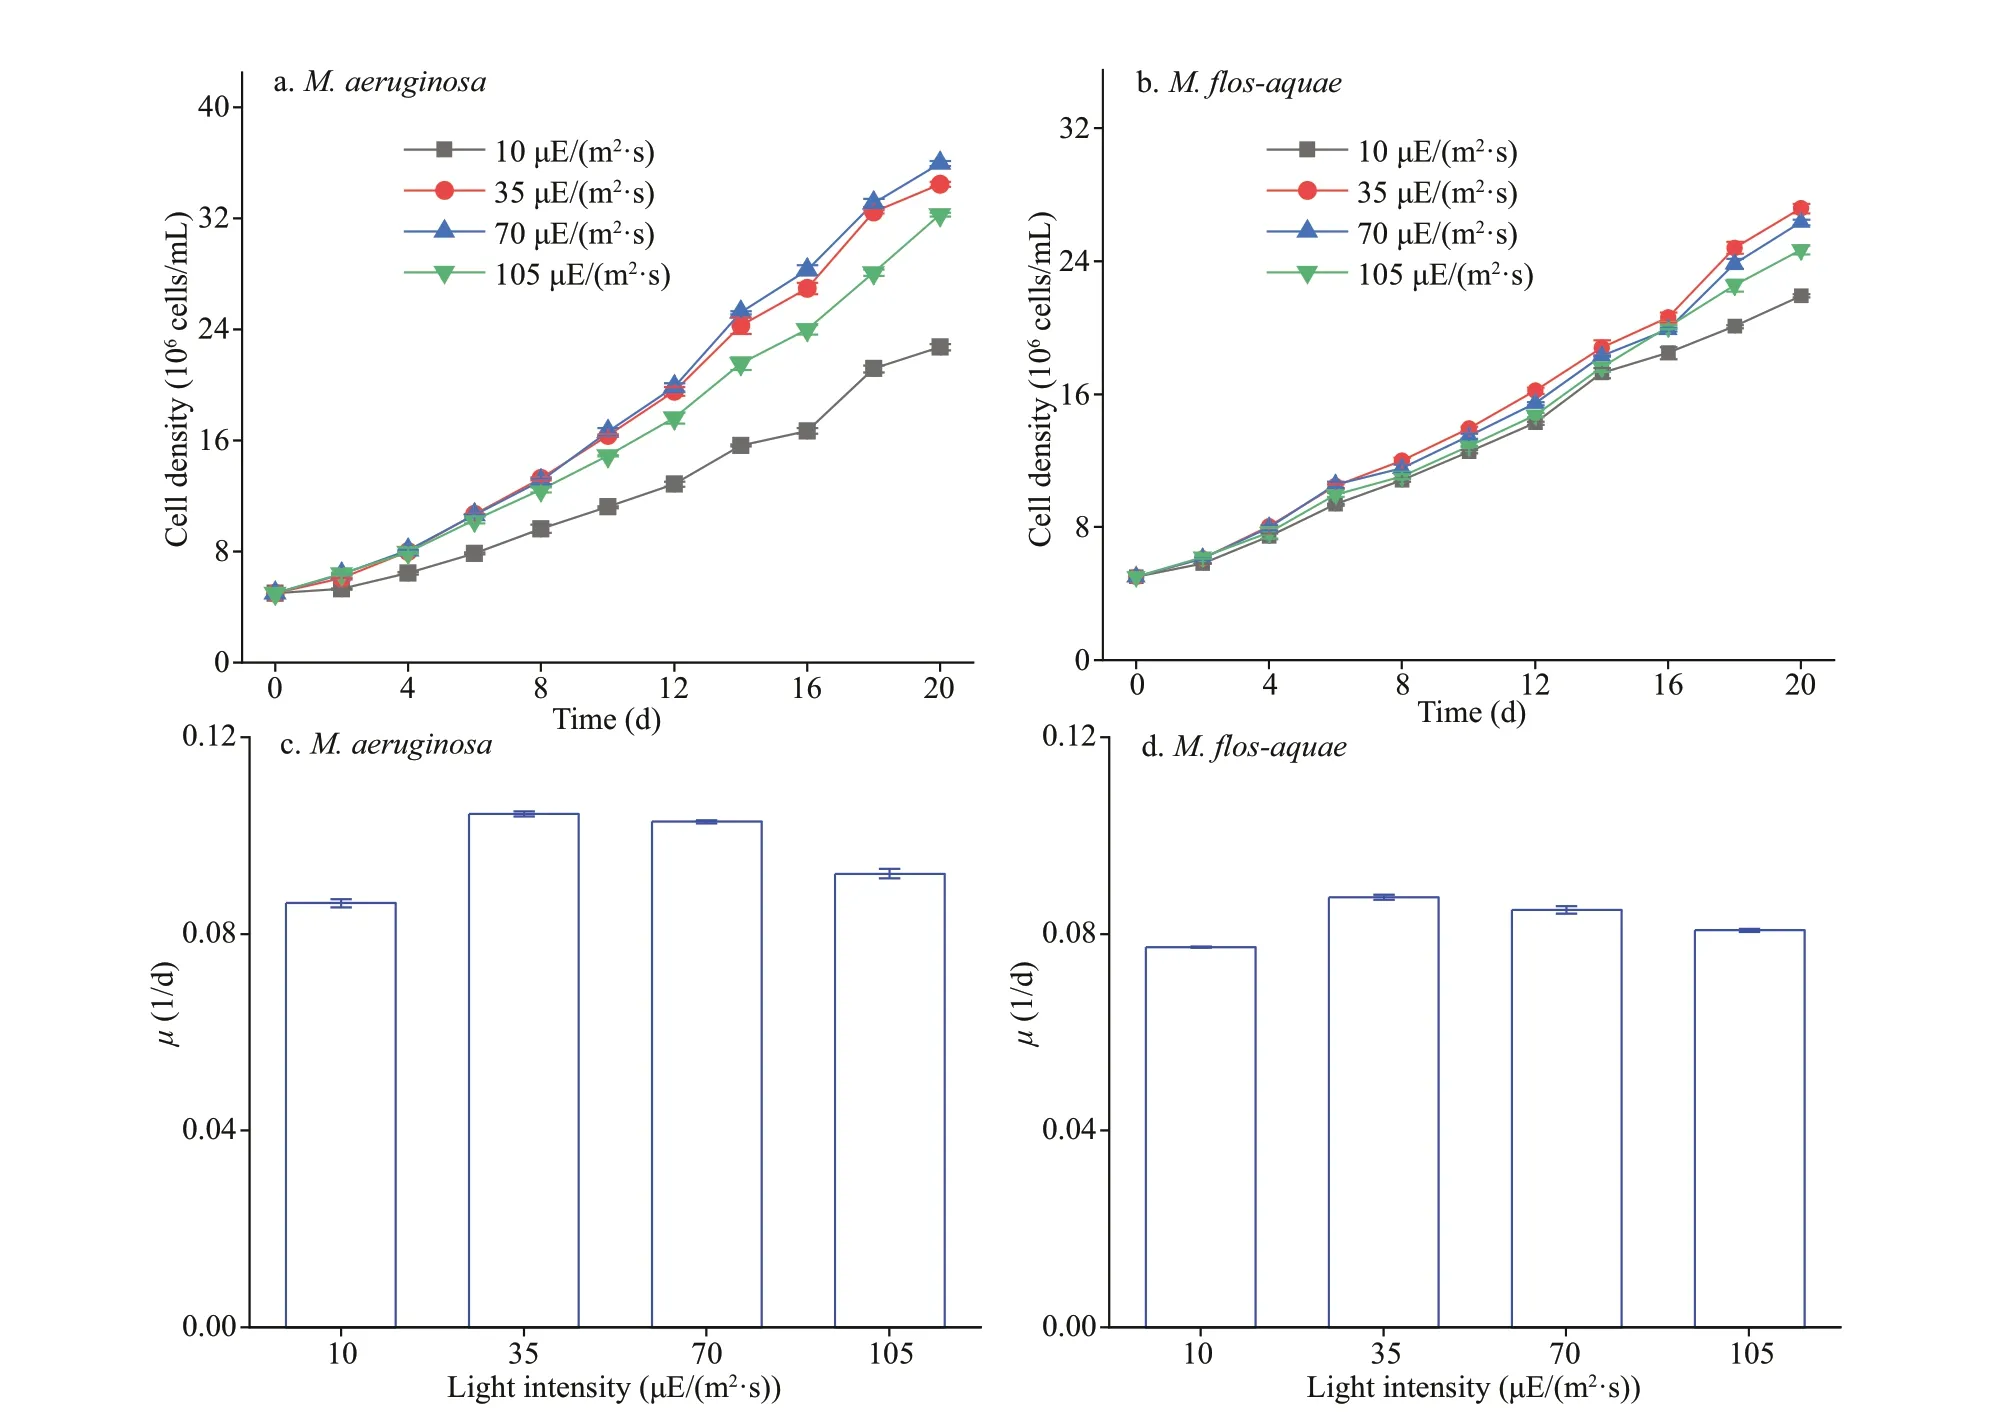
Fig.1 The growth curve of the two Microcystis species at diff erent light intensities
2.8 Data analysis
Data were expressed as mean±standard deviation(SD). The signif icant diff erences among treatments were analyzed by ANOVA using Tukey’s post-hoc test on SPSS 26.0.P<0.05 was considered signif icant diff erence, whileP<0.01 indicated extremely signif icant diff erence. Graphs were carried out on Origin 18.0.
3 RESULT
3.1 Growth of the two Microcystis species at diff erent light intensities
Figure 1 shows the growth curve of the twoMicrocystisspecies at diff erent light intensities.Along with prolongation of the culture time, the growth ofM.aeruginosawas signif icantly higher than that ofM.f los-aquaeunder the selected light intensities (P<0.05). The growth of the two species was the slowest at 10 μE/(m2·s) (P<0.01), while that at 105 μE/(m2·s) was slightly higher than that under 10 μE/(m2·s) (P<0.01; Fig.1).M.aeruginosahad the highest growth at 70 μE/(m2·s) (P<0.05),with the ultimate algal density of 3.59×10⁷cells/mL(Fig.1a).M.f los-aquaehad the maximum value at 35 μE/(m2·s) (P<0.05), with the ultimate algae density of 2.72×10⁷cells/mL (Fig.1b). However, the two species exhibited signif icant growth inhibition at 105 μE/(m2·s) (P<0.05; Fig.1). Moreover, 10 μE/(m2·s)had a negligible eff ect on the growth ofM.f los-aquaebefore 14 days.
Figure 2 shows the diameter of the twoMicrocystisspecies at the mid-logarithmic growth phase.M.aeruginosaandM.f los-aquaewere 2.66±0.4 and 1.49±0.3 μm in diameter, respectively (Fig.2a-b).The diameter ofM.aeruginosawas larger than that ofM.f los-aquae(P<0.05).
3.2 Photosynthetic activities of the two Microcystis species at diff erent light intensitie
The maximum photochemical yield of PSII,represented byFv/Fm, all decreased with increasing light intensity, except at 10 μE/(m2·s) inM.aeruginosa(Fig.3a). As shown in Fig.3, theFv/FmofM.f los-aquaewas obviously higher than that ofM.aeruginosain 70 μE/(m2·s) after 8 days (P<0.05). TheFv/FmofM.aeruginosawas obviously higher than that ofM.f losaquaein 35 μE/(m2·s) after 4 days (P<0.01). However,theFv/Fmbetween the two species did not exhibit obvious diff erences at 105 μE/(m2·s) (P>0.05, Fig.3a-b).
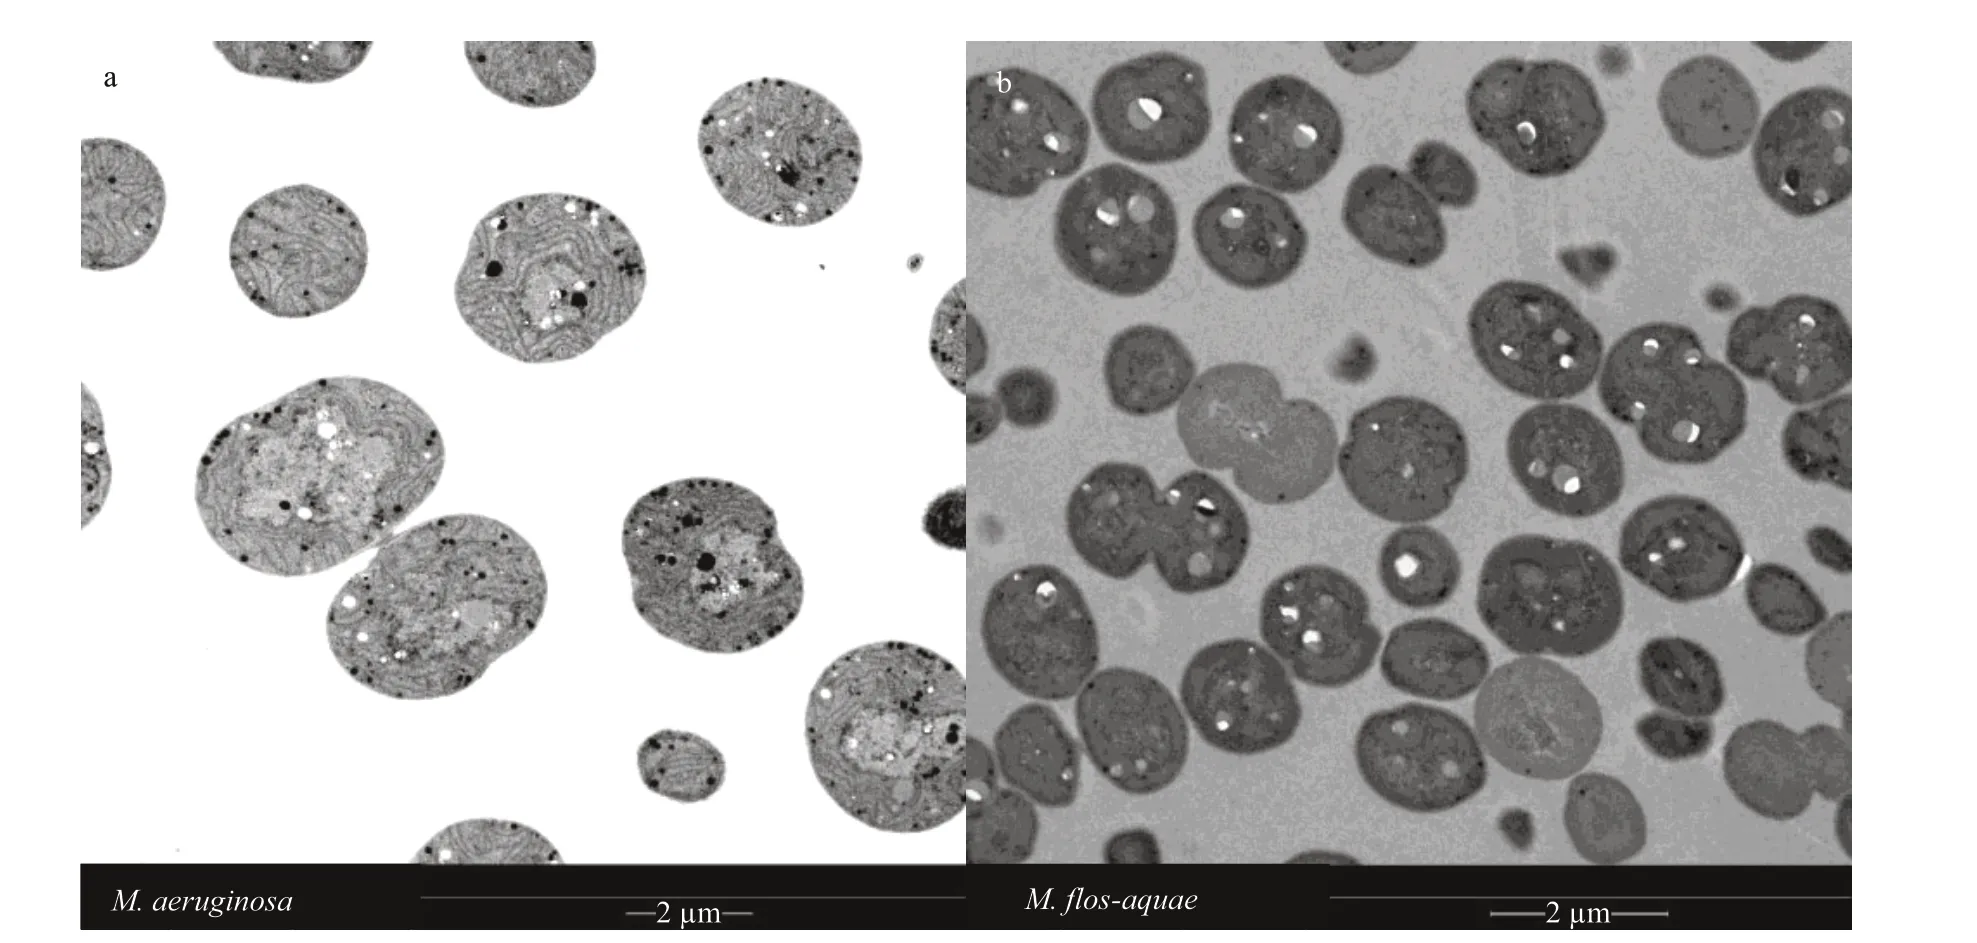
Fig.2 TEM images of the two Microcystis species at the mid-logarithmic growth phase in BG11 medium
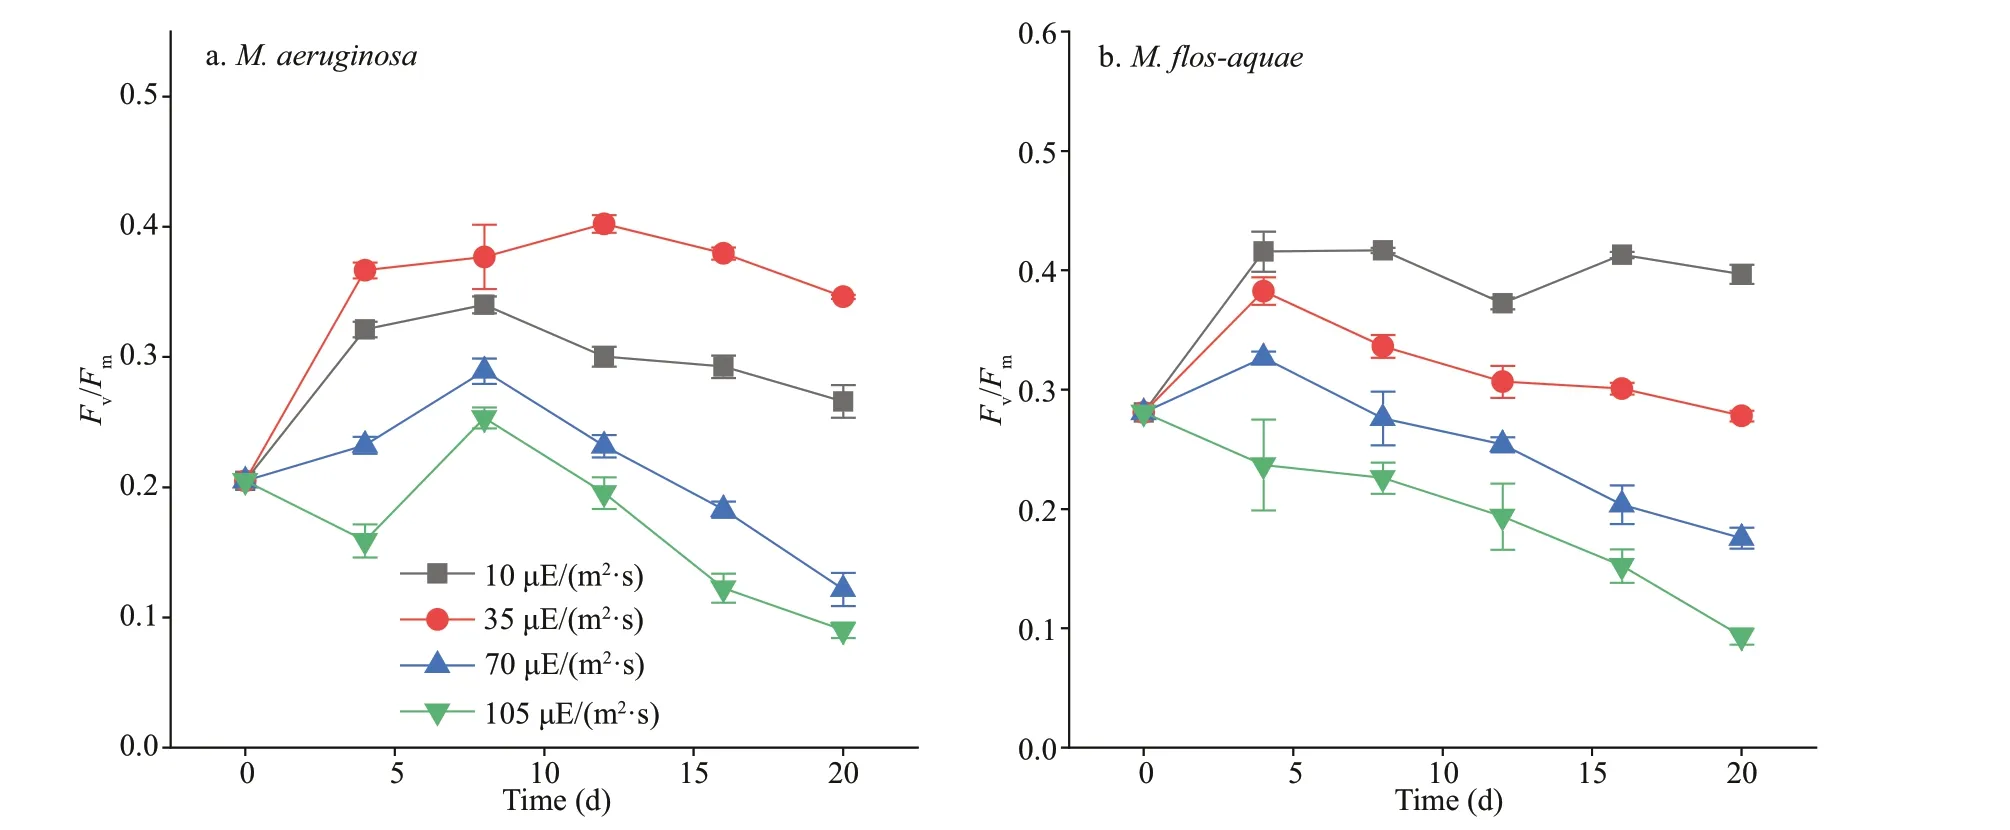
Fig.3 The F v/ F m of the two Microcystis species at diff erent light intensities
3.3 Variations of polysaccharides in bEPS of the two Microcystis species at different light intensities
All changes in the polysaccharide contents in bEPS of the two species are depicted in Fig.4. The polysaccharide contents in the LB-EPS, TB-EPS,and bEPS of the twoMicrocystisspecies showed an obvious decrease under all light intensities with incubation time. The polysaccharide contents in the TB-EPS or bEPS ofM.aeruginosaincreased with increasing light intensity, except at 105 μE/(m2·s)(Fig.4b & e). InM.f los-aquae, the polysaccharide contents of TB-EPS or bEPS showed no obvious interspecif ic variation under diff erent light intensities(P>0.05; Fig.4d & f). In addition, the polysaccharide content in TB-EPS was higher over time than that in the LB-EPS ofM.aeruginosaat the same light intensity(P<0.01; Fig.4a-b). However, the polysaccharide contents between LB-EPS and TB-EPS inM.f losaquaedid not show signif icant diff erences at the same light intensity (P>0.05; Fig.4c-d). As shown in Fig.4,after 4 days of culture, the polysaccharide contents in the TB-EPS or bEPS ofM.aeruginosawere obviously higher than those ofM.f los-aquaeat each light intensity (P<0.05). However, the polysaccharide contents of LB-EPS between the two species did not exhibit obvious diff erences after 8 days (P>0.05;Fig.4a & c). Furthermore, Fig.4c shows that the polysaccharide contents in the LB-EPS ofM.f losaquae was the highest under 10 μE/(m2·s) of light intensity after 16 days (P<0.01).
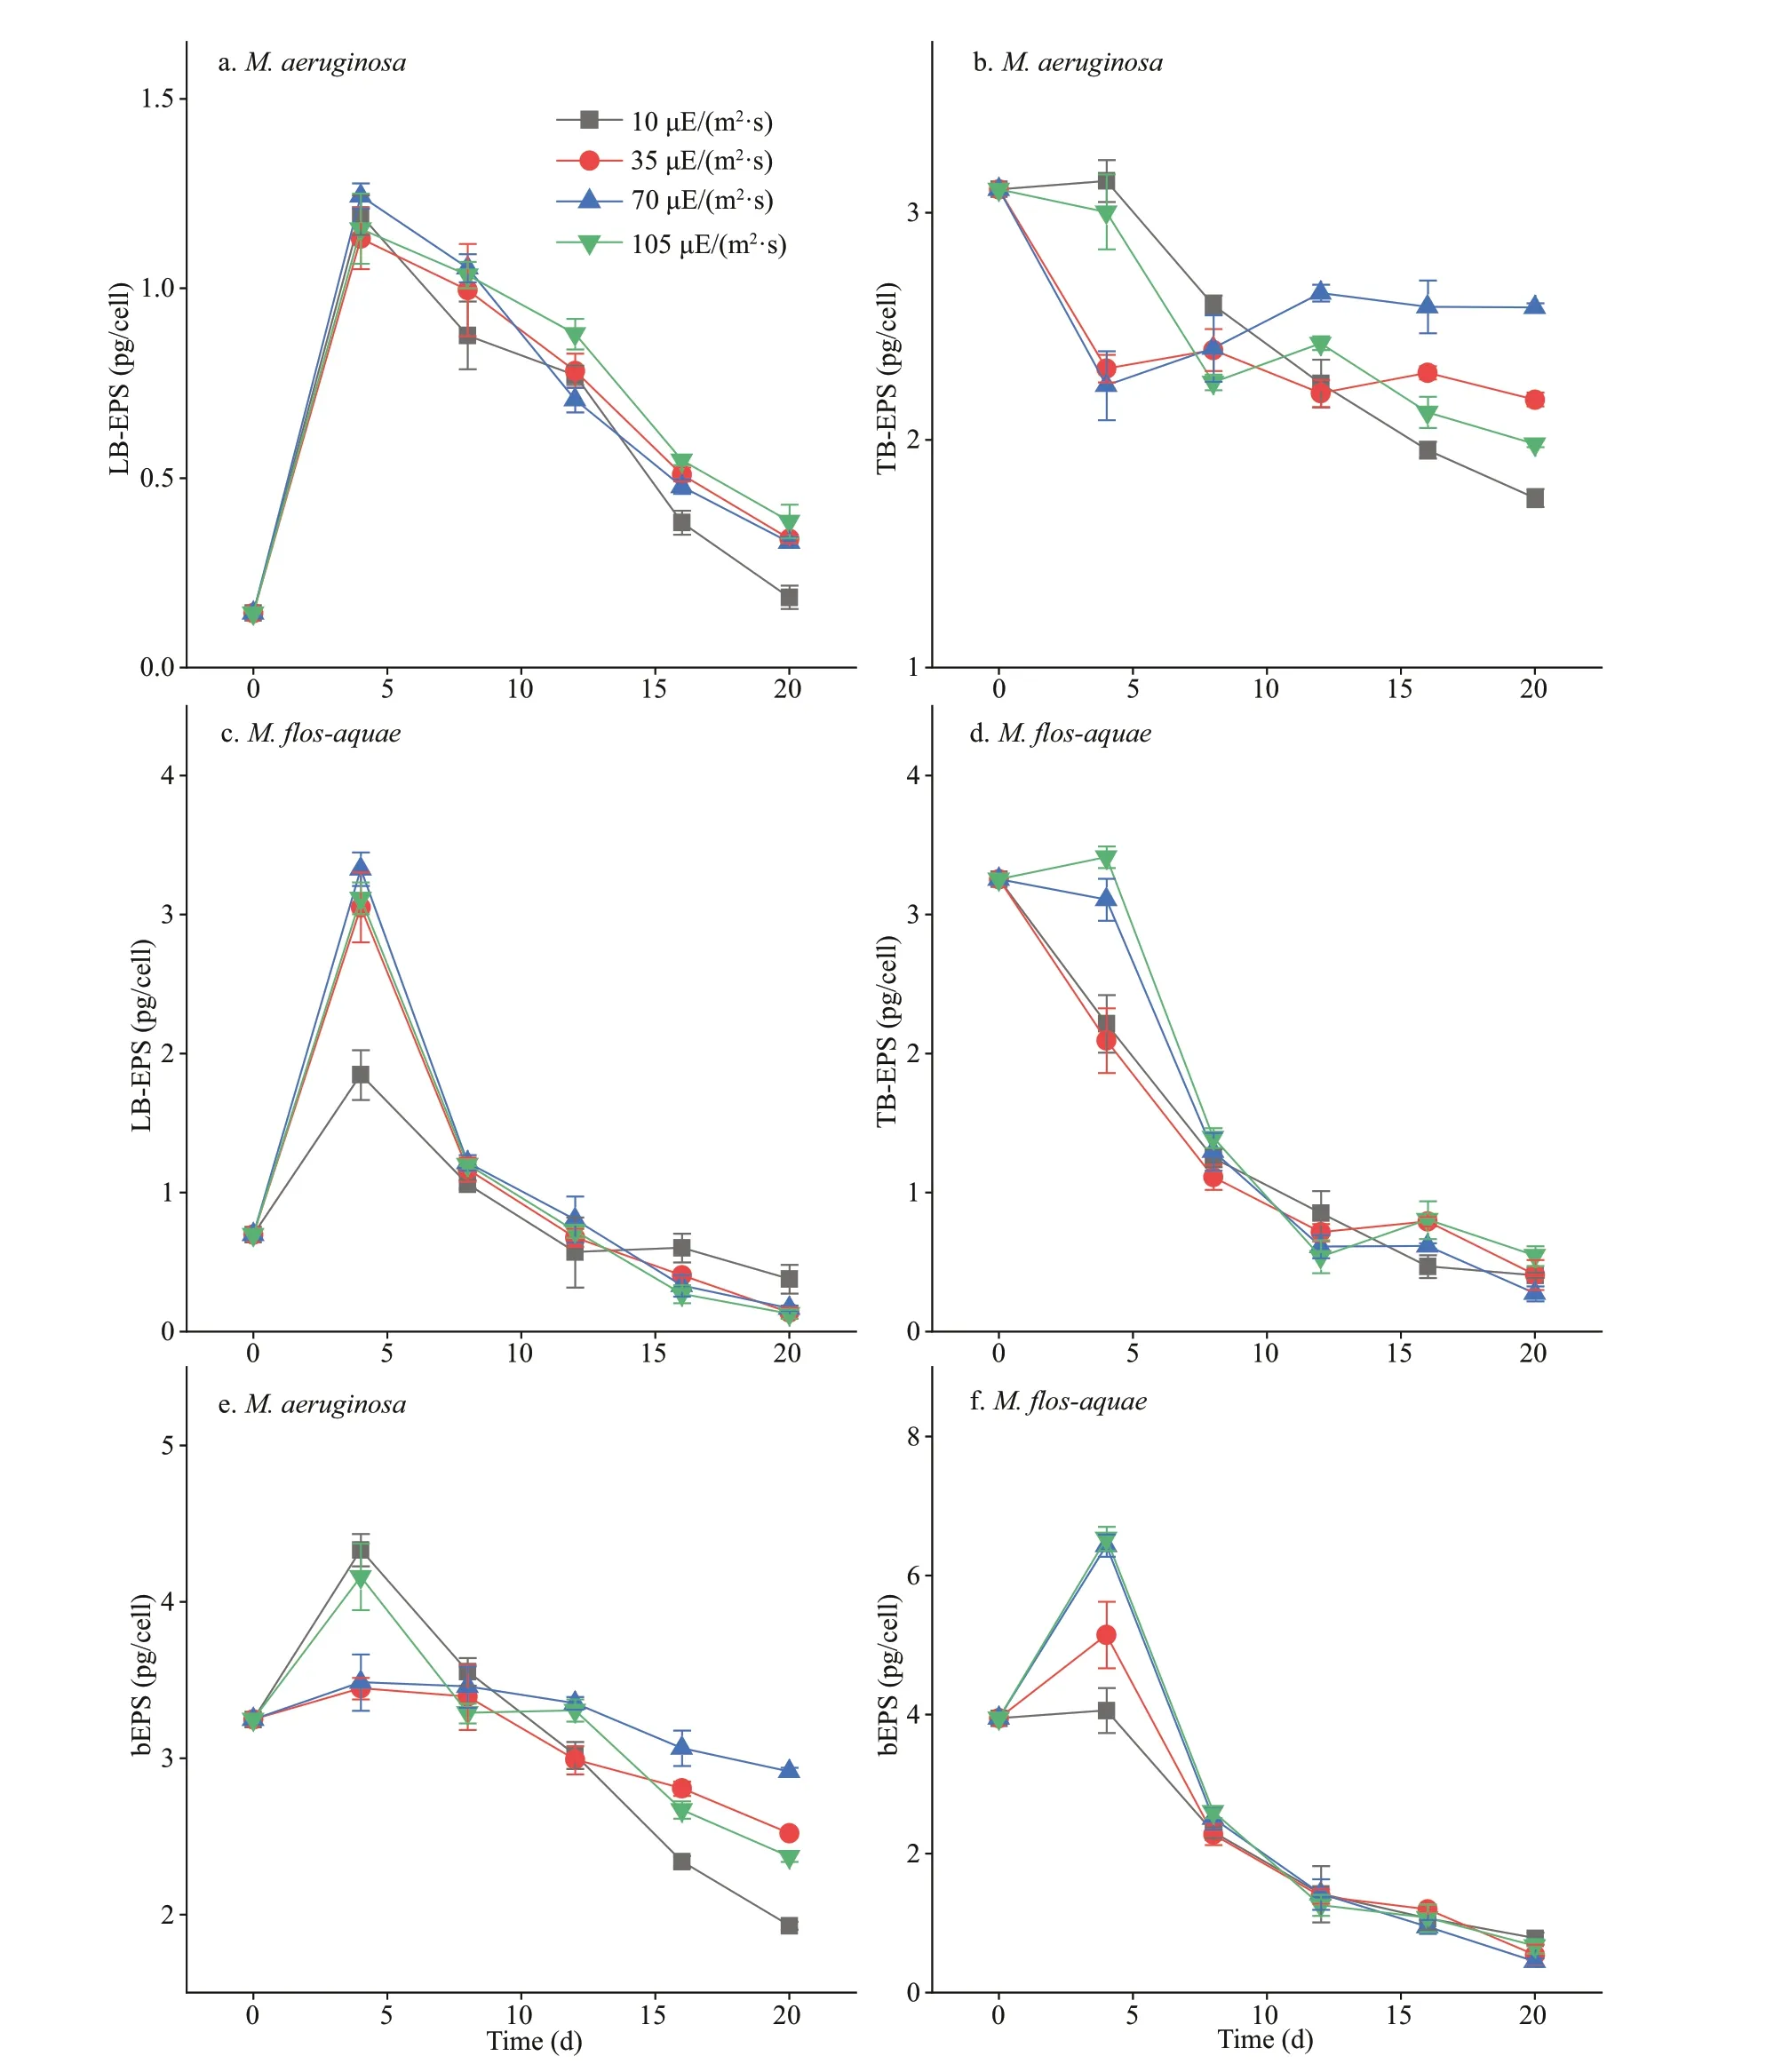
Fig.4 Variations of polysaccharides in bEPS of the two Microcystis species at diff erent light intensities
3.4 Protein contents in bEPS of the two Microcystis species in diff erent light intensities
The changes in the protein contents of bEPS are depicted in Fig.5. The proteins in the LB-EPS or TB-EPS ofM.aeruginosawere higher than those inM.f los-aquae(P<0.01) under the selected culture conditions. Figure 5a shows that the protein contents in the TB-EPS ofM.aeruginosawere signif icantly higher than those in LB-EPS under diff erent light intensities (P<0.01). However, inM.f los-aquae, theopposite rule was observed. In particular, the protein contents in TB-EPS were signif icantly lower than those in LB-EPS at each light intensity (P<0.01).
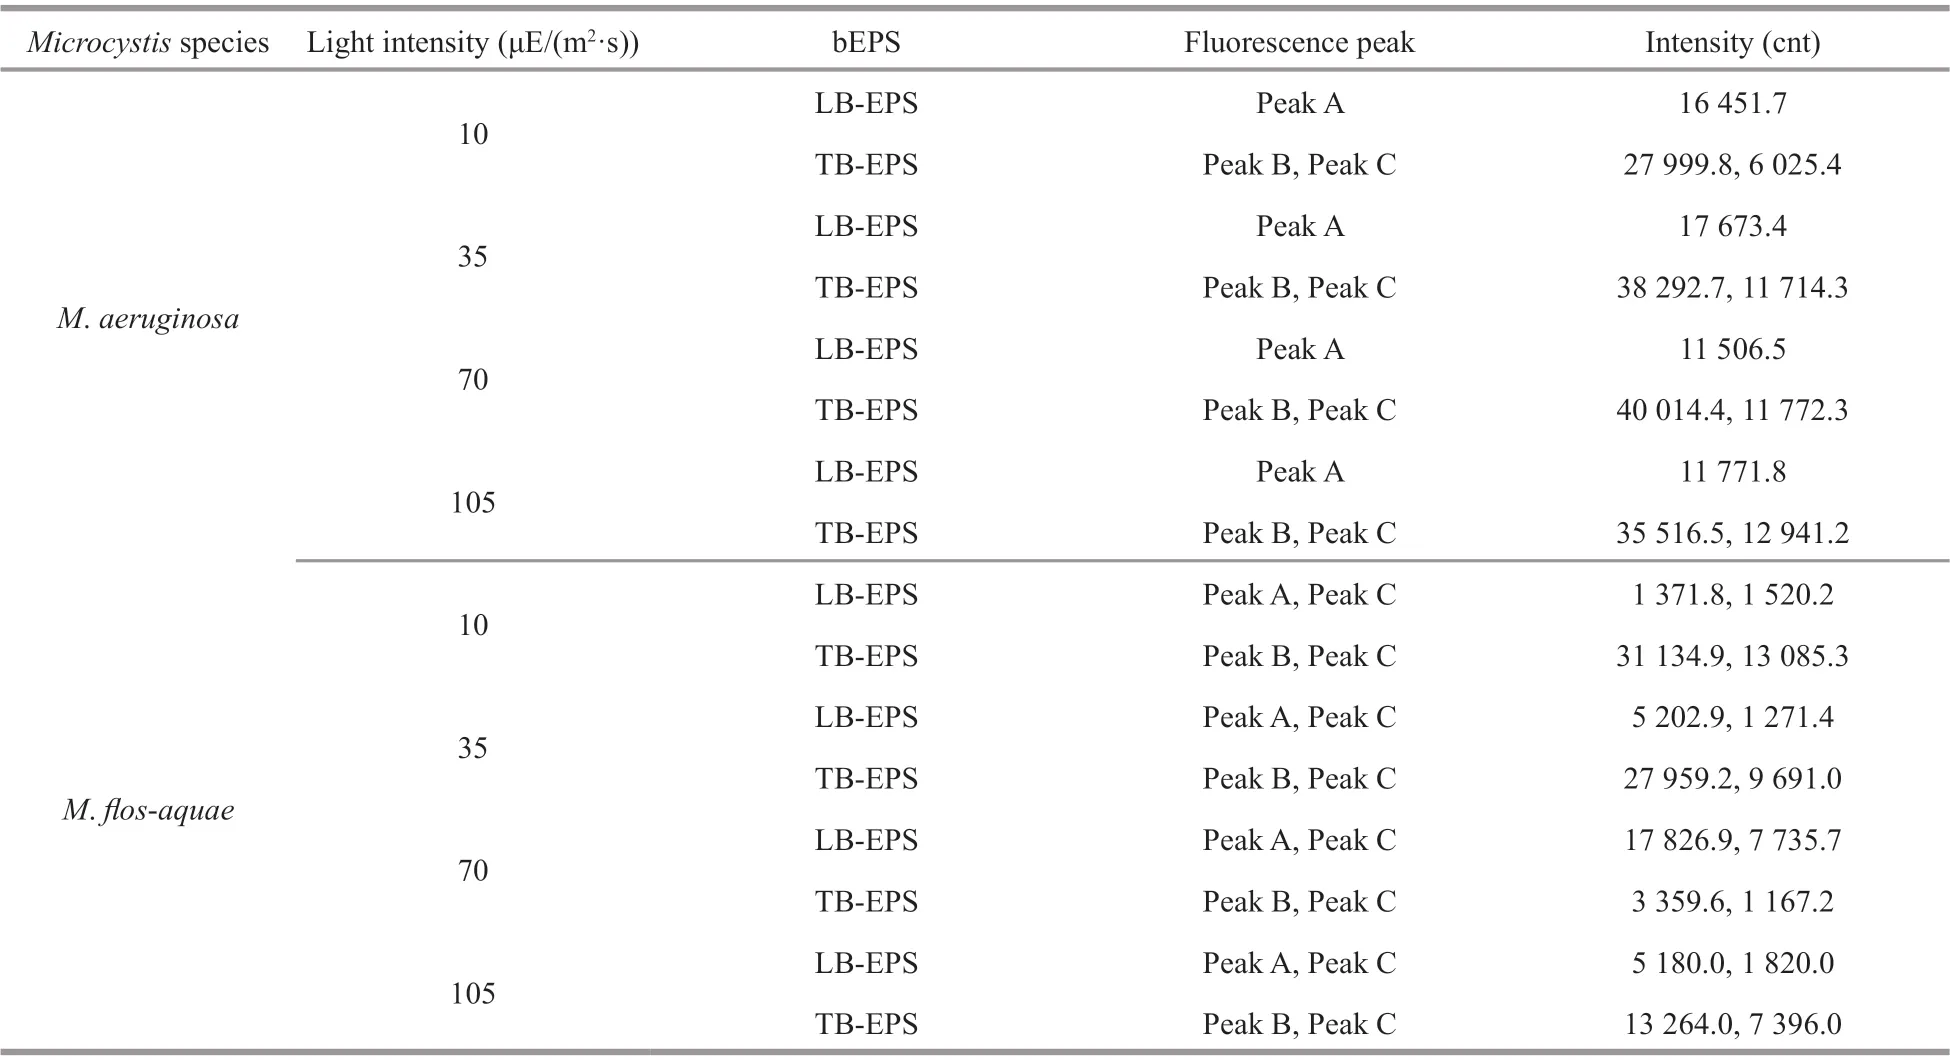
Table 1 The f luorescence spectra parameters of diff erent bEPS fractions at diff erent light intensities for the two Microcystis species
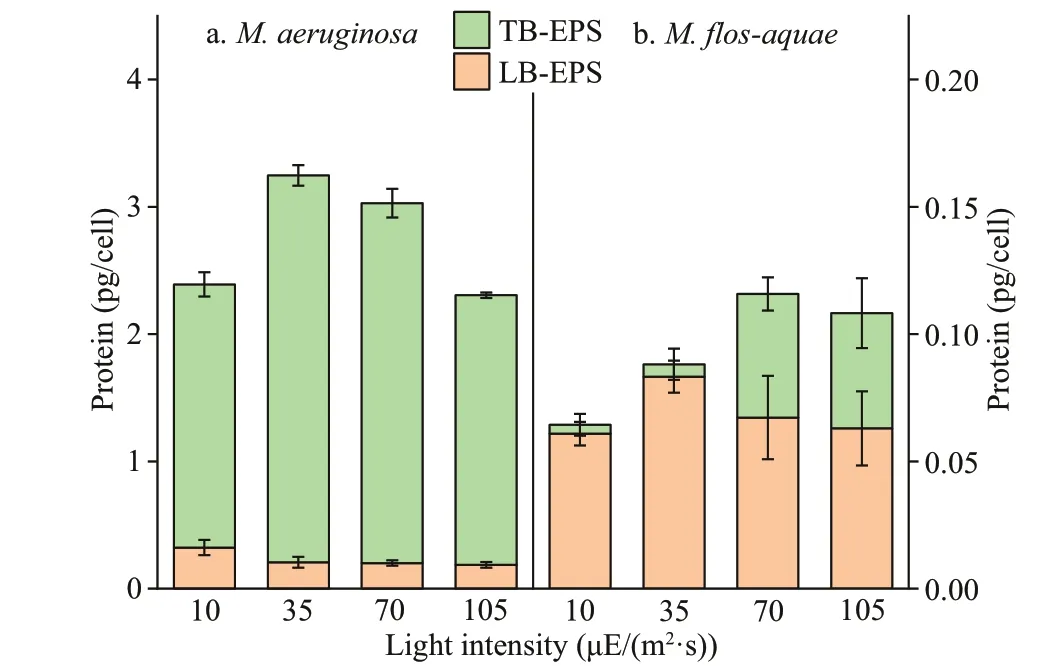
Fig.5 Proteins contents in bEPS of the two Microcystis species at diff erent light intensities
3.5 Fluorescence EEM of the two Microcystis species at diff erent light intensities
In this study, 16 f luorescence EEM spectra of bEPS fromM.aeruginosaandM.f los-aquaewere obtained at diff erent light intensities at day 20 (Figs.6-7). The f luorescence EEM spectra of the twoMicrocystisbEPS contained three f luorescence components. Here,peak A (Ex/Em=270-280/332-340 nm) is composed of protein-like substances (Dainard et al., 2015),peak B (290/354-360) are tryptophan-like substances(Amaral et al., 2020), and peak C (320-370/420-450)consists of humic acid-like substance (Chen et al.,2018), which may be derived from the decomposition of macromolecular organics, such as dead cells or proteins (Parlanti et al., 2000).
In this study, the EEM contours of diff erent bEPS fractions from each strain at diff erent light intensities were almost the same, but the light intensity signif icantly aff ected the f luorescence intensities of the peaks of diff erent EPS fractions for the two strains(Figs.6-7). The LB-EPS ofM.aeruginosacontained peak A (Fig.6a, c, e, & g) at diff erent light intensities,and another peak C was detected in the LB-EPS ofM.f los-aquae(Fig.7a, c, e, & g). The TB-EPS of both strains contained the same peak, that is, they contained peaks B and C (Figs.6-7).
As shown in Table 1, the f luorescence intensity of peak B (tryptophan-like substances) in the TB-EPS ofM.aeruginosawere signif icantly higher than those ofM.f los-aquaewhen the light intensity was higher than 10 μE/(m2·s). With the increase in light intensity,the f luorescence intensity of peak B (tryptophanlike substances) in the TB-EPS ofM.aeruginosagradually became stronger than before, whereas that of peak B (tryptophan-like substances) in the TB-EPS ofM.f los-aquaeweakened (Table 1).
3.6 Zeta potential of bEPS and Microcystis cells in diff erent light intensities
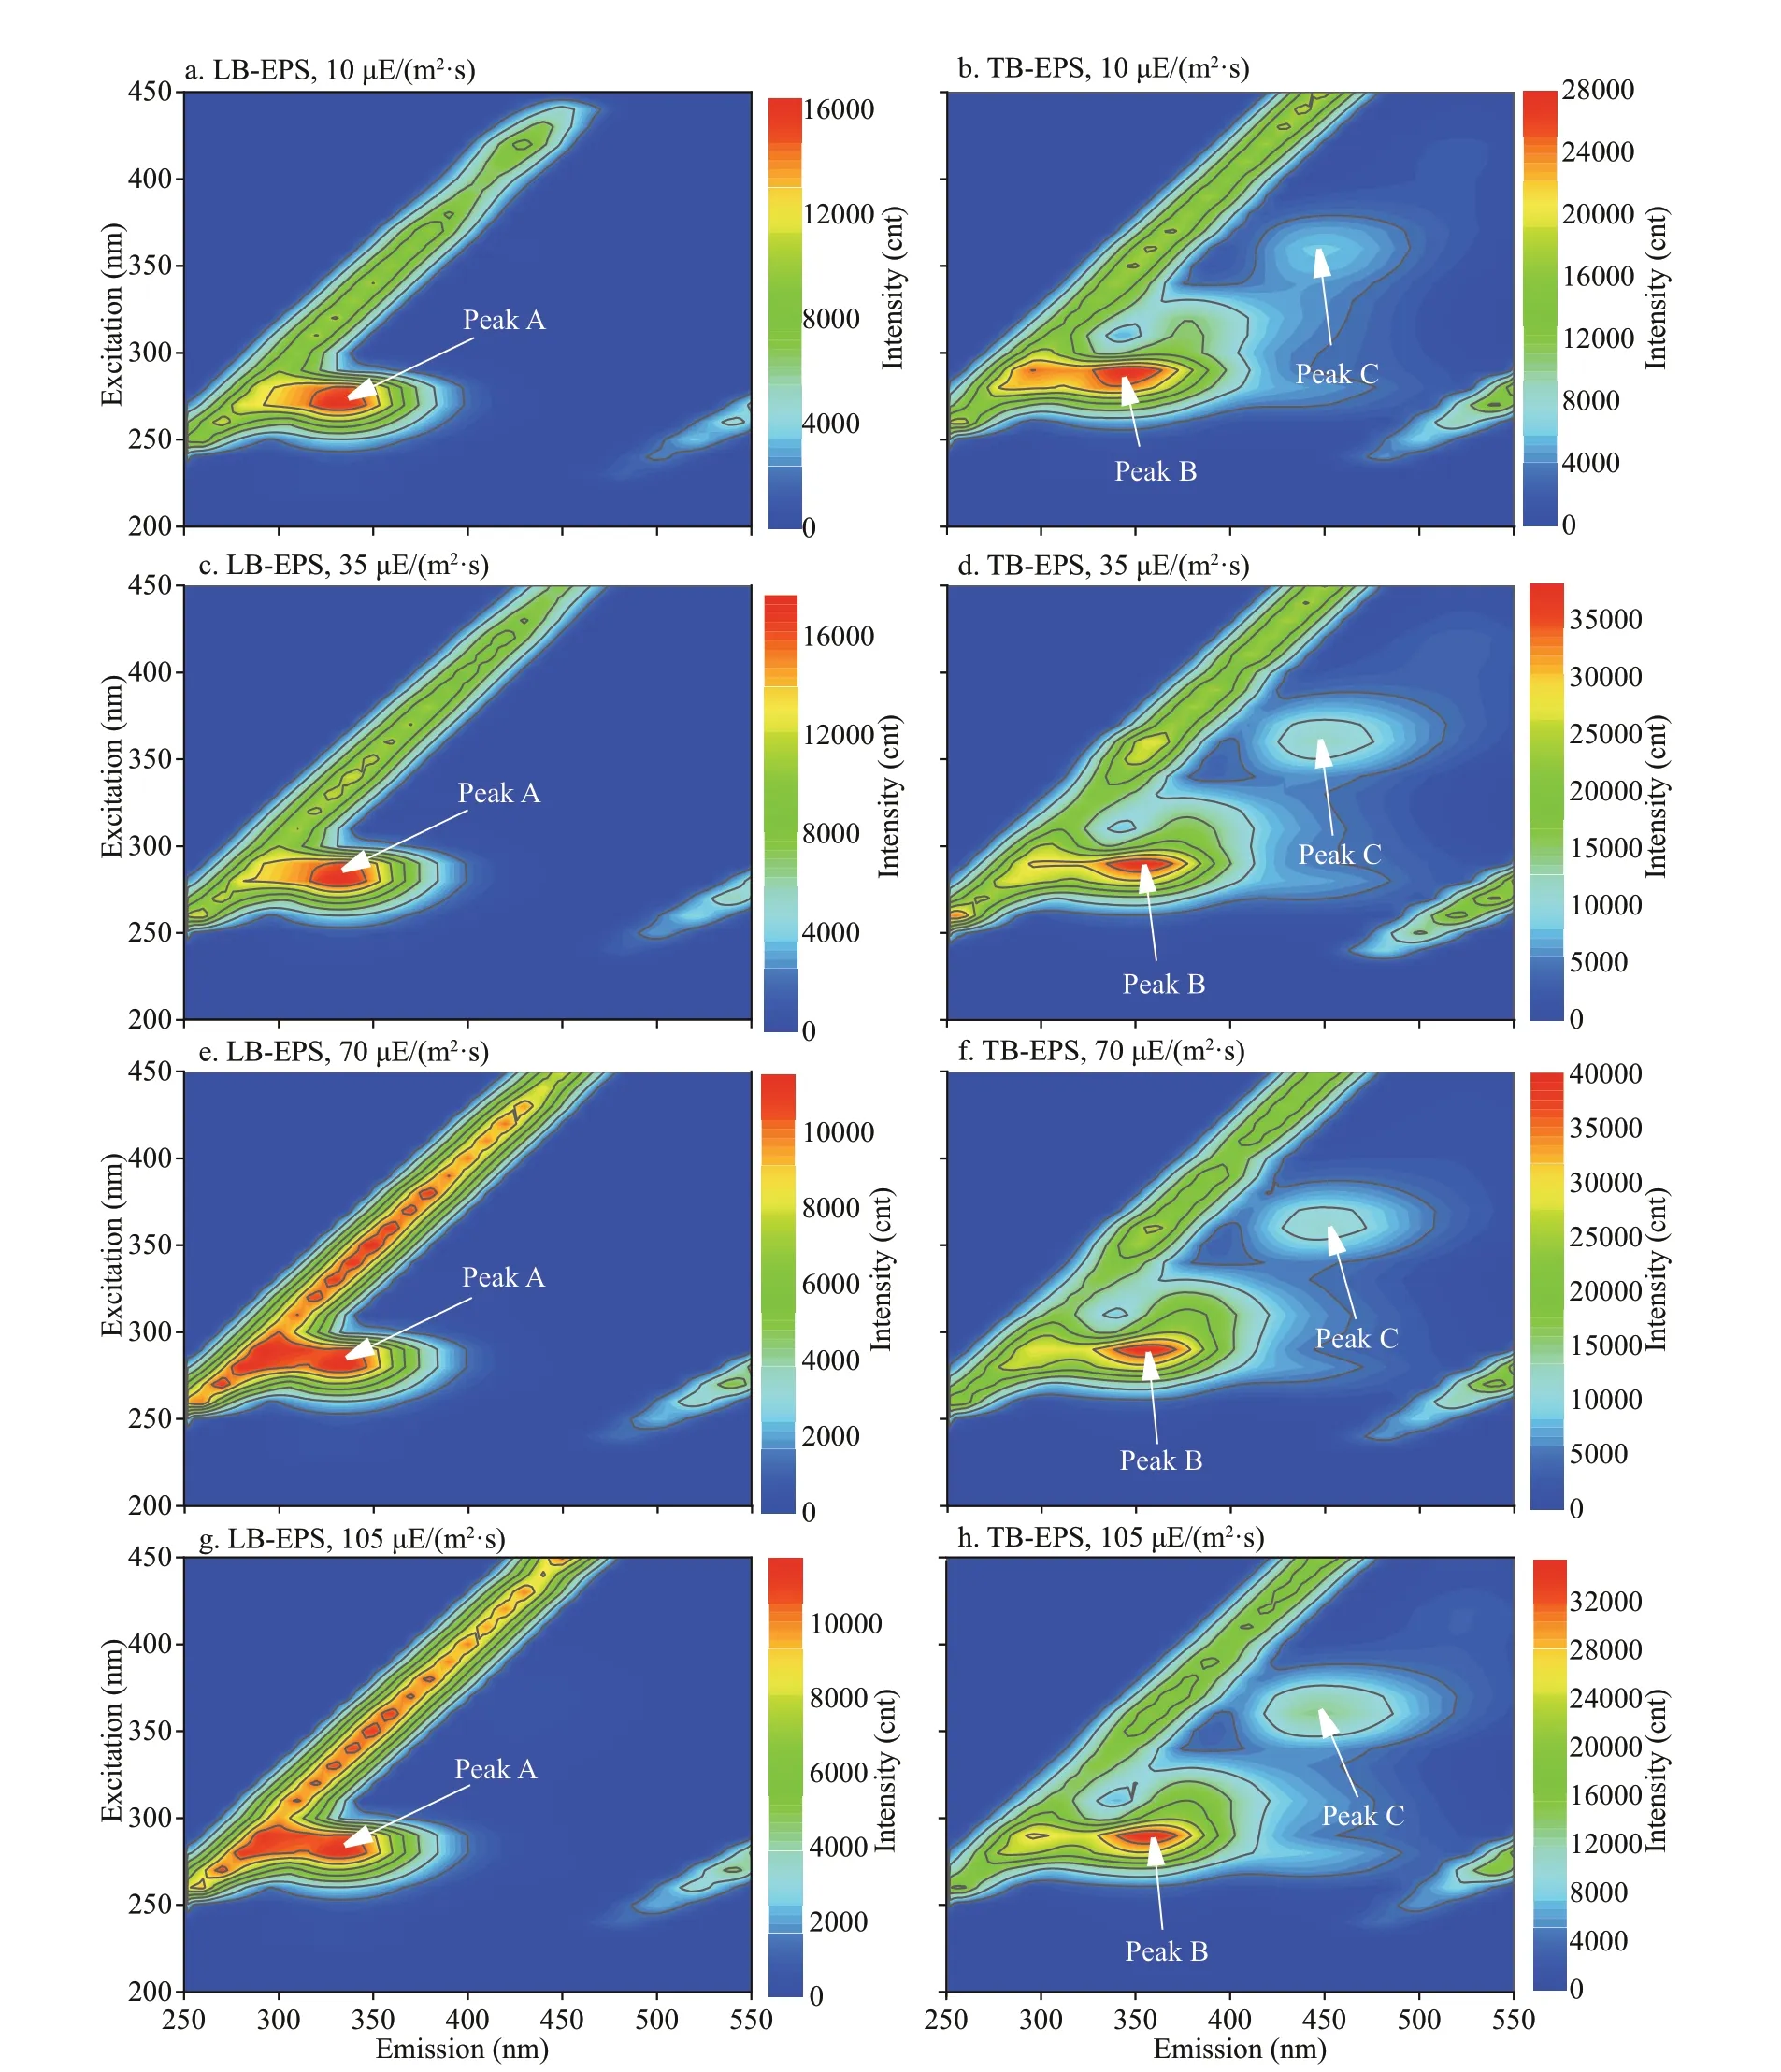
Fig.6 Typical EEM contours of diff erent bEPS fractions at diff erent light intensities for M. aeruginosa
The zeta potentials of bEPS andMicrocystiscells from the twoMicrocystisspecies at diff erent light intensities (pH 7.0) are shown in Fig.8. The absolute values of the zeta potential of LB-EPS inM.aeruginosawere higher than those of TB-EPS under diff erent light intensities (P<0.01). InM.f los-aquae,the opposite rule was observed, that is, the absolute values of the zeta potential of LB-EPS at each light intensity were all lower than those of TB-EPS(P<0.01). The absolute values of the zeta potential of TB-EPS inM.aeruginosaincreased with increasing light intensity (P<0.05), except at 105 μE/(m2·s)(Fig.8a). And the absolute zeta values of LB-EPS inM.aeruginosaat 10 and 105 μE/(m2·s) were the same (P>0.05), and those at 35 and 70 μE/(m2·s) were almost similar (P>0.05). Moreover, the former was lower than the latter (P<0.05; Fig.8a). Figure 8b also shows that inM.f los-aquae, the absolute values of the zeta potential of the two bEPS types all increased with increasing light intensity (P<0.01), except those in 35 and 70 μE/(m2·s), which were the same (P>0.05).As shown in Fig.8, the absolute values of the zeta potential ofM.aeruginosaincreased with increasing light intensity when the light intensity was higher than 35 μE/(m2·s) (P<0.01; Fig.8a). InM.f los-aquae,the absolute values of the zeta potential showed no exhibit obvious diff erences under diff erent light intensities (P>0.05; Fig.8b). Comparison showed that the absolute values of the zeta potential of LB-EPS orMicrocystiscells inM.aeruginosawere higher than those inM.f los-aquaeat each light intensity (P<0.05;Fig.8).
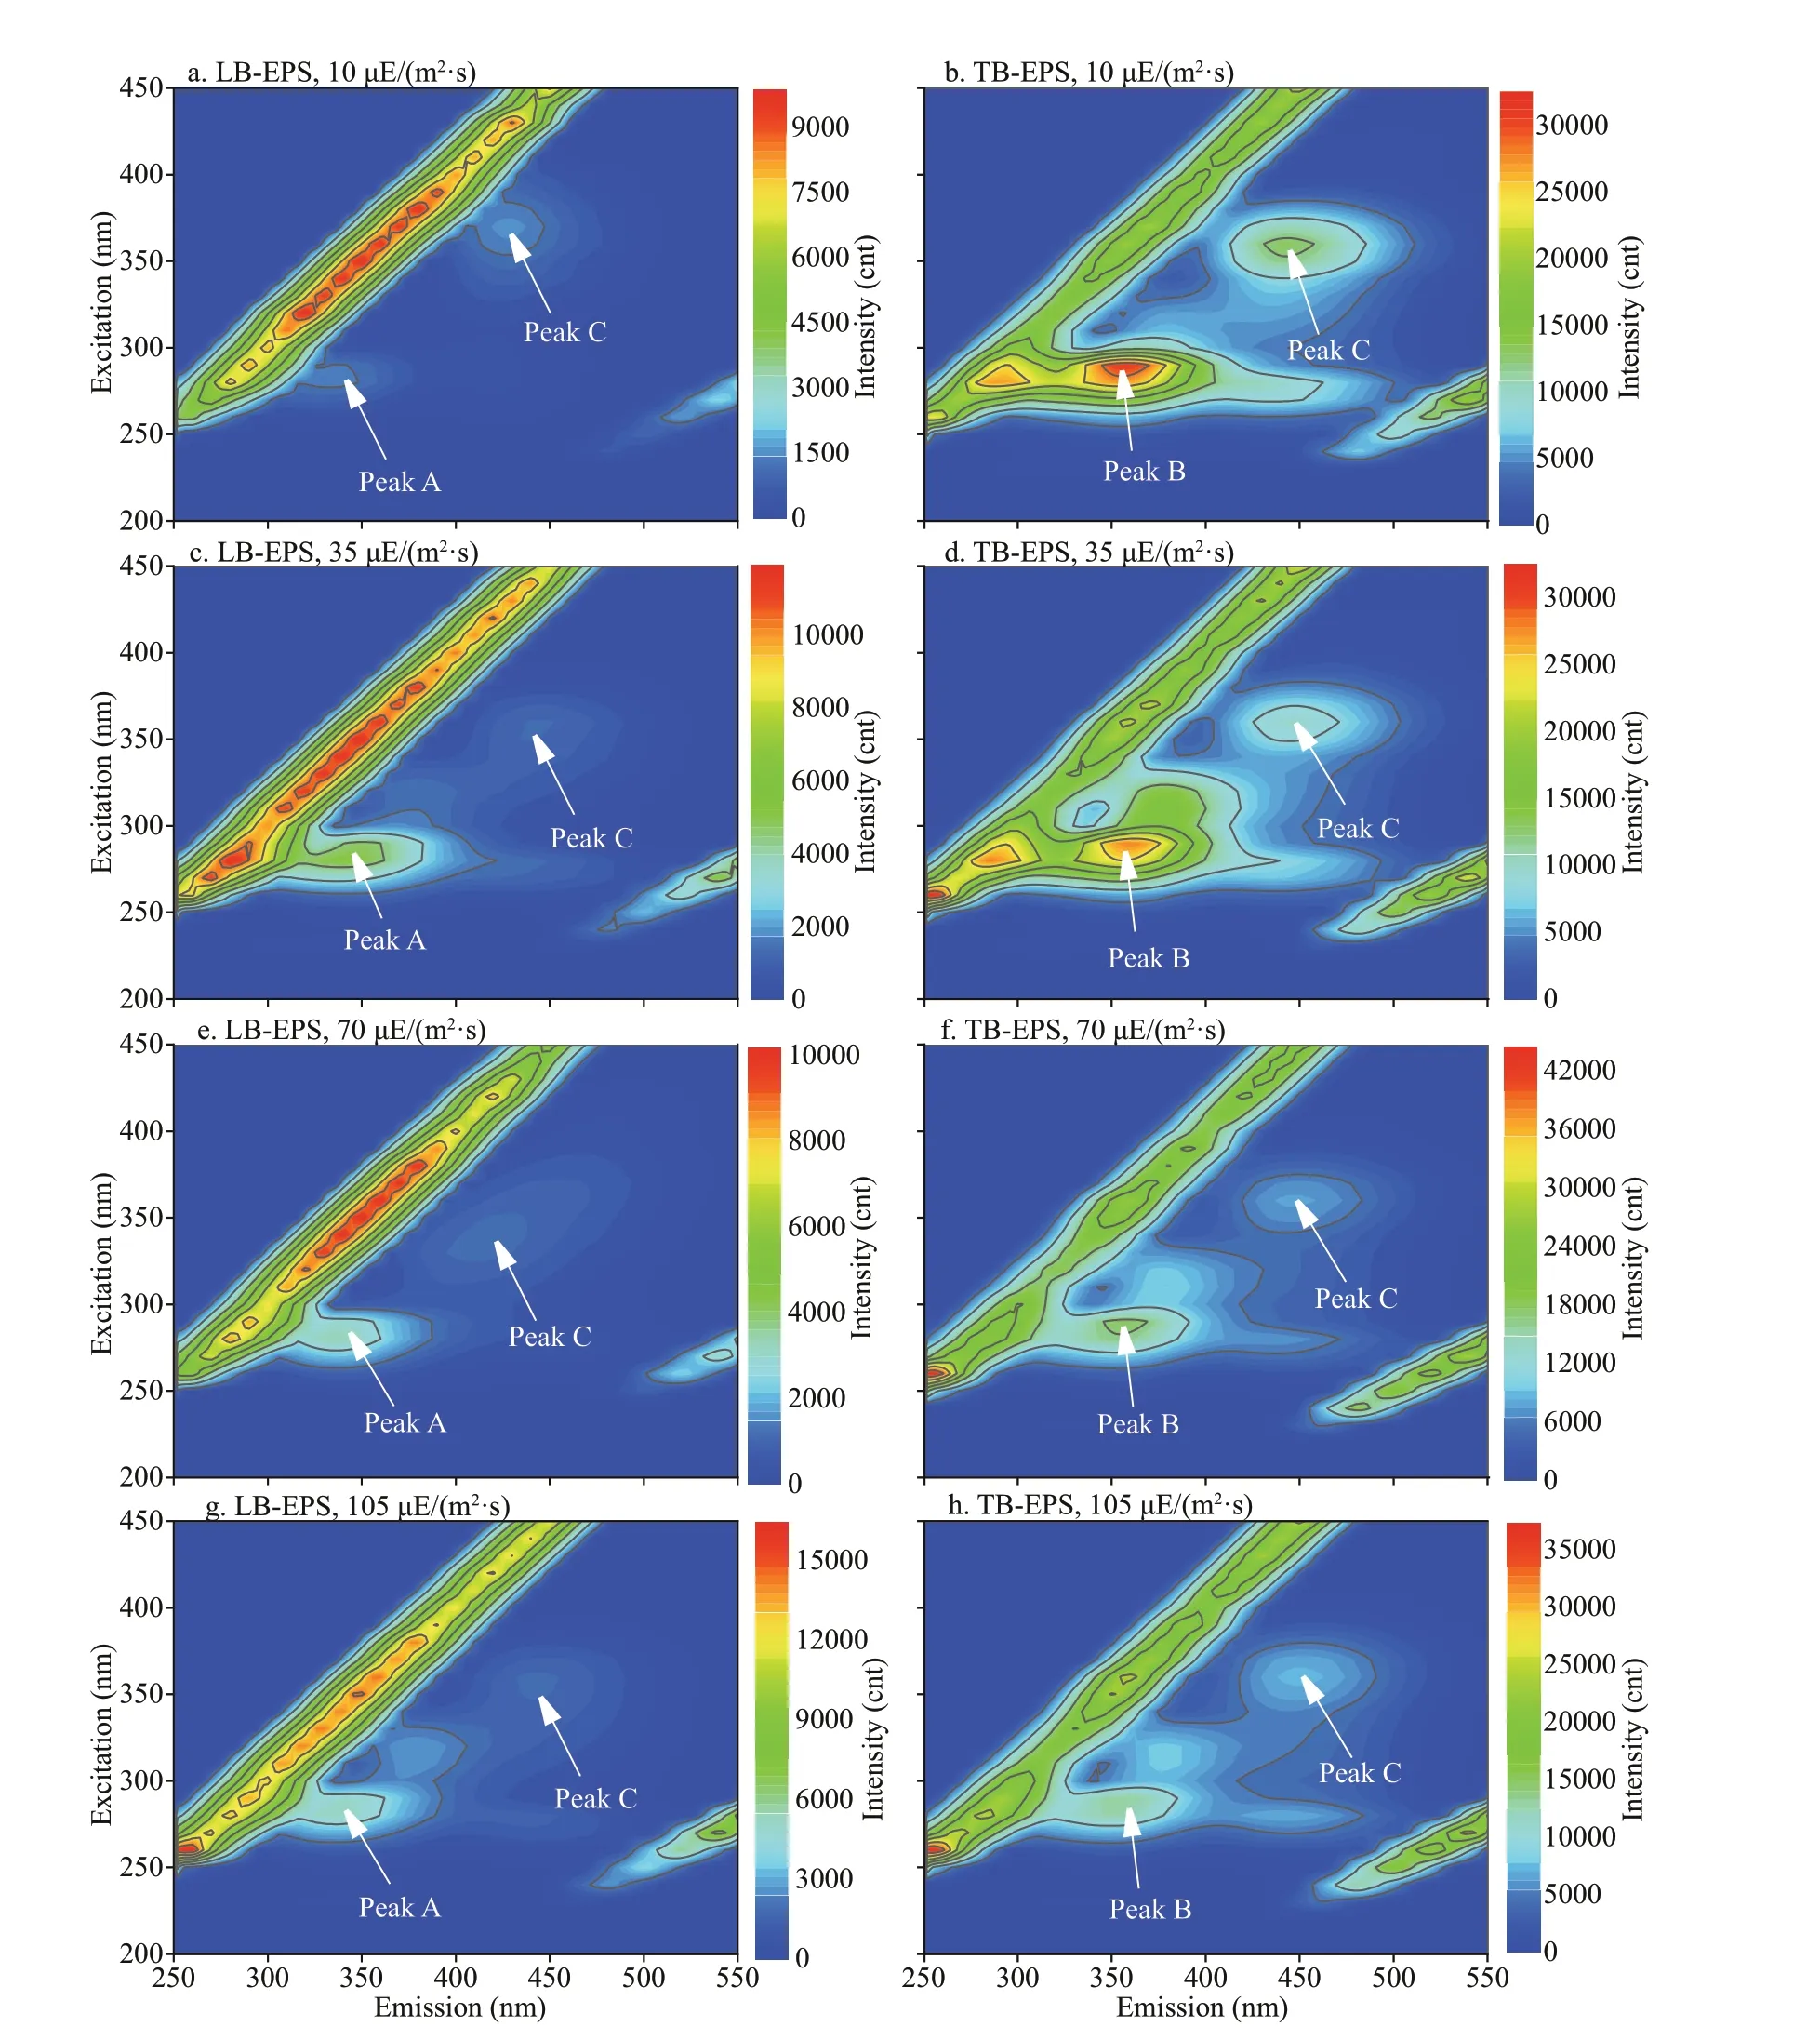
Fig.7 Typical EEM contours of diff erent bEPS fractions at diff erent light intensities for M. f los-aquaeSpecif ically, peaks A, B, and C were located at Ex/Em of 270-280/332-340, 290/354-360, and 320-370/420-450 nm, respectively.
3.7 Hydrophobicity of the two Microcystis species at diff erent light intensities
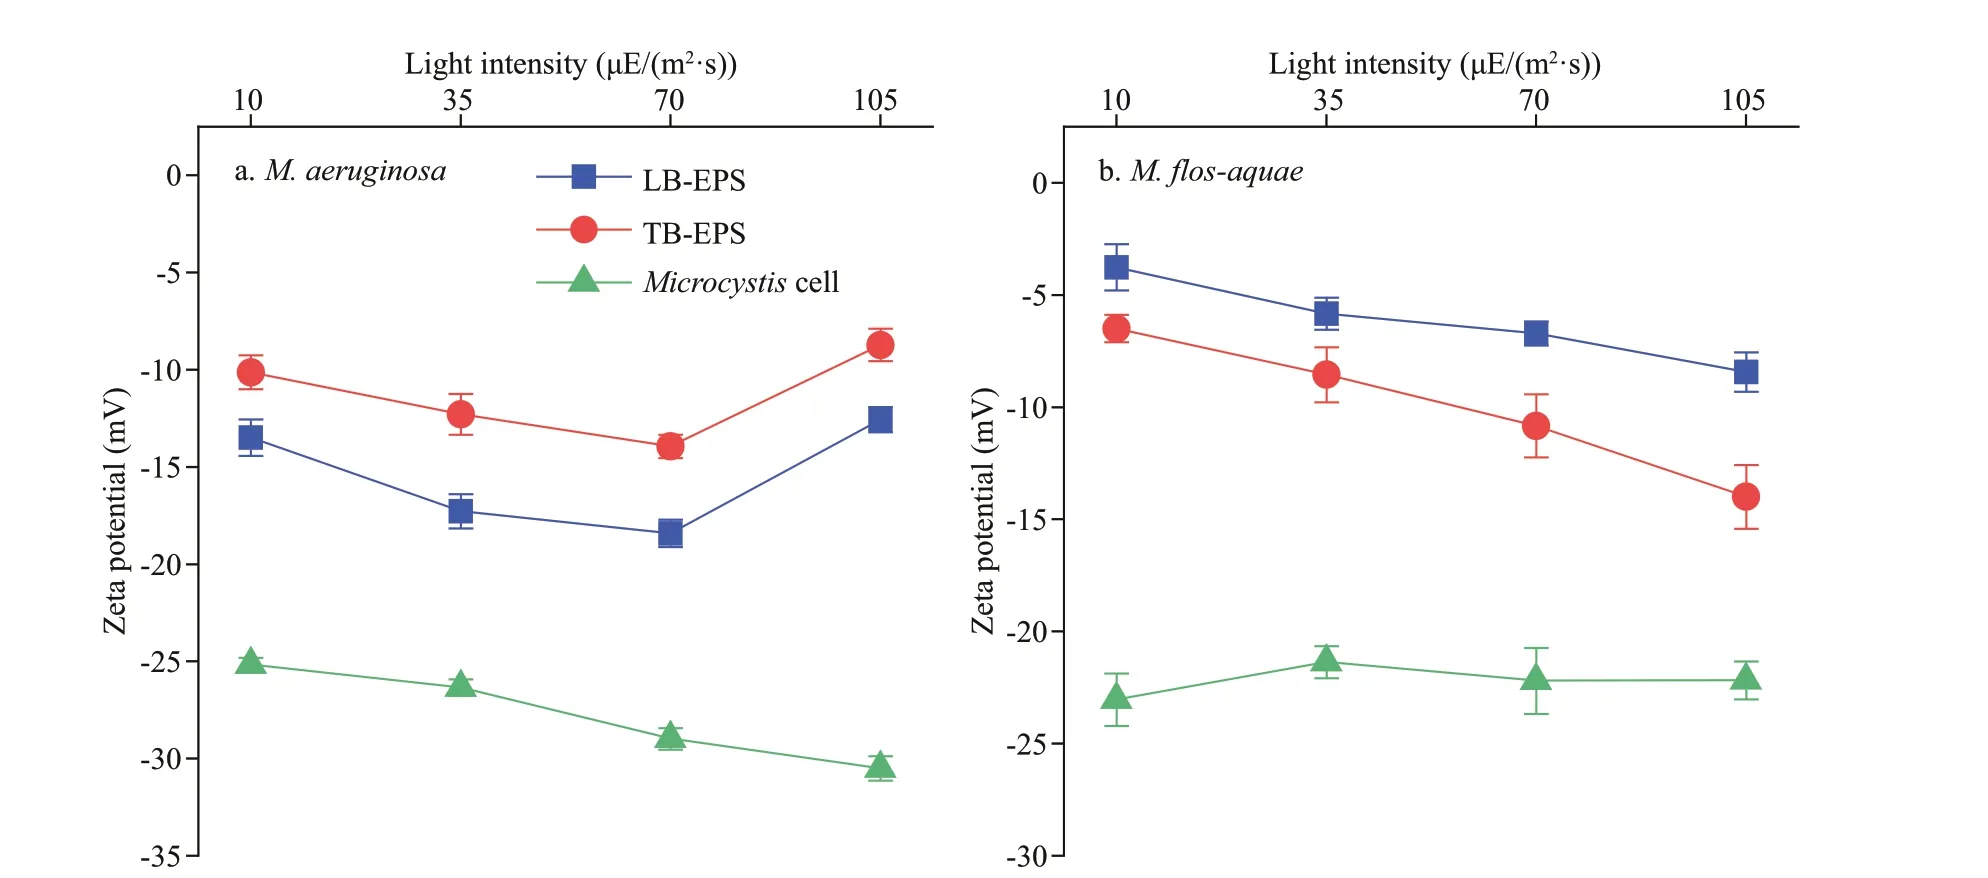
Fig.8 Changes in zeta potentials of bEPS and Microcystis cells from the two Microcystis species at diff erent light intensities
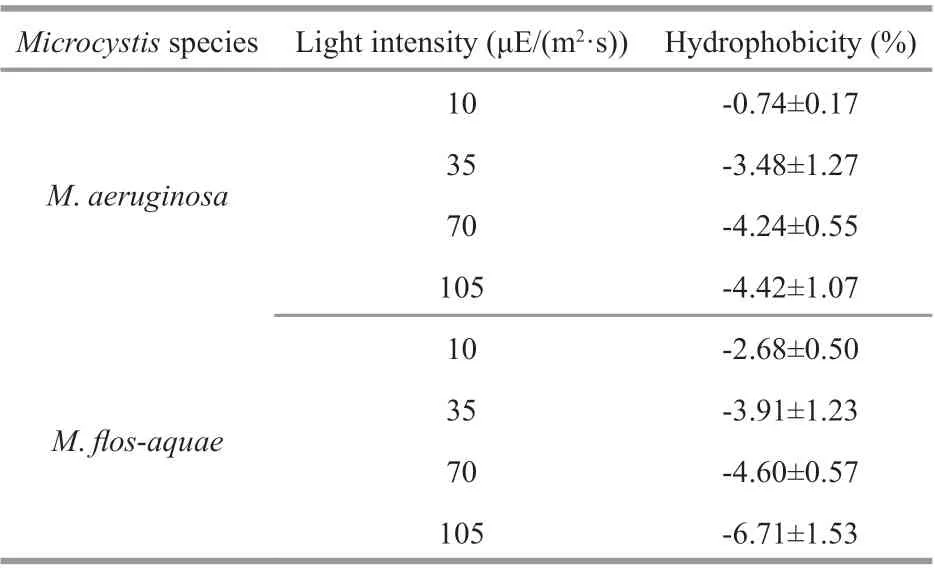
Table 2 The hydrophobicity of the two Microcystis species at diff erent light intensities
Table 2 shows the hydrophobicity of the twoMicrocystisspecies at diff erent light intensities. ForM.aeruginosaandM.f los-aquae, the hydrophobicity on the cell surface was all negative, indicating that the surface ofMicrocystiscells in culture is hydrophilic.These results were in good agreement with the results reported by Yang et al. (2011).
4 DISCUSSION
4.1 Eff ects of light intensity on the growth and F v/ F m
Previous studies have shown that growth (Li et al., 2013; Ge et al., 2014) and photosynthetic activity(Rousso et al., 2021) enhanced with the gradually increased light intensity, but intense light may inhibit the growth (Trabelsi et al., 2009) and photosynthetic activity (Meneghesso et al., 2016; Rousso et al., 2021).A similar correlation was observed in the current study, conf irming that light availability was the key factor aff ecting growth and maximal chlorophyll f luorescence of PSII (Fv/Fm). Moreover, the present study revealed a negligible eff ect of the lowest light intensity on the growth ofM.f los-aquaebefore 14 days, which is consistent with the highestFv/FmofM.f los-aquae. Similar results were also found for eukaryotic algaNannochloropsisgrown at intensities of 10, 100, and 1 000 μE/(m2·s) (Meneghesso et al.,2016). These phenomena can be explained by the increase in large antennae by cells to capture light under dim light (Müller et al., 2001; Straka and Rittmann, 2017) or the increase in capacity for nonphotochemical quenching of chlorophyll f luorescence under abundant or excessive light (Straka and Rittmann, 2018).
4.2 Relationship between EPS and growth
EPS aff ects the stickiness of cell surface, and EPS adhesion among individual cells may contribute to forming large colonies. In general, EPS production is enhanced by high light intensities (Yang et al., 2012;Ge et al., 2014; Xu et al., 2016). A similar correlation was observed in the present study ofM.aeruginosa.However, forM.fl os-aquae, the light intensity did not signif icantly aff ect the amounts of LB-EPS, TBEPS, and bEPS. The diff erence in EPS production between various strains ofMicrocystismay be attributed to the diff erence in photosynthetic carbon f ixation and the utilization effi ciency or carbon balance control ability between species (Otero and Vincenzini, 2003; Yang and Kong, 2013).M.f losaquaemay secrete SL-EPS into the media. TB-EPS contributed to the formation of tightMicrocystisaggregates, and LB-EPS played an important role in the subsequent development from aggregates to mucilaginous colonies (Tan et al., 2020). In the present study, the TB-EPS or bEPS contents ofM.aeruginosawere higher than those ofM.f losaquaeunder selected light intensities, indicating thatM.aeruginosamay proliferate more quickly thanM.f los-aquaeat certain light intensities.
Many previous studies revealed that the optimizing biomass diff ers from that for EPS production (Xu et al., 2016; Chen et al., 2019). ForMicrocystis, previous studies demonstrated that high EPS content and colony formation were associated with low specif ic growth rate (Li et al., 2013; Xu et al., 2016; Chen et al., 2019). By contrast, in the present study, the TBEPS or bEPS ofM.aeruginosawas shown to produce high contents whilst maintaining corresponding high growth compared with that corresponding to 10 μE/(m2·s) conditions. Similar results were also found for cyanobacteriumNostocf lagelliformeculture in white light (Han et al., 2017). Temperature had an obvious eff ect on the growth ofM.aeruginosa, and a twofold interaction was found with light intensity at 80 μE/(m2·s). Growth increased with increased temperature, whereas at 35 μE/(m2·s), growth decreased with increased temperature. However,temperature did not inf luence the polysaccharide content ofM.aeruginosaat these two light-intensity conditions (Yang et al., 2012). In this study, the contents of TB-EPS or bEPS inM.f los-aquaedid not change with the increase in growth at each light intensity. A previous study found that no correlation could be established between cell growth and EPS production for cultures grown at 30 °C/50 μE/(m2·s)and 35 °C/115 μE/(m2·s) (Trabelsi et al., 2009).These results further indicated that cell growth and EPS production are highly dependent on the algal physiological properties and the culture conditions.Furthermore,M.aeruginosacould produce more EPS whilst maintaining corresponding high growth at each light intensity thanM.f los-aquae, possibly conducive to its competitive advantage.
4.3 The role of organic compositions of bEPS
Low nutrient medium (1/7 of N and P contents of BG11 medium), linoleic acid (LA), and LA sustainedrelease microspheres did not aff ect the EEM contours of diff erent EPS fractions inM.aeruginosaFACHB-905(Xu et al., 2013a; Ni et al., 2017). However, the f luorescence intensities of the peaks of diff erent EPS fractions were signif icantly diff erent among the treatments (Ni et al., 2017). A similar phenomenon was found in the present study. In particular, the light intensity did not aff ect the organic compositions of bEPS but signif icantly aff ected the f luorescence intensities of the peaks of diff erent EPS fractions for the two strains. Tryptophan can absorb ultraviolet(UV) radiation and help cells avoid acute cellular damage. In addition, tryptophan is one precursor to the synthesis of scytonemin absorbing UV. Therefore,the existence of tryptophan-like substances in EPS could help cells resist UV radiation damage (Xu et al., 2013a; Wang et al., 2020). The intensities of peak B (tryptophan-like substances) increased with increasing light intensities inM.aeruginosa,indicating thatM.aeruginosacould adapt to high light environment conditions. On the contrary,they decreased with increasing light intensities inM.f los-aquae, indicating thatM.f los-aquaeis easily dominant in water with slightly lower light intensity. The intensities of peak B (tryptophan-like substances) in the TB-EPS fromM.aeruginosawere stronger than those fromM.f los-aquaewhen the light intensity was higher than 10 μE/(m2·s), suggesting thatM.aeruginosacould more easily survive on the surface of eutrophic freshwater systems thanM.f losaquaeat higher light intensities.
4.4 Eff ect of light intensity on the zeta potential of the bEPS and Microcystis cells
Zeta potential is closely related to the charges on cell surface. Cyanobacterial EPS are mainly composed of high-molecular-mass heteropolysaccharides, and they have multiple functional groups. Thus, cell surface properties could be determined by EPS (Tan et al., 2020) through polymer bridging (Vogelaar et al., 2005) and electrostatic binding (Liu and Fang, 2002). The value of zeta potential ref lects the degree of repulsion force between similarly charged particles. Thus, the zeta potential of EPS needs to be studied to well understand the mechanism ofMicrocystiscolony formation. The values of zeta potential of the LB-EPS, TB-EPS, andMicrocystiscells in the two strains were negative at pH 7.0 in this study, consistent with the report of Tan et al. (2020)forMicrocystiswesenbergii. This f inding suggested that theMicrocystiscell surface carries negative charges. Tan et al. (2020) found that the zeta potential changed with the thickness of bound EPS on the cell surface. The absolute value of the zeta potential of the retaining group (with higher EPS content and larger colony size) was higher than that of the stripped group (with lower EPS content and lower colony size) at low calcium concentration (≤20 mg/L).However, when the calcium concentration was more than 20 mg/L, the absolute value of the zeta potential of the retaining group was lower than that of the stripped group (Tan et al., 2020). In the present study, the absolute values of the zeta potential of TBEPS in the two species all increased with increasing light intensities, except the absolute values of the zeta potential of TB-EPS inM.aeruginosaat 105 μE/(m2·s). And the absolute values of the zeta potential ofM.aeruginosaincreased with rising light intensity when the light intensity was higher than 35 μE/(m2·s). These results may be due to the changes in the composition and contents of polysaccharide and protein in bEPS, further indicating that the lower the light intensity, the smaller electrostatic repulsion betweenMicrocystiscells. Previous studies have shown that limiting nutrient supplies facilitatedMicrocystisspp. growth (Xu et al., 2013b), and higher absolute zeta potential allowedMicrocystisto absorb more nutrients (Liu et al., 2016). In the present study, the absolute values of the zeta potential ofM.aeruginosawere higher than those ofM.f losaquaeat each light intensity, suggesting that these cells carried relatively higher negative charge thanM.f los-aquaecells, thus allowing the absorption of additional iron ions or other cations. Compared withM.f los-aquae, increased absorption of cations in the light intensity range could also be benef icial for
M.aeruginosaproliferation.
5 CONCLUSION
The bEPS characterization of two bloom-formingMicrocystisin Taihu Lake, China, at diff erent light intensities was studied. The growth and contents of the TB-EPS, bEPS, and tryptophan-like substances inM.aeruginosawere higher than those inM.f losaquaewhen the light intensity was higher than 10 μE/(m2·s). The absolute values of the zeta potential ofM.aeruginosawere higher than those ofM.f losaquaeat each light intensity. All these results indicated thatM.aeruginosamay more quickly proliferate thanM.f los-aquaethrough increased negative charges, bEPS contents, growth, and tryptophan-like substance contents at certain light intensities. This study provides new insights on the role of bEPS in the proliferation ofMicrocystis.
6 DATA AVAILABILITY STATEMENT
The datasets generated and analyzed during the current study are available from the corresponding author on reasonable request.
 Journal of Oceanology and Limnology2022年5期
- Journal of Oceanology and Limnology的其它文章
- Comparison of three f locculants for heavy cyanobacterial bloom mitigation and subsequent environmental impact*
- Community structure of aerobic anoxygenic phototrophic bacteria in algae- and macrophyte-dominated areas in Taihu Lake, China*
- Tidal water exchanges can shape the phytoplankton community structure and reduce the risk of harmful cyanobacterial blooms in a semi-closed lake*
- Eff ect of random phase error and baseline roll angle error on eddy identif ication by interferometric imaging altimeter*
- Estimating the evolution of sea state non-Gaussianity based on a phase-resolving model*
- Sodium acetate can promote the growth and astaxanthin accumulation in the unicellular green alga Haematococcus pluvialis as revealed by a proteomics approach*
