Far-field sonic boom prediction considering atmospheric turbulence effects: An improved approach
Jianling QIAO, Zhonghua HAN,*, Liwen ZHANG, Wenping SONG,Bifeng SONG
a Institute of Aerodynamic and Multidisciplinary Design Optimization, School of Aeronautics, Northwestern Polytechnical University, Xi’an 710071, China
b National Key Laboratory of Science and Technology on Aerodynamic Design and Research, School of Aeronautics,Northwestern Polytechnical University, Xi’an 710071, China
KEYWORDS Atmospheric turbulence;Augmented Burgers equation;HOWARD equation;Sonic boom;Supersonic transport
Abstract Accurate prediction of sonic boom is one of key challenges for the design of a low-boom supersonic aircraft. For most of available far-field prediction methods, the effect of atmospheric turbulence appearing in the planetary boundary layer cannot be considered, which results in remarkable inaccuracy of predicting ground-level sonic boom waveform. Although some efforts have been made to overcome the shortcoming, the turbulence effects are not yet well described so far.This article proposes an improved method by extending the two-dimensional Heterogeneous One-Way Approximation for the Resolution of Diffraction (HOWARD) equation to account for the axial and transverse convections of wind fluctuation as well as the effect of temperature fluctuation. The proposed method is validated by comparing the predictions with the flight-test data of JAXA D-SEND#1 LBM,which shows that the result of the proposed method is in better agreement with the flight-test data than that of the method without considering atmospheric turbulence effects.Then, distortion mechanism of sonic boom waveforms caused by atmospheric turbulence is analyzed by using the proposed method. It is indicated that the effect of turbulent convection makes uniform sonic-boom wavefronts irregular, which creates the condition of diffraction effect to perturb waveforms.Finally,the proposed method is applied to investigate the behavior of two types of waveforms given by the sonic boom minimization theory. Results show that a far-field waveform with a weaker initial shock is more beneficial for low-boom design of a supersonic aircraft.
1. Introduction
In recent years, research on developing a new generation of supersonic transports has been carried out intensively around the world, after the commercial operation of Concorde ended in 2003. Sonic boom is one of the core issues to be addressed for the development of supersonic transport aircraft.The accurate prediction of sonic boom signatures is essential for designing low-boom configurations and exploring a novel layout.Up to now, the widely-studied prediction method is a two-step strategy:(A)obtaining near-field sonic boom signatures with a Computational Fluid Dynamics(CFD)solver;(B)propagating the signature from near field to far field or ground by using a propagation model. In the propagation step, the augmented Burgers equation has been intensively studied and used to consider the effects of atmospheric wind, stratification, acoustic spread, molecule relaxation processes, thermo-viscous absorption and nonlinearity.However, besides the effects mentioned above, the fluctuation of atmospheric parameters, i.e.,atmospheric turbulence, can change the shape and smallscale structure of far-field waveforms.The change has tried to be simulated based on the waveform parameter method under the ray-trace framework,with the randomness of turbulence reflected in the variation of the ray path. But the fine structure on waveforms cannot be reproduced since the behavior of atmospheric turbulence is beyond its capability.It is significant to theorize and simulate the effect of atmospheric turbulence to improve the accuracy of ground-level sonic boom prediction. To this end, researchers have put many efforts to find the mechanism of action of atmospheric turbulence on booms and to develop approaches for simulating sonic boom propagation through the fluctuated atmosphere.
Distortion of sonic boom waveforms as they passed through the lowest layer of the atmosphere, was observed in many flight tests for measuring ground signatures in the 1960s.The distorted waveforms were mainly classified to three broad types,i.e.,P-type(peaked waves),N-type(normal waves) and R-type (rounded waves).The N-type waveform was closest to the N-wave which corresponded roughly to the result analyzed by the theoryat that time. To explain other distortions of waveforms,Crowand Pierceput forward their views independently. Crow’s point was from the first-order scattering theory.The distorted waveform was treated as being composed of two parts which were an incident wave unaffected by turbulence and a scattered wave generated by the action of an irregular medium on the incident wave.The scattered mechanism could provide quantitative predictions with the statistics of distorted waveforms by modifying the wave equation to describe the internal and thermal scattering.However, the first-order scattering theory showed that highfrequency components were strongly scattering at small angles,which would result in the peak overpressure predicted more than the actual phenomenon.In order to overcome this issue,Plotkin and Georgeextended Crow’s scattering theory to a second order and considered the thermo-viscous absorption.The scattering approach had also been refined by Boulanger et al.to reproduce the variability of sonic boom affected by turbulence through a first-order Born approximation of the scattering, with the physical model developed by McBride et al.The scattering theory can yield a statistical result of sonic boom because of the statistical description of turbulence,but it cannot give a reliable prediction for the fine-scale features of sonic boom signatures.Pierce’s view was based on an extension of concepts from geometrical acoustics.The normal and smooth shock front of sonic boom was rippled when it passed through the atmospheric turbulence layer.The rippled wavefront caused focusing and defocusing of rays,further resulting in wavefront folding which led to P-type and R-type waves observed. The phenomenon of the rippled front was owing to refraction of rays in an irregular medium, and the diffraction of the low-frequency portion of waveforms contributed to the width of P-type waves. The explanation above is the refraction-focusing-diffraction mechanism, which has been qualitatively supported by some laboratory resultsfor wavefront folding and focusing observed. To quantify distortion of sonic boom propagating through the atmospheric turbulence field, some numerical approaches have been developed by researchers.
Khokhlov-Zabolotskaya-Kuznetsov (KZK) equation,a parabolic approximation including nonlinear effects and thermo-viscous absorption, is one of methodologies to be noticed. Piacsekused an equivalent form of the KZK equation, i.e., a modified form of the Nonlinear Progressive wave Equation (NPE), to reproduce the focused and folded sonic boom wavefronts caused by atmospheric turbulence described as a collection of vortices. Blanc-Benon et al.modified the KZK equation to account for the effect of temperature turbulence, and obtained the numerical results using the algorithm developed by Lee and Hamilton.In 2006,Aver’yanov et al.derived a generalized KZK-type parabolic equation, which could account for diffraction, nonlinearity, absorption, scalar turbulence (fluctuations of density and temperature) and vectorial turbulence (wind fluctuation), to describe the propagation of a sound in inhomogeneous moving media. Numerical algorithms to solve the KZK equation previous are still adapted to the generalized equation, including time-domain approaches(e.g.,a Crank-Nicholson finite difference algorithmfor the diffraction term)and spectral-domain methods.A time-domain approach with a shock-capturing scheme was employed to simulate propagation of N-wave in inhomogeneous media which are modeled by random Fourier modes and modified von Karman energy spectra, the result of which showed that regions of focusing and defocusing of N-wave through the medium were consistent with the geometrical ray theory.Relaxation processes which have a great contribution to rise times were introduced in the generalized KZK equation by Takeno et al., and numerical simulation about JAXA DSEND#1was performed.A two-dimensional KZK equation considering the relaxation processes was also numerically solved to study the effects of a realistic turbulent atmosphere on N-wave.In 2017,simulation of combining the augmented Burgers equation for sonic boom propagation in the nonturbulence region and the generalized KZK equation in the atmospheric turbulence layer, was implemented to investigate the effects of uncertainties in atmospheric turbulence and weather prediction models on sonic boom.
However,a parabolic approximation like the KZK equation remains an approximation for the case of narrow angle propagation.The approximation is not sufficient near the region where there exist scattering of non-main directional propagation and focusing in a turbulent field.Dagrau et al.proposed a so-called Heterogeneous One-Way Approximation for the Resolution of Diffraction(HOWARD)method starting from the generalized Lighthill-Westervelt equation,and gave a three-level split-step algorithm of simulation.The assumption of the one-way approximation was applied to numerically solve the linear diffraction term of HOWARD equation by neglecting the backscattering of a sound wave.That HOWARD equation was only suitable for scalar turbulence (fluctuations of density and temperature) and not for vectorial turbulence because of excluding effects of wind fluctuations in the propagation direction and the transverse direction.Some efforts had been made to modify the HOWARD equation to account for vectorial turbulence, with a more exact FLow and Heterogeneous One-Way Approximation for Resolution of Diffraction(FLHOWARD)approachproposed consequently.However, a simplified form for the FLHOWARD equation is required because of complication of numerical simulation. It is an available way to organize the terms reflecting effects of the vectorial turbulence including axial and transverse convections of the generalized KZK equation into the HOWARD equation.These terms are simplification of the vectorial turbulence terms in the FLHOWARD equation. It had been attempted using the two-dimensional HOWARD equation accounting for the effect of vectorial turbulence in the propagation direction to simulate JAXA D-SEND#2flight tests.However, the effect of vectorial turbulence in the transverse direction on sonic boom is not taken into account but important for more accurately predicting peak and mean characteristics of distorted waveforms,which motivates the research of this article.
The main objective of this article is to propose an improved approach for predicting sonic boom signatures on the ground where there exists scalar and vectorial turbulence in the atmospheric boundary layer. The two-dimensional HOWARD equation is modified to account for effects of temperature turbulence and wind-fluctuation turbulence in both directions besides linear diffraction, thermo-viscous absorption, relaxation processes,nonlinearity,geometric spreading,and stratification.This work is an extension of the methodology proposed in Ref. 43 and an appropriate simplified form of the FLHOWARD equation for engineering application. The framework and the numerical algorithm of simulating sonic boom propagation through the realistic atmosphere with boundary-layer turbulence are also to be stated, with the augment Burgers equation and the modified HOWARD equation combined.The proposed method is to be validated by analytical cases and flight-test data, and applied to analyze the mechanism of a waveform distortion caused by turbulence. Besides, the performances of two types of low-boom far-field waveforms in atmospheric turbulence are to be investigated by the proposed method. The work of this article will also support the design optimization for a low-boom supersonic aircraft.
This article continues in Section 2 to introduce the proposed method for predicting far-field sonic boom, including the modified two-dimensional HOWARD equation, the modeling for atmospheric turbulence,the numerical algorithm,and the framework for prediction.Section 3 is the validation of the proposed method, using a sine wave case, an acoustic piston case, and the flight-test data of the JAXA D-SEND project.Section 4 discusses the distortion of an N-wave affected by turbulence, and the effect of turbulence on a flattop wave and a wave with a weaker initial shock.Section 5 draws some conclusions and makes an outlook.
2. Proposed method
The proposed method for predicting far-field sonic boom considering the effects of atmospheric turbulence includes two stages, which is shown in Fig. 1. For the region above the top of the atmospheric boundary layer, a near-field pressure signature is propagated by solving the augmented Burgers equation. For the region inside the boundary layer, the sonic boom waveform propagation is simulated by a modified twodimensional HOWARD equation. The augmented Burgers equation as well as numerical algorithms is documented in detail,so it will not be covered here. We will focus on the modified two-dimensional HOWARD equation.
2.1. Modified two-dimensional HOWARD equation
It is a challenging task to simulate the sonic boom propagation through atmospheric turbulence. The reason is not only that the simulation of atmospheric turbulence is very difficult, but also that the influence of atmospheric turbulence on sonic boom is complicated. In order to improve the original HOWARD equationdescribing turbulent effects, two improvements have been made in this study. We introduce the term describing the transverse effect of wind fluctuation in the generalized KZK equation (Eq. (1) in Ref. 33), into the original two-dimensional HOWARD equation (Eq. (1) in Ref. 43), by organizing the KZK equation to the similar form of the original HOWARD equation. Second, considering the FLHOWARD equation,which is a more exact formula,and recognizing the term to describe the effect of temperature fluctuation, we introduce this term into the original HOWARD equation. The modified two-dimensional HOWARD equation is
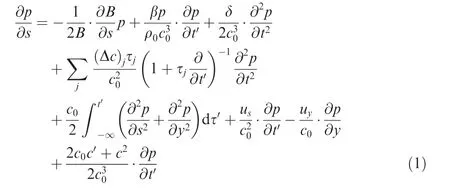
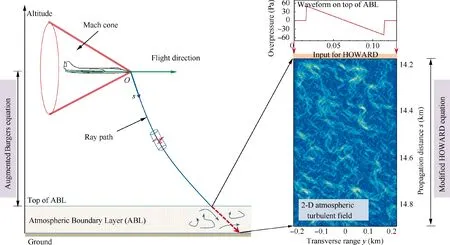
Fig. 1 Sketch map of proposed method for far-field sonic boom prediction considering effects of atmospheric turbulence.
where p is the acoustic pressure,s and y are the main direction of the sonic boom propagation and the transverse direction respectively, and t=t-Rds/cis the retarded time of a waveform. The main direction is along the ray path. The last two terms of Eq. (1) are additions to the original HOWARD equation to consider the transverse effect of wind fluctuation and the effect of temperature fluctuation.
Terms on the right-hand side of Eq. (1) account for some effects of a fluctuated atmosphere as follows.
The first term explains the geometrical acoustics which reflects the geometrical spreading of the sound energy and the refraction effect in a stratified atmosphere, where B is expressed as

Here,cand ρare the average sound speed and density of a fluctuated atmosphere. The symbol A denotes the ray-tube area, which can be calculated approximately with four adjacent rays.In Eq. (2), c=c+w·n and v=|cn +w|are the speed of the wavefront normal to itself and the ray velocity, where n is the unit normal vector of a wavefront,which is not the same as the tangent direction of the ray path in the atmosphere with the mean wind velocity vector of w.The second term reflects the nonlinear effect in the acoustic pressure propagation. The coefficient of nonlinearity is:β =1 +(γ-1)/2, where γ is the specific heat ratio of the air.The third term describes the effect of thermo-viscous absorption due to heat conduction and viscosity,where δ is the diffusion parameter which can be evaluated with δ =(μ/ρ)[4/3 +0.6 +(γ-1)κ/(γRμ)] in which μ, κ and R are respectively the shear viscosity coefficient,the thermal conduction coefficient and the gas constant. The fourth term includes effects of molecular relaxation processes of oxygen,nitrogen, etc., where (Δc)and τare the difference between equilibrium and frozen speed of sound and the relaxation time.The semi-empirical formulas of these two parameters are documented by Pierce.The first four terms on the right-hand side of Eq.(1)are the same as terms in the augmented Burgers equationused for predicting far-field sonic boom in the steady atmosphere.
The last four terms reflect actions of the atmospheric turbulence on distortion of a waveform.The fifth term describes the linear diffraction effect.The sixth and the seventh terms represent the linear convection effects of the vectorial turbulence,i.e., the wind fluctuation, where uand uare the components of the wind fluctuation u in the directions of s and y. The last terms are the effect of the temperature fluctuation, where cis the variation of the sound speed due to temperature fluctuation.
The presented equation is considered to add effects of wind fluctuation in the transverse direction and the temperature fluctuation on sonic boom waveforms. It is more suitable for the case where the atmospheric turbulence is relatively so strong that these effects are significant. The effects of density fluctuation and nonlinear convection of wind fluctuation are not included in the present study.On the one hand,in the turbulent field of atmospheric boundary layer, the wind speed is rarely more than 100 km/h, and the wind fluctuation is much lower. It is assumed that the air in the atmospheric boundary layer is incompressible. Density fluctuation is a relative secondary effect for the variation of a sonic boom waveform,compared with the eddy (wind fluctuation) near the earth’s surface and the temperature fluctuation. On the other hand,the effects of nonlinear convection of wind fluctuation are much smaller than that of linear convection.Ref. 41 indicated that the error of a split-strategy methodology can mask the effects of nonlinear convection,when solving an equation with more effects. The result of an equation ignoring the nonlinear convection effects is more precise for fewer sources of error in practice. Nevertheless, in order to further improve the accuracy of a model for simulating sonic boom propagation through atmospheric turbulence, these effects should be considered and a more accurate solving strategy for a more complete equation should be proposed.
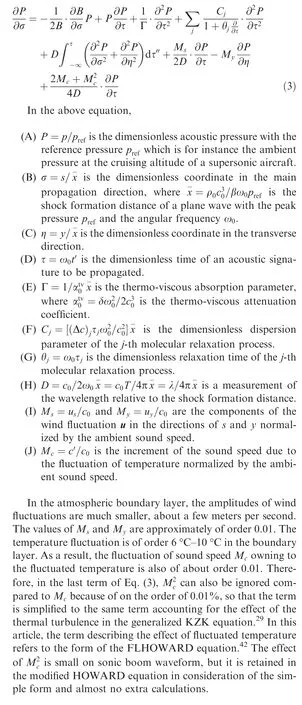
To be consistent with dimensionless augmented Burgers equation,the dimensionless form of Eq.(1)can be given as
2.2. Modeling atmospheric turbulence
An atmospheric turbulence field is supposed to be ‘‘frozen” in the simulation of sonic boom through the atmospheric boundary layer, which means that the atmospheric parameters are invariants with time in the process of sonic boom propagation.The hypothesis is reasonable since time scales for remarkable variations of atmospheric parameters are much larger than the characteristic period of a sonic boom signature. A model describing the isotropic and homogeneous atmospheric turbulence is used here with a Fourier modes method.The vectorial turbulence (the wind fluctuation) and the scalar turbulence including the temperature fluctuation only are generated.
For the vectorial turbulence, the frozen wind-fluctuation field is generated by the following way:

where r =(s,y)is the position vector;kis the n-th wave vector,and k=|k|is the wave number;Δkis the interval of the discrete wave number; φis the phase of the n-th Fourier mode;N(k)is the unit vector of the fluctuated wind for the n-th Fourier mode, which is perpendicular to the n-th wave vector according to the second expression of Eq. (4). The angle ψand the phase φdefined between the wave vector and the main propagation direction s is introduced to determine the unit of the n-th wave vector. The angle and the phase for each mode are taken from the independent random numbers uniformly distributed within the interval[0,2π].At the position r,the vectorial turbulence is generated by the summation of M Fourier modes. For each mode, the kinetic energy spectrum E(k) is estimated by the modified von Karman model, expressed as
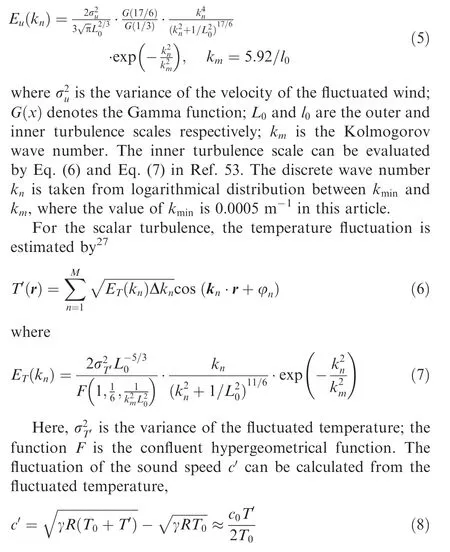

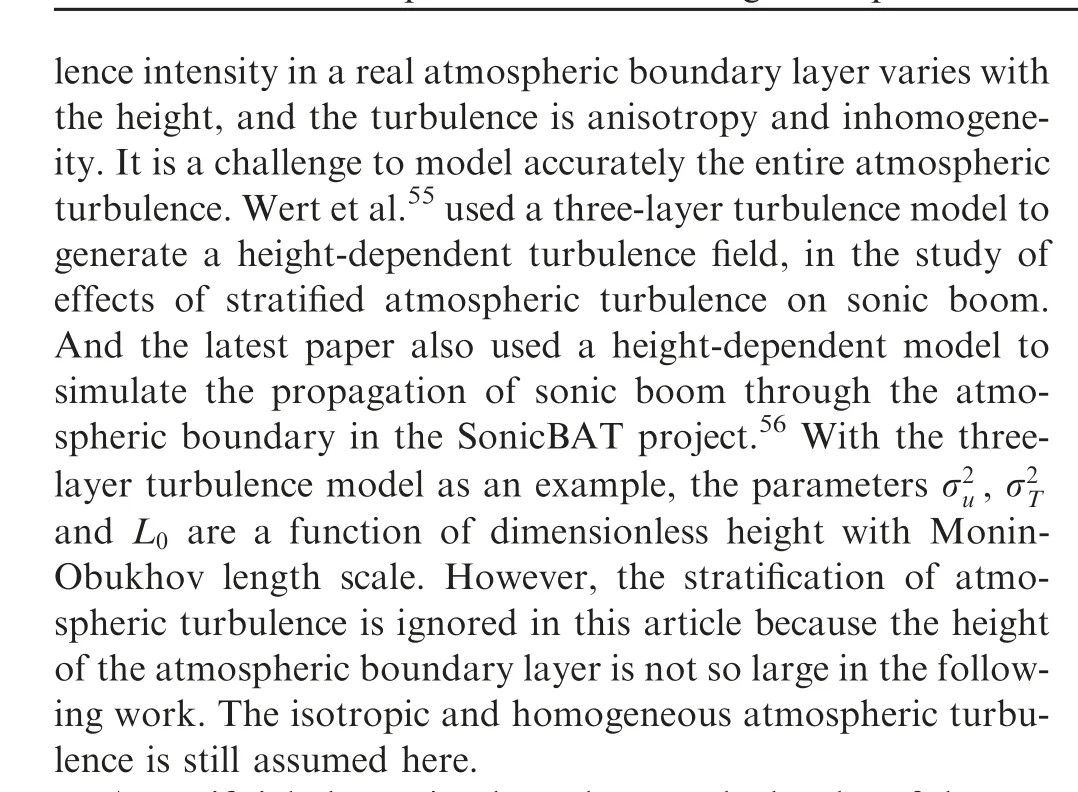
An artificial absorption boundary on the border of the turbulent field is introduced, as the strategy to solve the linear diffraction term in Eq. (1) will be implemented on spectral domain with the Fourier transform (see Section 2.3). The implicit condition of the strategy is that the sonic boom signature is periodic in the transverse y direction. An absorption boundary can guarantee that the turbulent fluctuation vanishes on the border, which means that the atmospheric turbulence is also periodic in the transverse direction. The absorption boundary is formed by
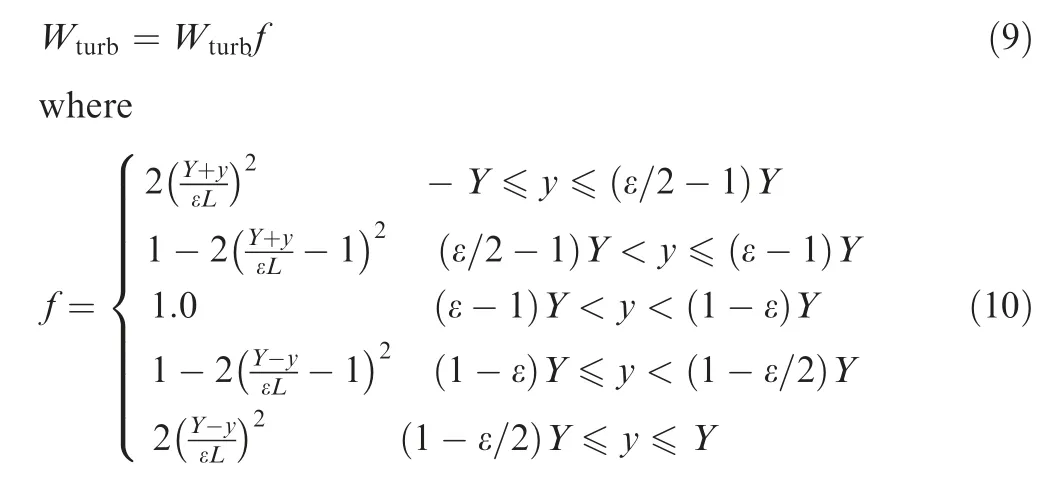
Here, Wdenotes the intensity of the turbulent fluctuation; ε is the thickness coefficient of the absorption boundary,and ε =0.1 is set here.The transverse range is between–L and L.
2.3. Numerical algorithm
Before introducing the numerical algorithm for solving the modified HOWARD equation, it is necessary to understand what the physical domain described by the equation is. The dimensionless equation is assumed to be numerically solved in the uniform grid of the σ-η domain. However, as the reference xis various with the main propagation s, a physical domain transformed from the uniform domain is shown in Fig. 2. In other words, the equation represents a sonic boom signature propagating in the domain shown on the right side of Fig. 2. The coordinate s is determined by a ray-tracing method, which is expressed as

where R =(x,y,z)is a position vector on the ray path in 3D coordinate system; I is the unit matrix; the operator denoted by ⊗is Kronecker product. A fourth-order four-step Runge-Kutta method is used to calculate the ray.
The coordinate y is perpendicular to the ray path. One can think that a series of y form the surface tangent to the ray path.The explanation for the surface and the physical domain is shown in Fig. 3. The surface is also tangent to the surface formed by all rays. The physical domain approximates the reality. The two-dimensional atmospheric turbulent field is generated in this domain by the preceding model.
An operator-splitting strategy is applied to obtain the numerical solution of the HOWARD equation.The advantage of the operator-splitting method is that it allows to separately solve each term of Eq. (3) with an appropriate numerical discretization method based on physical effects. A first-order operator-splitting method has been used to solve the augmented Burgers equation to simulate the sonic boom propagation, which is also available here. Alternatively, a Strangsplitting methodis also used to solve the differential equation to obtain higher discretization accuracy. A Strang-splitting method is used here:
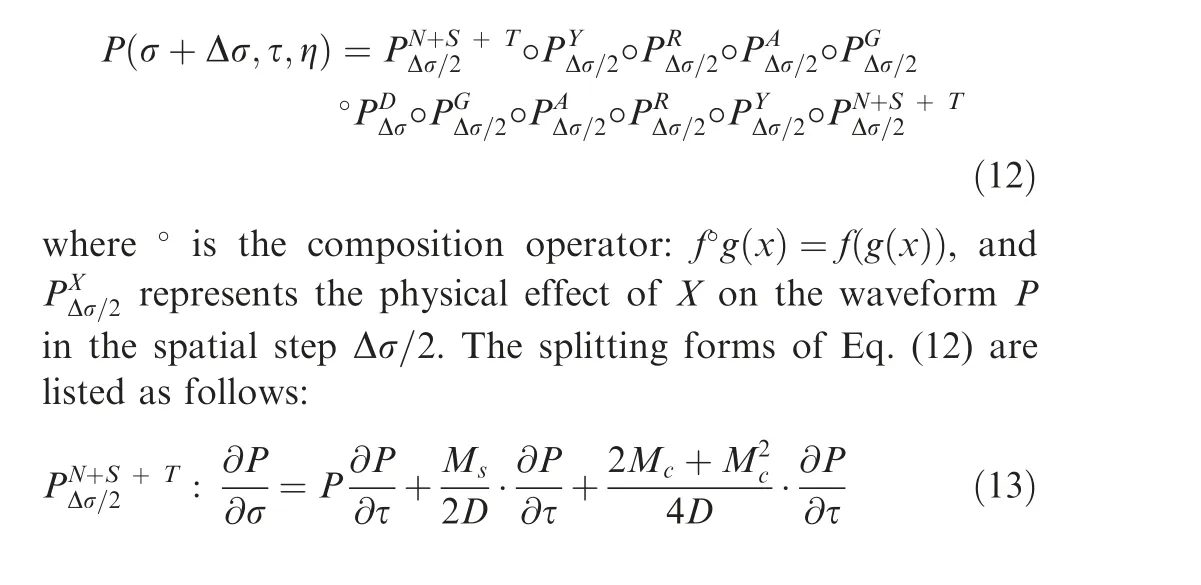
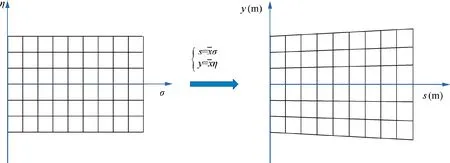
Fig. 2 Sketch map of transformation from uniform computational domain to physical domain.
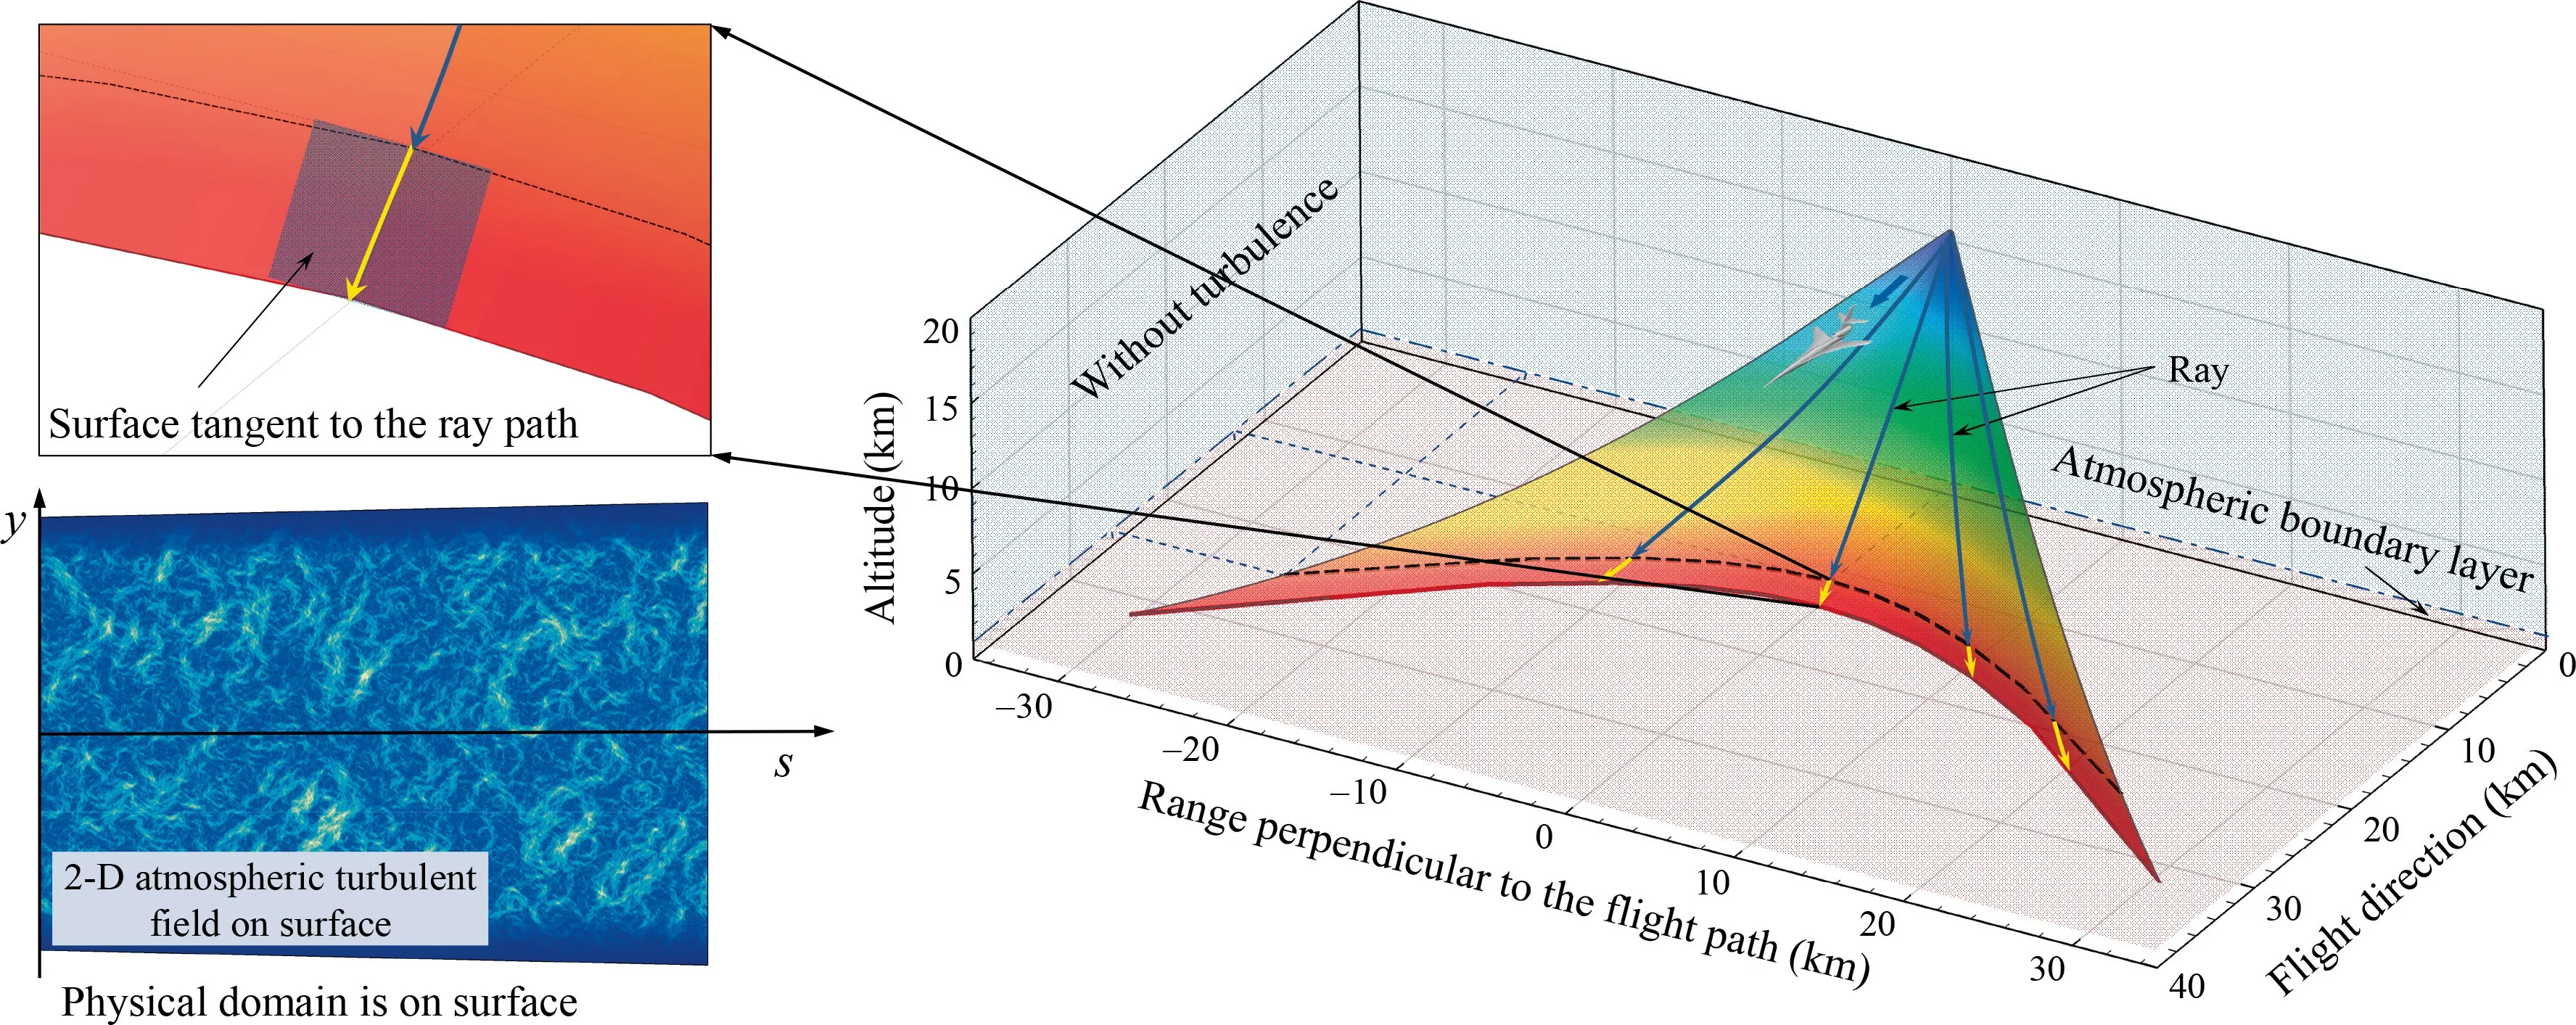
Fig. 3 Explanation for physical domain of two-dimensional modified HOWARD equation.
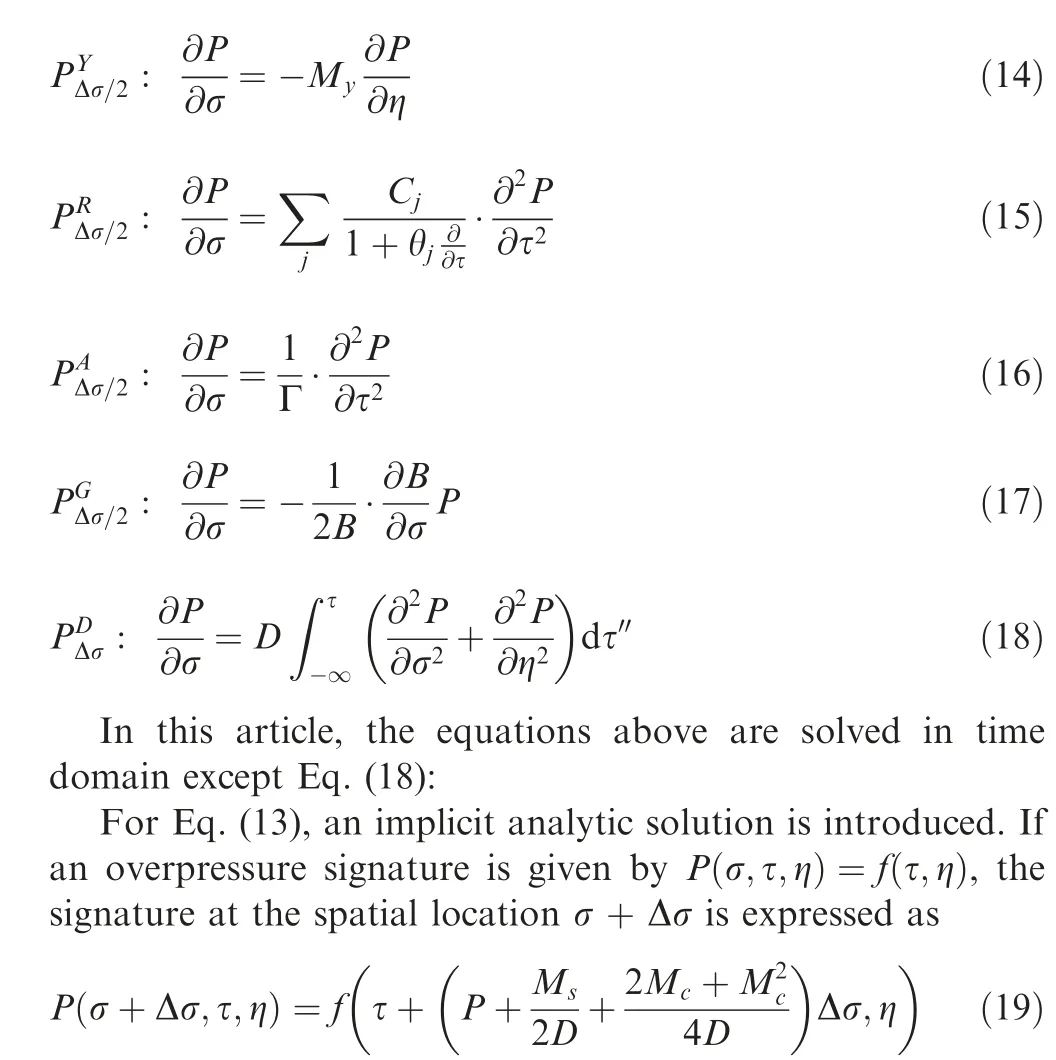
It is obvious that the moving speed of the pressure signature in the τ coordinate varies with the local acoustic pressure. A multivalued situation may occur in the numerical solution,when the value of Δσ is large enough. In fact, however, there must exist a shock. The Burger-Hayes methodis used to handle the multivalued situation to determine the location of a shock. It is exact except for the process of the interpolation of the analytic solution on the initial grid, which is the only approximation.
The similar algorithm with solving Eq. (13) is also applied to obtain the solution of Eq.(14).The analytic solution for this equation is

where Mvaries with the transverse position.
The numerical solutions of Eq. (15) and Eq. (16) are obtained using a Crank-Nicolson difference scheme.For the molecular relaxation equations,Eq. (15),the effects of oxygen and nitrogen are separately handled by the splitting manner.
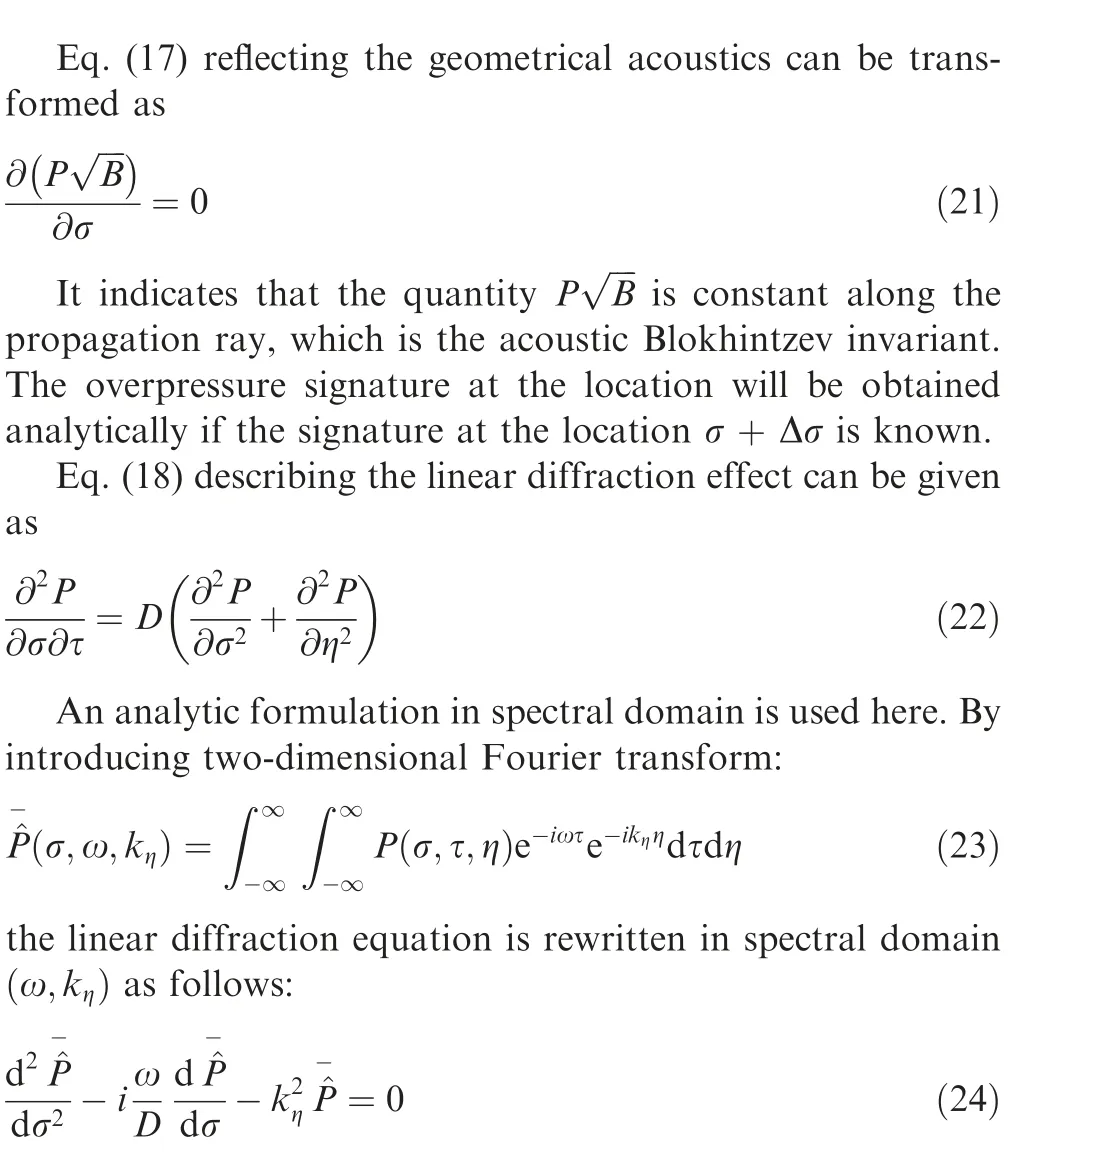
which is an Ordinary Differential Equation (ODE) of second order. The ODE solution is the superposition of two waves propagating both in direction of σ. To be consistent with the marching direction of solving Eq. (3), the wave propagating to the backward is ignored. In other words, only the part of the ODE solution describing the wave propagating to the direction of increasing value of σ is retained. This is the point where the one-way approximation of the HOWARD method reflects. The remained solution of Eq. (24) in the spatial step of Δσ is expressed as

The function of sign(ω)is to obtain the sign of the angular frequency ω. The first line of Eq. (25) describes propagation and decay of the evanescent wave in the forward direction,while the second line represents the wave propagating in the forward direction. The solution in time domain is given by using an inverse Fourier transform approach. A fast Fourier transform and the inverse algorithm are implemented based on the FFTW library in this article. It should be noted that the fast Fourier transform makes the overpressure signature periodic in the directions of τ and η.With an atmospheric turbulence field generated, an artificial absorption boundary in the transverse direction can avoid the aperiodic problem in the direction of. For the situation in the direction, increasing the sampling length of an overpressure signature can alleviate the influence of the rear of signatures on the fore due to the periodicity.
In Eq.(18),if ∂P/∂σis ignored under the condition of the slow axial amplitude variations compared to the ones due to the phase,it is a KZK-type parabolic equation to describe linear diffraction.For discarding the second-order partial derivative with respect to the main propagation direction,an efficient CNFD methodwith a tridiagonal system can be implemented. However, this method is not appliable to Eq. (18).
2.4. Framework of simulating propagation considering atmospheric turbulence
This section restates the framework for simulating sonic boom from the cruising altitude of a supersonic aircraft to the ground, which is shown in Fig. 4 (also see Fig. 1). The propagation ray of a sonic boom signature is traced by Eq. (11).Then,with the Atmospheric Boundary Layer(ABL)thickness given, the near-field signature is propagated by using the augmented Burgers equation from the cruising altitude to the top of ABL. The augmented Burgers equation is solved by applying a similar Strang-splitting method introduced in Section 2.3,with Eq.(13)marched in the step of Δσ and Eq.(15),Eq.(16)and Eq. (17) successively in the step of Δσ/2. In solving the augmented Burgers equation, Mand Mare zero in Eq.(13). After then, with the transverse range given (2L≈ABL in this article), an atmospheric turbulence is generated by the model of Section 2.2.The waveform at the top of ABL is taken as an input, and propagated through the turbulent field by using the modified HOWARD equation.In the last operation,the refraction of rays is not considered when the sonic boom enters the turbulent atmosphere from the non-turbulent atmosphere. The statistics analysis of the distorted waveforms may be required,which can be based on a series of waveforms along the transverse. The framework has been enclosed in our sonic boom prediction code ‘‘bBoom”.
3. Validation cases
3.1. Sine wave propagation in thermo-viscous medium
The viscous Burgers equation,describing the effects of nonlinearity and thermo-viscous absorption in Eq.(3),has an analytical solution in a series form, if the initial wave is a periodic sine wave and the thermo-viscous absorption parameter is constant. The analytical solutionis

where I(x) is the modified Bessel function of the first kind with order n. Herein, it is supported that 1/Γ is equal to 0.03,and the dimensionless distance σ is equal to 2.0.One period of the initial wave is discretized by 10001 points. Fig. 5 shows the comparison of the analytical solution and the numerical results with different splitting methods and different number of discrete points along the axis of. It is shown that numerical results converge to the analytical solution with the number of points increasing, which indicates that the numerical solving methods are confirmed. In the meanwhile, the results using Strang-splitting strategy are more consistent with the analytical solution, compared to the first-order operatorsplitting method (the normal splitting method).
3.2. Two-dimensional acoustic piston case
A two-dimensional acoustic piston with a single frequency is investigated to validate the diffraction effect described in Eq.(1) and the spectral-domain method. The piston vibrates with a single frequency f and causes pressure amplitude pin the range of [–a, a], at the initial boundary of s = 0. The sound speed cand the frequency f are set to 100 m/s and 100 Hz,resulting in the wavelength λ of 1 m. When the piston size a is the same order of magnitude as the wavelength λ,the diffraction phenomenon is obvious in the propagation of the sound caused by the piston.Herein,three acoustic pistons with different sizes of a={0.5λ, λ, 2λ} are considered. The numerical domain is 15 wavelengths in the main propagation direction s and 128 wavelengths in the transverse direction y so that the boundary reflections are not obvious. There are 40 points per wavelength in the direction s, 64 points per wavelength in the direction y, and 1024 points per period. The instantaneous pressure fluctuation fields caused by three pistons are shown in Fig.6.With the increase of the piston size,the directivity of sound propagation becomes more distinguished and side lobes appear clearly,which is qualitatively consistent with the physical laws. Fig. 7 shows the comparison of pressureamplitude fields between the numerical result and the analytical result in Ref.38,with the piston of size a=2λ.Moreover,the numerical result based on a two-dimensional KZK-type parabolic equation is also displayed here, which is solved on spectral domain.It is indicated that the numerical result based on the diffraction term in Eq.(1)(in fact,Eq.(18)used here)is in good agreement with the analytical result in both main and side lobes, while the KZK-type equation is only valid around the main lobe. Therefore, the validities of the description of the diffraction effect in Eq.(1)and its spectral-domain method are confirmed.

Fig. 4 Framework for simulating sonic boom from cruise altitude to ground in realistic atmosphere.
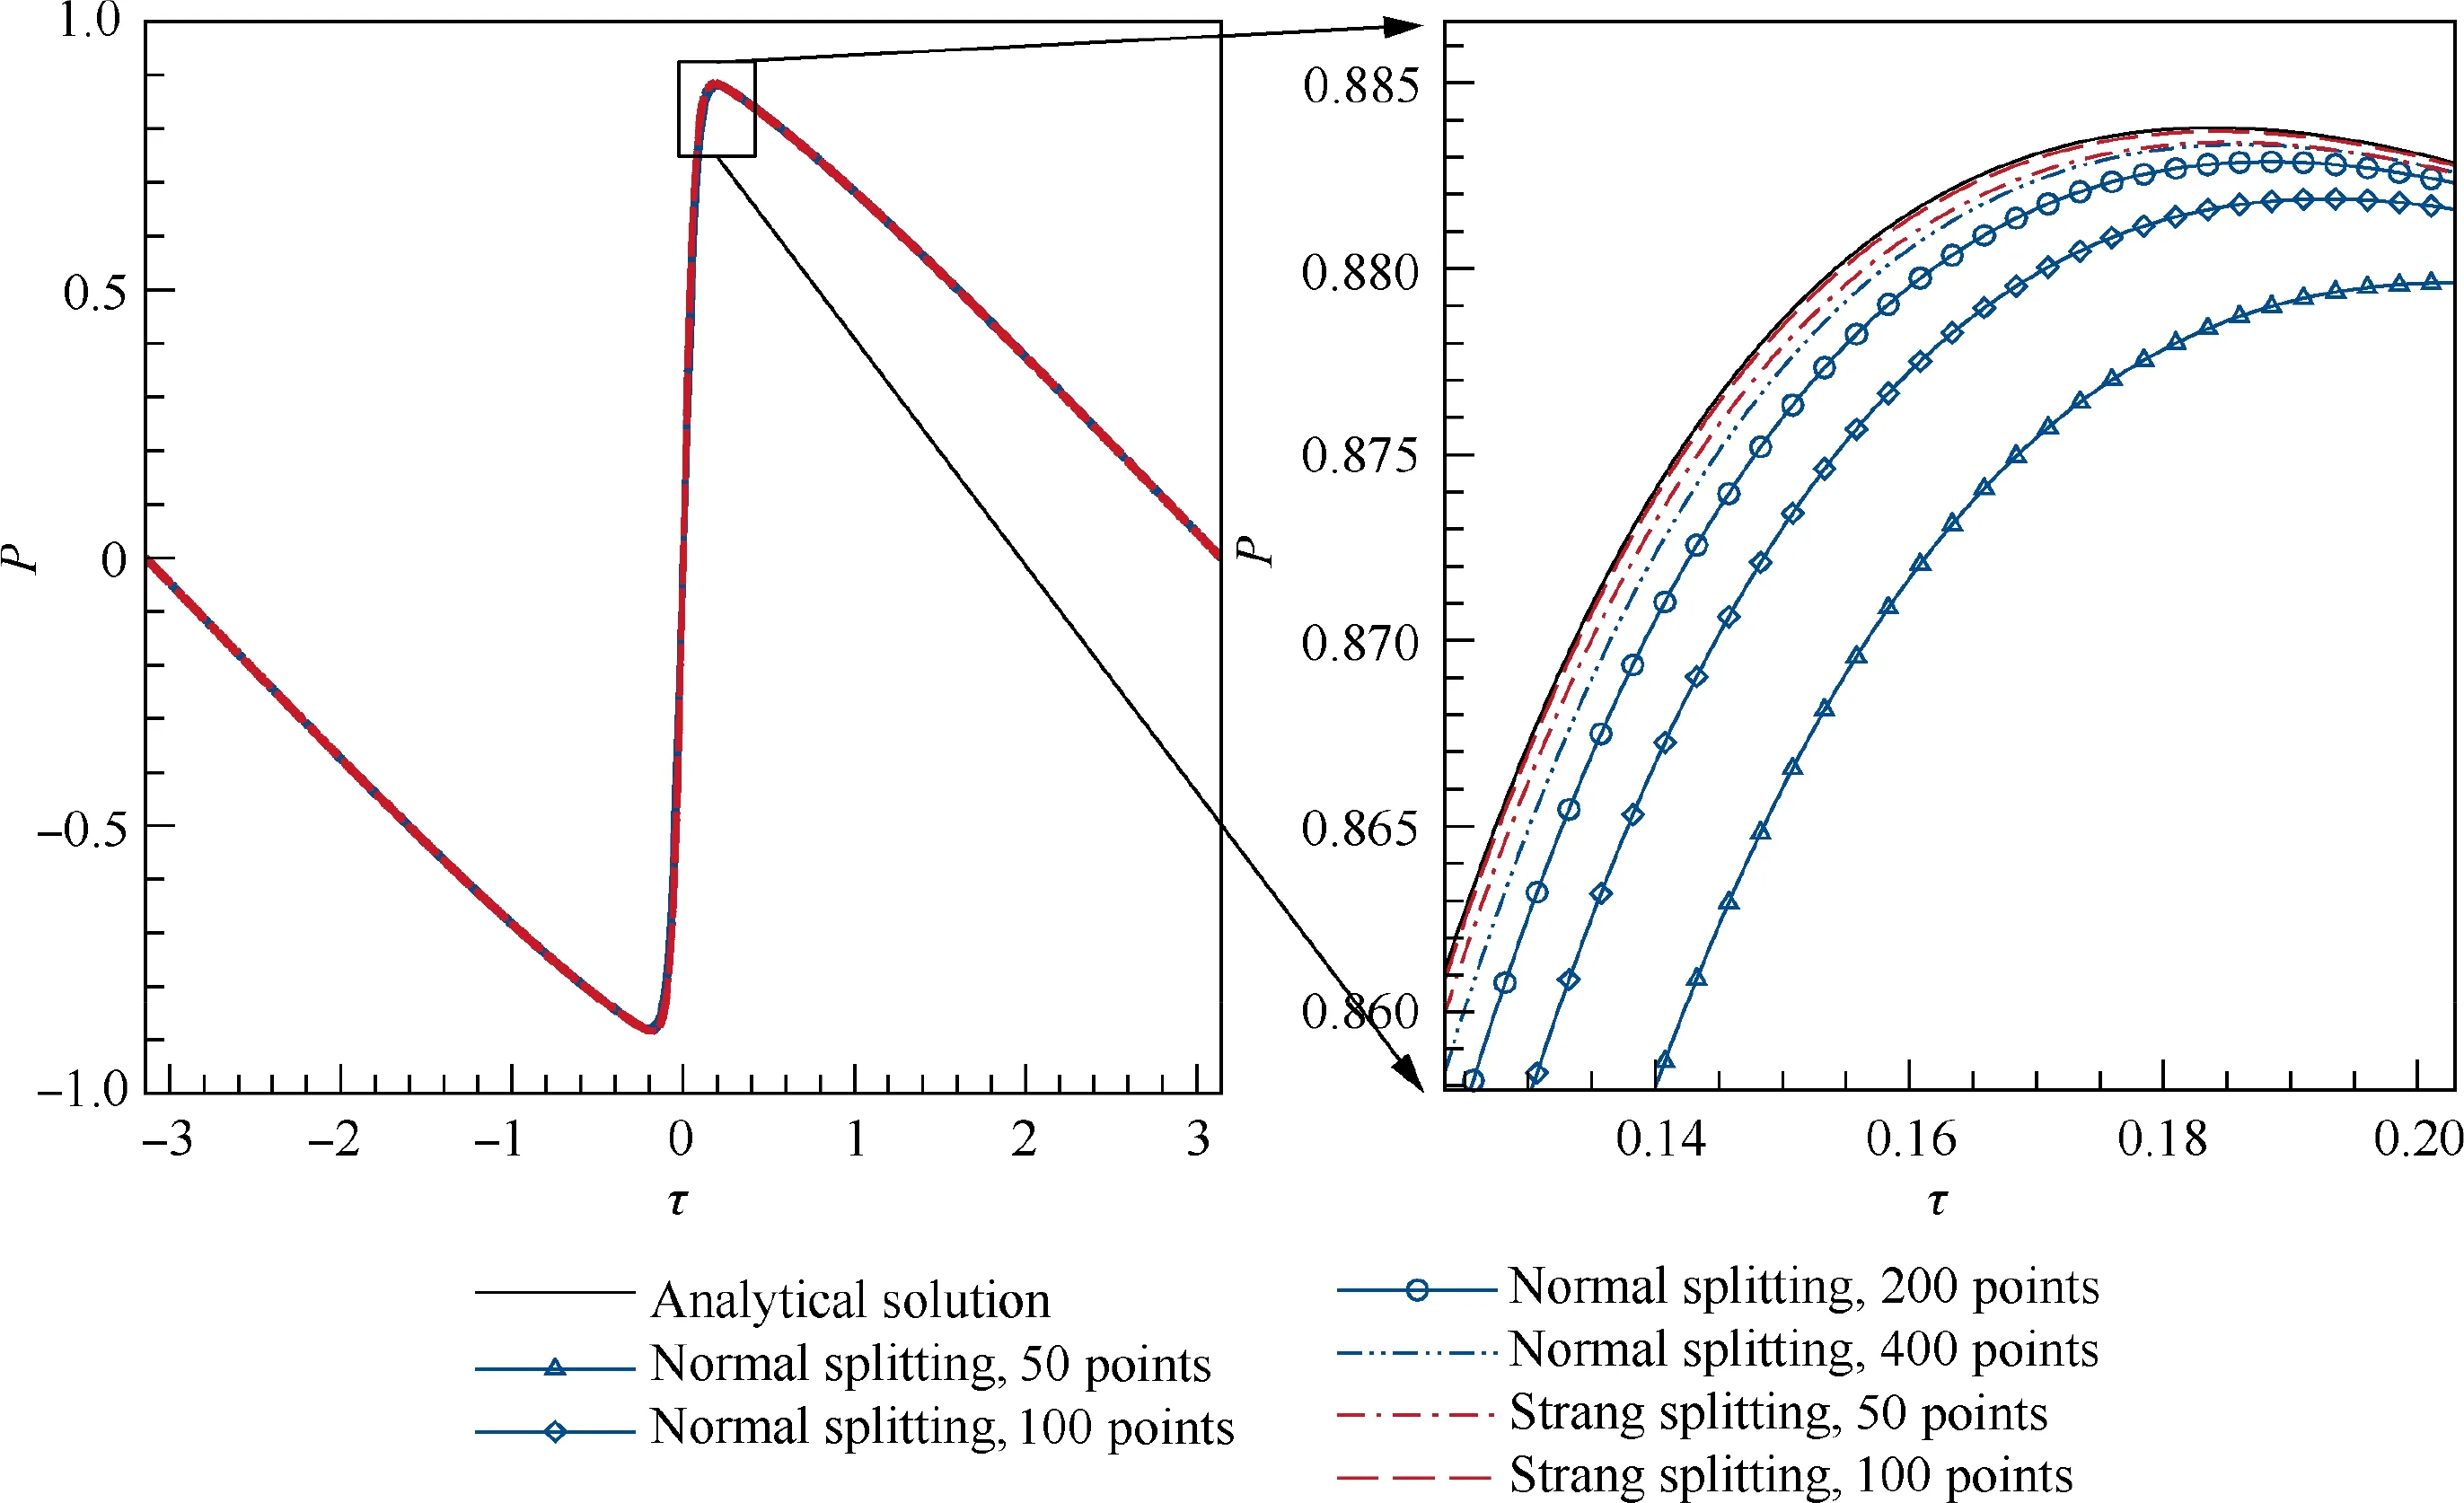
Fig.5 Comparison of analytical solution and numerical results using different splitting methods and different number of discrete points for dimensionless distance σ (1/Γ =0.03, σ =2.0).

Fig. 6 Instantaneous pressure fluctuation fields caused by 2-D acoustic pistons with single frequency.
3.3. JAXA D-SEND#1 LBM flight test case
This case is to demonstrate the framework of simulating sonic boom propagation considering atmospheric turbulence,beginning with a known geometry and the flight conditions,in order to validate the proposed approach. The Low-Boom Model(LBM), which is one of two in the JAXA D-SEND#1 flight testcarried out in May of 2011, is designed based on the sonic boom minimization theory and can generate a flattoptype waveform on the ground.The LBM is almost axisymmetric geometry, with the length of 8 m and the maximum diameter of 0.613 m, but there are four tails at the aft body. The detailed CAD model and the results of the flight test are available on the JAXA D-SEND project website.The purpose of the LBM is to validate the low-boom design concept in the project, compared with another model generating an N-wave on the ground. Two flight tests were conducted for the DSEND#1, the first flight-test data of the LBM used here. The model was dropped from a balloon at the altitude of about 21 km. The target Mach number of 1.4 for measurement was achieved at the altitude of about 6 km.The entirely flight conditions corresponding to sonic boom measurements on the far field have been searched.

Fig. 7 Comparison of pressure-amplitude fields between numerical results and analytical result (piston size is a = 2λ).
Firstly, the LBM near-field pressure is obtained by using a CFD solver for preparing to predict far-field waveform. A structured grid of size 8.48×10is created to simulate the flow field around the LBM and obtain the off-body pressure signatures.The simulation conditions are the Mach number of 1.42,the altitude of 5.8 km and the angle of attack of 0°.The Euler equations are numerically solved by an AUSM-type scheme for the space discretization and a LU-SGS implicit method in time. Four off-body pressure signatures are obtained at the locations of 0.5, 1.0, 1.5 and 2.0 times body lengths.Although the model is almost axisymmetric, a multipole analysis methodis used to modify the directly extracted signatures in order to improve the accuracy of far-field sonic boom prediction. The pressure signatures modified are shown in Fig.8(a),where the horizontal axis has been normalized by the Mach number and off-body locations.In the figure,L represents the length of LBM, R is the off-body distance. A cusp occurs at the beginning of every pressure signature with a flat region followed,which is the flattop-type low-boom feature on the near field.
Secondly,the obtained near-field pressure signature is propagated from the cruising altitude to the top of the Atmospheric Boundary Layer(ABL)based on the augmented Burgers equation, for preparing to simulate sonic boom through the ABL.The height of ABL is treated as about 500 m.The atmospheric condition is provided by the National Centers for Environmental Prediction (NCEPs), which can also be found on the JAXA D-SEND#1 project website.Four off-body pressure signatures are propagated by the bBoom code.When the sampling frequency or called interpolating frequency for discretizing pressure signatures is up to 800 kHz with the dimensionless marching step Δσ of 0.1, the predicted waveforms are convergent. Four waveforms predicted at the top of ABL are shown in Fig.8(b),where Δp is the overpressure of the farfield signature. The waveforms predicted from different off-body locations are in good agreement, especially on the fore of the waveform. However, around 0.028 s, the far-field waveform from the off-body distance of 0.5 time body lengths is relatively away from others.The predicted locations of rear shock based on the 0.5 and 1.0 time body lengths are behind two other results. With the off-body distance growing, the rear shock location predicted moves gradually to the left-hand side.The results from the off-body distance of 1.5 and 2.0 times body lengths are almost coincident. Therefore, the far-field waveform obtained from the location of 2.0 times body lengths is reliable.The flight-test result at the top of ABL is also drawn in Fig.8(b),which shows that the reliable prediction is mostly the same with the flight-test data although the location of the fore shock and the signature around 0.028 s are a little different. It is indicated that the prediction using the code is accurate.
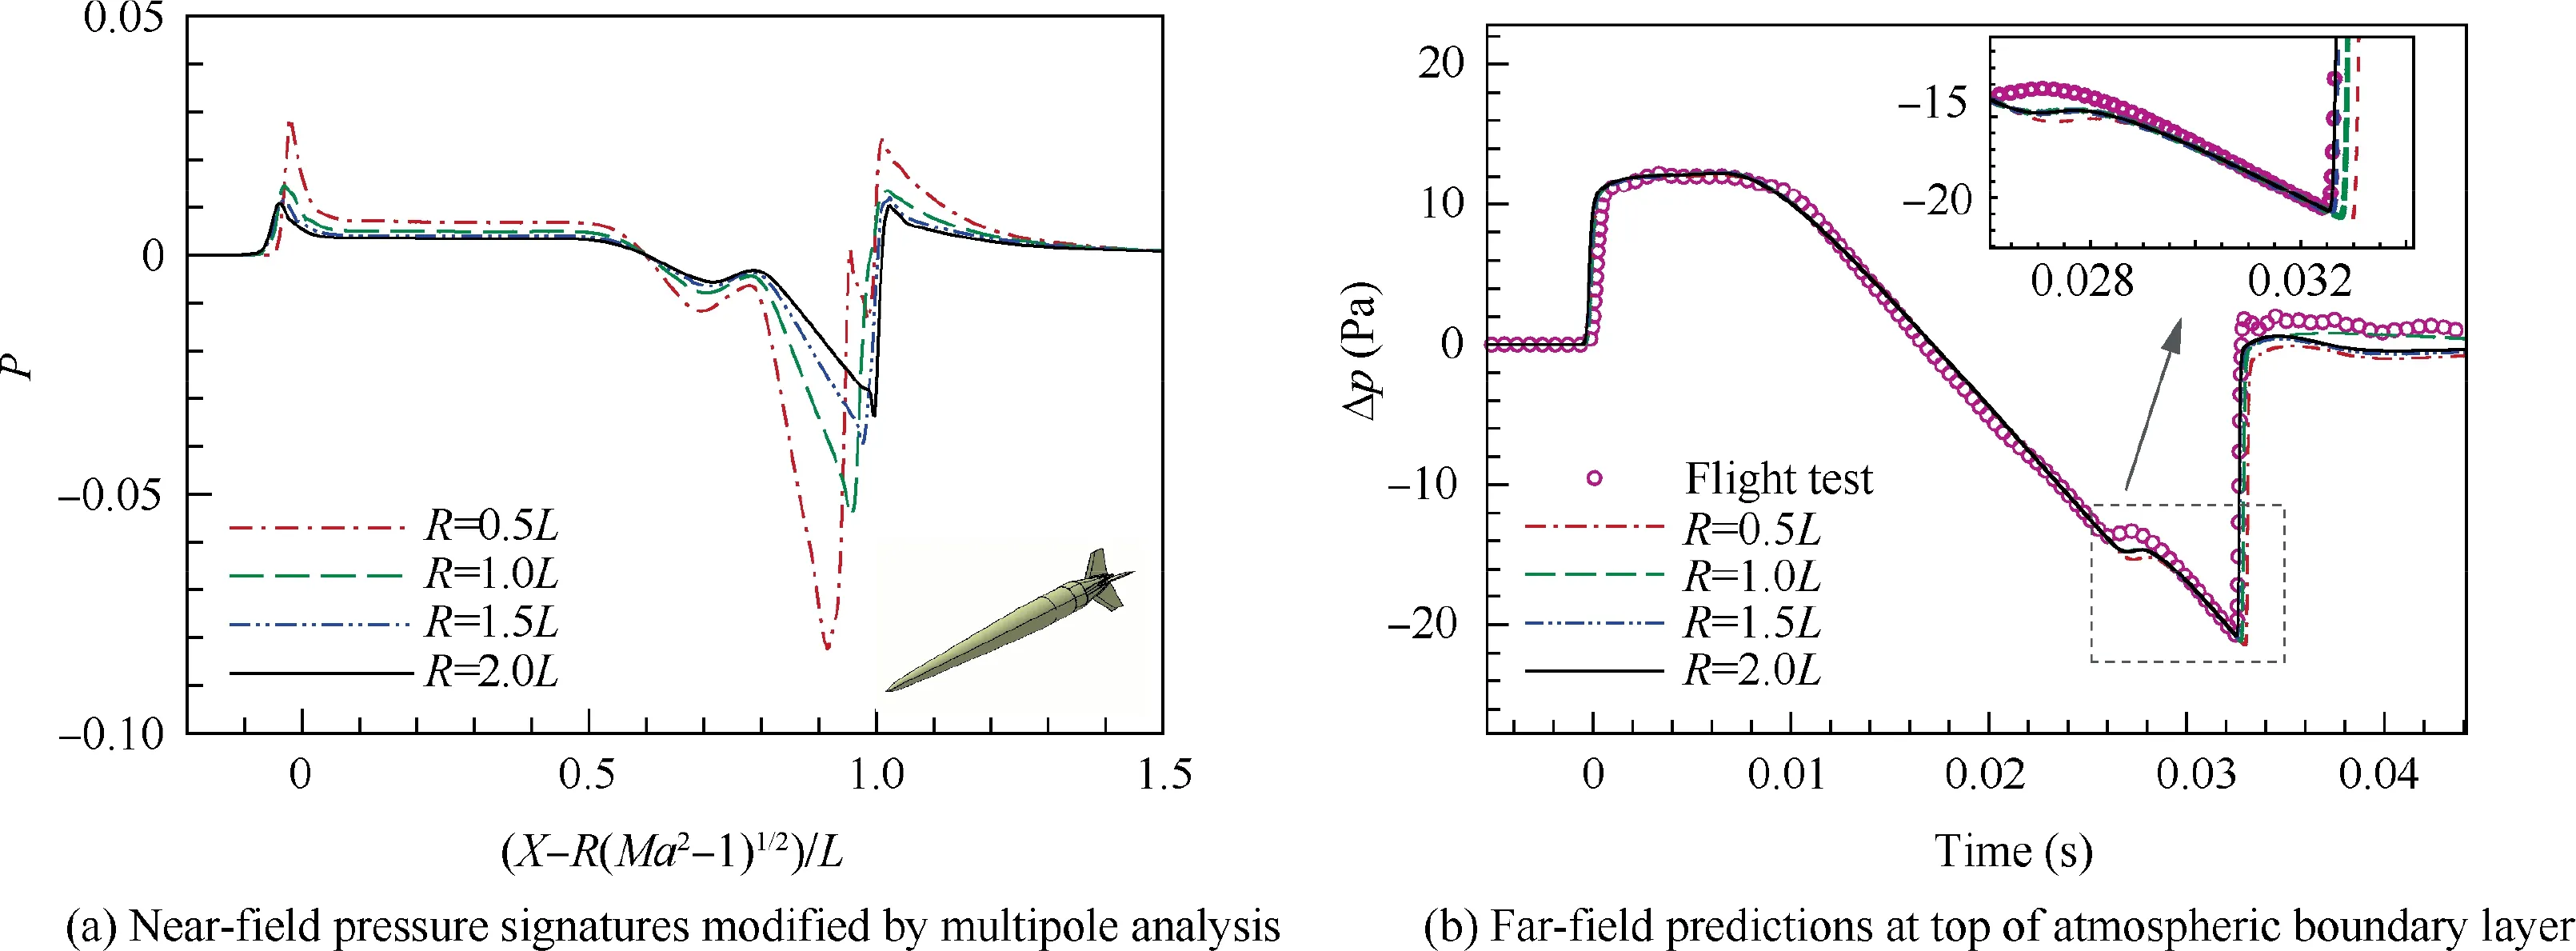
Fig. 8 Near-field signatures calculated by a CFD solver and comparison of far-field waveforms predicted by bBoom code with the measurement at the top of ABL (Ma = 1.42).
Thirdly, the waveform predicted from the location of 2.0 times body lengths is propagated from the top of ABL to the ground by using the modified two-dimensional HOWARD equation. The minimal transverse range is the same as the height of the boundary layer, which is about 500 m. The spatial resolutions in the main propagation s and the transverse direction y are respectively 0.5 m and 0.25 m. An isotropic and homogeneous atmospheric turbulence is created on the grid points by using 400 Fourier modes totally.The outer turbulence scale, the standard variances of wind fluctuation and temperature fluctuation are respectively set to 40 m, 0.6 m/s and 0.1 K, which are constant here. The two-dimensional turbulence generated is shown in Figs. 9(a)-(c).The coordinate s is calculated with the cruising altitude as the origin.As a result,the value of s corresponding to the top of the boundary layer is 7710 m.The transverse range increases with the increase of the value of s,due to the value of xincreasing with the decrease of altitude. At the upper and lower boundaries of the turbulence field, the intensity varies to zero gradually, the purpose of which is to avoid causing non-physical waveforms.
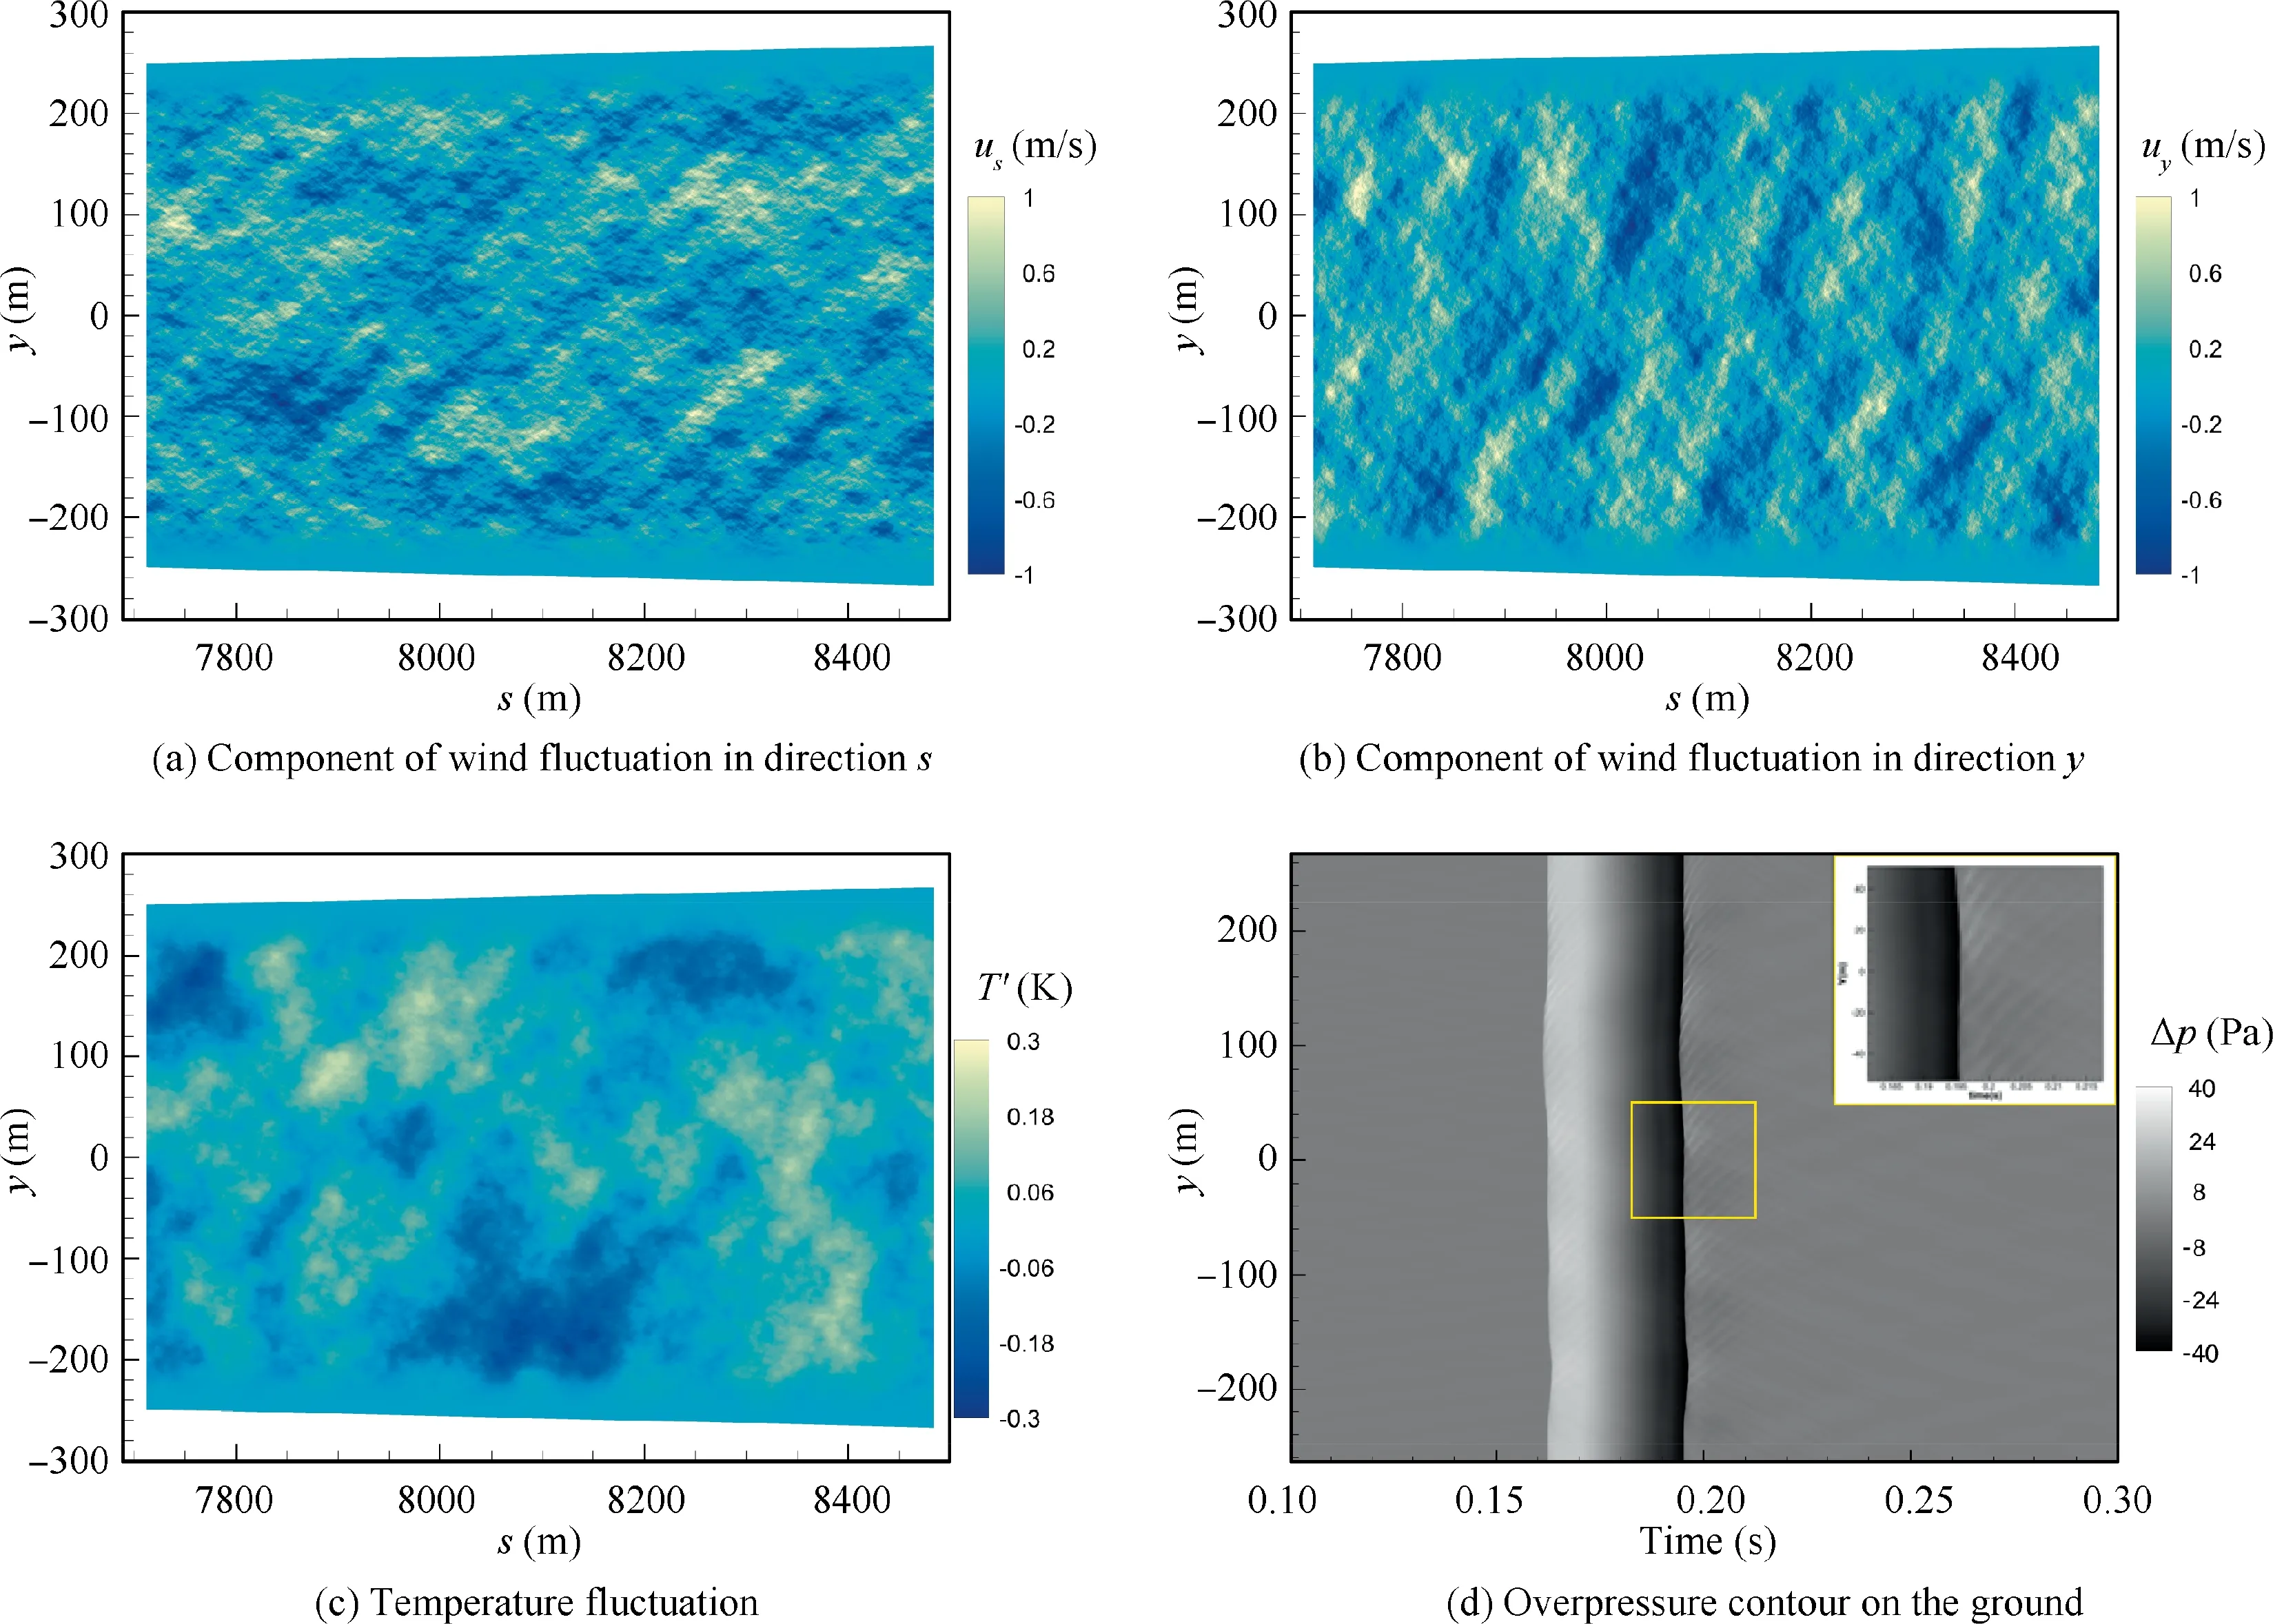
Fig.9 Two-dimensional atmospheric turbulence field generated by 400 Fourier modes and overpressure contour formed by signatures at different transverse locations (coordinate s is calculated with cruising altitude as origin).
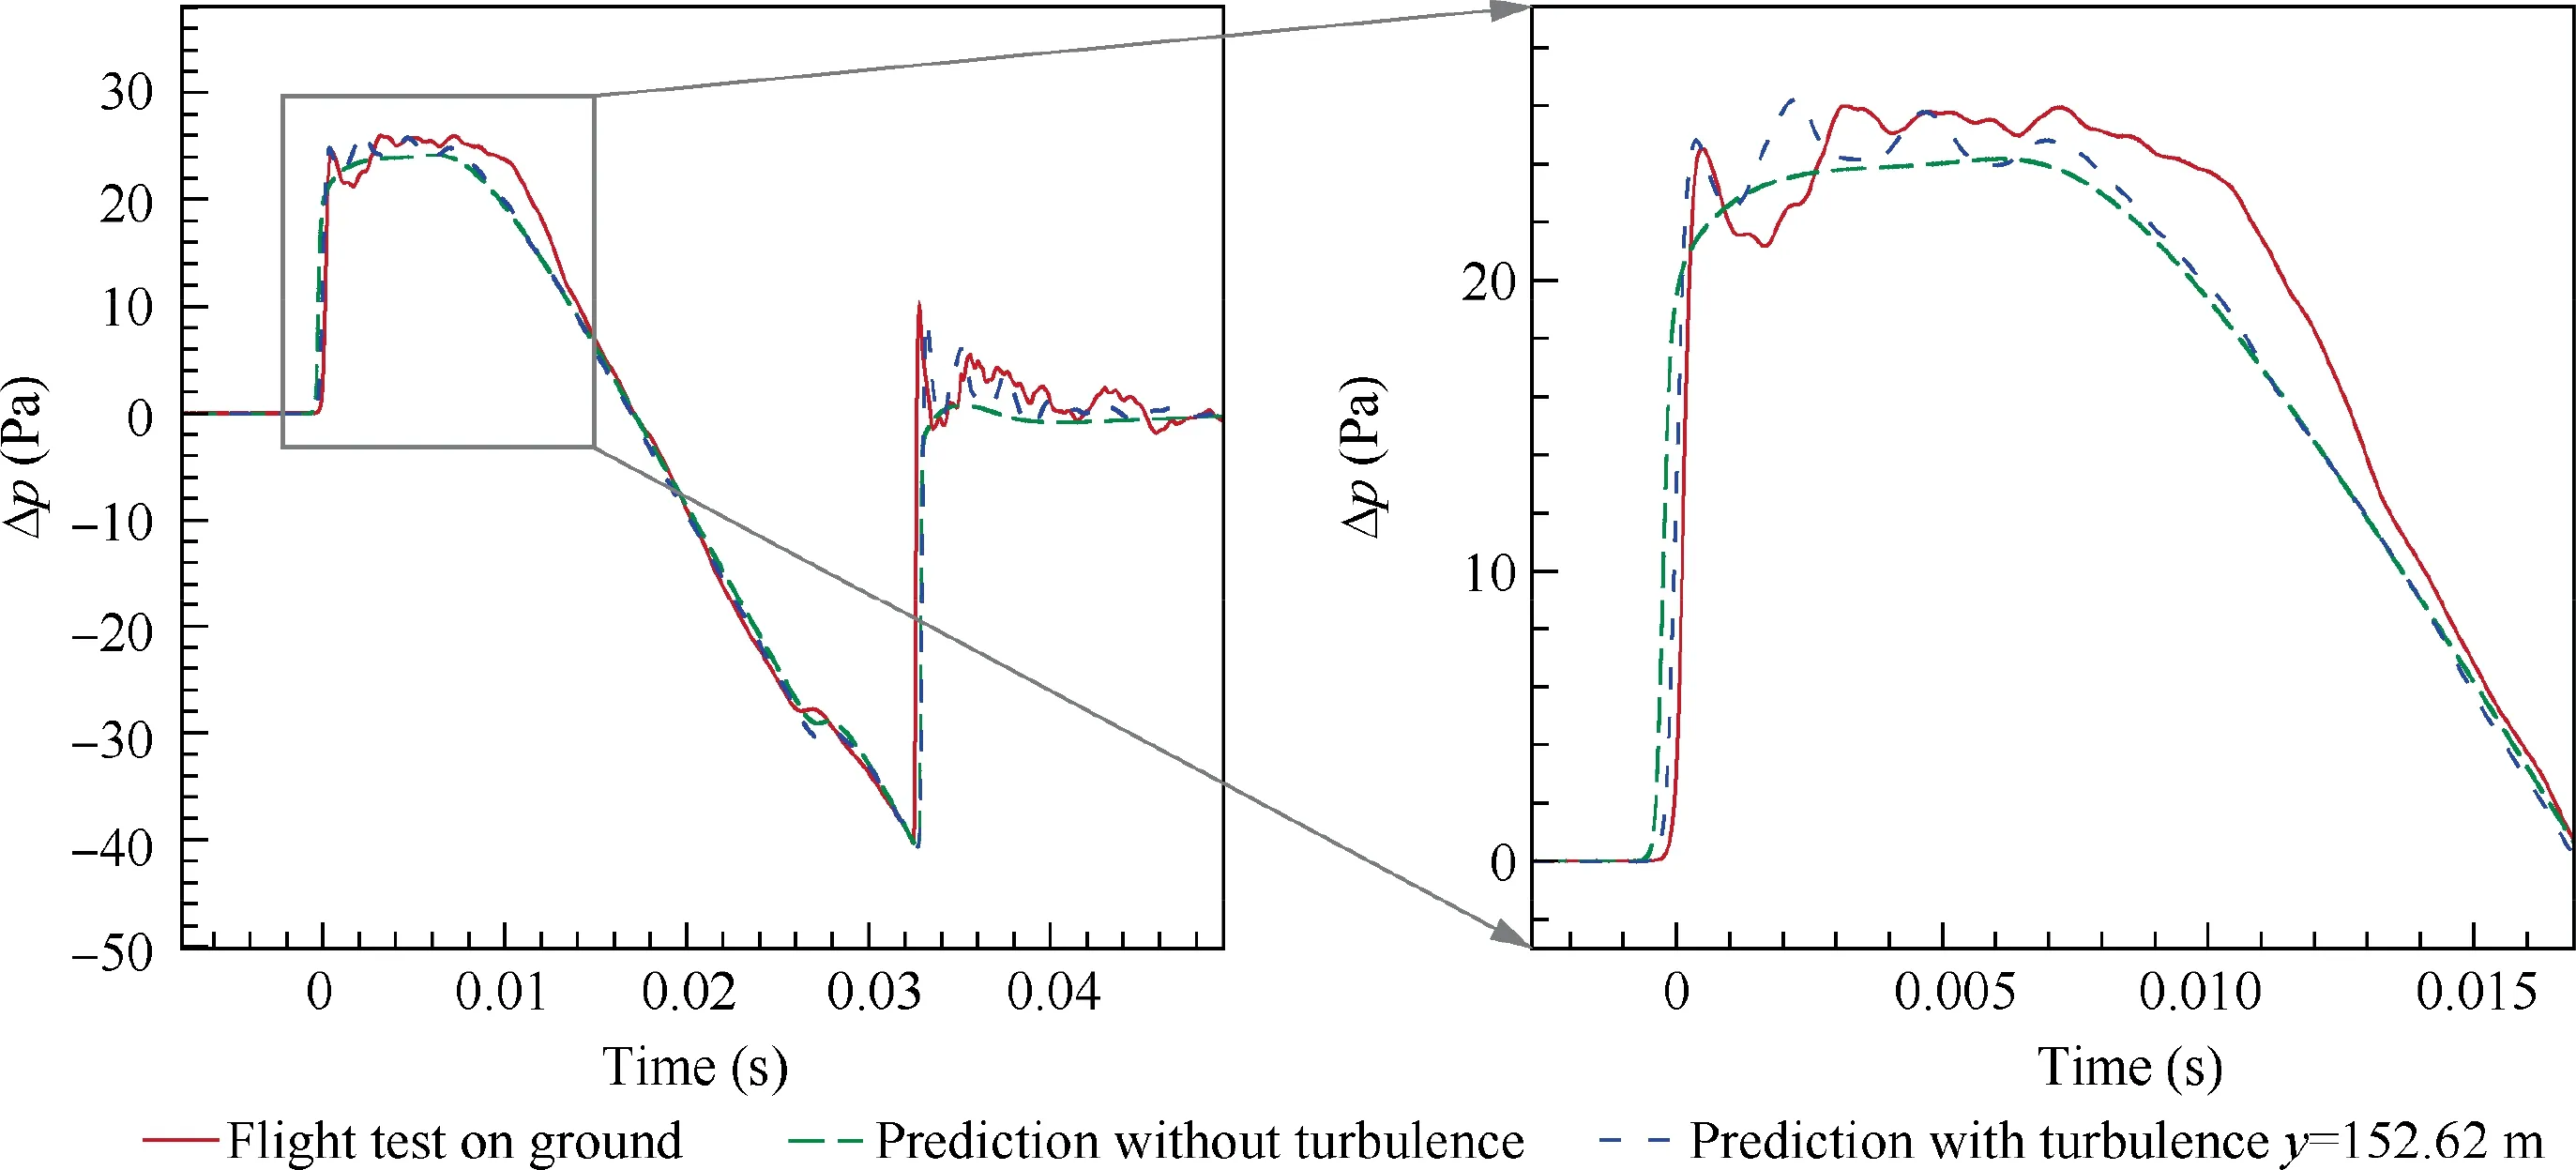
Fig. 10 Comparison of measured and predicted waveforms on ground (Flight data are from JAXA D-SEND#1 project website35).
The predicted ground-overpressure contour formed by signatures at different transverse locations is shown in Fig.9(d).The ground reflection is set to 2.0. The uniform sonic boom wavefront becomes irregular, for the random fluctuation of the turbulence field causing the different propagation speed at transverse locations.One can find the features of fishtail texture behind the wavefronts which are due to the combination of diffraction and convection effects that will be discussed in Section 4.1. Fig. 10 gives the predicted waveform at the transverse location of y = 152.62 m on the ground. The flight-test result and the predicted waveform without the effect of atmospheric turbulence are shown here.For the measured result,an abnormal sharp shock comes up at first with a much lower overpressure following, and then a perturbation lasts about 0.005 s where a flat-top signature should have appeared. The predicted result without the turbulent effect is monotone from the beginning of the fore shock to the peak overpressure,which is not in accordance with the flight-test data. The result considering the atmospheric turbulence reproduces the abnormal sharp shock and the random fluctuation.Furthermore,an overshoot is calculated in the rear shock, which is also seen in the flight-test result.In short,the ground-waveform prediction considering the turbulence is more consistent with the flighttest data than that considering not. The comparison indicates that the proposed approach is successful in considering the atmospheric turbulence, although there are still differences between the prediction and the flight-test data, especially in the range from about 0.008 s to 0.012 s.
4. Discussion about distortion of sonic boom
4.1. Analysis of distortion mechanism caused by turbulence
In this section, effects of convection and diffraction in atmospheric turbulence on sonic boom are investigated based on the modified HOWARD equation.The features of fishtail texture behind the wavefronts in Fig. 9 (d) are further explained.
4.1.1. Effects of convection in atmospheric turbulence
In the modified HOWARD equation,convection effects of the turbulence reflect in the last three terms of Eq.(3),which contain the effects of wind fluctuations in the axial and transverse directions and the effect of temperature fluctuation. With the convection effects considered only, the equation can be given as

The first term on the right side includes the effects of the axial convection and the temperature fluctuation. Since the turbulence field is assumed to be frozen during the propagation of sonic boom, the component of wind fluctuation in the direction of s and the increment of the sound speed due to the fluctuated temperature are invariable at a given grid point (σ,η). Therefore, the first term on the right side just shifts the waveform at the retarded time.Thus,when a normal N-type plane wave passes through the turbulence, its uniform wavefront becomes irregular,and the overpressure signature at different transverse locations becomes different at the same retarded time, with the gradient in the transverse direction generated.
In order to illustrate the phenomenon, an N-wave is propagated through an atmospheric turbulence of higher intensity,with the axial convection and the temperature fluctuation considered only. It is assumed that the N-wave at the top of ABL is generated by a supersonic aircraft cruising at the altitude of 11 km with the Mach number of 1.6, and the peak overpressure is 50 Pa with the duration time of 0.1 s and the rise time of 0.001 s. The height of ABL is treated as 500 m, with the outer turbulence scale of 40 m,the standard variances of wind and temperature fluctuations of 5 m/s and 1 K.The spatial resolutions in the directions of s and y are 1 m.The generated turbulence field is shown in Fig. 11, where there are totally 400 Fourier modes used.The comparison of the overpressure contours at the top of the boundary layer and on the ground is shown in Fig. 12, with the ground reflector of 1.0 assumed.One can observe that the uniform wavefront of the initial waveform is changed to an irregular wavefront by the turbulence.When one concentrates on the irregular wavefront,some small jaggies (see Fig. 13 (a)) along the wavefront will be found, which owe to the small-scale turbulence. At the retarded time of t=0.1 s,overpressures at different transverse locations are also compared, which indicates that the gradient in the transverse direction appears.It creates the condition for the convection of energy in the transverse direction.
The second term on the right side of Eq.(27)represents the transverse convection. Once an irregular wavefront occurs,there is the inequal overpressure at the same retarded time along the transverse direction, which leads to the transport of energy.The component of the wind fluctuation in the transverse direction determines the effect of the transverse transport of energy on waveforms. The N-wave mentioned above is propagated through the turbulence, with all convections considered. The effect of the transverse convection on the wavefront is shown in Fig. 13. One can find that the small jaggies owing to the small-scale turbulence become smoother in this case.However,the transverse of wind fluctuation is not always to do that,the result of which is relative to the local transverse fluctuated wind. Nevertheless, it is certain that the transverse convection will vary the irregular wavefronts caused by the axial convection.

Fig. 11 Two-dimensional atmospheric turbulence field with spatial resolution of 1.0 m in directions of s and y.
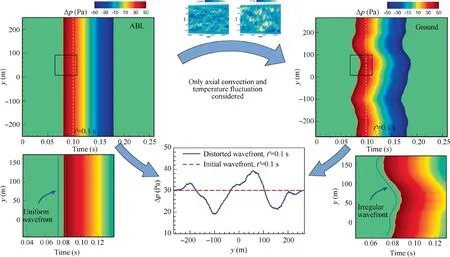
Fig. 12 Comparison of wavefront affected by atmospheric turbulence and initial wavefront.
4.1.2. Effects of diffraction in atmospheric turbulence
Before going any further, an N-wave with the peak overpressure of 50 Pa and the duration time of 0.1 s is propagated in a homogeneous medium with the sound speed of 340 m/s,for investigating the diffraction effect. The initial wavefront is not uniform.Fig.14 shows two cases where the initial wavefront is respectively distorted once and twice.The distortion of the wavefront results from delay of the portion, which can be described by a sine function with λRof 200 m and tof 0.04 s in Fig. 14 (a). There are 40 wavelengths and 40 points per wavelength in the transverse direction y. The N-wave is extended for 0.2 s respectively on the fore and the rear, where there are totally 8192 points. In the main propagation direction, discretization of 20 points per wavelength is adopted.With the initial wavefronts propagating 40 wavelengths, the wavefront folding and the focused waves are observed in Fig.15.Although the propagation speed at different transverse locations is equal, the propagation rays from the distorted wavefronts are converged and focused because the rays are along the unit normal vector of the local wavefront. The focused wavefront is no longer continuous, and the intensity is enhanced and decays backwards.
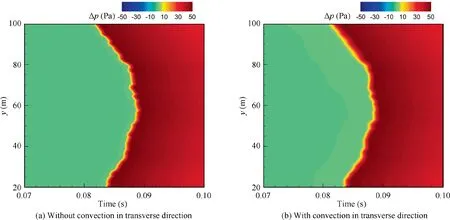
Fig. 13 Comparison of part of ground-overpressure contours with and without transverse convection effect.
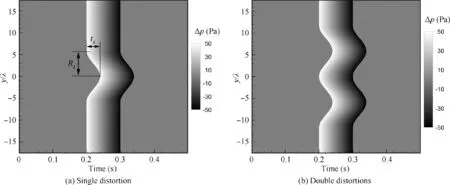
Fig. 14 Two distorted initial wavefronts propagating in a homogeneous medium. (Wavelength λ is 34 m.)
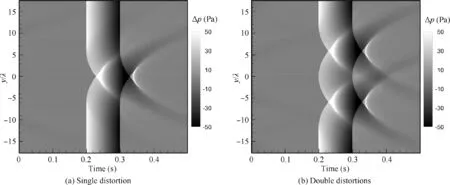
Fig. 15 Wavefronts obtained by distorted initial wavefronts propagating 40 wavelengths. (Wavelength is 34 m.)
In the previous section, it is mentioned that the convection effect can distort the uniform wavefront.Then,the diffraction effect will ripple and fold the distorted wavefront, causing a focused waveform. The N-wave described in Section 4.1.1 is propagated from the top of ABL to the ground with the convection and diffraction effects. The same sets for simulation are used but with the diffraction effect considered. The overpressure contour on the ground and two typical waveforms predicted are shown in Fig. 16. In the transverse range from y=0 m to y=100 m,a strong focusing phenomenon occurs because the wavefront in this range is delayed due to the convection effect of the turbulence according to Fig. 11 (a) and Fig. 12. There exists a peaked waveform with the peak overpressure almost twice that of the initial N-wave. In addition,a rounded waveform with the similar feature in many flight testsis reproduced in this simulation.
As shown in Fig.16,it is observed that the normal N-wave is distorted to become the waveform with small oscillation.Owing to the small jaggies on wavefronts (see Fig. 13), the diffraction effect focuses the distorted wavefronts and forms a series of caustic curves with different intensity that affect a wide transverse range. The caustic curves originate from the fore and rear shocks,which are essentially tangent to the local wavefront. When extracting the waveform at a given transverse location, the different caustics cause small oscillation on the waveform. If the turbulence intensity is small, caustics manifest as the features of fishtail texture.
The modified HOWARD equation proposed in this article considers the effects of the transverse convection of wind fluctuation and temperature fluctuation, compared with the original equation. The N-wave mentioned above is propagated from the top of ABL to the ground using the original equation at the same turbulent field. Fig. 17 shows the comparison of peak overpressure of waveforms simulated by the modified HOWARD equation and the original equation. In this case,the atmospheric turbulence has a relatively stronger velocity of wind fluctuation and obvious temperature fluctuation.Therefore, the difference between the two simulations, which is caused by the two new effects in the modified HOWARD equation, is significant, especially in the focus region from y=0 m to y=100 m.The comparison suggests that the modified equation could be appropriate for the case in which the effects of the transverse convection and temperature fluctuation cannot be ignored.
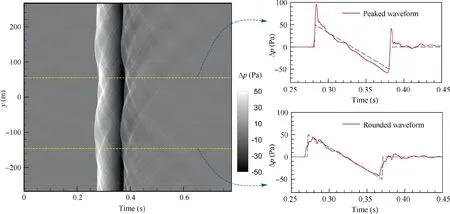
Fig. 16 Ground signatures of N-wave through atmospheric turbulence with effects of convections and diffraction.
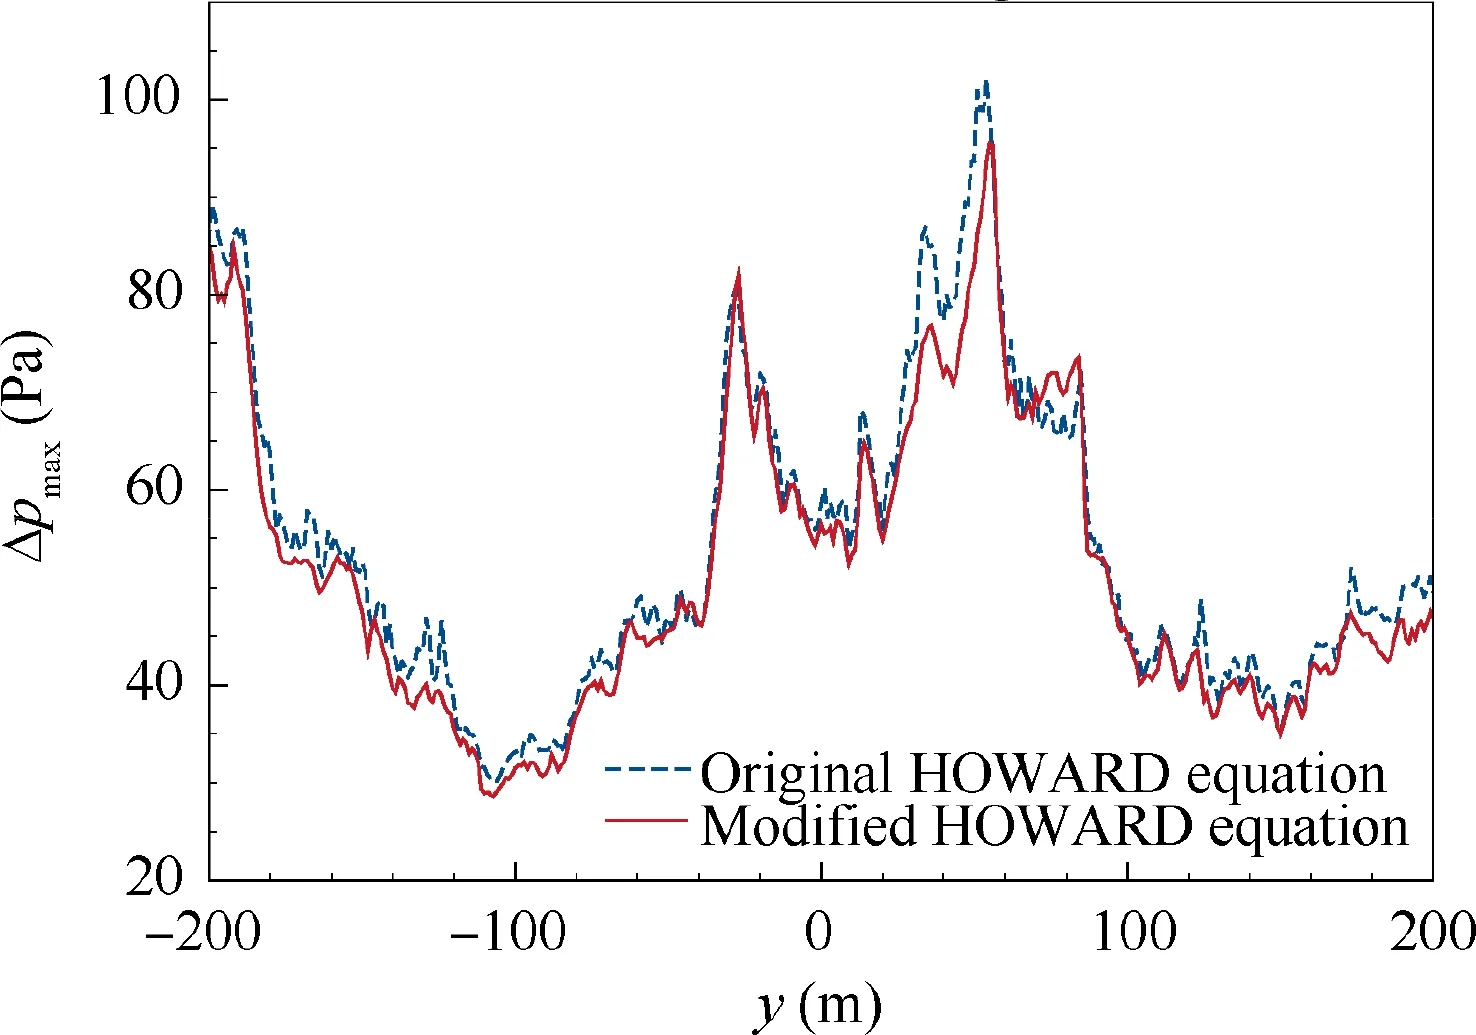
Fig. 17 Comparison of peak overpressure on different transverse locations simulated by different equations.
4.2. Effect of atmospheric turbulence on low-boom far-field waveforms
All the time, researches on supersonic aircraft are devoted to reducing the intensity of sonic boom. The sonic boom minimization theoryprovides the waveform with a minimal peak overpressure, like the flattop shape of JAXA LBM, and the waveform with a minimal initial shock.In this section,the performances of these two low-boom waveforms in an atmospheric turbulence are investigated by using the proposed method.
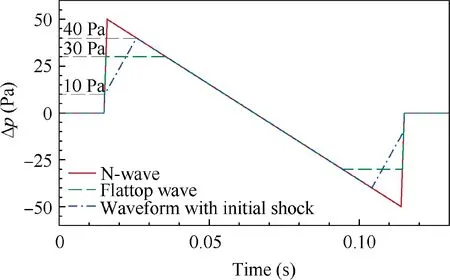
Fig. 18 Comparison of two types of low-boom waveforms and N-wave.
A flattop wave and a wave with a minimal initial shock are constructed by shaping the N-wave described in Section 4.1.1.The peak of the flattop wave is assumed to be 30 Pa,while the peak of another shaped wave is 40 Pa with the initial shock of 10 Pa. Three waves have the same duration, the same slop of the expansion and the same slop of rise time,which are shown in Fig. 18. It is assumed that three waves are observed at the top of ABL, which are respectively generated by three supersonic aircraft cruising at the altitude of 11 km with the Mach number of 1.6. With the same generated turbulence as in Section 4.1.1, three waves are propagated through the atmospheric boundary layer by the modified HOWARD equation with all effects considered. The sets for simulation are also the same as the preceding. For comparison, the results on the ground are predicted by the augmented Burgers equation without the turbulence. The ground reflector is 1.0 in all simulations.
For each case, 431 waveforms affected by the turbulence are obtained from the different transverse locations for statistical analysis.In fact,there are 537 waveforms along the transverse direction with the resolution of 1.0 m,but 106 waveforms are in the region of the turbulence boundary described in Section 2.2, which are not included here. The histograms of peak overpressure of observable waveforms are shown in Fig. 19.Statistics about distorted waveforms on the ground is shown in Table 1. For the case of the N-wave, the mean peak overpressure of waveforms is 53.55 Pa, which is slightly greater than the result of the non-turbulence atmosphere. The peak overpressure of 48.5% of waveforms is greater than that in the situation without the turbulence, and the maximum is 2.22 times the latter.For the case of the flattop waveform,the mean value is 36.63 Pa,which is about 7 Pa lower than the case of the N-wave. The benefit of decreasing sonic boom intensity remains in the turbulent atmosphere as that in the atmosphere without turbulence. However, the peak overpressure of the flattop wave tends to be increased, about 71.5 % waveforms appearing. For the case of the wave with a weaker initial shock,the mean value is slightly lower than the peak overpressure in the non-turbulence atmosphere. Only 35.3% of waveforms are greater than that in the non-turbulence atmosphere.
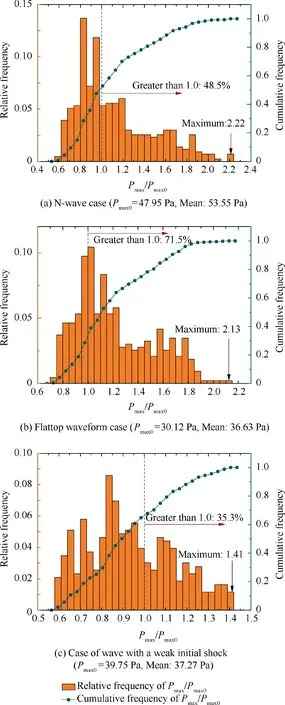
Fig.19 Statistics of peak overpressure of waveforms affected by turbulence.(The variable Pmax represents the peak overpressure of waveforms affected by the turbulence, while Pmax0 is that not affected by the turbulence.)
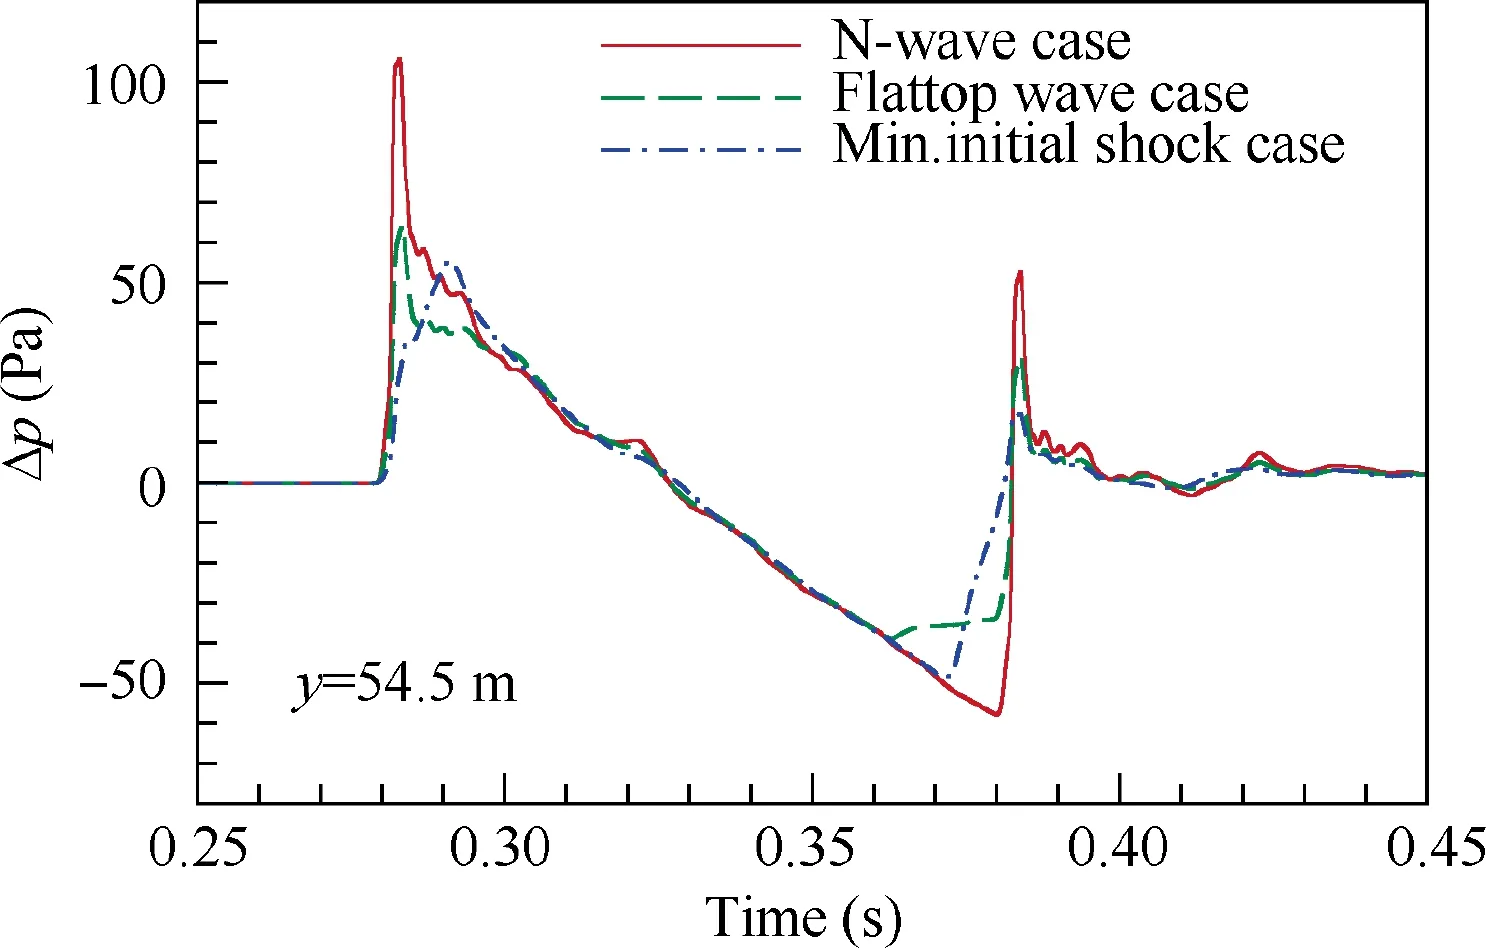
Fig. 20 Comparison of peaked waveforms of three cases under action of turbulence.
It is obvious that two low-boom waveforms have a lower mean value of the peak overpressure compared with the Nwave. The atmospheric turbulence prefers to reduce the peak overpressure for the wave with a weaker initial shock, while it is the opposite for the flattop waveform.In addition,the distribution of the wave with a weaker initial shock is much more centralized.Therefore,from this view,the wave with a weaker initial shock may be better in the turbulent atmosphere.
Fig. 20 shows the comparison of the peaked waveforms in three cases,which are extracted from the same transverse location of y = 54.5 m. The remarkable spike is generated at the fore and rear shocks for the cases of the N-wave and the flattop waveform.The flat-top feature of the flattop waveform has disappeared after the initial shock,while the feature before the rear shock is still obvious.By comparison,although the initial shock of another low-boom waveform wants to be a spike, it fails eventually because the initial shock is too weak. In short,it shows that the wave with a weaker initial shock is beneficial for a low-boom supersonic aircraft in the situation of turbulent atmosphere.
5. Conclusions
The two-dimensional HOWARD equation is extended to account for the effects of temperature fluctuation and transverse wind fluctuation, and an improved method for far-field sonic boom prediction is proposed in this article. A modelfor generating atmospheric turbulence and a numerical algorithm for solving the modified equation are presented. A framework of predicting the ground-level sonic boom, which combines the modified HOWARD equation for the region of the atmospheric boundary layer and the augmented Burgers equation for the region ranging from the cruising altitude to the top of the layer,is presented.Two analytical solution cases and the flight-test data of the JAXA D-SEND#1 LBM are chosen to validate the proposed method. Then the proposed method is applied to study the effects of atmospheric turbulence on sonic boom waveforms, with N-waves and two lowboom waveforms as examples.

Table 1 Statistics of distorted waveforms predicted on the ground for three cases.
Some conclusions are drawn as follows:
(1) The improved method is valid to consider the effect of atmospheric turbulence, since the predictions are in good agreement with the flight-test data of the JAXA D-SEND#1 LBM.
(2) The modified HOWARD equation reproduces the peaked and rounded waveforms at the ground, which have been observed in many flight tests.
(3) The axial convection and the temperature fluctuation in atmospheric turbulence make uniform sonic-boom wavefronts irregular, which make the condition for transverse convection of sound energy and the diffraction effect. The diffraction effect will focus and defocus the irregular wavefronts to produce the peaked and rounded waveforms respectively.
(4) The far-field waveform with a weaker initial shock is beneficial for the design of a low-boom supersonic aircraft,since the atmospheric turbulence prefers to reduce the peak overpressure for the wave with a weaker initial shock.
Future work beyond the scope of this article is to extend the modified two-dimensional HOWARD equation to the threedimensional system considering the incident direction of sonic boom entering the layer, to develop discretization schemes for more accurately solving the equation, and to improve the atmospheric turbulence model for describing the inhomogeneous effect.Moreover,it is of great significance to investigate the effects of the atmospheric turbulence intensity on sonic boom, which is to be carried out using the proposed method.Based on the present work, one can further research the shaped waveform for a low-boom design aircraft.
The authors declare that they have no known competing financial interests or personal relationships that could have appeared to influence the work reported in this paper.
This research was supported by the National Natural Science Foundation of China (Nos. U20B2007, 11972305), the Aeronautical Science Foundation of China (No. 2019ZA053004),the Shaanxi Science Fund for Distinguished Young Scholars(No. 2020JC-13) and the ‘‘111” Project of China (No.B17037). The work was carried out at National Supercomputer Center in Tianjin, and the calculations were performed on TianHe-1A.
 Chinese Journal of Aeronautics2022年9期
- Chinese Journal of Aeronautics的其它文章
- Effect of vortex dynamics and instability characteristics on the induced drag of trailing vortices
- Dynamic modeling and beating phenomenon analysis of space robots with continuum manipulators
- An effective crack position diagnosis method for the hollow shaft rotor system based on the convolutional neural network and deep metric learning
- A homogenization-planning-tracking method to solve cooperative autonomous motion control for heterogeneous carrier dispatch systems
- Static magnetic field analysis of hollow-cup motor model and bow-shaped permanent magnet design
- Adaptive modification of turbofan engine nonlinear model based on LSTM neural networks and hybrid optimization method
