Effect of vortex dynamics and instability characteristics on the induced drag of trailing vortices
Zepeng CHENG, Shiyn ZHANG, Yng XIANG, Chun SHAO,Mio ZHANG, Hong LIU, Yingchun CHEN,*
a School of Aeronautics and Astronautics, Shanghai Jiao Tong University, Shanghai 200240, China
b Shanghai Aircraft Design and Research Institute, Commercial Aircraft Corporation of China Ltd., Shanghai 201210, China
KEYWORDS Induced drag;Linear stability analysis;SPIV;Trailing vortex;Vortex flow;Winglet
Abstract In this paper,trailing vortices generated by three wingtip configurations,namely the M6 wing and the M6 wing with a blended or split winglet, are experimentally investigated using the Stereo Particle Image Velocimetry (SPIV) technology. Then, linear stability analysis is performed to investigate instability characteristics. Three corresponding trailing vortex patterns, including the isolated trailing vortex without wake(pattern v)and with wake(pattern v-w),co-rotating vortex pair (pattern v-v), are observed in experiments. The strength of trailing vortices, characterized by circulation, is reduced after installing winglets as expected, and the strength of pattern v-v can be further suppressed compared with pattern v-w. Moreover, instability characteristics, such as the eigenvalue spectrum and perturbation mode, are distinctive among these three vortex patterns.The distribution of eigenvalue spectrums indicates that pattern v and pattern v-w are temporally‘‘marginally stable”, while pattern v-v is temporally ‘‘unstable.” The primary perturbation mode of pattern v and pattern v-w is the m =-1 helical mode, while |m|>1 for the case of pattern v-v.The effect of vortex dynamics and instability characteristics can be concluded in two aspects.Firstly,the value of induced drag is polluted by about 3%from vortex wandering since vortex wandering affects the tangential velocity and streamwise vorticity of trailing vortices. Secondly, the growth rate and penetration depth perturbation mode affect trailing vortex evolution and further affect induced drag.Specifically,the larger the growth rate and penetration depth are,the more turbulence injects inside the vortex core, thus leading to a quicker and more intense attenuation of trailing vortex, as well as a smaller induced drag. This finding can guide us to manipulate the induced drag in flow control.
1. Introduction
A typical vortex flow in nature, the trailing vortex, or wingtip vortex,is a large-scale vortex structure formed at the tip region due to the pressure difference between upper and lower surfaces of the wing. Due to its significant impacts on induced drag,wake encounter,and aerodynamic noise,both science and industry have been devoting continuous attention to trailing vortex.
To alleviate the effects above, particularly adverse consequences that result from the induced drag and wake encounter,two strategies were put forward by Gerz et al., namely low vorticity vortex strategy and quickly decaying vortex strategy.Recently, these vortex-dynamical-based strategies have been updated as modifying vortex and accelerating instability attenuation of the vortex from the perspective of instability characteristics by Hallock and Holza¨pfel.As one of the common and efficient measures to reduce drag, winglets are usually installed on large airliners and have developed into diverse configurations,which change the dynamic and instability characteristics of trailing vortices. Therefore, it is an interesting question whether existing and future winglets can both reduce induced drag and accelerate trailing vortices attenuation through imposing effects on dynamics and instability characteristics.
The induced drag is closely related to vortex structure, of which the generation mechanism and calculation have always been the focus. In aspects of vortex structure, a large body of experimental results indicates that dynamical characteristics, including the velocity profile and radial circulation, are self-similar.Lee and Heexperimentally compared the effects of cropping, anhedral, Gurney flaplike strips winglets to compare trailing vortices and aerodynamic properties generated by a wing with different wing configurations. Their work showed that the cropping would lead to a minor change in vortex flow property and aerodynamics, while anhedral produced inferior aerodynamics but strengthened vortices compared to the baseline wing.Gurney flaplike strips increased both the lift and drag and vortex strength.As for induced drag calculation,the far-field wake integral method is most widely used in an actual trailing vortex flow, first reported by Maskellfor a low-speed isentropic trailing vortex flow. Based on his derivation, the induced drag can be obtained by the product of streamwise function and streamwise vorticity, which also equals the kinetic energy in cross-section. After Maskell, the axial effect, denoted by Axial Velocity Defection (AVD) on induced drag, was made up in the analysis of Giles and Cumming.Furthermore, Birch et al.considered the consequences of inflation effect, which is denoted by the product of potential velocity and source term,and found that the inflation effect would make induced drag smaller. For a transonic or hypersonic trailing vortex flow,the induced drag can be calculated by the method put forward by Van Vooren and Slooff,and Destarac,while an unsteady term can be introduced for unsteady flow configuration.In another aspect,Devenport et al.found that the peak velocity of tangential velocity and AVD would be underrated by 15% and 11%due to vortex wandering for a Batchelor theory vortex flow.These effects inevitably affect the integration parameter, thus further affecting induced drag. In this situation, investigation about the effects of vortex wandering,as well as other instability characteristics on induced drag,is necessary and significant.
In respect of vortex instability characteristics,one can conclude from three aspects: long-wavelength instability, shortwavelength instability, and vortex wandering. Concerning long-wavelength instability, one of breakthrough works was conducted by Crow,who modeled long-wavelength instability of trailing vortices and explained it as three combined effects:(A)self-induced rotation opposite to the rotation direction of core fluid; (B)motion induced by the other vortex;(C)mutual induced motion of two vortices. Corresponding to Crow instability, another significant instability phenomenon of the trailing vortex is short-wavelength instability resulting from the resonance mechanism of two Kelvin modes.For a relatively low Reynolds number (10-10), the resonance phenomenon occurs as long as |m-m|=2 is satisfied,where m, mare circumferential wavenumbers of Kelvin modes, respectively. Besides, the vortex wandering, one of the other manifestations of vortex instability, has also drawn much attention since it was observed in water tunnel experiments by Baker et al..Recently,Cheng et al.experimentally investigated the trailing vortices system generated by a NACA0020 rectangular wing and installed with a blended winglet, raked winglet, and split winglet, indicating that the vortex strength can be suppressed by controlling the wandering amplitude. This idea is confirmed by Dghim et al., who looked into the control mechanism of trailing vortex wandering onset of five synthetic jet configurations. Their experimental results suggested that the lower-frequency control configuration can result in a larger wandering amplitude, thus allowing the synthetic jet to travel a more significant distance into the vortex bringing turbulent structures within its core.Even so,how does the winglet affect vortex instability characteristics still needs to be further investigated.
In sum, in order to evaluate the effects of vortex dynamic characteristics and instability characteristics on induced drag,trailing vortices patterns generated by three wingtip configurations, namely the pure M6 wing, M6 wing with blended winglet, and split winglet, are experimentally measured using SPIV technology and quantitatively analyzed by conducting Linear Stability Analysis(LSA)in this paper.The experimental setup and methodology used are introduced in Section 2. Then,dynamic characteristics, including structures, circulation, and vortex wandering for three vortex patterns, are investigated in Section 3, which is followed by instability characteristics in Section 4. The following section is about the discussion and comparison of induced drag of three vortex patterns.Finally, we draw the main conclusions of this paper in Section 6.
2. Instrumentation and methodology
The details for our experiments,such as facilities,tested conditions, and Stereo Particle Image Velocimetry (SPIV) system,have been reported in previous publications in Refs.. As a series of experiments,the instrumentations of this experiment are the same. Herein, we choose wingtip configurations, SPIV system, and postprocessing to introduce for brevity.
2.1. Experimental setup
2.1.1. Wingtip configurations
By referring to the winglet configuration of the blended winglet on C919 or B747, split winglet on A320NEO or B737MAX,the M6 wing without winglet (Model NO), and with blended winglet (Model BL), split winglet (Model SP) is measured in our experiments. The sketch and geometric parameters for Model NO, Model BL, and Model SP are depicted from left to right sequent in Fig.1.Among them,Model NO is a scaled M6 wing,of which the airfoil is NACA 0012,the root length is 0.143 m, and the aspect ratio is 3.8 with a cutoff end of the trailing edge. For other geometry parameters, the standard M6 wing described by the official NASA websiteis referred to. As for Model BL and Model SP, they are the same M6 wing as Model NO mounted with a blended winglet and split winglet, respectively. The blended winglet is the upper branch of the split winglet.The split winglet is arranged symmetrically with an inclined angle of 60° with respect to the airfoil chord,and more details have been reported in Ref..
Besides, every model is made of aviation aluminum in the milling machine with its manufacture accuracy up to 0.05 mm, whose smoothness is ensured adequately. The M6 wing and winglet for Model BL and Model SP transit smoothly to avoid the formation of undesired vortex structures at the corner of each model.
2.1.2. SPIV system and postprocessing
Taking Model SP as an example, flow fields were measured using the Stereoscopic Particle Image Velocimetry (SPIV) system in Fig. 2. The Cartesian coordinate system (x, y, z) corresponds to the streamwise direction,the upper side of the wing,and the spanwise direction of the wing,respectively. For comparison, three angles of attack and freestream velocities,namely AoA = 6°, 8°, 10°, u=15 m/s, 30 m/s, 45 m/s, were tested.Therefore,the corresponding chord length(c=0.08 m)based Reynolds numbers were Re= 0.82 × 10, 1.64 × 10,and 2.46 × 10, respectively. The measured region was 16 chord lengths downstream of the wing with an interval of 2,namely x/c=x*=2,4,...,16.As mentioned earlier, the fundamental setting of laser, CCD cameras, and synchronizer is the same as the previous reporting.The interval of dualcavity was set adaptively to keep particles in this image pairs recorded by the CCD camera belong to the same layer. The pixel shift of images taken by the SPIV system was about two pixels, making an acceptable relative uncertainty, and a large dynamic velocity range can be obtained when constructing the flow field. Considering average effects on the timeaveraged field,insufficient image pairs will lead to unnecessary background noise in the average flow field when visualizing the trailing vortex flow. In contrast, superfluous image pairs will result in extra fluctuation of streamwise velocity and tangential velocity profiles. In this situation, a repetitive experiment was conducted,and 200 instantaneous image pairs were continuously recorded at each measured surface to obtain a satisfactory time-averaged flow field.
With regard to the postprocessing process, the raw image pairs were visualized by the TSI Insight 4G commercial software. A double-consulted window was adopted to improve the resolution of the velocity vector, of which the initial consulting window was 72 × 72 pixels with an effective overlap rate of 25% and 36 × 36 pixels with an effective overlap rate of 50%for the second consulting window.In this way,the percentage of suitable vectors accounts for above 85%, and the velocity error measured within the whole measured region was less than 1%.This uncertainty level will result in the growth rate error at the order of 10, meeting requirements in linear stability analysis.

Fig. 1 Sketch and geometric parameters of examined models.
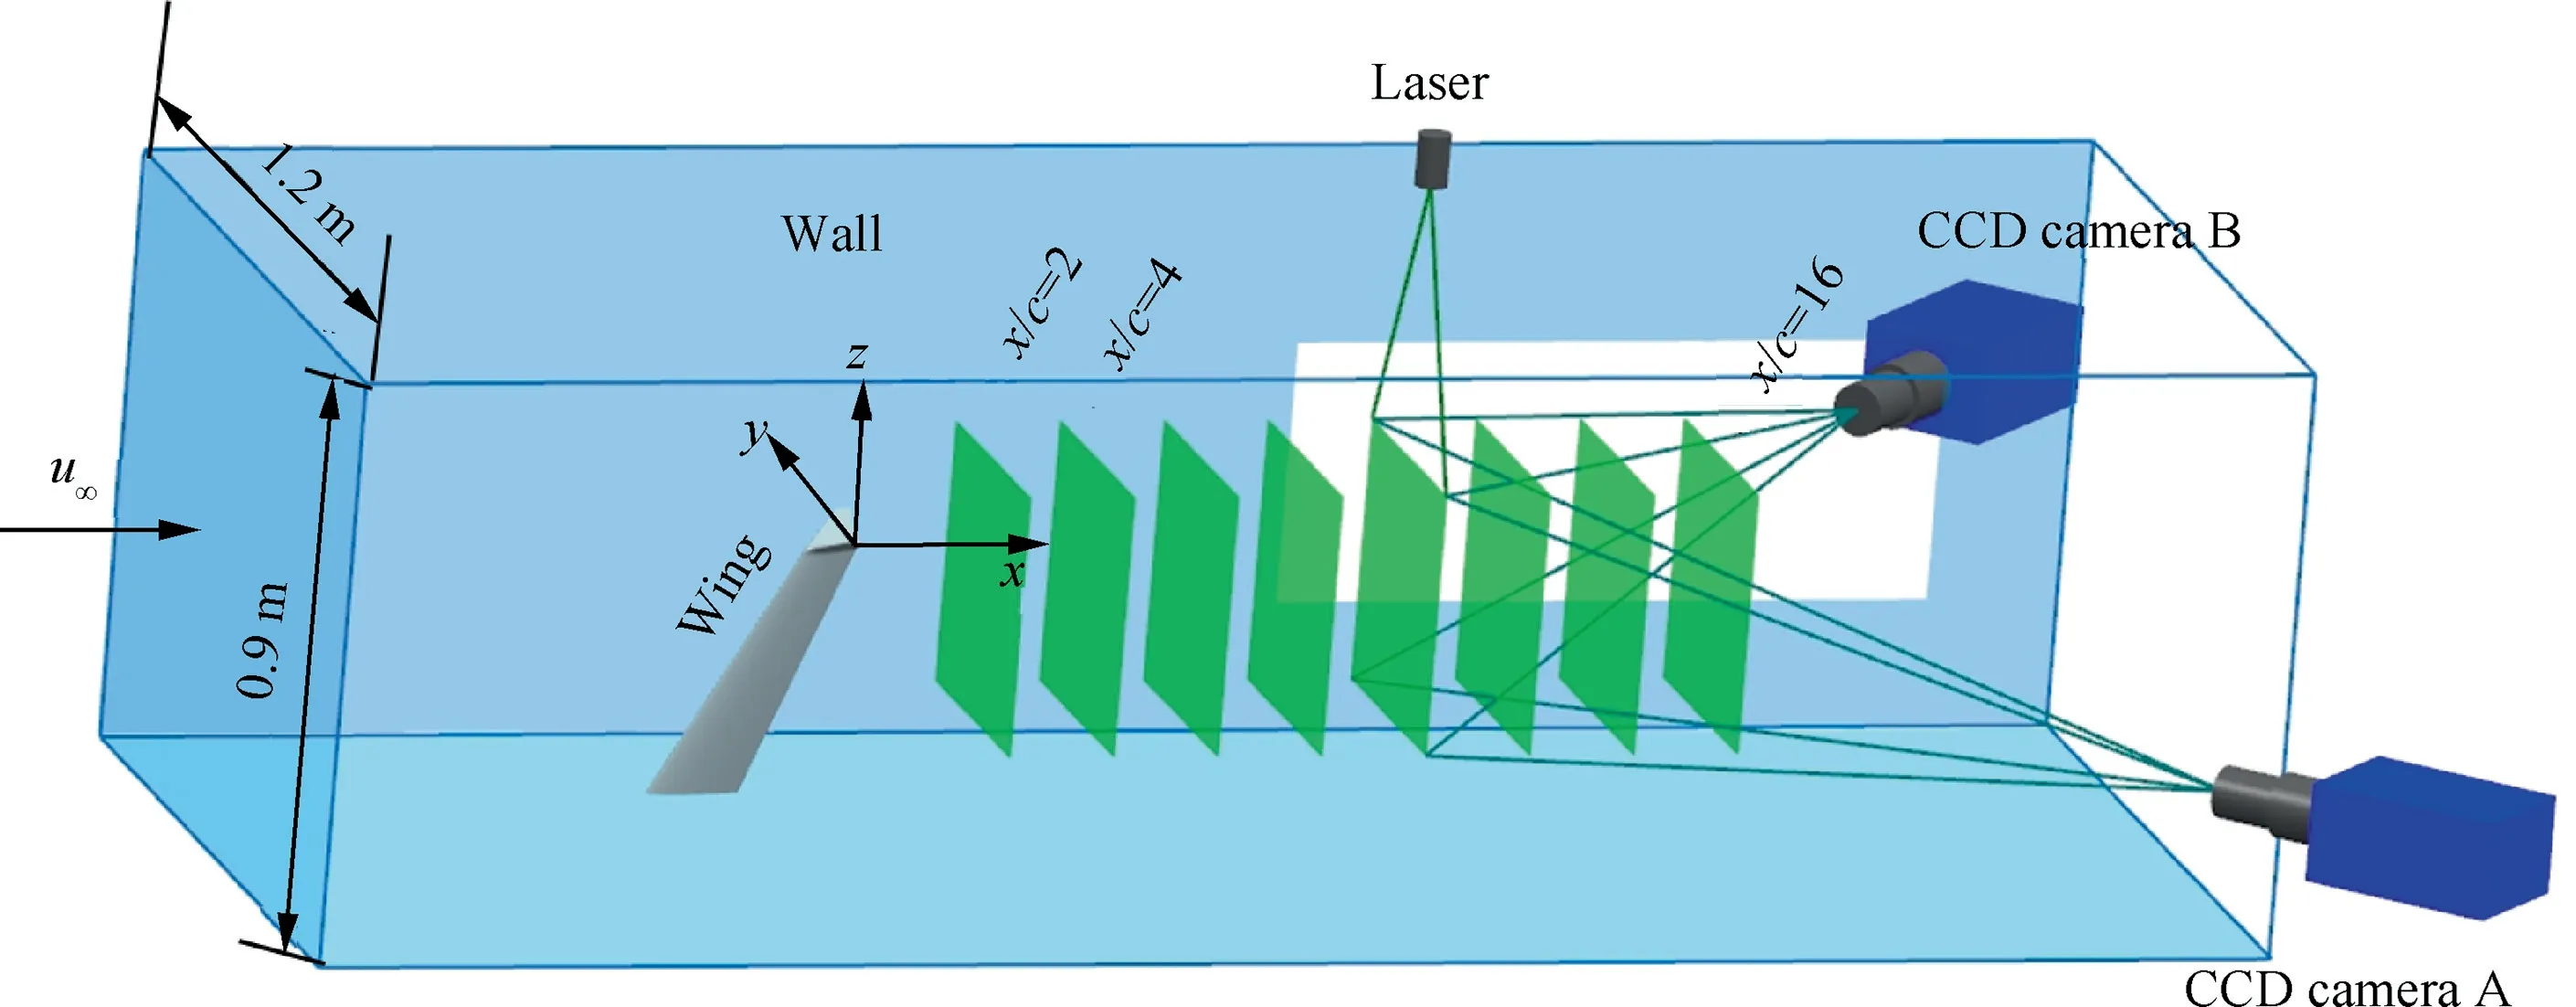
Fig. 2 Sketch of SPIV system.
2.2. Methodology
2.2.1. Calculation of vortex parameters
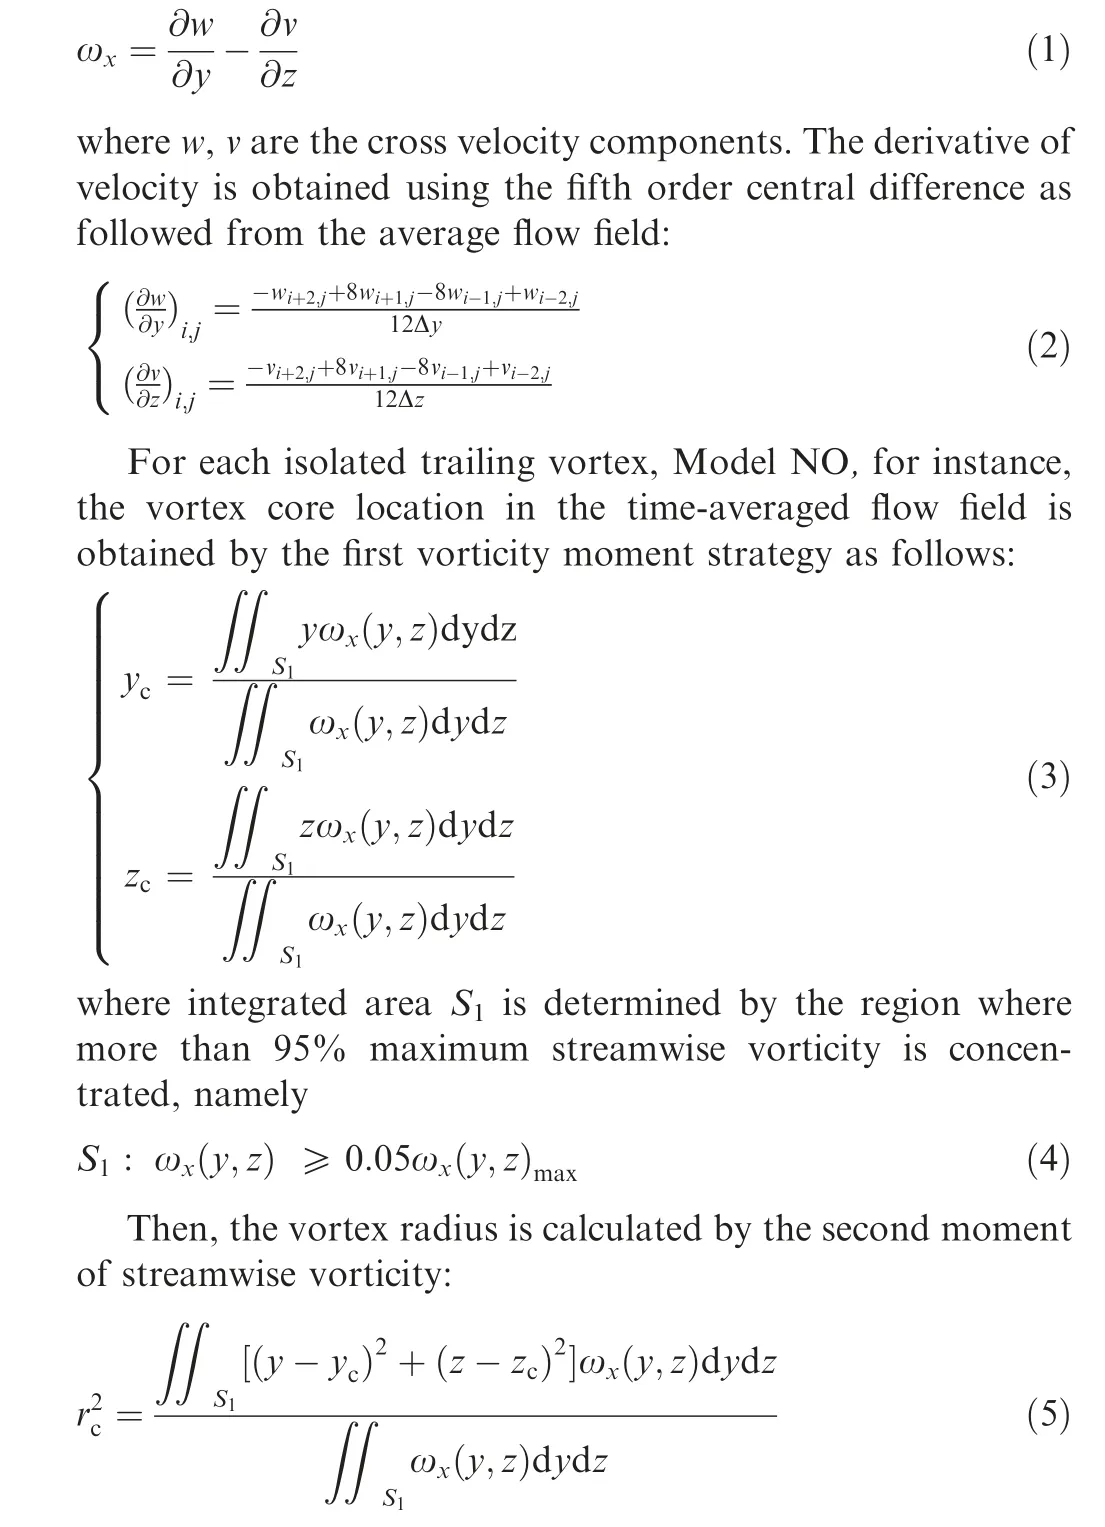
After obtaining the time-averaged flow field of trailing vortices, the streamwise vorticity can be calculated by
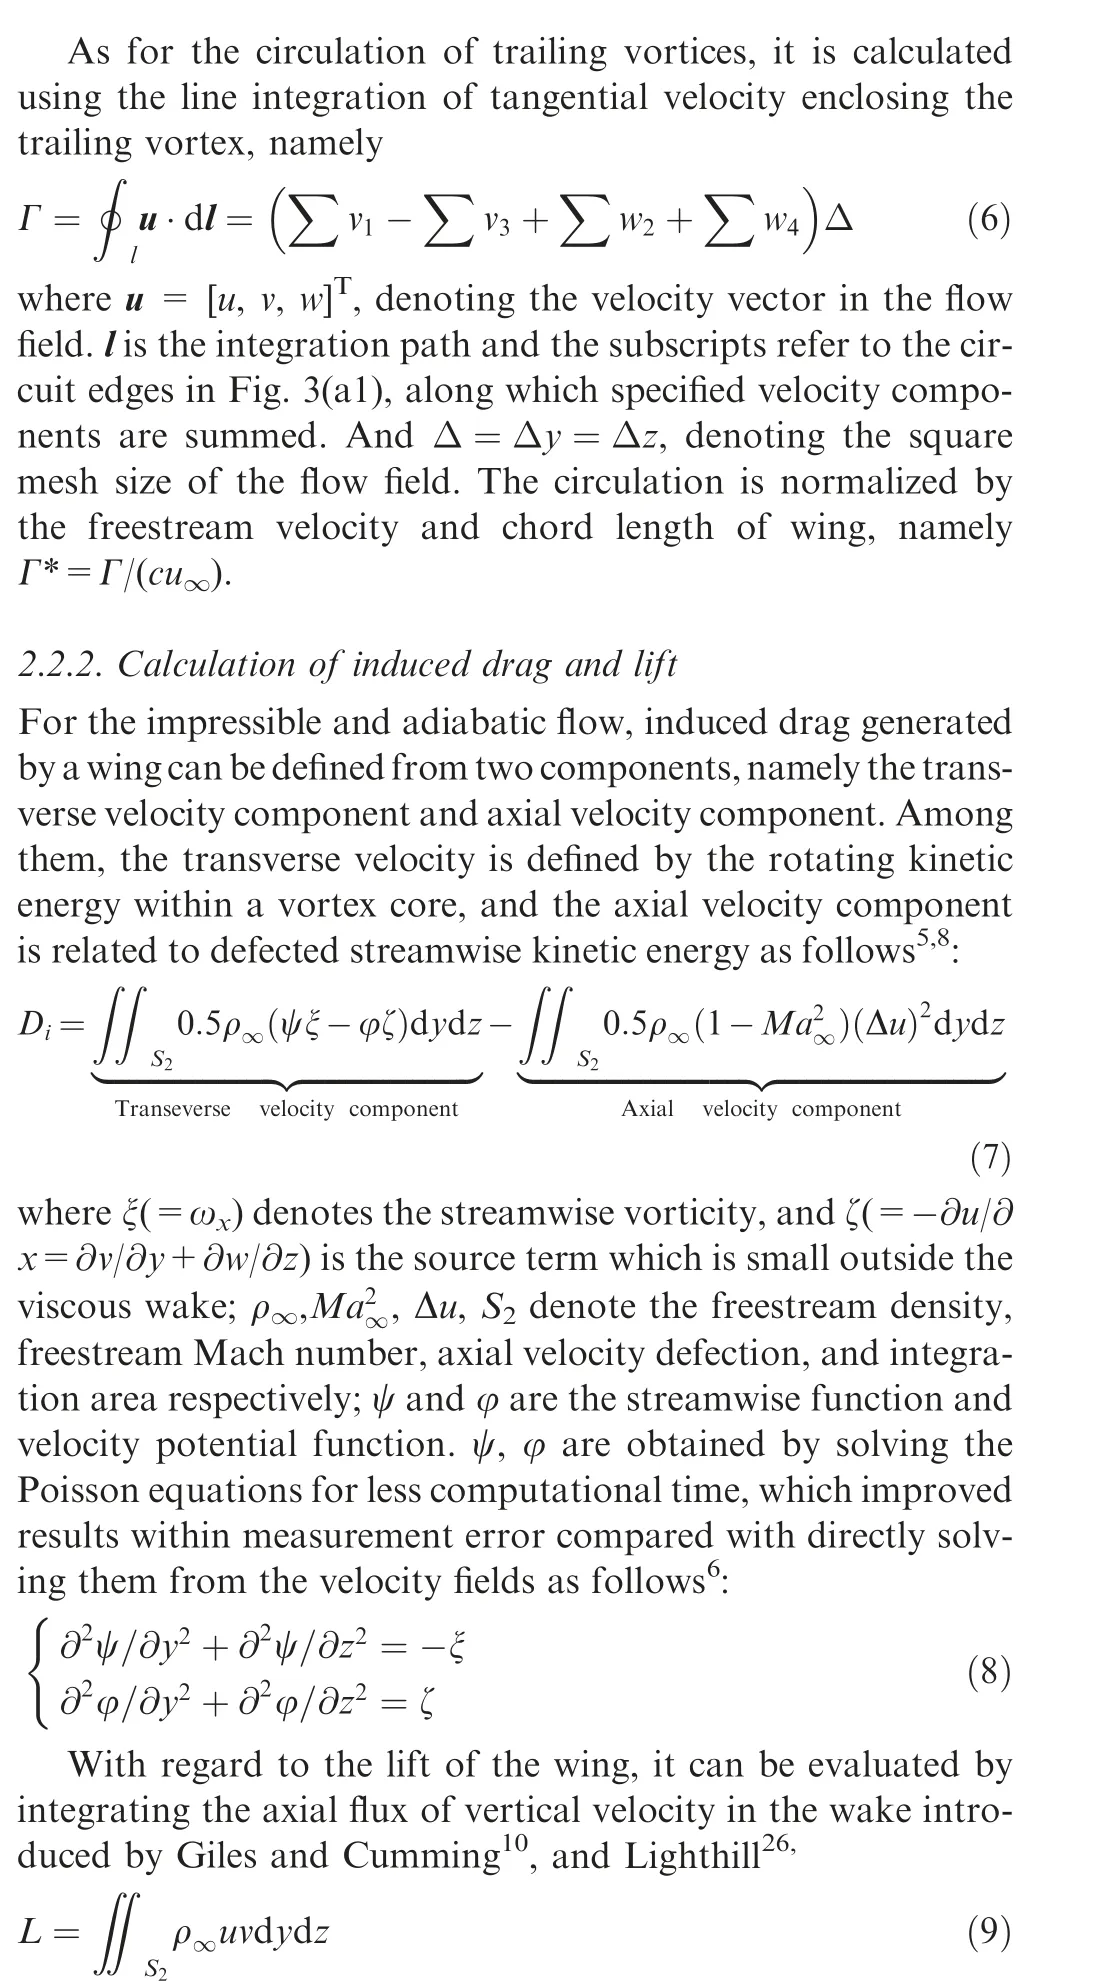
As such,a large wake plane region Sshould be required to ensure that the transverse velocity beyond the region is nearly zero.
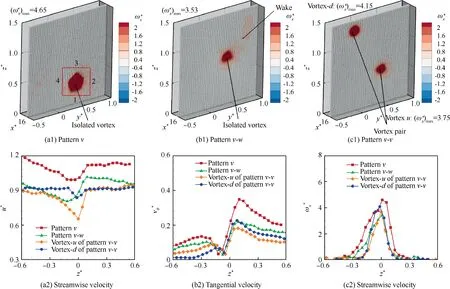
Fig. 3 Comparison of vortex patterns for three different wingtip configurations, [AoA, Rec, x*] = [8°, 2.46 × 10⁵, 16].
Then, the induced drag coefficient and lift coefficient are denoted as

where Sis the profile area of the wing with or without winglets along the freestream direction, and C/Cis defined as the induced drag factor λ referring to the textbook by Anderson.
2.2.3. Linear stability analysis method
As reported in our previous work,trailing vortices generated by Model NO and Model BL only contain an isolated vortex(maybe an additional wake shedding from the trailing edge in the very near wake).By contrast,trailing vortices for Model SP consist of a co-rotating vortex pair. According to whether the trailing vortex is asymmetrical in space, the local LSA is performed for the scenario of Model NO and Model BL and bi-global LSA for Model SP.
As the cartesian coordinate system is shown in Fig. 2, the linearized governing equations for the infinitesimal disturbances can be written by

where uand u- denote the disturbance velocity field and averaged velocity field, respectively;prepresents the disturbance pressure, and t is flow time. The whole flow variable q can be denoted by
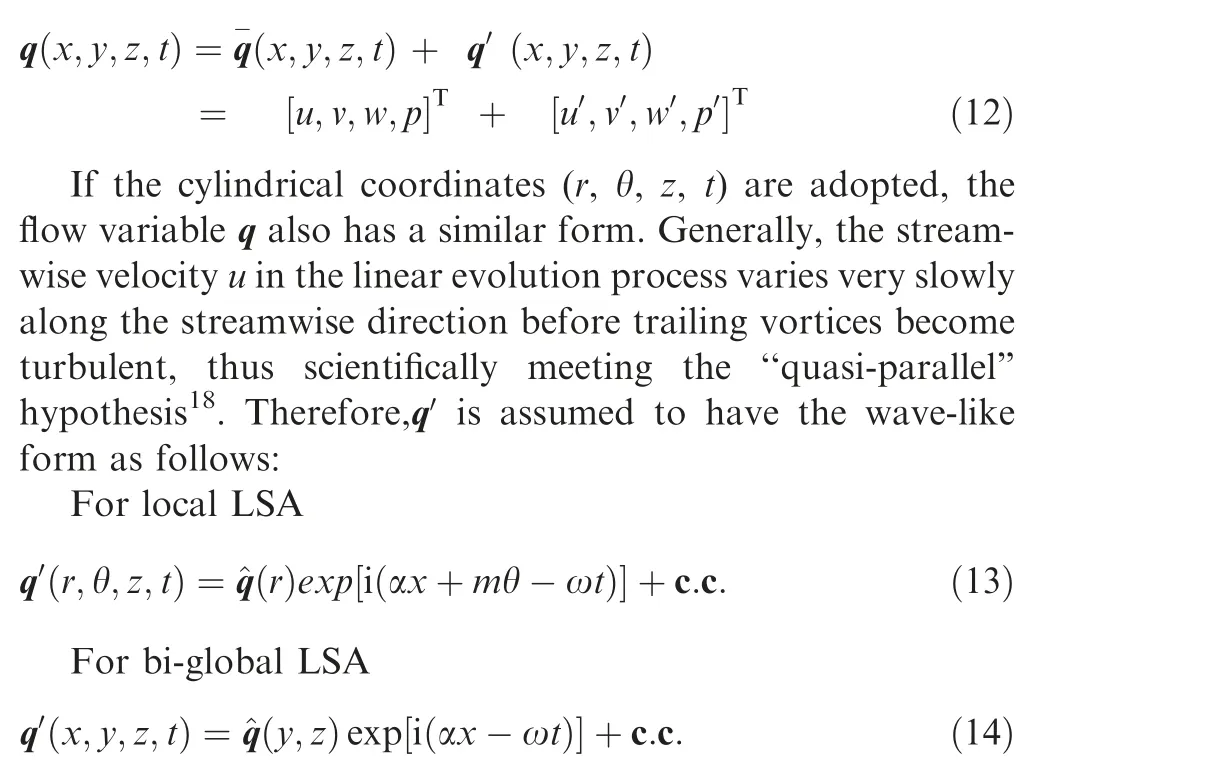
In the above Eqs. (13) and (14), three terms on the right represent the form function of small disturbance, phase function, and complex conjugate numbers, respectively, of which q(y,z)=[^u,^v, ^w,^p]. In the phase function, α is the axial wavenumber, m denotes the azimuthal wavenumber, and ω is the temporal frequency of disturbance. Based on the previous results, the eigenvalue spectrum obtained by the local or bi-global LSA on the trailing vortex in time and space is consistent.As such,only the temporal LSA is conducted.Therefore, we shall attempt to determine the complex ω as an eigenvalue for a given real number of α in Eq.(13);the disturbance is amplified or damped with time depending upon whether ω>0 or ω<0 respectively. ω= 0 characterizes neutral disturbances.
Substituting Eqs. (13) or (14) into Eq. (11), and neglecting the nonlinear terms,the linearized form of equations that govern the small perturbation in the flow field can be derived as

where A,B are the stability matrix,omitted for brevity,and the details can be seen in Ref..
Considering the numerical accuracy and convergence performance, the Gauss–Lobatto grid was used to discretize Eq.(15). The Dirichlet boundary conditions are enforced at the computational boundary, forcing the disturbances to become zero in the far field. The current formulation has been validated rigorously on the channel flow, isolated trailing vortex flow, equal counter-rotating vortex pair flow, and equal corotating vortex pair flow.Noticeably, the validated results show that the most unstable eigenvalue and perturbation mode calculated by local LSA and bi-global LSA for isolated trailing vortex are consistent, thus demonstrating that our results are reasonable.
As for the base flow for these two LSA methods, they are treated slightly differently after obtaining the average flow field. However, the necessary treatments are the same, including (A) recentering the flow field to remove the wandering effect of trailing vortex;(B)azimuthally averaging the velocity of each trailing vortex to obtain the average tangential velocity and axial velocity; (C) fitting the tangential velocity and axial velocity of trailing vortex based on the Batchelor vortex model(for Model NO and Model BL) or Lamb-Oseen vortex model(for Model SP).For the process,one can refer to our previous works,as well as other canonical worksfor more details.Besides,what should be noted is that the trailing vortex system may include the wake shedding from the trailing edge of blended winglet that has not dissipated in the very few flow conditions for Model BL, especially in the region very near wake, x*=2 for instance. In this situation, the wake is equivalently fitted into the corresponding isolated trailing vortex.Then, the velocity profile of the equivalent vortex serves as the final base flow of the flow field.
3. Dynamic characteristics of trailing vortices
3.1. Vortex pattern and circulation
3.1.1. Vortex patterns of trailing vortices
Without loss of generality, trailing vortices of three wingtip configurations under the flow condition of [AoA, Re,x*] = [8°, 2.46 × 10, 16] are depicted in Fig. 3. The vortex structures characterized by the contour of dimensionless streamwise vorticity are shown in Fig. 3(a1)-(c1), and dimensionless velocity profiles and streamwise vorticity through the vortex center in the y direction are shown in Fig. 3(a2)-(c2).For comparison, the value of maximum streamwise vorticity,also corresponding to the peak value of Fig. 3(c2), is denoted in the scatter of(a1)-(c1).Noticeably,the abscissa axis of profiles for scatters (a2)-(c2) has been artificially translated to the same coordinate scale of Model NO.
Obviously, the evidence of trailing vortices structures in Fig. 3(a1)-(c1) validates three vortex patterns generated by Model NO, Model BL, and Model SP, namely the isolated vortex pattern (pattern v), the isolated vortex pattern with a wake (pattern v-w), and co-rotating vortex pair pattern(pattern v-v), respectively. The pattern v-v consists of vortexd and vortex-u, which is generated by the down and upper branch of the split winglet, respectively. These three vortex patterns also represent the typical trailing vortices configurations generated by the current mainstream winglets. As for the evolution under different flow conditions and the streamwise location for these trailing vortices, one can refer to the works by Lee and He,and Cheng et al..
Looking through the results in Fig. 3(c2), the streamwise vorticity satisfies an abnormal Gaussian distribution for each isolated trailing vortex. Besides, the dimensionless maximum value of streamwise vorticity (ω*)for pattern v is 4.65,while 3.53 for pattern v-w, 3.75 for the upper primary vortex of pattern v-v,and 4.15 for the lower primary vortex of pattern v-v, indicating that the strength of trailing vortices is suppressed after installing either the blended winglet or split winglet. The tangential velocity profiles in Fig. 3(b2) also support this conclusion from another side. As observed, though the dimensionless tangential velocity profiles obey a similar morphology distribution, the peak value of v* for pattern v-w and pattern v-v decreases compared with pattern v. As for the dimensionless streamwise velocity in Fig. 3(a2), drastic changes of velocity gradient can be found in the vicinity of trailing vortices.Meanwhile,the velocity gradually approaches 1.0 along the radial direction;that is,it is the same as the freestream velocity. For pattern v-w, the change of streamwise velocity in the positive z-axis is slightly slower, which should be attributed to the vortex wake in this region.
3.1.2. Circulation of trailing vortices
Another critical parameter to compare the strength of these three vortex patterns, as well as related with the performance of induced drag and lift is the circulation of trailing vortices,of which the results under [AoA, Re,] = [8°, 2.46 × 10] are shown in Fig.4.Starting with the circulation evolution for pattern v, the circulation of trailing vortices Γ* firstly exhibits a slight increase in the near wake (x*≤6.0), mainly due to continuously feeding these vorticities from the wake. Then, Γ*gradually exhibits a slight decrease due to the viscous dissipation of trailing vortices after a critical streamwise location,x*≈6.0 in our experiments. Further, the viscous dissipation and turbulence injection into the vortex should also accelerate when the vortex instability is enhanced along with the streamwise location,thus indicating a faster decrease after the middle field (x*≥10.0).
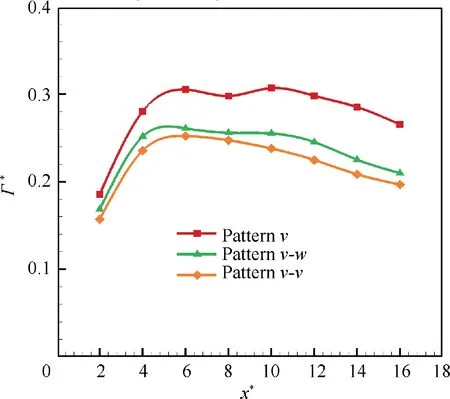
Fig.4 Comparison of dimensionless circulation for three vortex patterns, [AoA, Rec] = [8°, 2.46 × 10⁵].
Besides,what should be noted is that the circulation magnitude of trailing vortices at each corresponding streamwise location is pattern v, pattern v-w, and pattern v-v from large to small in the whole measurement region. This law agrees well with the observations in Fig. 3(a2).
3.2. Vortex wandering
As a result of vortex instability,vortex wandering is defined as the low-frequency coherent side-to-side motion of the trailing vortex in the surrounding flow and can be measured by the instantaneous vortex core locations in the measured section.Taking the results of pattern v as an example, the evolution of dimensionless wandering amplitude σ*(=σ/c = [(σ+-σ)]/c) under different AoA and Re, as well as along with the streamwise location,are shown in Fig.5.In the calculation,σ, σdenote the wandering amplitudes of y direction and z direction, respectively.
As observed, the wandering amplitude increases with Rewhile decreases with AoA at a given streamwise location,which coincides with the observations by Devenport et al..Besides, the wandering amplitude is enlarged along with the streamwise location model as expected, indicating that the instability is enhanced during the evolution of the trailing vortex to the far field.This can be explained by the q parameter of the trailing vortex, which gradually approaches the unstable region along with the streamwise location.
Concerning the vortex wandering amplitudes of different vortex patterns under [AoA, Re] = [8°, 2.46 × 10], for instance, the comparison of them is depicted in Fig. 6. For comparison, the results of pattern v-v are displayed as vortex-d and vortex-u, separately. As observed, the wandering amplitude of the trailing vortex for all vortex patterns is gradually enlarged along with the streamwise location, suggesting that the vortex instability is enhanced during this process.This observation not only confirms the findings of Dghim et al.and Edstrand et al.but also coincides with our previous conclusions in Ref.and Ref.. Considering the vortex patterns with winglets installed, wandering amplitudes of pattern v-w and pattern v-v are significantly larger than that of pattern v,among which the wandering amplitude of both vortex-d and vortex-u for the scenario of pattern v-v is the largest. This result indicates that the wandering motion can be further magnified after introducing another corotating trailing vortex. As for their effects on the induced drag in these three flow configurations, they will be discussed in Section 5.
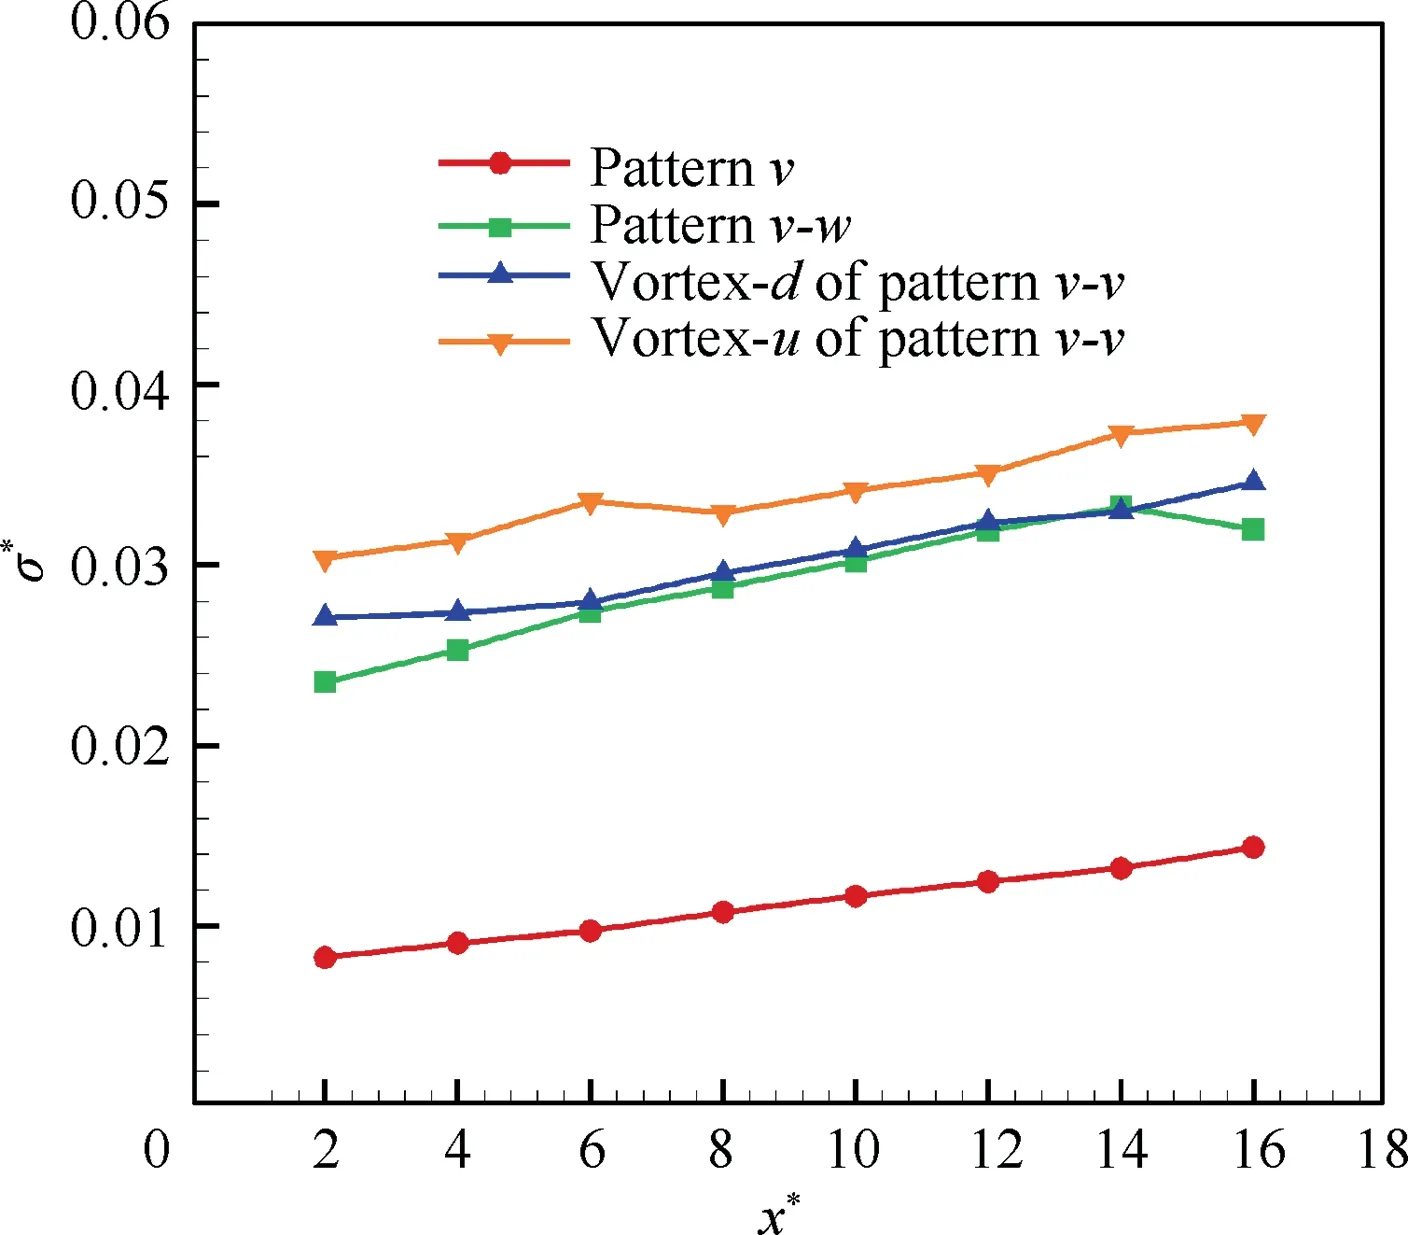
Fig. 6 Comparison of vortex wandering amplitude for different vortex patterns, [AoA, Rec] = [8°, 2.46 × 10⁵].
4. Instability characteristics
4.1. Eigenvalue spectrum and perturbation mode
By conducting LSA on these three vortex patterns, a brief comparison of eigenvalue spectrums illustrated by (ω, ω)under the most unstable streamwise wavenumber (from left to right is 0.11, 0.12, and 4.25, respectively) is shown in Fig. 7. The eigenvalue results in Fig. 7(c) have been filtered using two sets of discrete grids with a tolerance of 0.01. The examined flow condition in the figure is [AoA, Re,x*] = [8°, 2.46 × 10, 16].

Fig. 5 Wandering amplitude as functions of AoA, Rec, and x* for pattern v.

Fig. 7 Eigenvalue spectrums for three vortex patterns, [AoA, Rec, x*] = [8°, 2.46 × 10⁵, 16]
The eigenvalue spectrum for pattern v in Fig. 7(a) contains a discrete branch and three continuous branches. The discrete branch comprises a single but maximum eigenvalue of(ω,ω)=(0.1109,- 3.4924 × 10), located near the axis of ω= 0,indicating that pattern v is marginally stable in this situation.The continuous branch A is gradually forked as another two continuous branches,namely continuous branch B and continuous branch C. The real part of eigenvalues in the continuous branch B is about 0.11, which just is equal to the value of examined streamwise wavenumber.As for the eigenvalue spectrum of pattern v-w in Fig.7(b),the distribution of eigenvalues is similar to the results of pattern v. However, the primary eigenvalue of the discrete branch for pattern v-w is larger than that for pattern v,indicating that the trailing vortex under pattern v-w is more prone to instability than that under pattern v.Things become very different,concerning pattern v-v shown in Fig.7(c).As observed,the instability eigenvalue spectrum contains two types of branches: discrete branches and continuous branches. The discrete branches contain the primary branches of vortex-u and vortex-d,the secondary branch of vortex-d and coupled branch, of which all eigenvalues are located in the unstable half-plane of ω>0, indicating that the trailing vortex pair is temporally unstable.By contrast,eigenvalues of the continuous branch are concentrated on the half-plane of ω<0. Obviously, even the smallest eigenvalue in all the discrete branches is also larger than that of pattern v and pattern v-w, thus leading to one of the most underlying significant results that the co-rotating trailing vortex pair of pattern v-v is temporally unstable. In contrast, the isolated trailing vortex of pattern v and pattern v-w is marginal temporally unstable.
Corresponding to the most unstable eigenvalue shown in Fig. 7, the primary perturbation mode for these three vortex patterns is displayed in Fig. 8, where δ is the radius used for LSA. In the figure, the normalized vortex radius is also denoted as a black dashed line in each scatter.The most significant parts of primary perturbation mode for pattern v and pattern v-w, the two-lobe structures, are highlighted as each sub-diagram for comparison.
For pattern v and pattern v-w, the two-lobe structures in Fig. 8(a)-(b) coincide with the observations by Roy et al.and Edstrand et al.and are explained as the vortex wandering origin in the former work.Further,the affected area of perturbation mode of these two vortex patterns is both suppressed within the vortex core; that is, the disturbance energy is prohibited from entering into the boundary region of the trailing vortex. However, the affected area of perturbation mode of pattern v-w is slightly larger than that of pattern v, and the underlying mechanism will be discussed latterly. Concerning the primary perturbation mode for pattern v-v in Fig. 8(c),the primary mode of vortex-u (Mode P) and the primary mode of vortex-d (Mode P) are located exactly at the corresponding vortex core, respectively. Besides, Mode Pexhibits the structures enclosed with a relatively sizeable azimuthal wavenumber as investigated by Cheng et al.and Edstrand et al., while the structure of Mode Pis enclosed with radial wavenumber. Interestingly, the performance of the affected area for these two primary modes is distinctive though both of them can penetrate the vortex boundary compared with pattern v and pattern v-w.To be more specific,the affected area of Mode Pis larger than that of Mode P, suggesting that vortex-u becomes unstable more easily than vortex-d.
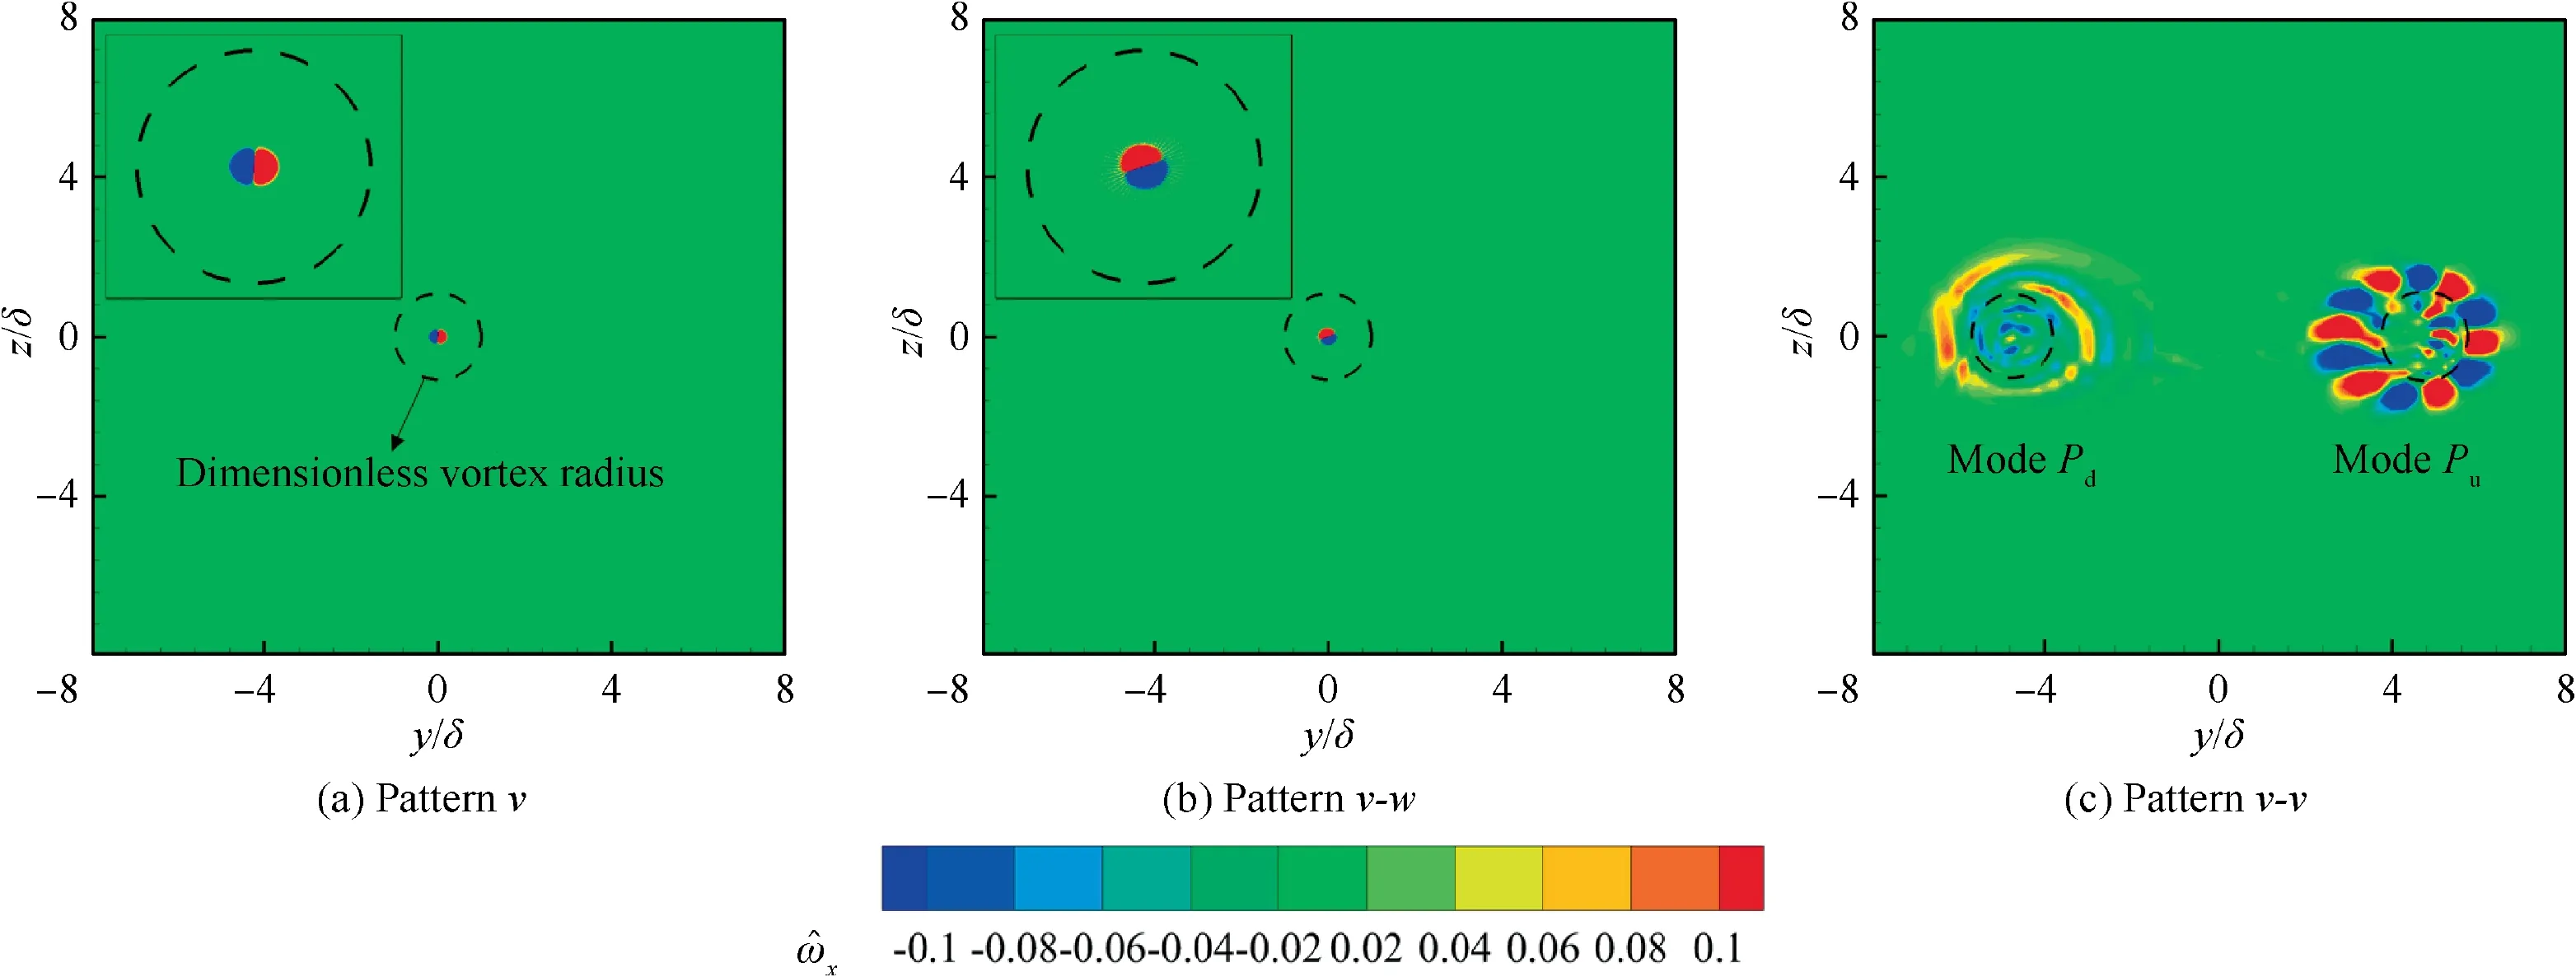
Fig. 8 Perturbation mode for three vortex patterns, [AoA, Rec, x*] = [8°, 2.46 × 10⁵, 16].
Noticeably, although the results in Figs. 7 and 8 are obtained under the flow condition of [AoA, Re] = [8°,2.46 × 10], this does not hinder the extensibility of conclusions under other different angles of attack and Reynolds number measured in our experiments. It is just not presented here for the sake of brevity.In the following analysis of stability curves, which are obtained from the eigenvalue spectrum under different streamwise wave numbers, we will present the results under different flow conditions.
4.2. Stability curves
The stability curves corresponding to the most unstable eigenvalue in the eigenvalue spectrums can be obtained when sweeping the different streamwise wavenumbers, α ∈[0,11.0] for instance, during LSA. The results are depicted in Fig. 9, of which the details for pattern v and pattern v-w among α ∈[0,0.30] are zoomed-in for each scatter.
It can be observed from Fig.9 that the growth rates as functions of streamwise wavenumbers are non-monotonic. Taking pattern v as an example,the growth rate firstly increases within a small range of wavenumber of α ≤0.11 and decreases with the streamwise wavenumbers. The peak value of the growth rate just corresponds to the very imaginary part of the single eigenvalue in the discrete branch. Noticeably, a nonmonotonic evolution of growth rates occurs around α = 9.0 under the flow condition of [AoA, Re] = [6°, 1.64 × 10].However, this peak growth value is smaller than that of the case of α = 0.11, indicating that the trailing vortex herein experiences the second vortex instability.A similar phenomenon also appears under the flow condition of [AoA,Re]=[6°,1.64×10]for pattern v-w.Concerning the results of pattern v-v under different flow conditions,both the growth rates of vortex-d and vortex-u are larger than those of pattern v and pattern v-w, and the results of vortex-u are more sensitive to the flow conditions than those of vortex-d. This result indicates that vortex-u is more easily to be attenuated than vortexd for the scenario of pattern v-v. Besides, the evolution law of growth rates under different flow conditions coincides with the results of wandering amplitude in Fig. 4, which has been confirmed in our previous experiments and suggests that the vortex wandering results from vortex instability. The different instability characteristics in Fig. 9 are relative to the induced drag and lift performance for these three vortex patterns,which will be discussed in the following.
5. Induced drag of trailing vortices
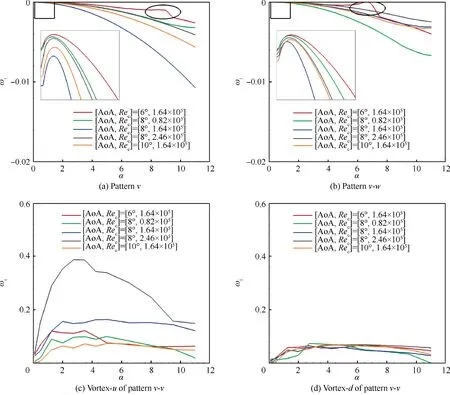
Fig. 9 Instability curves for three vortex patterns under different flow conditions.
After investigating dynamic characteristics and instability characteristics of three vortex patterns, the effects of vortex wandering on the calculation of induced drag are discussed firstly in this section. Then, the role of vortex characteristics on the induced drag performance of three vortex patterns is compared and investigated. Besides, what should be pointed out is that a recenter method referring to the work of Edstrand et al.is adopted to remove the wandering effect. The main idea of this method is shifting every instantaneous vortex core location to the mean vortex core location in the average field,and the corresponding velocity vector u = [u, v, w]is also shifted.
5.1. Calculation of induced drag considering vortex wandering
To precisely calculate the induced drag onset of vortex wandering, the effect of vortex wandering on the tangential velocity and streamwise vorticity is investigated, as shown in Fig. 10. The results are for pattern v under several arbitrary flow conditions.
In Fig. 10(a), the tangential velocity is a bit small due to vortex wandering, thus making the vortex radius be larger if ignoring the effects of wandering amplitude. The maximum effect on the tangential velocity occurs under the flow condition of [AoA, Re] = [10°, 2.46 × 10]. As observed, the dimensionless tangential velocity from the simple timeaveraged flow field is about 0.32, while it is about 0.33 after recentering the flow field,thus demonstrating that the wandering effect on the tangential velocity is up to 3.1% in this situation. This finding also agrees well with the qualitative discussion by Devenport et al.on the theoretical Batchelor vortex, in which the largest wandering effect on the tangential velocity is up to 15%. For Fig. 10(b), the absolute value of streamwise vorticity defined by ω=∂w/∂y-∂v/∂z is decreased on the whole due to the vortex wandering. This result can be attributed to the increase of tangential velocity, as shown in Fig. 10(a).
The vortex wandering affects the fundamental velocity quantities of the flow field and derived vorticity of the trailing vortex, thus inevitably affecting the induced drag coefficients and lift coefficients obtained by the wake integration method,which is depicted in Fig. 11.
Though the impacts made by the vortex wandering on the velocity quantities are definite,the effects of vortex wandering on the induced drag coefficients cannot be universally considered as a simple increase or decrease.For instance,the induced drag after removing the wandering effect is smaller than that of the original time-averaged flow field under the flow condition of[AoA,Re]=[6°,1.64×10],while becomes more extensive for the case of [AoA, Re] = [8°, 1.64 × 10]. This can be explained by the couple effects from the two components of induced drag in Eq. (7). The most distinctive impact occurs under the flow condition of [AoA, Re] = [6°, 1.64 × 10].Considering that the induced drag coefficients vary with the streamwise locations, the mean value among the results of x*∈[2.16] is adopted as the final induced drag coefficient of the corresponding flow condition. For [AoA, Re] = [6°,1.64 × 10], Cin the original time-averaged flow field is 0.0062, and 0.0060 for the recentered flow field, thus making the wandering effects on the induced drag coefficient be up to 3.22%.Similar results also can be observed for the lift coefficients displayed in Fig. 11(b). That is, the influence range of lift coefficients due to vortex wandering is 1%-3%, which should not be ignored when calculating the induced drag.
5.2. Role of vortex characteristics
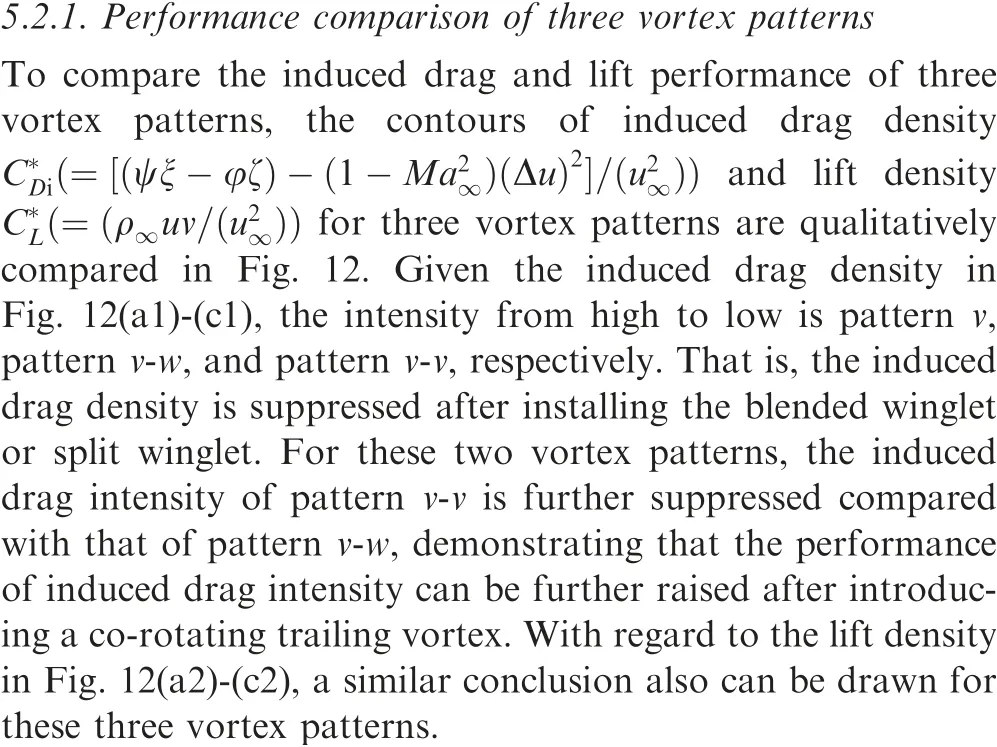
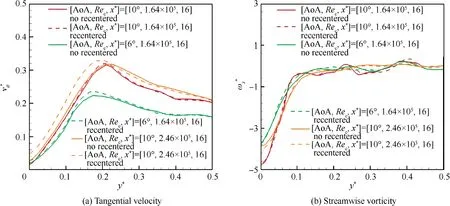
Fig. 10 Wandering effects on tangential velocity and streamwise vorticity for pattern v.
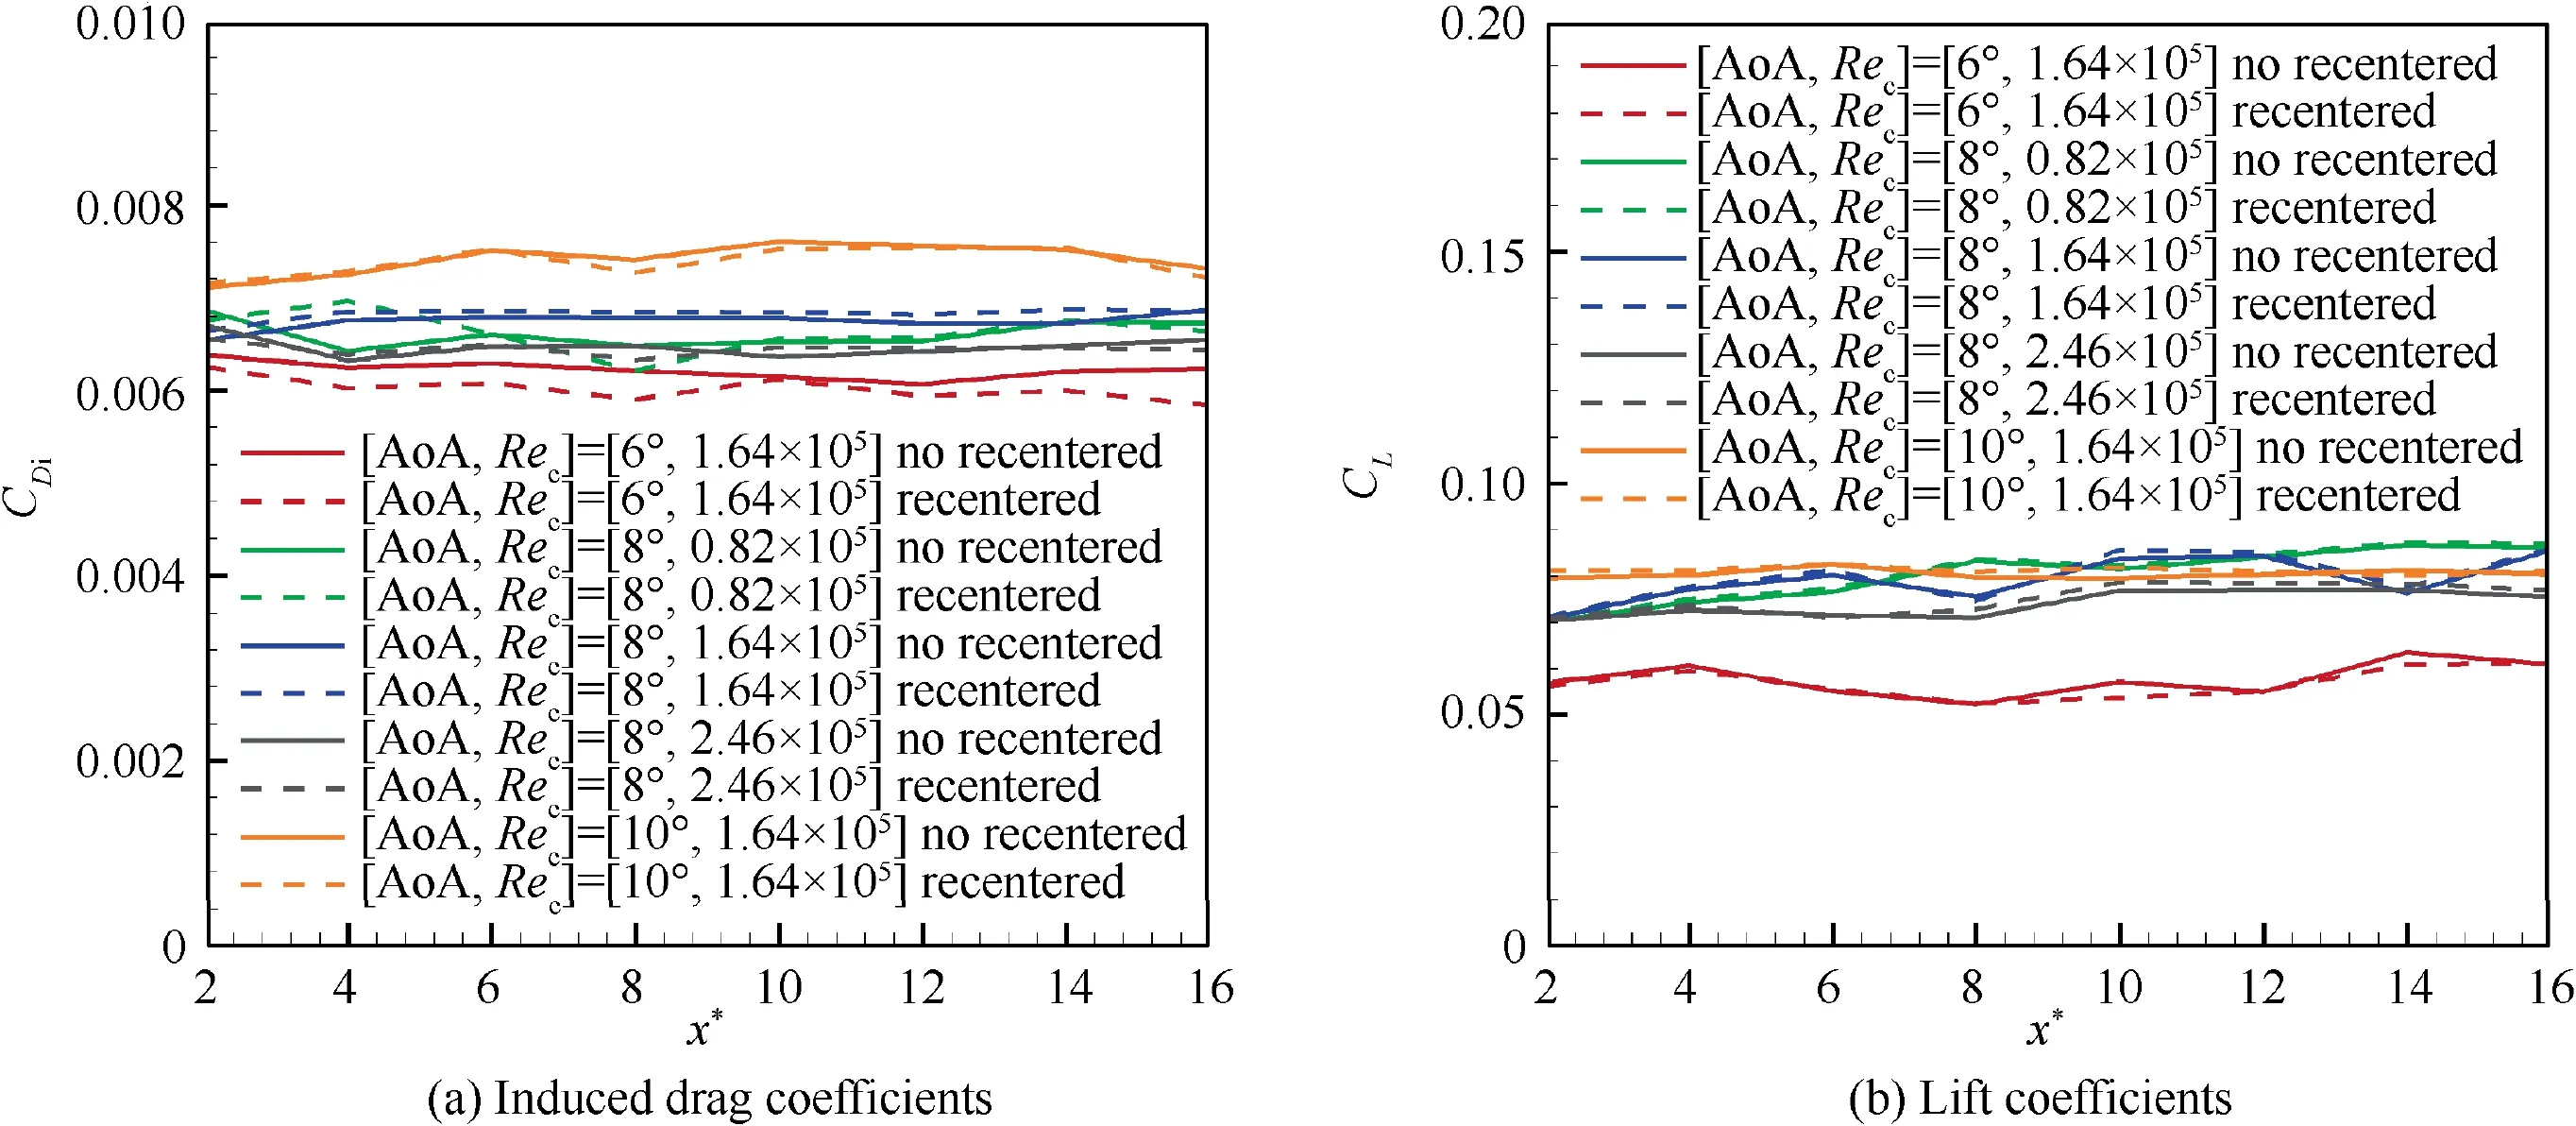
Fig. 11 Induced drag coefficients and lift coefficients for pattern v.
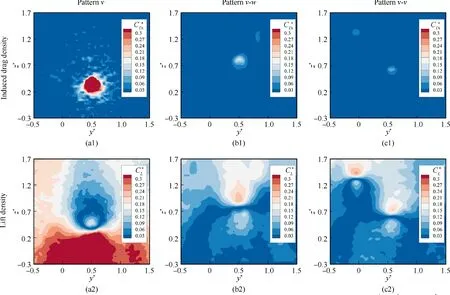
Fig. 12 Comparison of induced drag density and lift density for three vortex patterns, [AoA, Rec, x*] = [8°, 2.46 × 10⁵, 16].

Table 1 Induced drag and lift performance comparison of three vortex patterns.
In order to more clearly compare the performance of induced drag coefficients and lift coefficients for three vortex patterns, quantitative coefficients of the recentered flow field under different flow conditions are listed in Table 1. As mentioned above,the coefficient results in the table are the average results among the streamwise locations of x*=2–16. Besides,considering that the induced drag coefficients in Table 1 are based on the different vortex patterns, this may challenge the rationality of data, since such variation is due to the change of wing configuration. Therefore, the induced drag factor λ is also listed and compared in the table.
From the results in Table 1, it can be observed that both Cand Cincrease with AoA, as expected. By contrast, Cand Cincrease first and then decrease with Re. This may relate to the fact that the velocity increase is not as intense as Cand C. Among three vortex patterns, the value of Cvaries from large to small in pattern v, pattern v-w, and pattern v-v under the measured flow conditions. Taking the flow condition of[AoA,Re]=[8°,1.64×10]as an example,the corresponding Cof pattern v,pattern v-w,and pattern v-v is 0.0068, 0.0063, and 0.0047, respectively. That is, Cof pattern v-w decreases by 7.35% compared with that of pattern v and 30.89%for the scenario of pattern v-v.As for the induced drag factor λ,it increases with AoA and Re,as expected.For the different vortex patterns, λ decreases by 20%-40% under all the flow conditions, and λ of pattern v-v further decreases compared with the results of pattern v-w,in which the effect of instability characteristics will be discussed in the following.
5.2.2. Effect of instability characteristics on induced drag
As discussed above, the induced drag can be suppressed after introducing a vortex wake for pattern v-w and can be further decreased after generating another co-rotating trailing vortex for pattern v-v. However, the effect of instability characteristics, such as the most unstable growth rates of trailing vortex,and the penetration depth on the induced drag, is not known.By referring to Ref.the penetration depth d is defined as

Taking the flow condition of[AoA,Re]=[8°,2.46×10]as an example,the most unstable growth rates and penetration depth for three vortex patterns are depicted in Fig. 13. For comparison,the calculation of penetration depth is at the same streamwise number of α = 0.10. Noticeably, the range of ωfor pattern v-v in Fig. 13(a) is [0, 1.5] labeled on the right vertical axis.
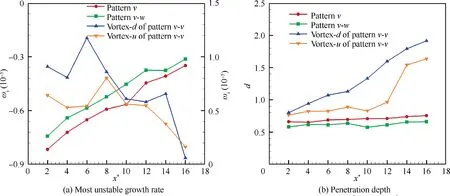
Fig. 13 Effect of instability characteristics on induced drag, [AoA, Rec] = [8°, 2.46 × 10⁵].
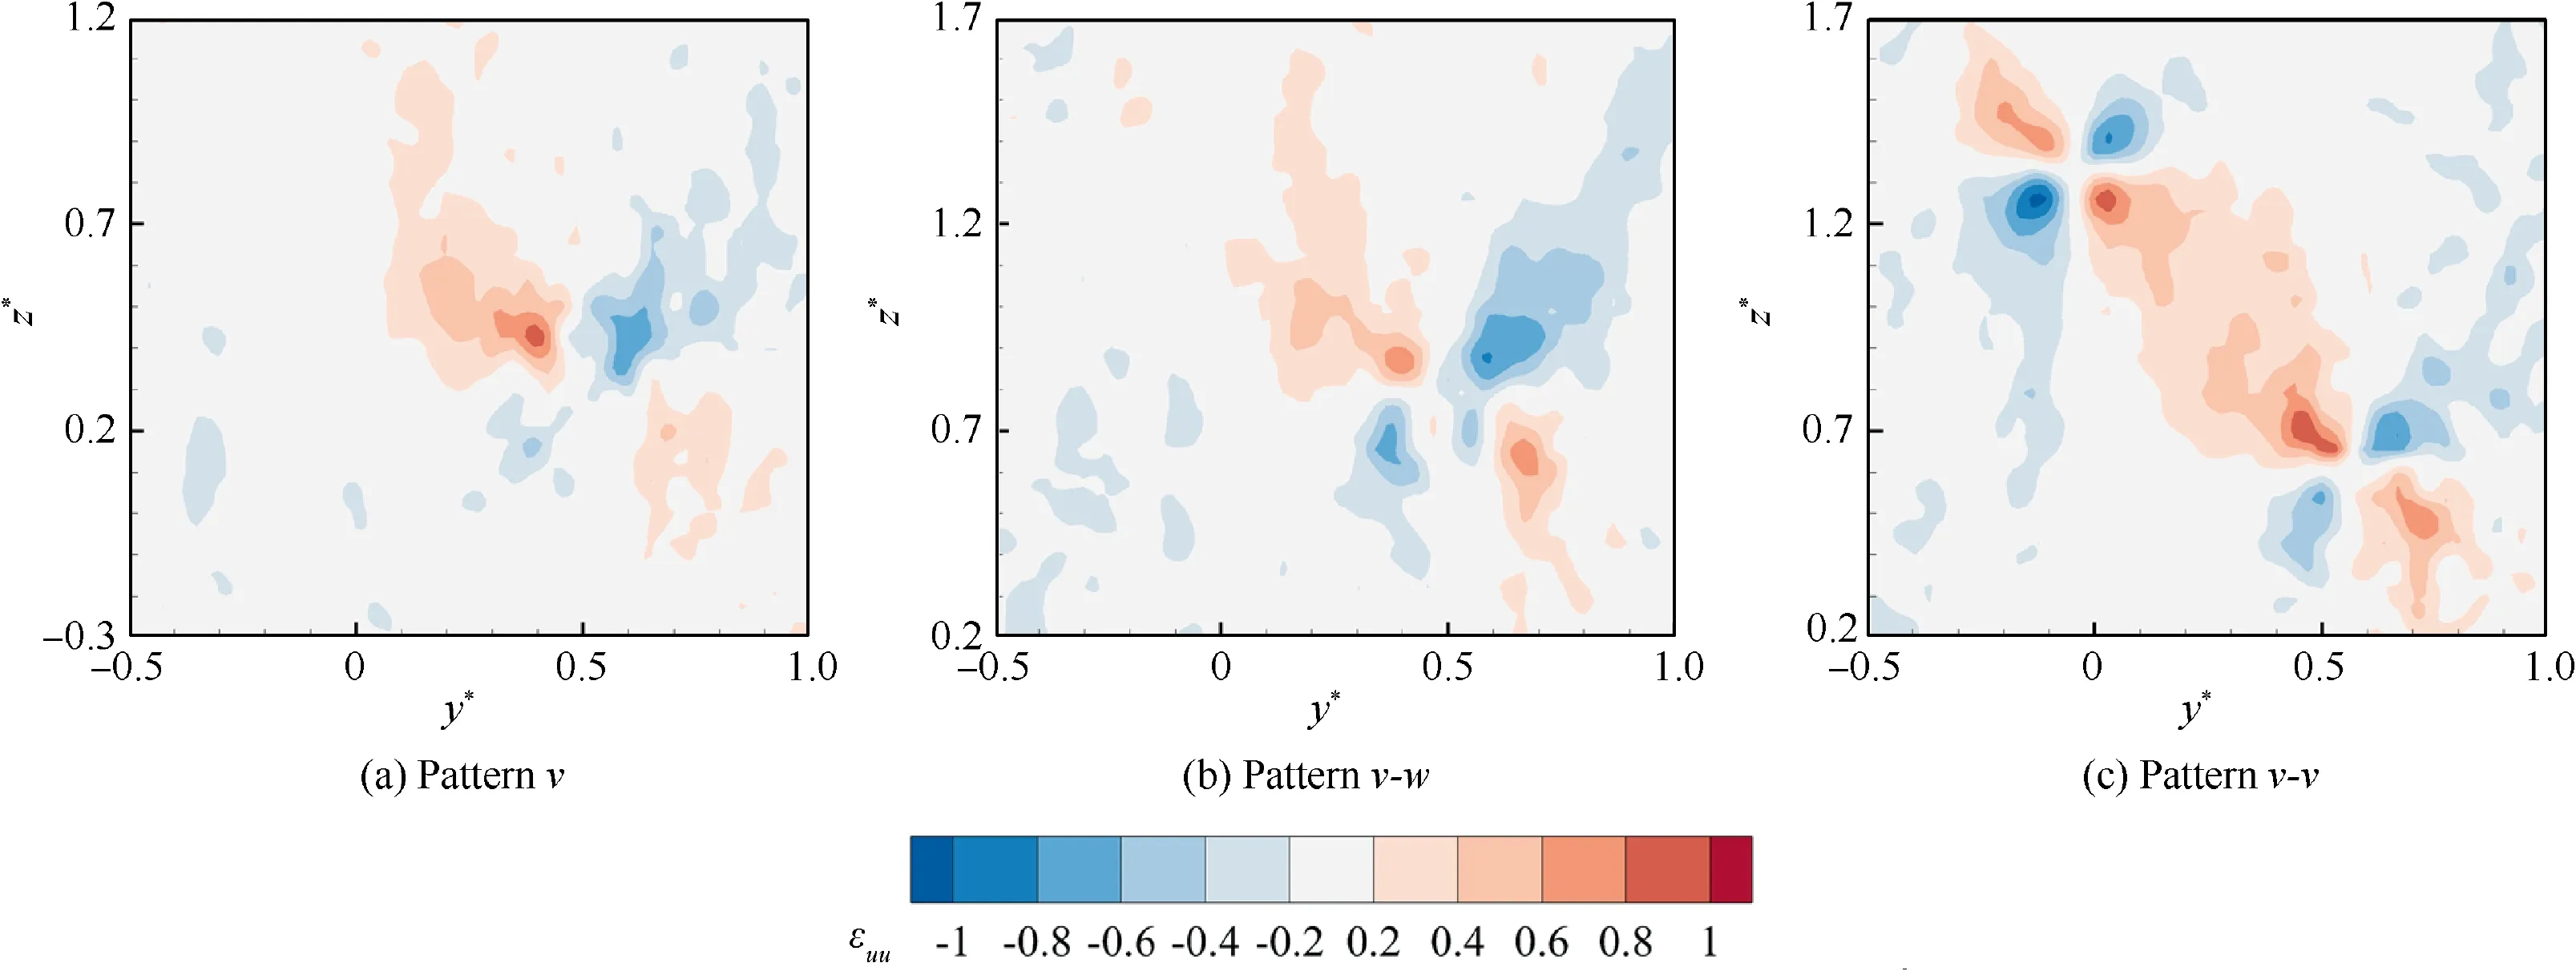
Fig. 14 Distribution of normal strain for three vortex patterns, [AoA, Rec, x/c] = [8°, 2.46 × 10⁵, 16].
Firstly, looking through results in Fig. 13(a), growth rates for pattern v and pattern v-w are at the order of 10, while the results for pattern v-v are between [0, 1.2] among all the measured streamwise locations, indicating that the growth rates of pattern v-v are larger than those of pattern v and pattern v-w.Furthermore,the growth rates of pattern v-w are larger than those of pattern v, which also agrees well with the results in Fig. 7. Noticeably, the evolution of growth rates for pattern v-v for each primary vortex is that they first increase with the streamwise location and then decrease,which is different from the evolution for pattern v and pattern v-w.This is primarily due to the interaction of two trailing vortices for the vortex pair,and the underlying mechanism will be further investigated in the future.
Given the results of penetration depth in Fig. 13(b), the evolution of penetration depth for three vortex patterns is similar to the wandering amplitude discussed in Fig.6.The results in Fig.13 indicate that the larger the growth rate and penetration depth are,the smaller the induced drag will be,which may provoke us to manipulate the trailing vortex from the point of vortex instability.
To further explain this indication, the normal strain distribution for three vortex patterns ε(=∂u/∂x) is depicted in Fig. 14. It can be obviously found that the normal strain is strengthened after installing winglets as expected. The pattern v-v shares the largest normal strain among the three vortex patterns. This can be explained by the fact that a larger growth rate causes a quicker attenuation of the trailing vortex, and the larger penetration depth means that more outer turbulence flow injects into the inner vortex core, thus leading to more intense mitigation of the trailing vortex.
6. Conclusions
In order to evaluate the effects of vortex dynamics characteristics and instability characteristics on the induced drag, trailing vortices generated by the pure M6 wing (Model NO), the M6 wing with blended winglet (Model BL), and split winglet(Model SP) are experimentally measured using the SPIV technology and quantitatively analyzed by conducting LSA under different angles of attack and chord-length-based Reynolds number within 16 chord-length downstream areas. The main conclusions can be drawn as follows:
(1) The dynamics characteristics of trailing vortices. Three trailing vortex patterns, including the isolated trailing vortex with and without vortex wake (pattern v-w and pattern v), and co-rotating trailing vortex pair (pattern v-v), are found generated by Model BL, Model NO,and Model SP,respectively.Results show that the circulation magnitude of trailing vortices at each corresponding streamwise location is pattern v, pattern v-w, and pattern v-v from large to small in the whole measured region.For the wandering amplitudes of these three vortex patterns, both the results of pattern v-w and pattern v-v are distinctly larger than those of pattern v. Moreover,the wandering amplitude of pattern v-v will be further enlarged, compared with the results of pattern v-w,indicating that the wandering motion can be magnified after introducing another corotating trailing vortex.
(2) The instability characteristics of trailing vortices.Firstly,given the eigenvalue spectrums for three vortex patterns,all of them contain two types of branches:discrete branch and continuous branch.For the eigenvalue spectrums of pattern v and pattern v-w,they contain a discrete branch and three continuous branches.The discrete branch is a single eigenvalue near ω=0,of which the largest eigenvalue is still negative,indicating that the trailing vortex is marginal stable. As for pattern v-v, the discrete branch contains the primary branches of vortex-u and vortex-d,the secondary branch of vortex-d and coupled branch,of which all eigenvalues are located in the unstable halfplane of ω>0,indicating that the pattern v-v is temporally unstable by contrast. Concerning the perturbation modes, two-lobe structures are found for pattern v and pattern v-w, and the affected area of perturbation mode of pattern v-w is slightly larger than that of pattern v.As for pattern v-v,two primary modes,namely the primary mode of vortex-u (Mode P) and primary mode of vortex-d (Mode P) are observed. For the structure of Mode Pand Mode P,Mode Pexhibits the structures enclosed with a relatively sizeable azimuthal wavenumber,while the structure of Mode Pis enclosed with radial wavenumber.The affected area of Mode Pis larger than that of Mode P,suggesting that vortex-u becomes unstable more easily than vortex-d.
(3) Before comparing the induced drag of three vortex patterns, the vortex wandering effect on the induced drag is investigated. Due to vortex wandering, the tangential velocity is increased by about 1%-3%, thus making the actual value of induced drag be polluted by about 3%.This effect provokes us that the calculation of induced drag should consider the effects of vortex wandering.After removing the wandering effects,the actual induced drag is obtained,which is pattern v,pattern v-w,and pattern v-v, respectively, from large to small. Moreover,observations are found that the smaller induced drag is accompanied by a larger growth rate and penetration depth of perturbation mode under the measured flow conditions.This is because the larger growth rate means a quicker attenuation on the trailing vortex, which can guide us to manipulate the induced drag in the flow control.
The authors declare that they have no known competing financial interests or personal relationships that could have appeared to influence the work reported in this paper.
The authors would like to appreciate the financial support from the Major Research of National Natural Science Foundation of China (No. 91952302) and China Postdoctoral Science Foundation (No. 2018M642007).
 Chinese Journal of Aeronautics2022年9期
- Chinese Journal of Aeronautics的其它文章
- Bolt insertion damage and mechanical behaviors investigation of CFRP/CFRP interference fit bolted joints
- Capture and detumbling control for active debris removal by a dual-arm space robot
- Target localization based on cross-view matching between UAV and satellite
- Quick identification of guidance law for an incoming missile using multiple-model mechanism
- Robust image-based coordinated control for spacecraft formation flying
- A novel imprecise stochastic process model for time-variant or dynamic uncertainty quantification
