Frictional resistance of supercritical pressure RP-3 flowing in a vertically downward tube at constant heat fluxes
Yinlong LIU,Guoqiang XU,c,Yanchn FU,d,*,Ji WEN,d,Gng GONG,Lulu LYU
a Research Institute of Aero-engine, Beihang University, Beijing 100191, China
b National Key Laboratory of Science and Technology on Aero-engine Aero-thermodynamics, Beihang University, Beijing 100191,China
c School of Energy and Power Engineering, Beihang University, Beijing 100191, China
d Beihang Hangzhou Innovation Institute Yuhang, Hangzhou 310023, China
e China Aerodynamics Research and Development Center, Mianyang 621000, China
f AECC Commercial Aircraft Engine Co., Ltd., Shanghai 200241, China
KEYWORDS Aviation kerosene RP-3;Constant heat flux;Empirical correlation;Friction factor;Supercritical pressure;Vertical tube
Abstract Based on the demands of compact heat exchangers and micro cooling channels applied for aviation thermal protection, the flow resistance characteristics of aviation kerosene RP-3 were experimentally studied in a vertically downward circular miniature tube with an inner diameter of 1.86 mm at supercritical pressures and constant heat fluxes.A long and short tube method was used to accurately calculate the frictional pressure drop, and experimental conditions are supercritical pressures of 4 MPa, mass flow rates of 2–4 g/s(i.e.,mass fluxes of 736–1472 kg/(m2·s)),heat fluxes of 100–500 kW/m2,and inlet temperatures of 373–673 K.Results show that the sharp variations of thermophysical properties, especially density, have significant influences on frictional resistances.Generally,the frictional pressure drop and the friction factor increase with increasing inlet temperatures,and this trend speeds up in the relatively high-temperature region.However,the friction factor has a sudden decline when the fuel outlet temperature exceeds the pseudo-critical temperature.The frictional pressure drop and the friction factor basically remain unchanged with increasing heat flux when the inlet temperature is relatively low,but increase quickly when the inlet temperature is relatively high. Besides, a larger mass flux yields a higher pressure drop but does not necessarily yield a higher friction factor.Finally,an empirical friction factor correlation is proposed and shows better predictive performance than those of previous models.

Nomenclature cp isobaric specific heat capacity (kJ/(kg·K))d tube diameter (m)f fanning friction factor g acceleration of gravity (kg/(m·s2))G mass flux (kg/(m2·s))H enthalpy (kJ/kg)L tube length (m)m mass flow rate (kg/s)P pressure (MPa)Pr Prandtl number q heat flux (kW/m2)r radius Re Reynolds number T temperature (K)u fuel bulk speed (m/s)x local position (m)Greeks Δ difference value δ absolute uncertainty ε relative uncertainty λ thermal conductivity (W/(m·K))μ dynamic viscosity (Pa·s)ρ density (kg/m3)Subscripts ac acceleration b bulk c critical fr frictional g gravity heat heated in inlet inlet inlet section iso thermal isolated j joint l local L long tube max maximum out outlet outlet outlet section pc pseudo-critical S short tube w wall
1. Introduction
As future advanced hypersonic vehicles and aero-engines draw growing attention,the engine inlet stagnation temperature,turbine inlet temperature, and compressor pressure ratio have increased significantly to improve engine performance based on the Brayton cycle. The consequent deterioration of engine thermal environments promotes the development of the heatresistance quality of materials and advanced cooling technologies such as precooling technology,Active Regenerative Cooling (ARC)technology, and Cooled Cooling Air (CCA)technology.
Precooling technology utilizes the heat sink of onboard fuel to precool high-temperature engine intake air before it enters compressors, which can enhance the available compression ratio and engine performance in high-Mach number flight.ARC technology is introduced to cool high-temperature components(e.g.,combustors and exhaust nozzles)by endothermic fuel before entering a combustor and releasing heat.CCA technology precools the cooling air extracted from the highpressure compressor outlet to improve its cooling quality using onboard fuel as coolants through a heat exchanger installed near the combustor.Fuel will be heated to a supercritical state in the endothermic process due to limited fuel supply and enormous cooling task because 34–68 atm (3.45–6.89 MPa)is the typical operating pressure range of an aero-engine fuel feed system,which is beyond the critical pressure of common aviation kerosene.The subsequently heated fuel with a higher initial temperature at a supercritical pressure can be atomized better for following efficient combustion,resulting in a higher engine thermal efficiency. Therefore, the supercritical pressure state should be maintained in the whole cooling and combustion process. Low-resistance cooling processes are needed to decrease the consumption power for onboard fuel pumps pressurizing fuel to a high initial pressure, and the thickness of whole fuel tubes and channels could be thinner.Hence,the flow resistance characteristics of fuel in tubes and channels are meaningful to be studied since fuel-cooled thermal management systems are widely applied on aerospace engines.
Experimental and numerical research has been done aiming at the flow resistance characteristics of supercritical pure fluids such as water and carbon dioxide.Pioroand Fanget al.gave summarized research of pure fluids at supercritical pressures,and some empirical correlations of the friction factor were recommended for certain conditions.Razumovskii et al.provided an experimental investigation on the flow resistance of supercritical pressure water conducted in a heated vertical tube.Results indicated that the thermal acceleration effect had a strong impact on total flow resistance and took a large proportion in large q/G conditions. Kurganov et al.investigated total and frictional pressure drops of carbon dioxide flowing in a heated horizontal tube at supercritical pressures. The factors of momentum, kinetic energy, and density were determined by velocity and temperature profiles, and these could be devoted to calculating the pressure drop along the tube.
Due to complex components and the coking deposition effect, hydrocarbon fuels have significant differences from single-component fluids.Many investigations have been carried out on the flow characteristics of different hydrocarbon fuels.Kalbaliev and Verdievstudied the flow instability and oscillation of aromatic hydrocarbons in the supercritical region during a heated process.The oscillation phenomenon was limited when the operating pressure was twice beyond the fluid critical pressure.Zhu et al.carried out experimental research on the flow frictional resistance characteristics of China aviation kerosene RP-3 in an adiabatic horizontal circular tube with an inner diameter of 1.78 mm at supercritical pressures.Results revealed that the friction factor exhibited a local peak near the fuel pseudo-critical temperature at 3 MPa, and both the friction pressure drop and the friction factor reduced dramatically with increasing pressure at critical and pseudo-critical regions.Then a numerical investigation was proposed,and results indicated that the critical temperature was the demarcation point to determine the uniformity of pressure drops under different operating pressures.Furthermore,numerical studies on heat transfer and flow characteristics of supercritical hydrocarbon fuels in a dimpled channel were conducted by Feng et al.based on fuel physical properties by experimental measurements. An enhancement for convective heat transfer and a reduction for heated wall temperature were obtained with dimple effects.The average heat transfer rate of the dimpled channel was 1.64 times higher than that of a smooth channel,while the pressure drop of the dimpled channel was only 1.33 times higher than that of its smooth counterpart.
Compared with pure fluids, hydrocarbon fuels have complex components,causing complex variations of thermal properties and a difficulty in estimating heat transfer and flow resistance characteristics. Moreover, the flow direction of endothermic hydrocarbon fuel is not always horizontal in thermal management systems, and there are many differences in heat transfer and flow resistance characteristics between horizontal and vertical flows due to the buoyancy and thermal acceleration effect. Based on the thermo-physical property data of Chinese typical aviation kerosene RP-3 measured in our previous works,the flow frictional resistance characteristics of supercritical-pressure RP-3 in a vertically downward heated tube were experimentally studied in this paper.
2. Experimental apparatus and methods
2.1. System description
Fig. 1 shows the schematic diagram of the flow and heat transfer system for supercritical pressure hydrocarbon fuel at Beihang University, which consists of four sections: a preheating section, a test section, a recycling system, and a data acquisition system. Some parts of the experimental facilities are similar to those in our previous literature.The experimental system can provide fuel with mass flow rates of 0.1–8.33 g/s, achieve system pressures of 0.1–10 MPa, and release a maximum heat power of 60 kW, and these parameter ranges are capable to cover all test conditions in this work.The fuel was pumped by a high-pressure infusion pump(SP6015, 15 MPa, 0.01–600 mL/min) from a fuel tank. A filter screen with a net spacing of 45 μm was set before the pump to avoid impurity blockage of the fuel path. Then,the mass flow rate of the fuel was measured by a Coriolis mass flow meter (DMF-1-1, ±0.15%). Two 20-kW adjustable DC powers (TN-KGZ01, 100 V, 200 A) were used to heat the pressurized fuel to obtain the wanted inlet temperature for the test section. After the test section, there was a double-pipe water cooler to cool the high-temperature fuel to room temperature, and then the cold fuel flowed into a waste fuel tank to be collected. Moreover, a back pressure valve was arranged behind the water cooler to adjust the fuel system pressure within the scope of 0.1–8 MPa.
Fuel inlet and outlet temperatures were measured by two K-type sheathed thermocouples with first-class precision and a head diameter of 0.5 mm. The inlet absolute static pressure and pressure drop on the test section were measured by an absolute pressure transducer (Model 3051CA4, Rosemount)and a differential pressure transducer(Model 3051CD4,Rosemount), respectively. Furthermore, the experimental data of the absolute static pressure, pressure drop, temperature, mass flow rate,heater voltage,and current were measured by respective instruments on the set-up, collected by ADAM-4018 data acquisition units, transformed by ADAM-4520 to readable files, and stored on an industrial computer.
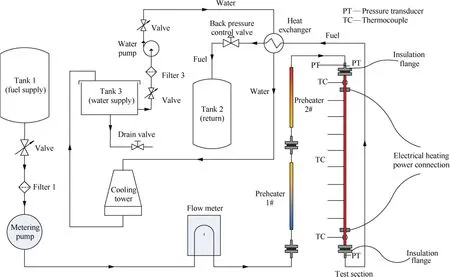
Fig. 1 Schematic of experimental system.
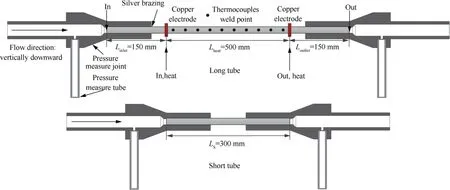
Fig. 2 Schematic of test section.
2.2. Test section
The test section is a vertical straight stainless steel(1Cr18Ni9Ti)tube with an outer diameter of 2.2 mm and inner diameter of 1.86 mm. Fig. 2 displays that the total tube length is 800 mm with a heating section of 500 mm,and both the inlet and outlet adiabatic sections of 150 mm are used to obtain fully developed flow.Ten K-type thermocouples with first-class precision were welded with a uniform spacing on the tube outside surface to monitor local tube outer wall temperatures. Two homemade three-way joints were connected to the test tube at both ends by the silver brazing method to decrease the local resistance,and they have an opening hole with a diameter of 0.5 mm perpendicular to the main flow channel to measure the pressure drop on the test section. Moreover, to reduce and eliminate the influence of the local resistance on the acquisition of the frictional pressure drop, experiments were conducted by two separate tubes with the same diameter but different lengths(800 mm and 300 mm), and a detailed description of data reduction is listed in Section 2.3. The whole test section was covered with a thermal insulation material called Aspen(λ=0.012 W/(m·K))to reduce heat loss.The influences of several physical factors on the frictional resistance were considered, and Table 1 shows detailed test conditions.
2.3. Data reduction
In the vertically downward long tube with constant heat fluxes on the heated section as shown in Fig.2,the total pressure losscontains the frictional pressure drop ΔP, the local resistance pressure drop due to the measure joint ΔP, the heataccelerated pressure drop on the heated section ΔP, and the gravity pressure drop ΔP. The total pressure drop of the long tube can be written in the following equation:
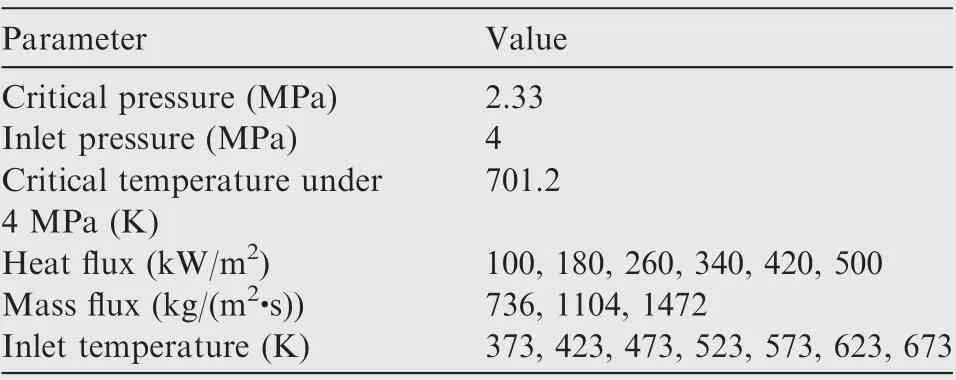
Table 1 Experimental parameters.
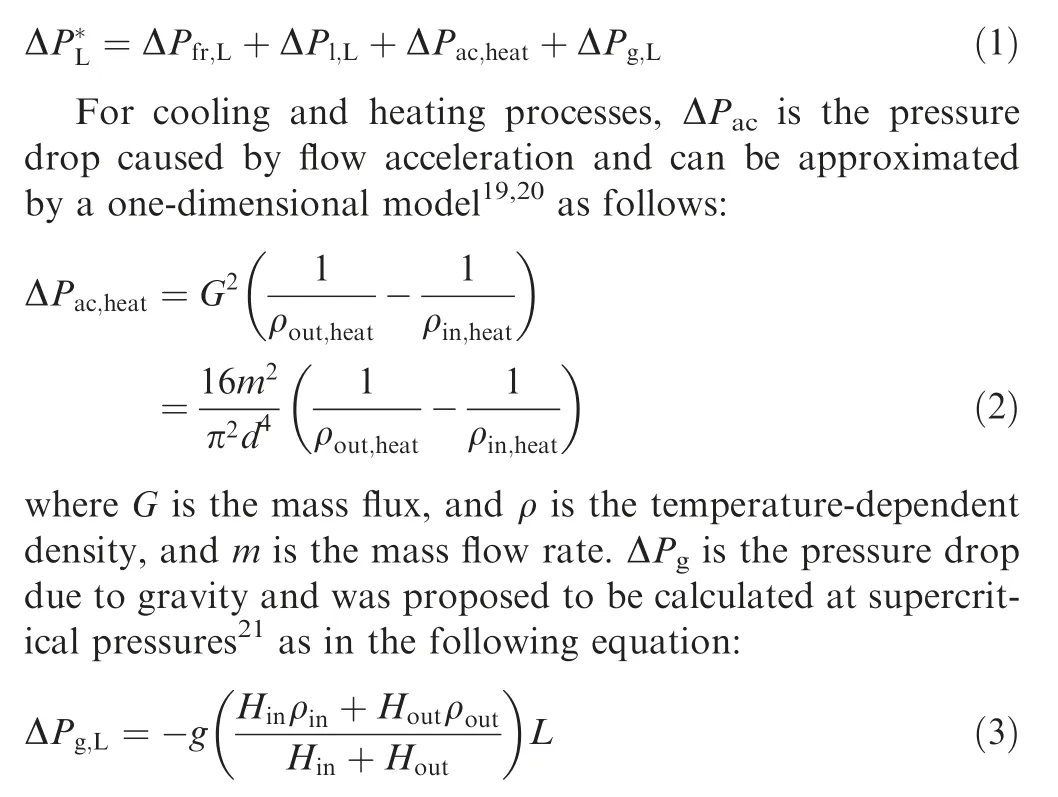
where g is the local gravitational acceleration, H is the enthalpy value of aviation kerosene, and L is the length of the test tube. In terms of the long tube structure, Eq. (1) can be rewritten as
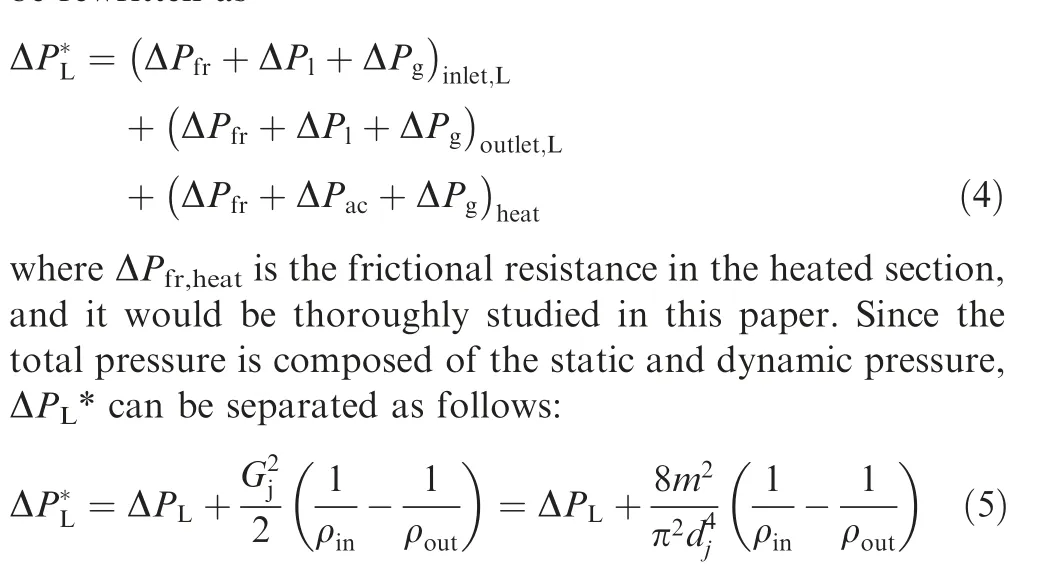
where ΔPis the static pressure drop actually measured by a differential pressure transducer, Gis the mass flux of the flow channel in the pressure measure joint,and dis the inner diameter of the flow channel in the pressure measure joint. Similar to Eq. (4), the total pressure drop of the isothermal adiabatic short tube can be written as follows:

where(ΔP*)stands for the total pressure drop in the short tube when its thermo-physical condition is identical to that of the long tube inlet region,and(ΔP*)has a similar meaning.As the fuel bulk temperature remains constant and the system pressure varies little in the isothermal adiabatic short tube,ΔP* can be simplified as follows:

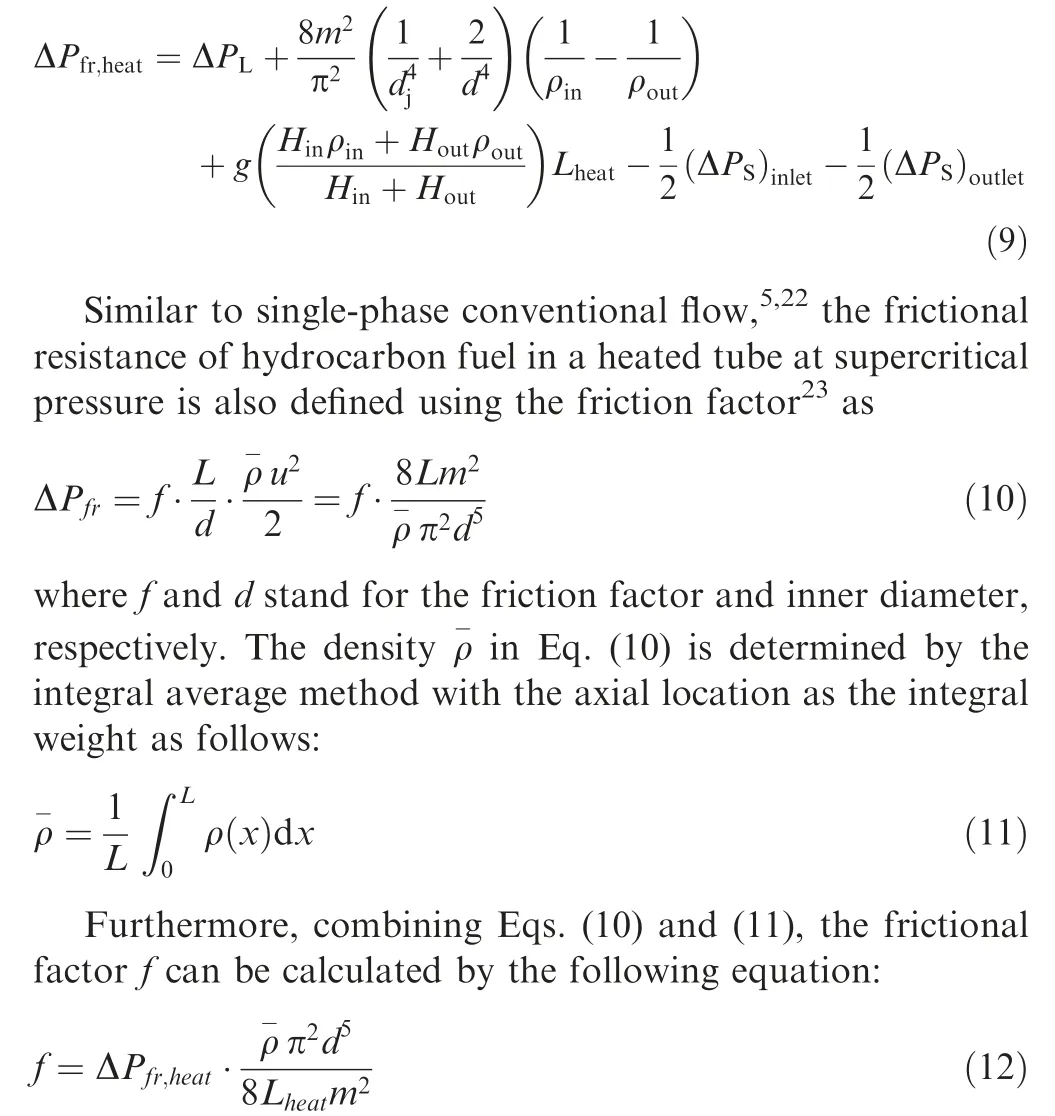
where ΔPis the static pressure drop for the short tube and is actually measured by the differential pressure transducer.Combining Eqs. (1)–(8), the frictional resistance of aviation kerosene on the long tube heated section is obtained as
During data processing, thermo-physical properties of aviation kerosene RP-3 (isobaric specific heat capacity,viscosity,and density) were calculated using the experimental data in our previous work as shown in Fig. 3.
Table 2 summarizes the experimental uncertainties of direct measurements.Based on the non-linear error propagation theory,the uncertainty of the second item in ΔPcalculation of Eq. (9), composed of the dynamic and thermalacceleration pressure drops, could be calculated in the following equation:
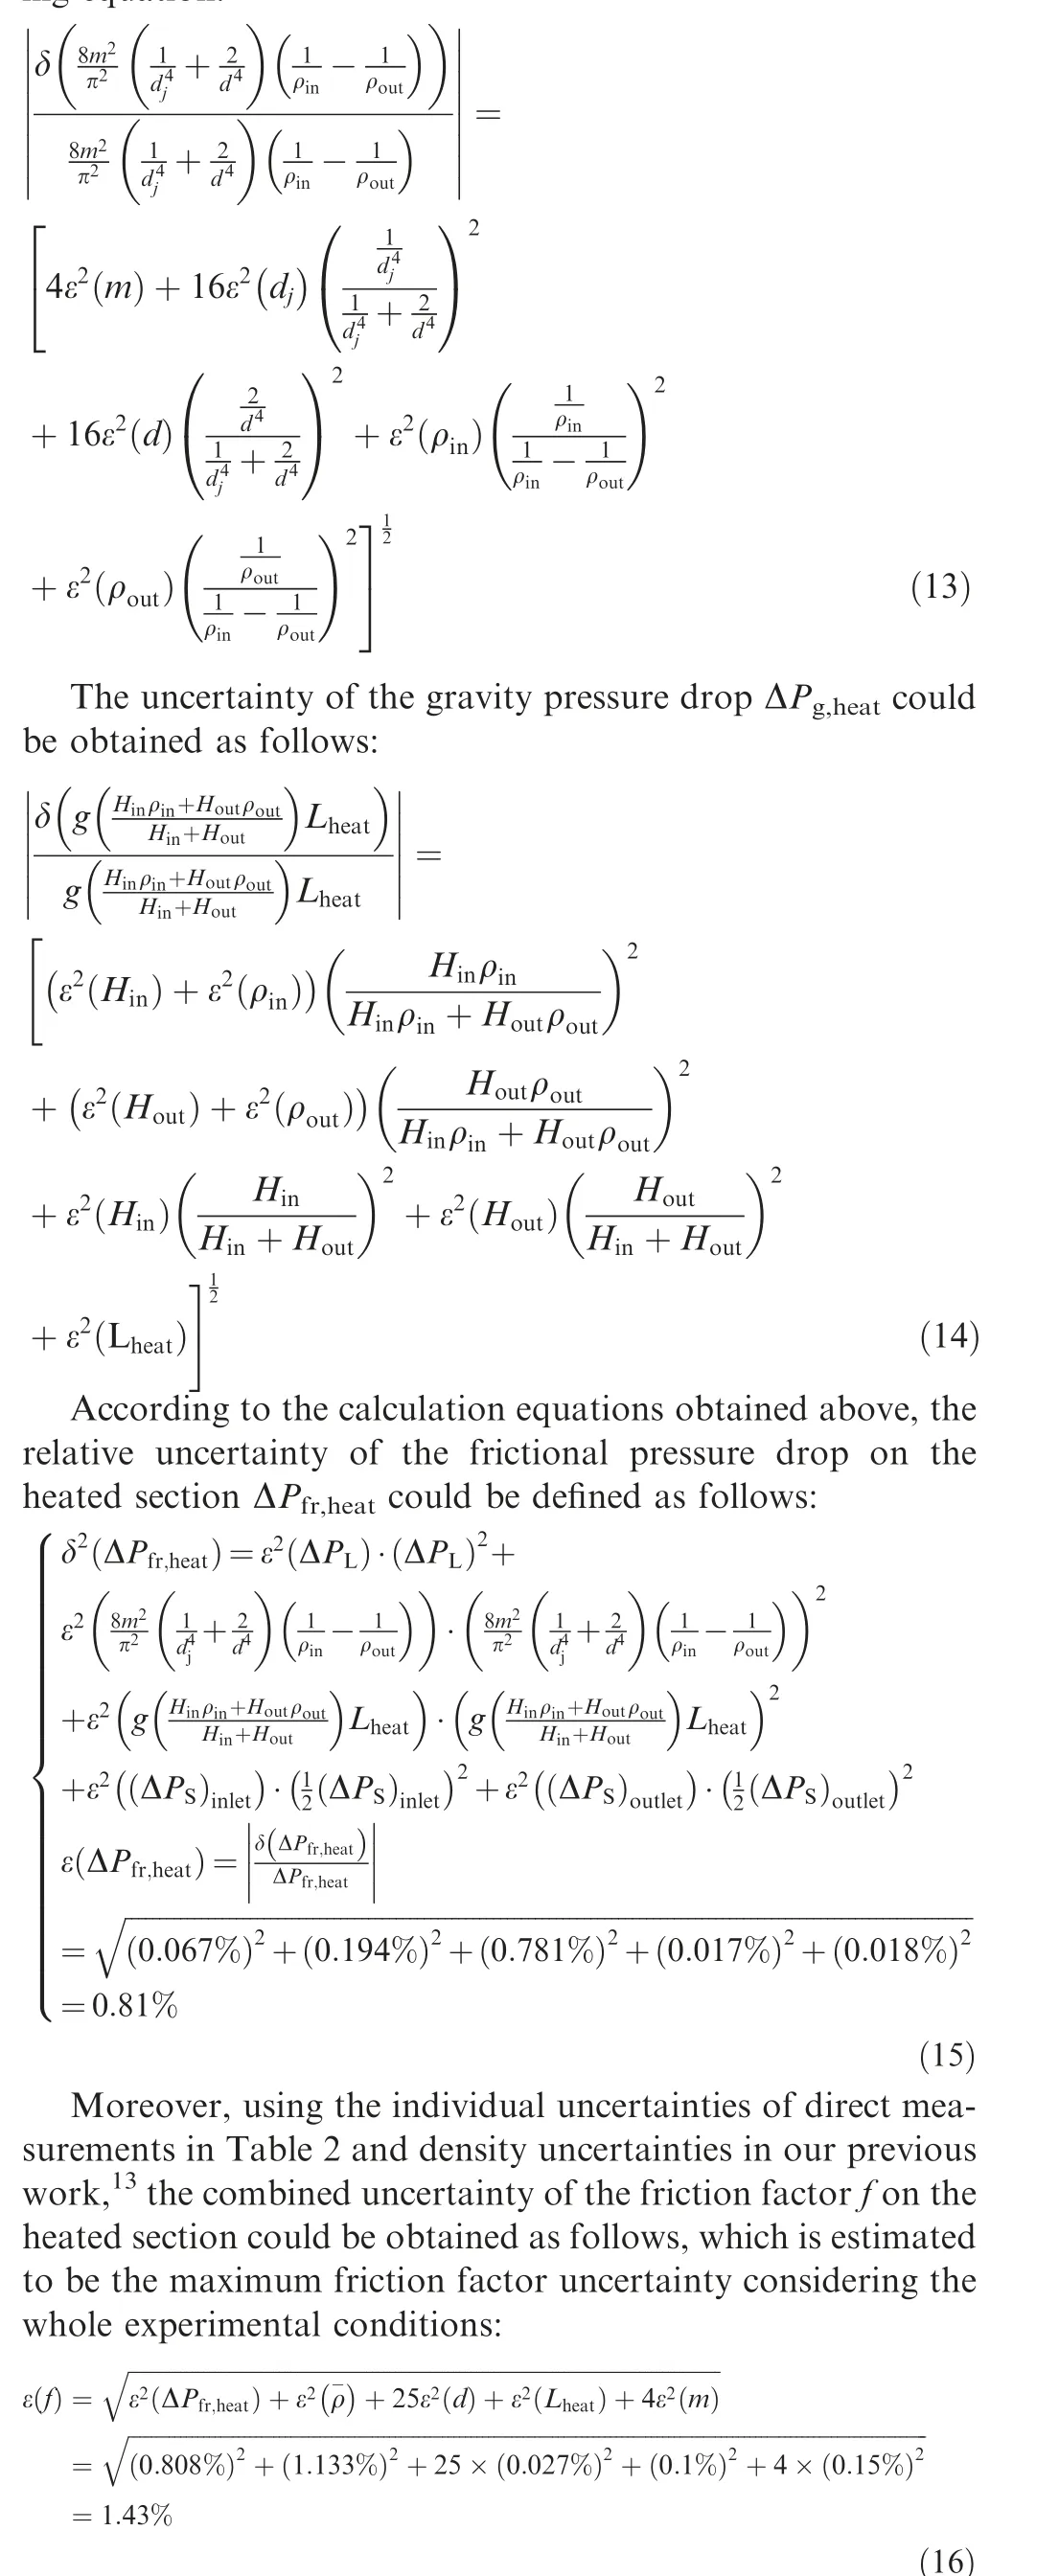
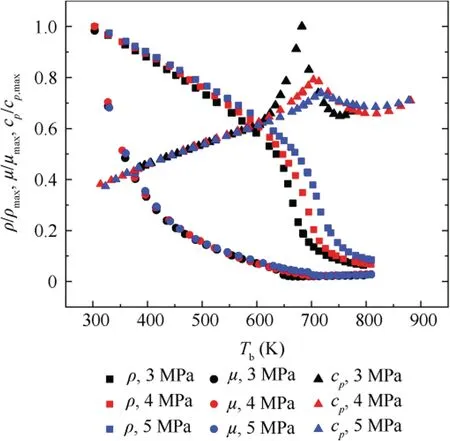
Fig. 3 Variations of temperature-dependent thermo-physical properties for kerosene RP-3 at 3–5 MPa.

Table 2 Uncertainty of direct measurements.
3. Results and discussion
3.1. Effect of temperature
Fig.4 shows the frictional pressure drop and friction factor of kerosene RP-3 vs fuel outlet temperatures under a mass flux of 1104 kg/(m·s), a pressure of 4 MPa, and heat fluxes from 100 kW/mto 500 kW/m,where the outlet temperatures were obtained by varying the inlet temperature from 373 K to 673 K with a uniform interval of 50 K.At relatively low temperatures(about T<600 K), the frictional pressure drops increase relatively slowly with the fuel outlet temperature. However,the frictional resistance increases rapidly with the outlet temperature when the fuel temperature rises to a relatively higher region. This phenomenon is due to variations of fluid thermophysical properties at supercritical pressures. As presented in Fig. 3, both the density and dynamic viscosity decrease with the fluid bulk temperature, which results in a slow increase of the frictional pressure drop in the low-temperature region.A rapid decrease of the density with the fluid bulk temperature results in an increase of the bulk velocity and near-wall velocity gradient at the relatively higher-temperature region,and the wall-to-bulk temperature and density difference gradually induces an M-shaped velocity profile which makes the nearwall velocity gradient larger. The variation of the densitydependent velocity profile results in a quick enlargement of the frictional pressure drop near by the pseudo-critical temperature.
To understand the velocity profile variation more vividly,a certain velocity profile developmentfor RP-3 in a simulated vertically heated circular tube with an inner diameter of 2 mm is displayed in Fig.5.As can be seen,the development of crosssection velocity profiles experiences a U-shaped profile and an M-shaped profile,and recovers to a turbulent U-shaped profile along the axial direction owing to the variation of temperature-dependent density.
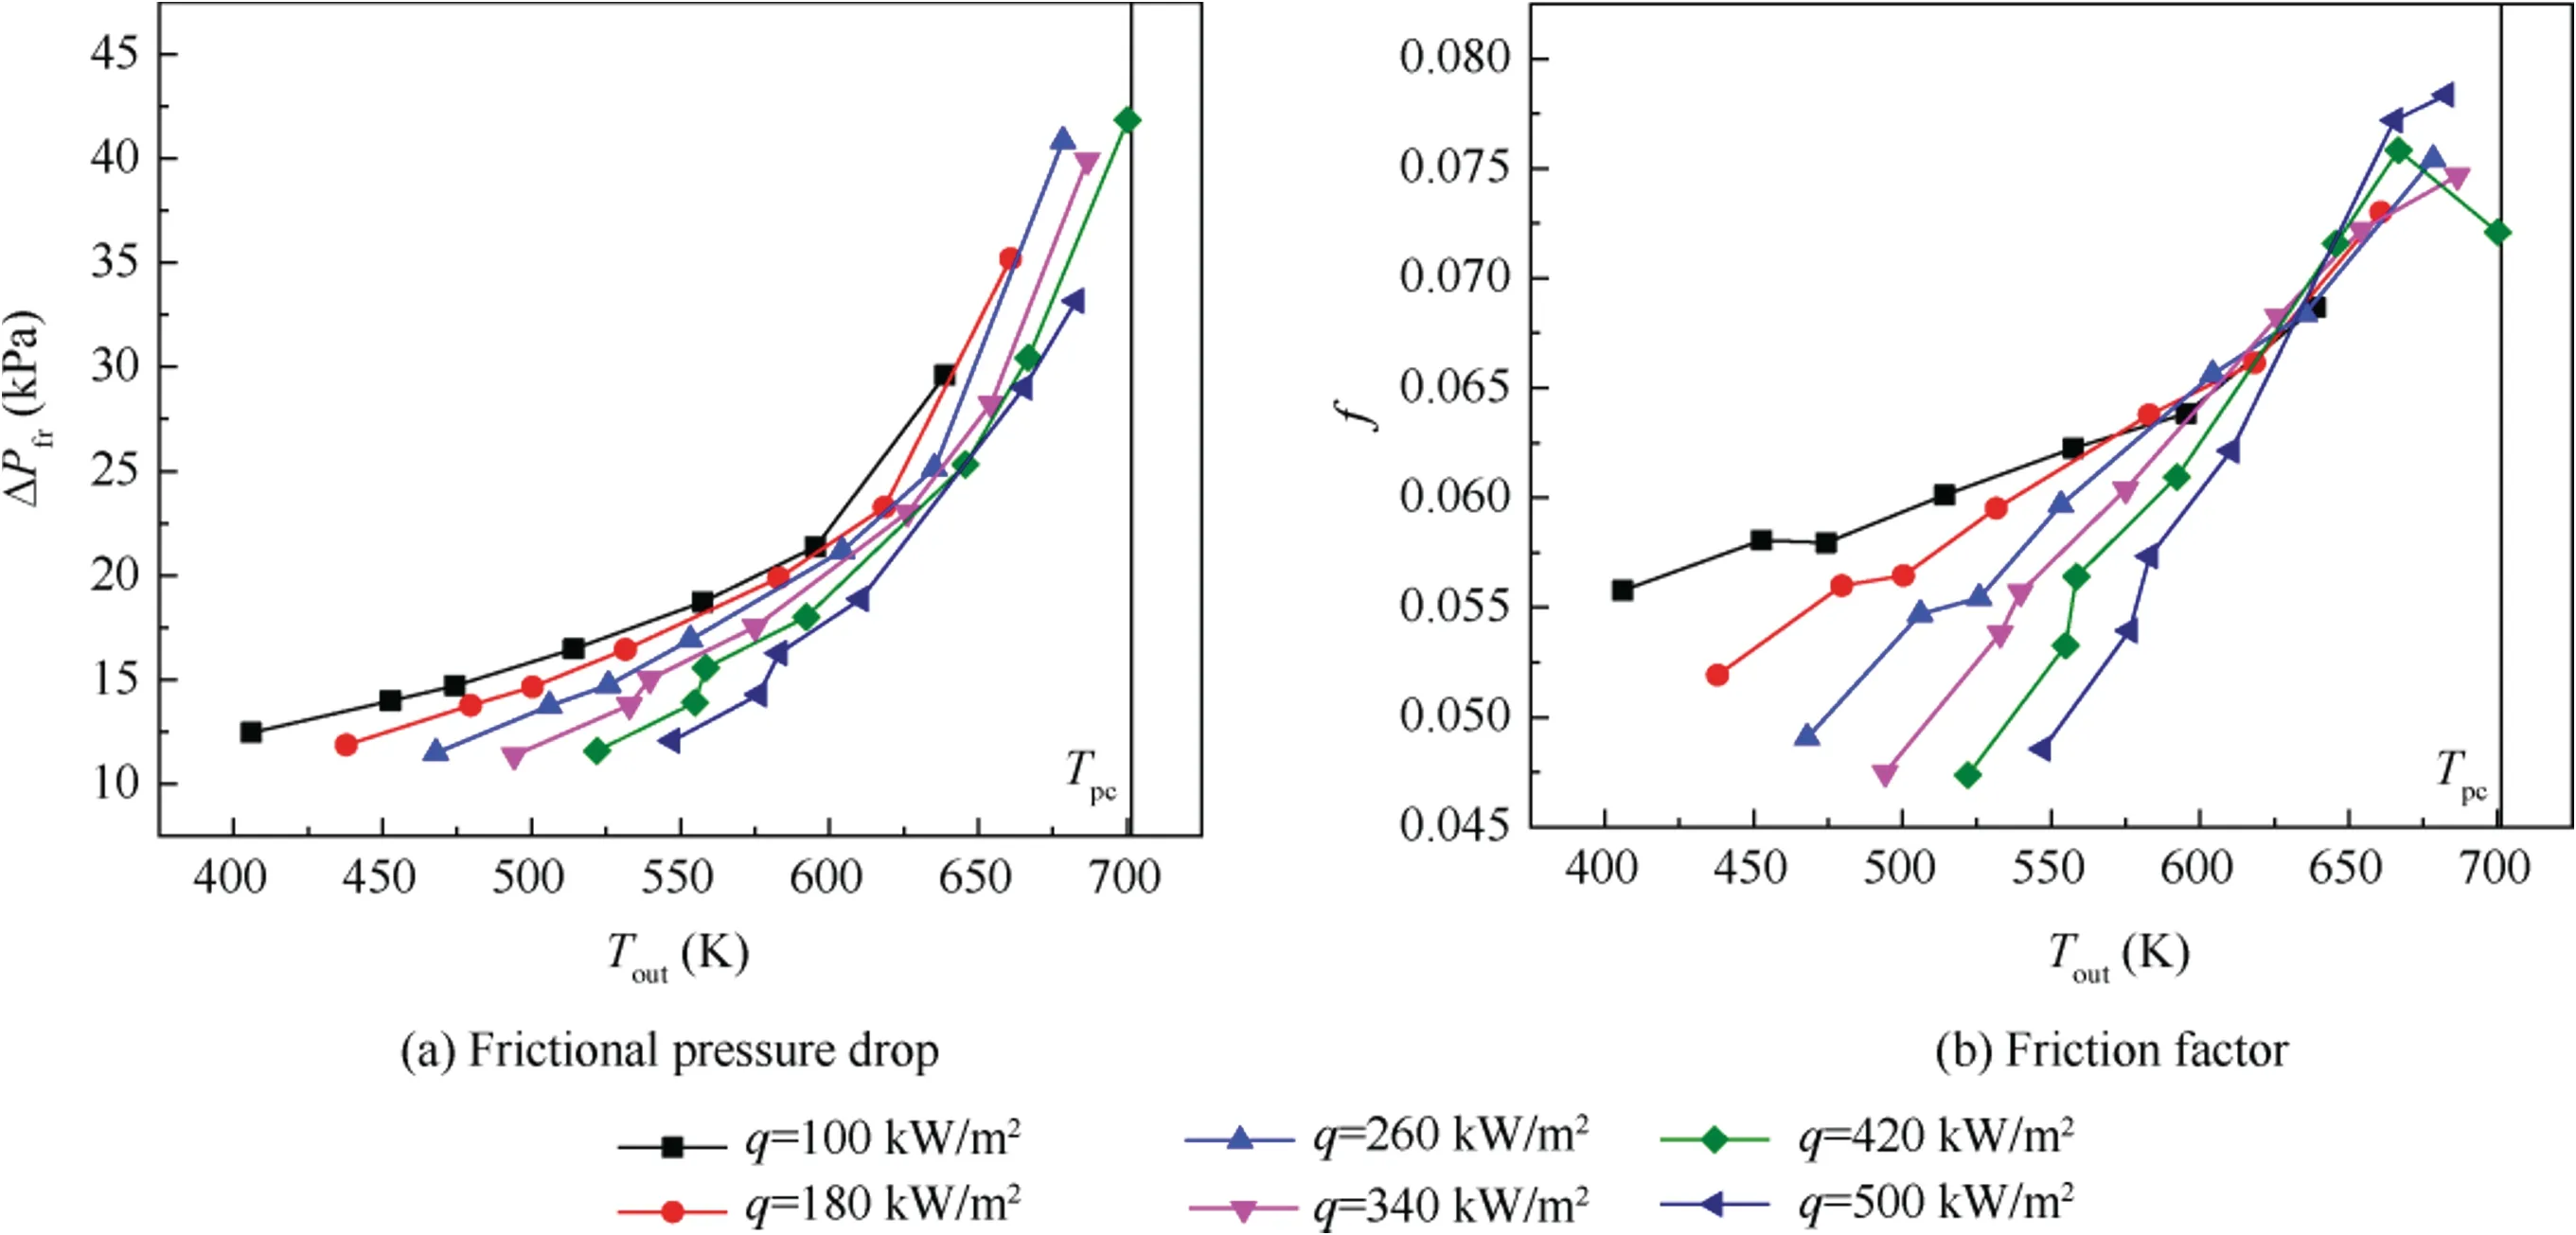
Fig.4 Variations of frictional pressure drop and the friction factor with outlet temperatures at different heat fluxes(G=1104 kg/(m2·s),P = 4 MPa).
As shown in Fig. 4(b), the variation of the friction factor generally follows an upward tendency with rising fuel average temperatures in most conditions because of an increasing flow velocity gradient near the wall caused by a decrease of the density and formation of an M-shaped velocity profile. Note that the increase rate of friction factors is slower than that of frictional pressure drops, because the dynamic pressure 1/2(ρu)has been eliminated in the calculation of friction factors from pressure drops as shown in Eq. (10). Meanwhile, it indicates that the increase amplitude of the near-wall velocity gradient yielded by the density-dependent bulk velocity is smaller than that yielded by the wall-to-bulk temperature and density difference.That is,the formation of the M-shaped velocity profile occupies the maximum proportion in the reasons of the frictional pressure drop augment.
Whereas, there exists a decline for the friction factor when the fuel outlet temperature exceeds the pseudo-critical temperature T. The range of T>Tin Fig. 4(b) indicates that both the fuel bulk and wall temperatures are higher than the pseudo-critical temperature in the near tube outlet region,which brings about the M-shaped velocity profile vanishing and transforming to be a normal turbulent U-shape. Hence,the near-wall velocity gradient decreases, and the fluid-towall shear force weakens, which induces a decline of the friction factor.
3.2. Effect of heat flux
Fig.6 presents the frictional resistance,friction factor,and fuel outlet bulk temperature of aviation kerosene RP-3 vs heat flux when the heat flux q varies from 100 to 500 kW/mwith a uniform spacing of 80 kW/m. At each heat flux, a test was conducted by varying the inlet temperature from 373 K to 673 K with a uniform interval of 50 K.
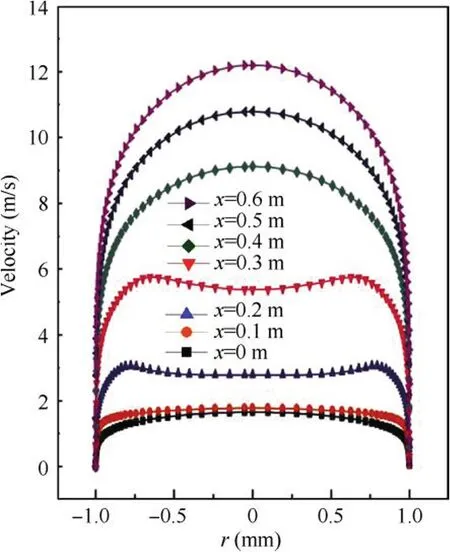
Fig. 5 Velocity profile development in a simulated vertically heated tube (P = 3 MPa, Tin = 573 K, q = 500 kW/m2,G = 704 kg/(m2·s), d = 2 mm, Lheat = 0.6 m, vertically upward).24
As can be seen from Fig. 6(a) and (b), the frictional pressure drop stays generally unchanged, and the friction factor has a slight decline with the heat flux increasing in the scope of T≤523 K, far away from the pseudo-critical temperature at 4 MPa. On one hand, the frictional resistance tends to increase as a decrease of the density causes a higher main flow speed and a larger wall velocity gradient. On the other hand, the viscosity declines more dramatically than the density in the relatively low-temperature region, which gives a reduction tendency for the pressure drop. Thus, the variations of the density and viscosity with the temperature generate a synthetic effect of the frictional pressure drop keeping nearly constant in the relatively low-temperature region, and the friction factor has a slight decrease with the heat flux based on Eq. (12) because the average density is decreasing. In the relatively high-temperature region of T>523 K, the frictional pressure drop obviously rises with an increasing heat flux due to a quick decline of the density with an accompanying increase of the fuel temperature. Because the wall temperature is higher than the fuel bulk temperature in a heating condition and the wall-tobulk density discrepancy makes the cross-section velocity profile flatter, a higher velocity gradient is produced near the wall, and the frictional resistance increases. Moreover,an M-shaped velocity profile is generated due to a sharp decrease of the fuel density near the wall, when the inner wall temperature is higher than the pseudo-critical temperature of 701.2 K at 4 MPa and the fuel bulk temperature is lower than that. The gradually larger velocity gradient near the wall causes a gradually larger variation slope of the frictional pressure drop when the heat flux increases at T>523 K.
It is worth noting that the frictional resistance curve at T= 673 K is much higher than others for its whole temperature region is nearer by the pseudo-critical temperature, but the pressure drop remains generally unchanged when q >260 kW/m. It is observed from Fig. 6(c) that the wallto-bulk density discrepancy gets lower and the velocity profile becomes normal in the outlet region of the tube referring to Fig. 5 as the fuel outlet temperature is basically close to the pseudo-critical temperature in this heat flux region at T= 673 K. As a result, the frictional pressure drop rises slowly and even flattens, and the friction factor starts to decline as shown in Fig. 6(b).
3.3. Effect of mass flow rate
Fig. 7 illustrates the frictional resistance and friction factor characteristics of aviation kerosene RP-3 vs mass flux under heat fluxes of 180 and 420 kW/m,and at each mass flux,a test was conducted with the inlet temperature varying from 373 to 673 K with a uniform interval of 50 K. The mass flux has a great influence on the fuel resistance as shown in Fig. 7. For the whole experimental conditions,a rise of the frictional pressure drop was observed with an increasing mass flux due to an accompanying higher flow bulk velocity and velocity gradient near the wall.Besides,in the relatively low-temperature region,the pressure drop increases relatively slowly with an enlargement of the fuel average temperature, and the growth slope augments rapidly in the relatively high-temperature region owing to a quick descent of the density as explained before.

Fig. 6 Frictional resistance characteristic at different heat fluxes (G = 1104 kg/(m2·s), P = 4 MPa).
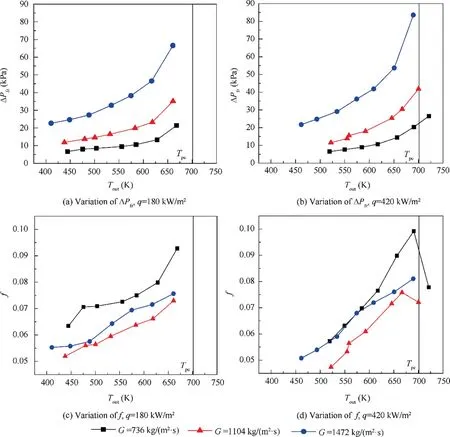
Fig. 7 Variations of frictional pressure drop and friction factor at different mass flow rates (P = 4 MPa).
The variation of the friction factor generally follows an upward tendency with a rising fuel average temperature in most conditions because of an increasing flow velocity gradient near the wall caused by a decrease of the density and formation of an M-shaped velocity profile. However,there exists a decline for the friction factor at 420 kW/mwhen the fuel outlet temperature exceeds the pseudocritical temperature, and the M-shaped velocity profile vanishes and transforms to be a normal U-shape as explained in Section 3.1.
Besides, it is observed in Fig. 7(c)and(d)that, at the same outlet fuel temperature, f firstly decreases and then increases with the mass flow rate. Note that a higher mass flux yields a higher Re number due to a higher axial velocity and a lower average viscosity caused by a higher average bulk temperature at the same outlet fuel temperature and heat flux.A classic empirical correlation for single-phase flow in an isothermal tube such as the Blasius correlationtells us that the friction factor decreases with Re number generally.It is coincident from mass fluxes of 736 kg/(m·s)to 1104 kg/(m·s), but not coincident from mass fluxes of 1104 kg/(m·s) to 1472 kg/(m·s). Since the dynamic pressure 1/2(ρu)has been eliminated in the calculation of friction factors from pressure drops as shown in Eq.(10),it means that an additional influencing factor having more influence than the bulk velocity resulted in increases of friction factors from mass fluxes of 1104 kg/(m·s) to 1472 kg/(m·s). As discussed above,with a dramatical descent of the near-wall fluid density with respect to central fluid,an M-shaped velocity profile is generated in the generally high-temperature region,and the friction factor magnifies much owing to an amplifying near-wall velocity gradient.Because a higher mass flux stands for a higher average temperature along the heated tube at the same outlet fuel temperature and heat flux, the friction factor for a mass flux of 1472 kg/(m·s) is greater than that of 1104 kg/(m·s), and this difference is more apparent with a higher heat flux. However,as presented in both Fig.7(c)and(d),the difference reduces in the near pseudo-critical temperature region ascribed to the gradual transition from an M-shaped velocity profile to a normal turbulent velocity profile.
3.4. Friction factor modeling and correlation
The frictional resistance characteristics of straight circular tubes were studied in previous research,and most of them were analyzed and generalized using the Darcy friction factor.Table 3provides the parameter range in our present work and the experimental data of four works of literature on hydraulic resistance at supercritical pressures, and their detailed friction factor relations for heated fluids are presented as follows.
Zhu et al.used an experimental method to investigate the flow frictional resistance of supercritical-pressure RP-3 in an adiabatic horizontal circular tube, and obtained a correlation for the friction factor f summarized in the following equation:
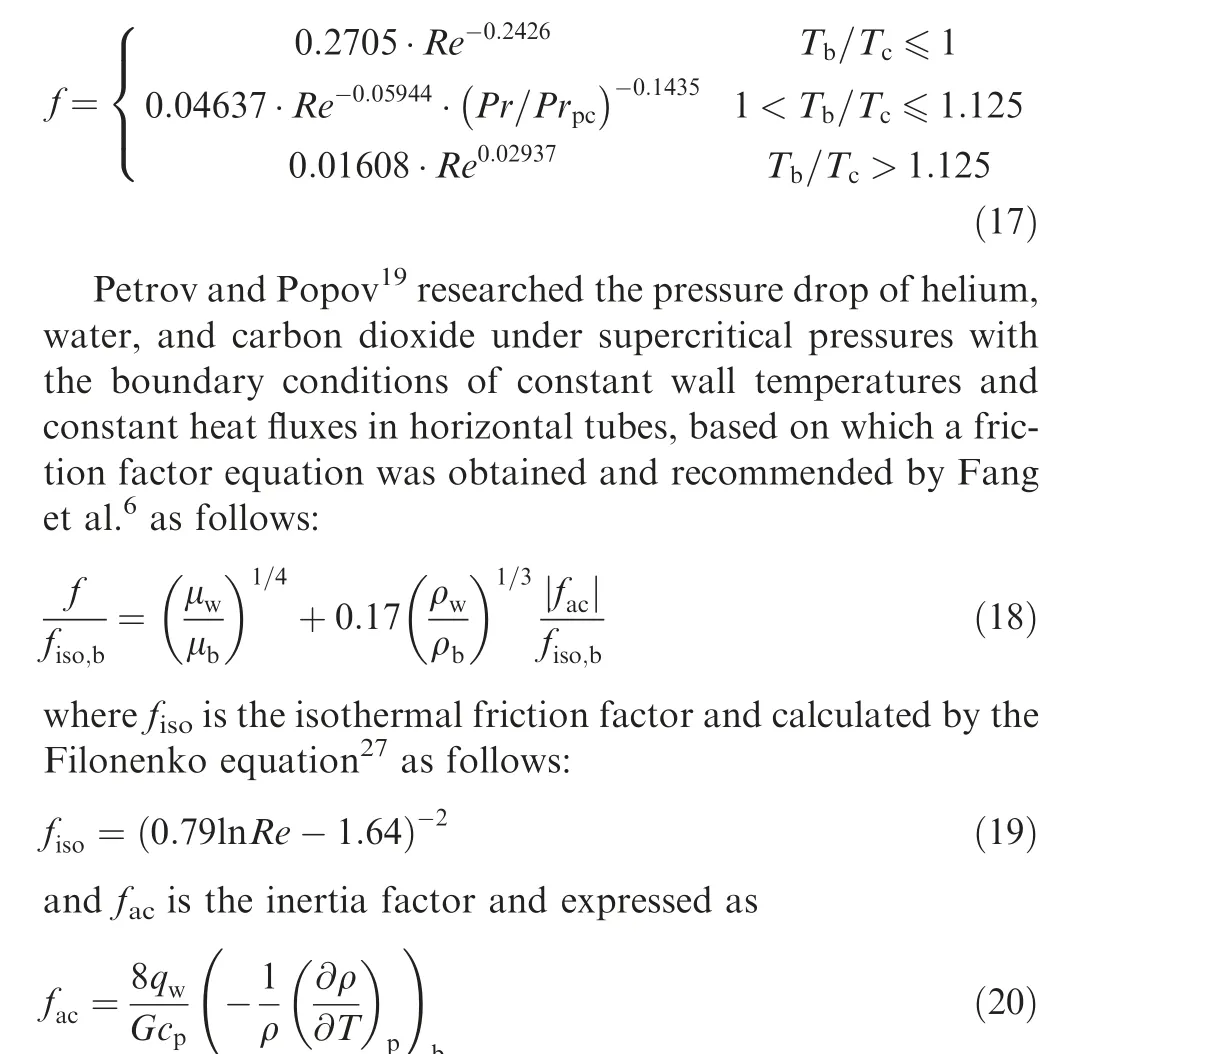
Petukhov et al.described a new procedure for predicting the pressure drop of fluid flows in a heating condition with variable properties. Experimental data obtained in horizontal and vertical tubes with heating carbon dioxide under supercritical pressures were summarized by empirical correlations as follows:

where fis the isothermal friction factor and calculated by the Filonenko equation.Tarasova and Leonte´vfound that f/fcoincided with the variation of μ/μespecially in the pseudo-critical region when the supercritical-pressure water flow in a heated tube was investigated, based on which a correction coefficient was added into the calculation equation for the friction factor as follows:


Table 3 Ranges of investigated parameters for flow resistance experiments at supercritical pressures.
Similarly,fis the isothermal friction factor and calculated by the Filonenko equation.
Fig.8 presents calculated friction factor(f)results by the above four literature correlations and indicates that all predicted values are lower than experimental data(f)with most deviations exceeding-30%.In addition,the majority of calculated values by Petrov and Tarasova correlations show very small deviations between each other. Fig. 9 shows a comparison between the predicted friction factor and experimental values along with the wall-to-bulk viscosity and density ratios with a variation of the fluid bulk temperature, generated by varying the fuel inlet temperature from 373 K to 673 K with a uniform interval of 50 K. In addition, all of the four literature correlations take under-prediction, and the deviations between predicted and experimental values increase with the fluid bulk temperature increasing and approaching the pseudo-critical temperature. All four literature equations have a little discrepancy in the relatively low-temperature region,and the discrepancy magnifies with the fluid bulk temperature approaching the pseudo-critical temperature.The wall-to-bulk viscosity ratio stays relatively low and undergoes little change when T/T<0.91,but increases fast and approaches 1 with the augment of the bulk temperature in the relatively hightemperature region of T/T>0.91.The wall-to-bulk density ratio undergoes little change when T/T<0.84, but has a sharp decline in the relatively high-temperature region of T/T>0.84.

Fig.8 Comparison of friction factors between experimental data and four previous correlations.
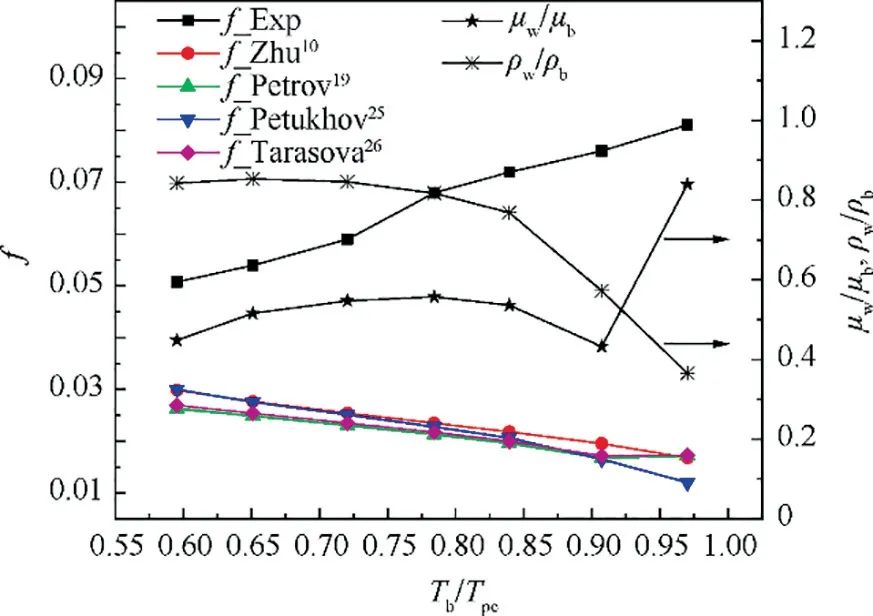
Fig. 9 Comparison between experimental and literature friction factors with variations of fluid bulk temperatures (P = 4 MPa,q = 420 kW/m2, and G = 1472 kg/(m2·s)).
Zhu correlation was obtained for supercritical-pressure RP-3 with an adiabatic boundary condition, not considering the variations of thermophysical properties in the heating condition and the property discrepancy between near-wall fluid and main flow caused by heat transfer. The other three literature correlations revealed the frictional resistance characteristics of pure-substance fluids like water and carbon dioxide in heated tubes at supercritical pressures while adding respective correction items of the thermal-physical property ratio in their empirical equations. However, there are many differences between pure-substance fluids and multi-component hydrocarbon fuels in terms of velocity distribution, temperature distribution, and thermophysical property variation in heated flow, which causes the discrepancy in frictional pressure drop characteristics.Therefore,there is a need to develop a new correlation to describe the frictional resistance characteristics of hydrocarbon fuel RP-3 in a vertically downward circular tube under supercritical pressures and uniform heat fluxes.
Referring to the forms of Blasius equationand Zhu equation,a power function form is adopted to generalize the experimental friction factor data with a single correlation.Moreover, wall-to-bulk thermo-physical property ratios should be added into the correlation as correction terms allowing for the variations of velocity and temperature distributions caused by significant thermo-physical property discrepancies in heating conditions at supercritical pressures referring to Refs.As the variation tendencies of viscosity and density ratios show disagreement as displayed in Fig. 9 and both of them have significant influences on the frictional resistance,both ratios are added into the new empirical friction factor correlation as follows:

Eq.(23)is validated within the range of 4400 <Re<10,0.24 <μ/μ<1.21, and 0.22 <ρ/ρ<0.96, where the average temperature of the inlet and outlet is chosen as the reference temperature for Re.
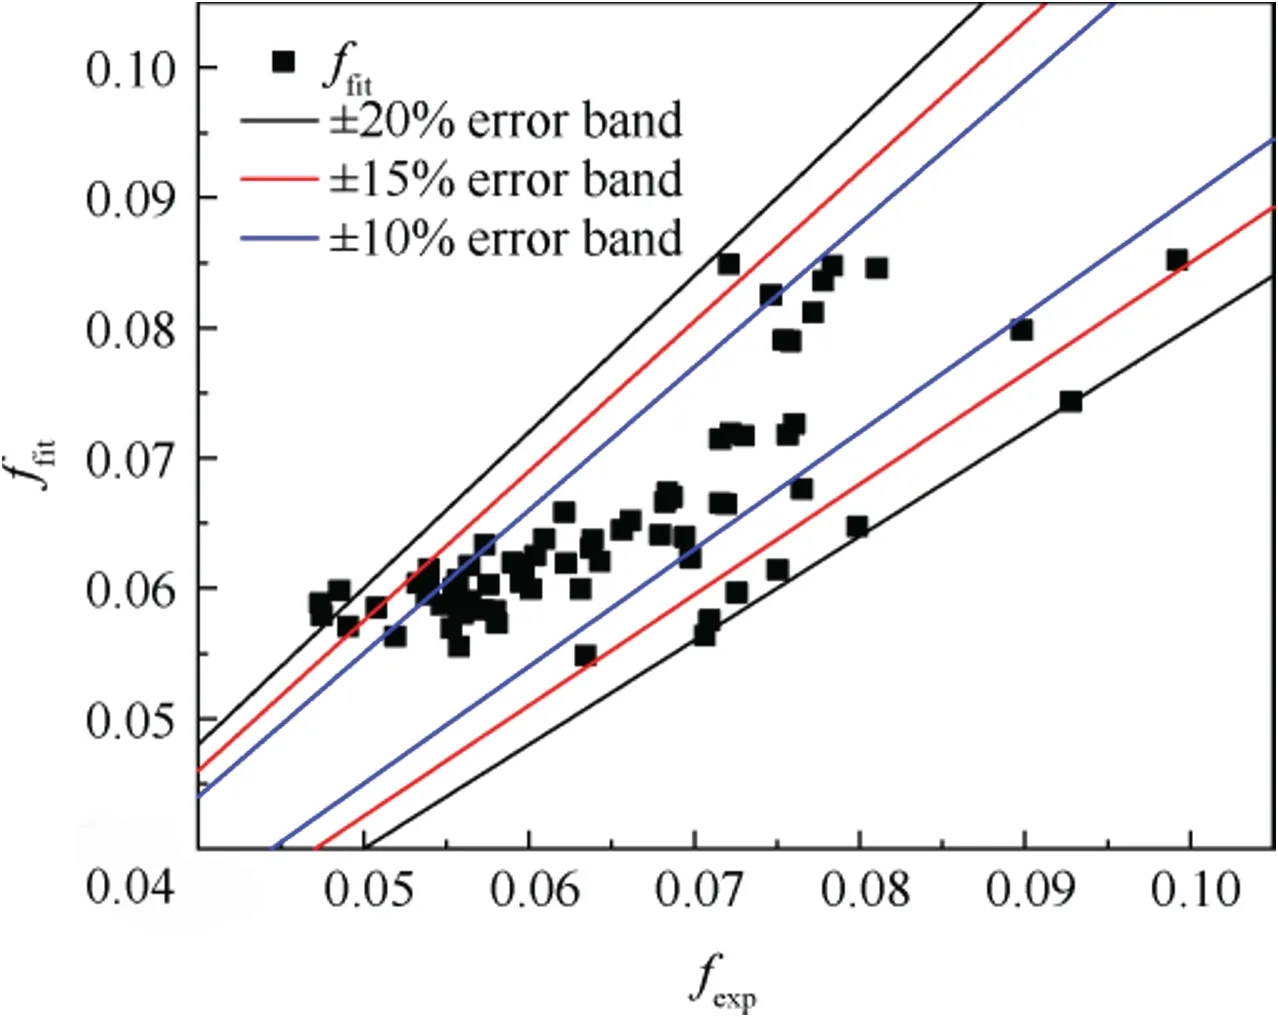
Fig. 10 Comparison of friction factors between experimental data and fitted values.
Fig. 10 describes the comparison results between experimental data and calculated values by the above fitted correlation of Eq. (23) (f). It can be seen that the average absolute value of deviations is 7.96%,and the maximum absolute value of deviations is 24.3%.94.2%of data points fall within±20%error band, 82.6% within ±15% error band, and 72.5%within ±10% error band. The new empirical correlation obtained in this study shows much better predictive performance than those of previous works under certain conditions as listed in Table 3 and Eq. (23).
4. Conclusions
The frictional pressure drop and friction factor characteristics of aviation kerosene RP-3 in a vertically downward miniature tube with an inner diameter of 1.86 mm at supercritical pressures and uniform heat fluxes were studied.The following conclusions are obtained:
(1) The frictional pressure drop and the friction factor increase slowly with increasing inlet temperatures in the relatively low inlet temperature region, and the increases speed up in the relatively high inlet temperature region. However, the friction factor has a decline when the fuel outlet temperature exceeds the pseudocritical temperature.
(2) The frictional pressure drop and the friction factor generally remain unchanged with increasing heat fluxes in the relatively low inlet temperature region, but increase quickly in the relatively high inlet temperature region.
(3) The frictional pressure drop increases with increasing mass fluxes, but the friction factor varies complexly.
(4) An empirical correlation of the friction factor was obtained based on experimental data and shows better predictive performance than those of previous models.
The authors declare that they have no known competing financial interests or personal relationships that could have appeared to influence the work reported in this paper.
This study was co-supported by the National Science and Technology Major Project of China (Nos. 2017-III-0005-0029, J2019-III-0021-0065, and J2019-III-0015-0059), and the National Natural Science Foundation of China (No.51906009).
 Chinese Journal of Aeronautics2022年9期
- Chinese Journal of Aeronautics的其它文章
- Effect of vortex dynamics and instability characteristics on the induced drag of trailing vortices
- Dynamic modeling and beating phenomenon analysis of space robots with continuum manipulators
- An effective crack position diagnosis method for the hollow shaft rotor system based on the convolutional neural network and deep metric learning
- A homogenization-planning-tracking method to solve cooperative autonomous motion control for heterogeneous carrier dispatch systems
- Static magnetic field analysis of hollow-cup motor model and bow-shaped permanent magnet design
- Adaptive modification of turbofan engine nonlinear model based on LSTM neural networks and hybrid optimization method
