Modelling and analysis of initial icing roughness with fixed-grid enthalpy method based on DPMVOF algorithm
Jie LIU, Peng KE
a Department of Civil Helicopter Research and Development, China Helicopter Research and Development Institute, Tianjin 300000, China
b School of Transportation Science and Engineering, Beihang University, Beijing 100191, China
KEYWORDS Discrete phase model;Fixed-grid porous enthalpy method;Ice roughness;Icing modelling;Integrated algorithm;Multiphase heat transfer;Volume of fluid
Abstract Ice particles could form under the continuous impingement of incoming supercooled droplets in icing conditions, which will change the surface roughness to enhance the further heat and mass transfer during icing process.A fixed-grid porous enthalpy method based on the improved Discrete Phase Model (DPM) and Volume of Fluid (VOF) integrated algorithm is developed to solve the multiphase heat transfer problem to give more detailed demonstration of the formation of initial ice roughness. The algorithms to determine the criterion of transformation from DPM to VOF and the allocation of source items during transformation are improved to the general DPM-VOF algorithm. Two verification cases, namely two glycerine-solution droplets impact and single droplet freeze, are conducted to verify the accuracy and reliability of the enthalpy-DPMVOF method, where the simulation results match well with experiment phenomena. Ice roughness on a NACA0012 airfoil is precisely captured and the effects on convective heat transfer characteristics are preliminarily revealed. The results illustrate that the enthalpy-DPM-VOF method could successfully capture the characteristics of motion and the phase change process of droplet, as well as balance the calculation accuracy and efficiency.
1. Introduction
Icing is always vital for the performance and safety of aircraft,and during the process of icing, ice particles will form under the continuous impingement of incoming supercooled droplets,and then change the roughness and heat transfer characteristics of the structure surface. Thus, reproducing the initial ice roughness accurately after droplets impingement is of great significance as well as the basis of subsequent study of multiphase heat transfer.
The numerical simulation of droplets impact and freeze process has been modeled and investigated with different methods,although the classic Messinger model for icing simulation does not consider the realistic physical details of flow on the ice layer. Some researchers adopted the lubrication equation based on the assumption of continuous and thin liquid film to model the film height, which is unable to consider the initial icing roughness.The global ‘‘equivalent sand grain roughness”whose height does not change with time and space was used to simulate effects of the surface roughness on the flow and heat transfer process.However, it still cannot reproduce different sizes of ice beads observed in experiments and does not applicable for rotorcraft, propeller and engine nacelle.Therefore, some other models must be developed to simulate the formation of initial roughness, such as the work initiated by Fortinand followed by Chang et al.,where the roughness prediction model was established after analyzing the forced characteristics of water for different forms of flow.In this research,a fixed-grid porous enthalpy method based on the improved Discrete Phase Model and Volume of Fluid(DPM-VOF) integrated algorithm is developed to solve the multiphase heat transfer problem during the icing process.
The VOF approach in the Eulerian framework could perfectly simulate the liquid water distribution, but the computational cost is extremely high. To balance the requirements of computation capacity and accuracy, an integrated DPMVOF algorithm is brought out to simulate the flow behavior of supercooled large droplets after impingement, which has shown some prospects in the field of two-phase flow simulation.Anez et al.focused on the unresolved interface and tested the model against realistic experimental data, indicating that computationally less demanding models with enough accurate are required in the industrial environment.Adeniyi et al.proposed an enhanced VOF technique to model the oil and gas flow inside an aero-engine bearing chamber,where the droplets were tracked in a Lagrangian framework and coupled to the Eulerian phases.Besides, Wang et al. adopted an Eulerianbased CFD module to simulate the flow field near the blade body as well as employed a Lagrangian-based VTM module to track the vortex in the far wake.In addition, a twophase Eulerian-Lagrangian method was employed in a numerical study on atomization characteristics and droplet distribution by Mohammadi and OmmiRen et al.solved the shear flow by the Eulerian method and tracked the motions of fuel droplets by the Lagrangian method when simulating the combustion characteristics in the scramjet combustor. All these studies show the efficiency and promising application of the integrated discrete and continuous phase simulation approach.
The fixed-grid enthalpy method has been widely used for liquid–solid phase change numerical simulations. Galione et al. implemented this method for explicit time schemes and collocated unstructured domain discretization, due to the interest in coupling phase-change formulations with turbulence models for liquid motion.Chen et al. developed a two-dimensional conduction-controlled model using the enthalpy method as well as performed the numerical simulation of the eutectic solution during the temperature dropping and freezing process.In addition, a fixed-grid-porousmedia method capable of simulating the growth and densification of frost sheets was presented by Bartrons et al.The velocity field was calculated across the entire domain,in which a porous media treatment was given to the ice-containing cells.The transported temperature and vapor density were used to define the thermophysical state of each cell, which might enable phase change.
An integrated fixed-grid enthalpy-DPM-VOF simulation algorithm extended from references is established in this study to simulate the formation of initial ice roughness and solve the multiphase heat transfer problem during this process. Firstly,the physical problem and the overall framework of the integrated algorithm are theoretically defined, and the governing equations of the models used are given.Secondly,the improvements in transformation criterion and reallocation of source terms are compared with a previous similar algorithm. Then the accuracy and reliability of the fixed-grid enthalpy method based on the improved algorithm are verified by two cases,namely two glycerine-solution droplets impact and single droplet freeze. Finally, the integrated algorithm is used to reproduce the growth of initial ice roughness on NACA0012 airfoil and the corresponding analysis of its effect on convective heat transfer characteristics is given.
2. Methodology
2.1. Algorithm framework
When aircraft flies through clouds with super-cooled liquid droplets,as described in FAR Part 25,29 and 33,droplets tend to impact the upstream-facing surfaces on the aircraft or engine. The droplets freeze completely immediately upon impact when the ambient air temperature is far below the freezing point. However, the latent heat of fusion will be released from the freezing water and warm the accreted ice to form thin wall film when there is high Liquid Water Content(LWC)and/or air temperatures only slightly below the freezing point.The unfrozen water film tends to run back along the surface under the shear force from outside airflow and may eventually freeze due to the continuous convective heat transfer to the ambient cold air.
According to the icing process mentioned above,the whole flow domain could be divided into two regions, the far-field region, where only droplets move, and the near-wall region,where ice accretes and film flows. The film flow and ice accretion process as well as the schematic of the computational domain is illustrated in Fig. 1. The theories of this algorithm,including the overall framework, the computational principles of DPM,VOF and fixed-grid enthalpy model are introduced in detail.
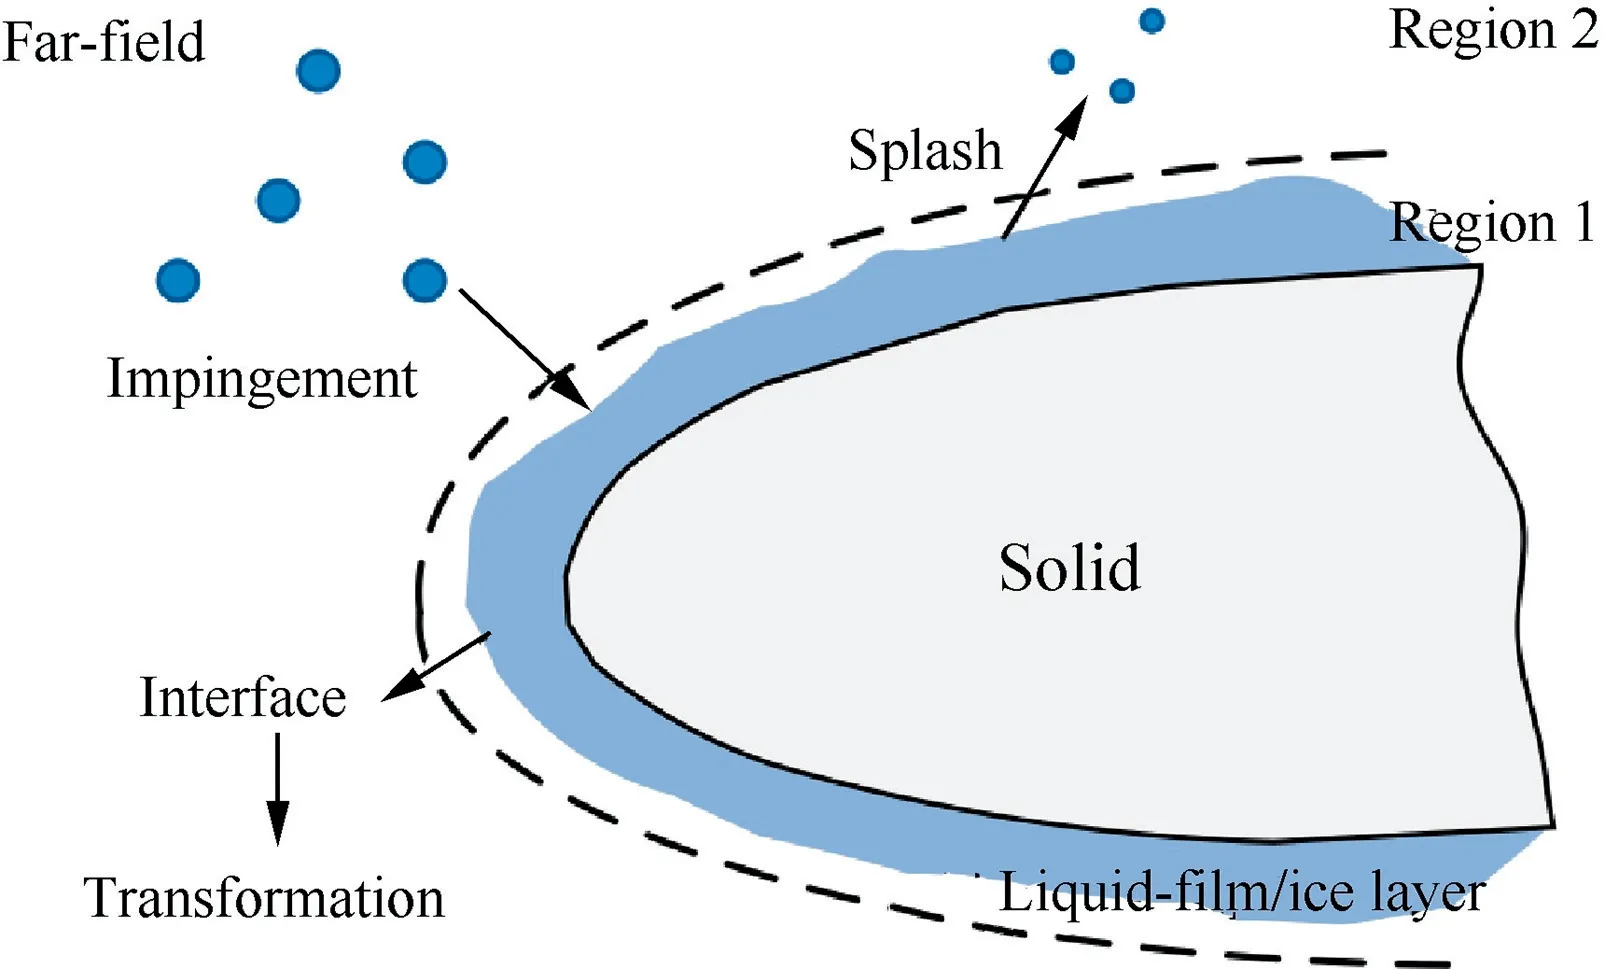
Fig. 1 Schematic diagram of computational domain.
A hybrid algorithm integrating DPM, VOF and fixed-grid enthalpy method is established to simulate all stages from the droplet initiation to the well-formed film to make the numerical simulation of icing more realistic and accurate (see Fig.2).For the droplet(the dispersed phase),once it is injected into the flow field, its trajectory is calculated in Lagrangian form and updated at each timestep of the unsteady flow calculation. When it impinges on the dry wall or film, its mass,momentum and energy will transfer into the water film.Then,the water film (the continuous phase) will be modelled using VOF method,where the advection equation for the liquid volume fraction is formulated in volume of fluid form using the Compressive Interface Capturing Scheme for Arbitrary Meshes (CICSAM). The simulation of phase change and heat transfer during the icing process and the reproduction of icing roughness can be achieved by fixed-grid enthalpy method,after which the characteristic of icing roughness can be extracted to explore its influence on the flow and heat transfer of airflow. The multiphase calculation is carried out with FLUENT pressure-based solver using the implicit body force treatment to account for the surface tension term.
2.2. Governing equations
2.2.1. Governing equations for discrete phase
Considering the smaller volume of fraction and larger density of droplets in icing conditions, several assumptions are made as follows:

where Uand Dare velocity and actual diameter of single droplet, respectively; u and ρ are velocity and density of air,respectively; t is time; μ is coefficient of dynamic viscosity; g is acceleration of gravity;Cis drag coefficient;Re is Reynolds number;ρis density of liquid;A,c,mand Tare superficial area, specific heat, mass and temperature of droplet, respectively;his convective heat transfer coefficient;his latent heat of evaporation; Tis temperature of air around the droplet.
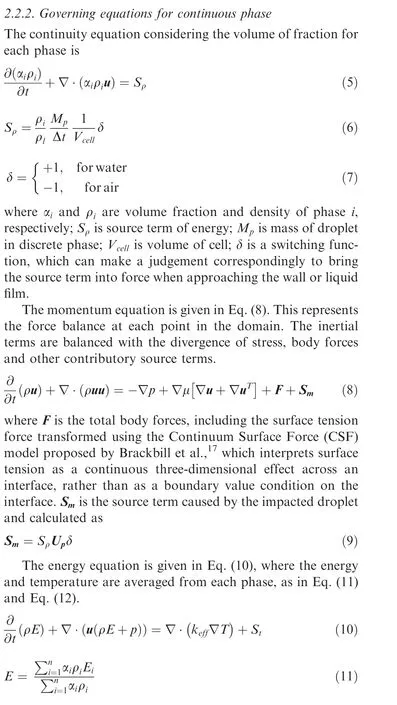

Fig. 2 Overall flowchart of integrated algorithm.
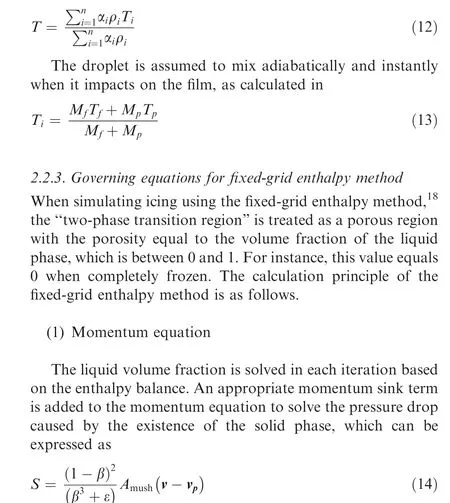
where β is the liquid volume fraction,ε takes a minimum value(such as 0.001)to prevent the denominator from being 0.Ais a constant used to measure the attenuation amplitude of transition area, and the larger the value is, the more severe the speed change caused by freezing is.
(2) Turbulence equation
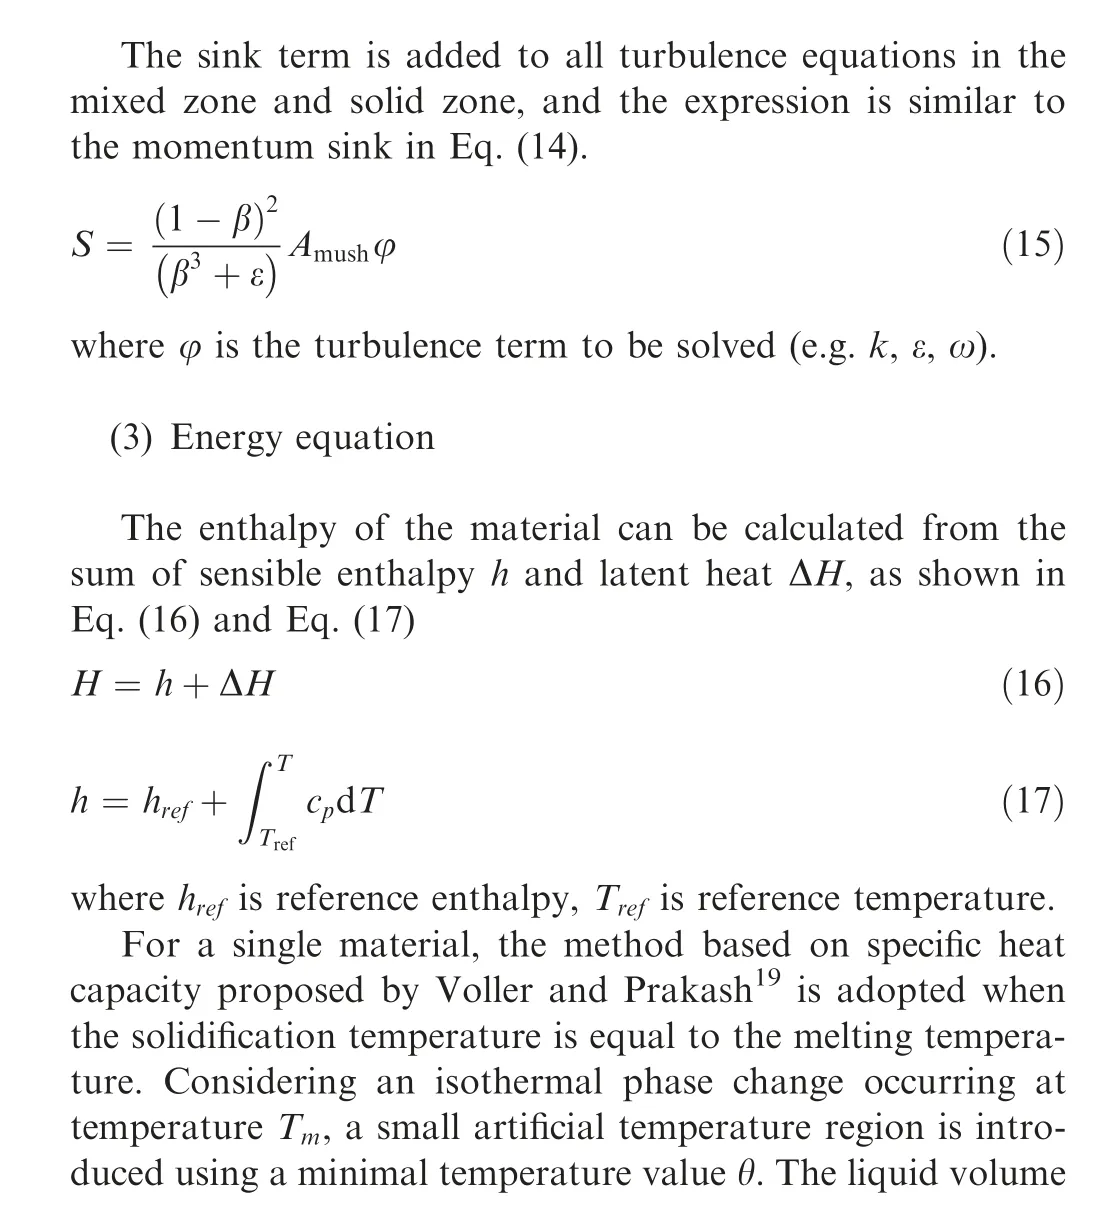
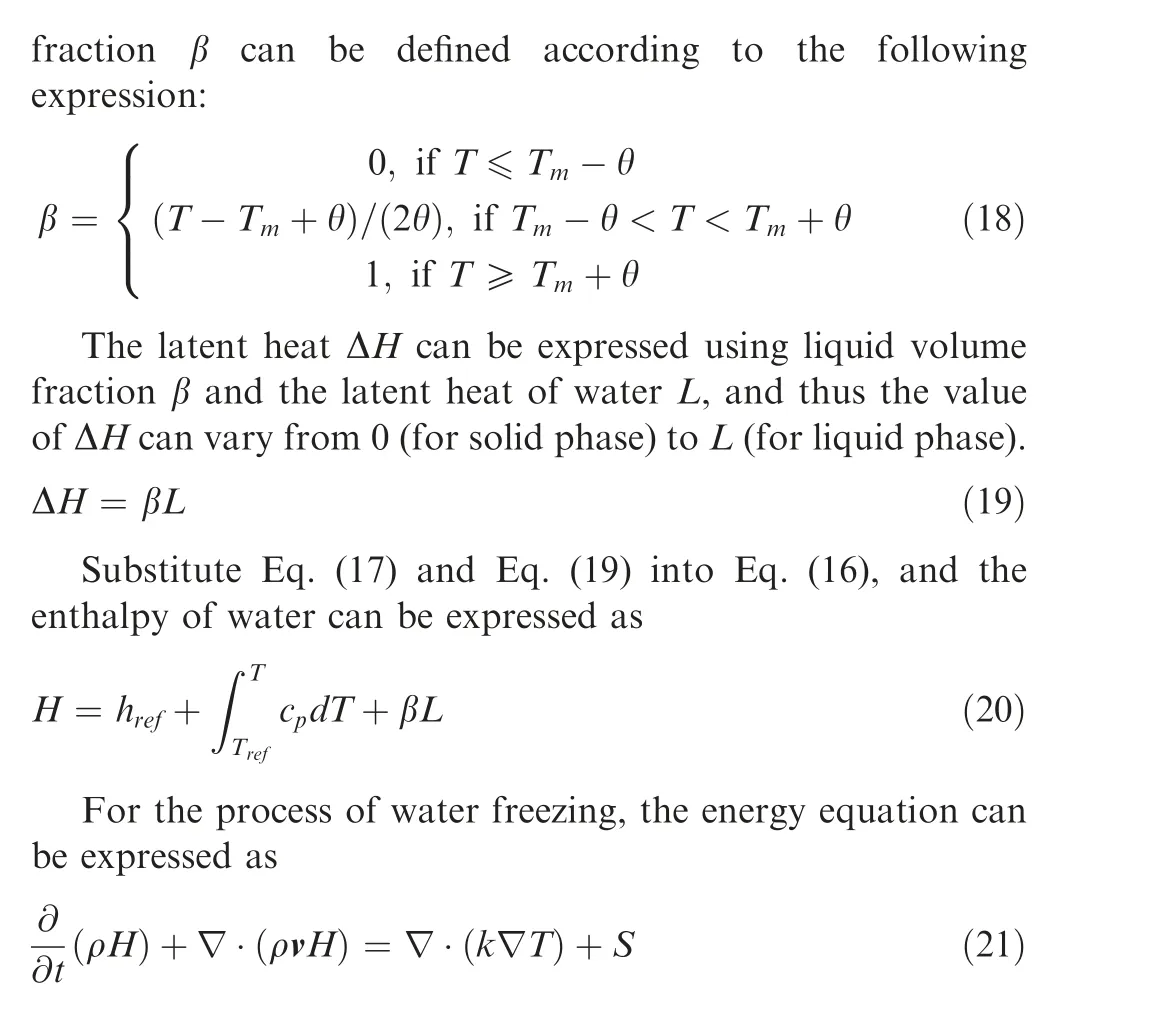
where v is velocity of fluid, and S is source term.
Essentially,the solution of temperature is actually an iteration between Eq. (18) for the liquid volume fraction and the energy equation expressed by Eq. (21).
2.3. Improvement and implementation
Compared with previous integrated discrete and continuous phases simulation methods presented by other researchers,the DPM-VOF approach in this coupled algorithm has been improved in the following two aspects.
2.3.1. Transformation criterion
The transformation from the droplet into film needs to be activated as soon as the particle impacts the wall or the free interface. In previous researches, the criterion of transformation uses the center position of the droplet(P)to judge the relative relationship between the particle and the interface,which leads to transformation delay because the bottom half of the particle has already immerged into the interface.
In this study, as shown in Fig. 3, Pis the lower-boundary point of the spherical droplet along with its velocity(U)direction. The criterion for initiating the transformation is thus improved, using Pto judge the relative position between the interface and the droplet needed to be converted.

Fig. 3 Relative position of judgement.
Cells are searched layer by layer from the wall boundary along the normal direction until the liquid volume fraction in the current cell is less than the critical value. These cells will be marked as the interface of gas–liquid phases, of which the corresponding liquid film thickness will be stored. When Penters the marked region,the transformation will be activated.The main logic of the implementation is shown in Fig. 4.
2.3.2. Reallocation of source terms
The mass and momentum of the incoming droplet will be reallocated into the cells in terms of liquid volume fraction, as the source terms in Eq. (5) and Eq. (8). The initial value of such reallocation of liquid volume fraction will affect the iterative efficiency of subsequent VOF process.
The search scope Ris defined here as the radius of the spherical droplet extending out half of the maximum distance of the cell in three directions,taking the center of the droplet as the center of searching,which can be expressed as Eq.(22)and demonstrated in Fig. 5.
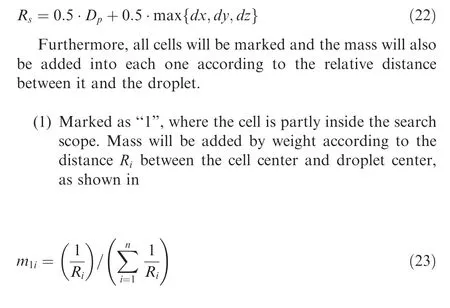
(2) Marked as‘‘2”,where the cell is totally inside the search scope. The mass will be added into such cells according to the mass source item and the volume of the current cell.
The total mass added to all cells of these two kinds should satisfy the mass conservation relationship during transformation.All the other cells completely outside the search scope will be marked as ‘‘0”, into which mass will not be added.
A sample of a marked droplet is shown in Fig. 6.
3. Verification
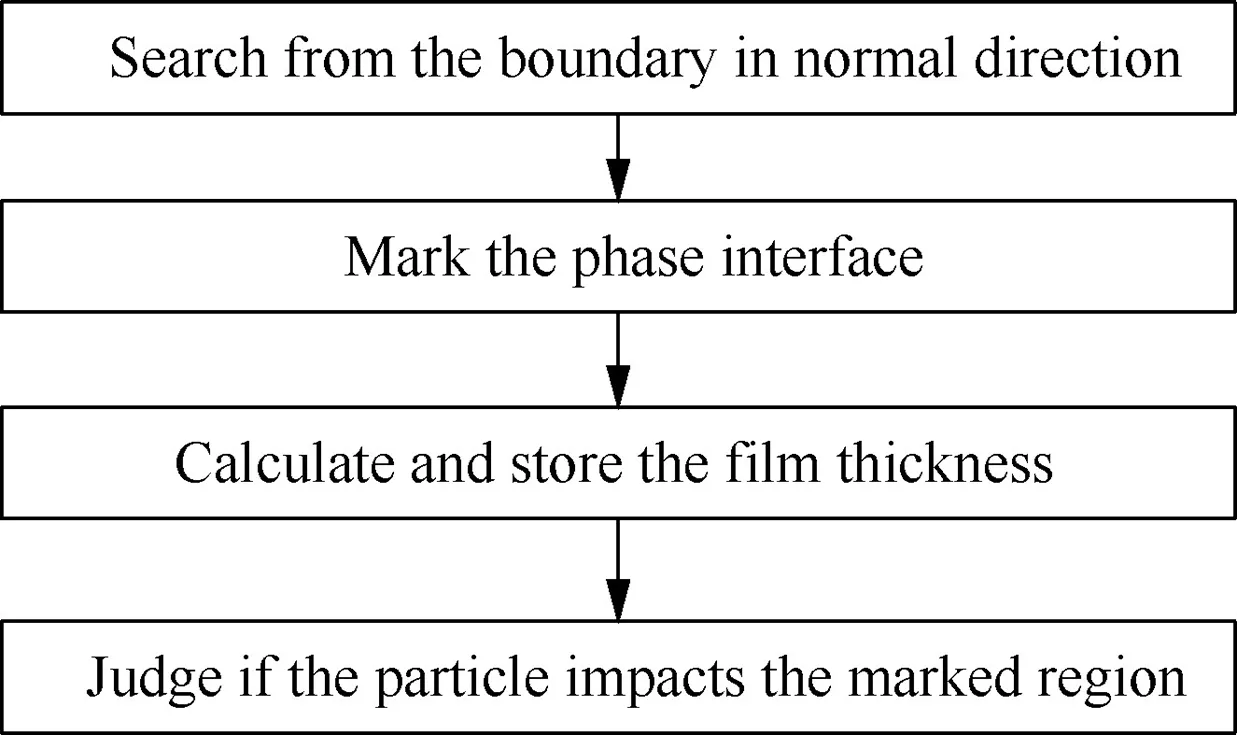
Fig. 4 DPM-VOF transformation.
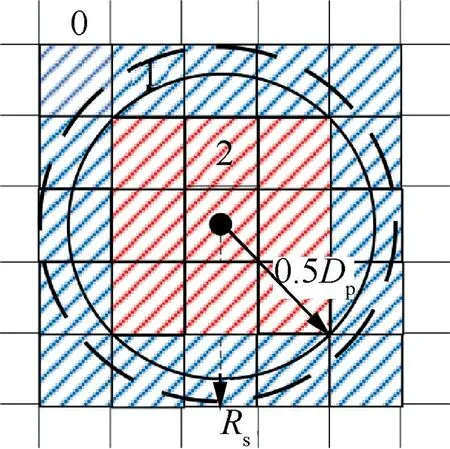
Fig. 5 Demonstration of search scope and cell marking in 2D.
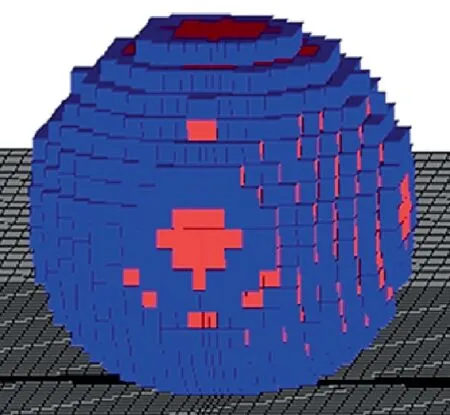
Fig. 6 Sample of marked drop in 3D.
Some simulations of droplets impact and freeze are conducted to verify step by step that the hybrid algorithm is effective and applicable to simulate the droplet initiation and icing process,especially the mass conservation during the transformation from DPM into VOF and the flow behavior after the transformation.
Compared with the Eulerian-Eulerian algorithm in high precision, the integrated algorithm is not demanding on the quality of the grid. To be more specific, the droplet in the far-field region is treated as spherical particles whose shape does not change with motion. It is only necessary to densify the mesh in the near-wall region where the transformation occurs to obtain a good capture of the gas–liquid phases interface. And the total calculation time could be shortened by at least one order of magnitude. The time step is limited to 10to keep the Courant number less than 1.The convergence criterion set for all the equations is 10.
3.1. Impact of two large droplets
87% glycerine-in-water solution droplets impacting on a flat plate are simulated and compared with the experiment done by Dalili et al.As shown in Fig. 7(a), the first droplet is injected 3 mm above the center of the bottom plate, whose diameter and impacting velocity are 3.4 mm and 1.1 m/s,respectively.The grid is encrypted according to the exponential law, especially refined in the area where the droplet may spread.Three densities are used for grid independence verification,as shown in Fig.7(b),where the profiles in each condition are compared.The grid with 691,200 cells is selected considering the accuracy and time of calculation comprehensively.The stable shape is obtained under the condition that the wall static contact angle is 60°,as illustrated in Fig.7(c).The mass of the converted droplet is 2.542×10kg, the relative error of which is less than 0.489% given that the mass of the injected particle is 2.529×10kg.
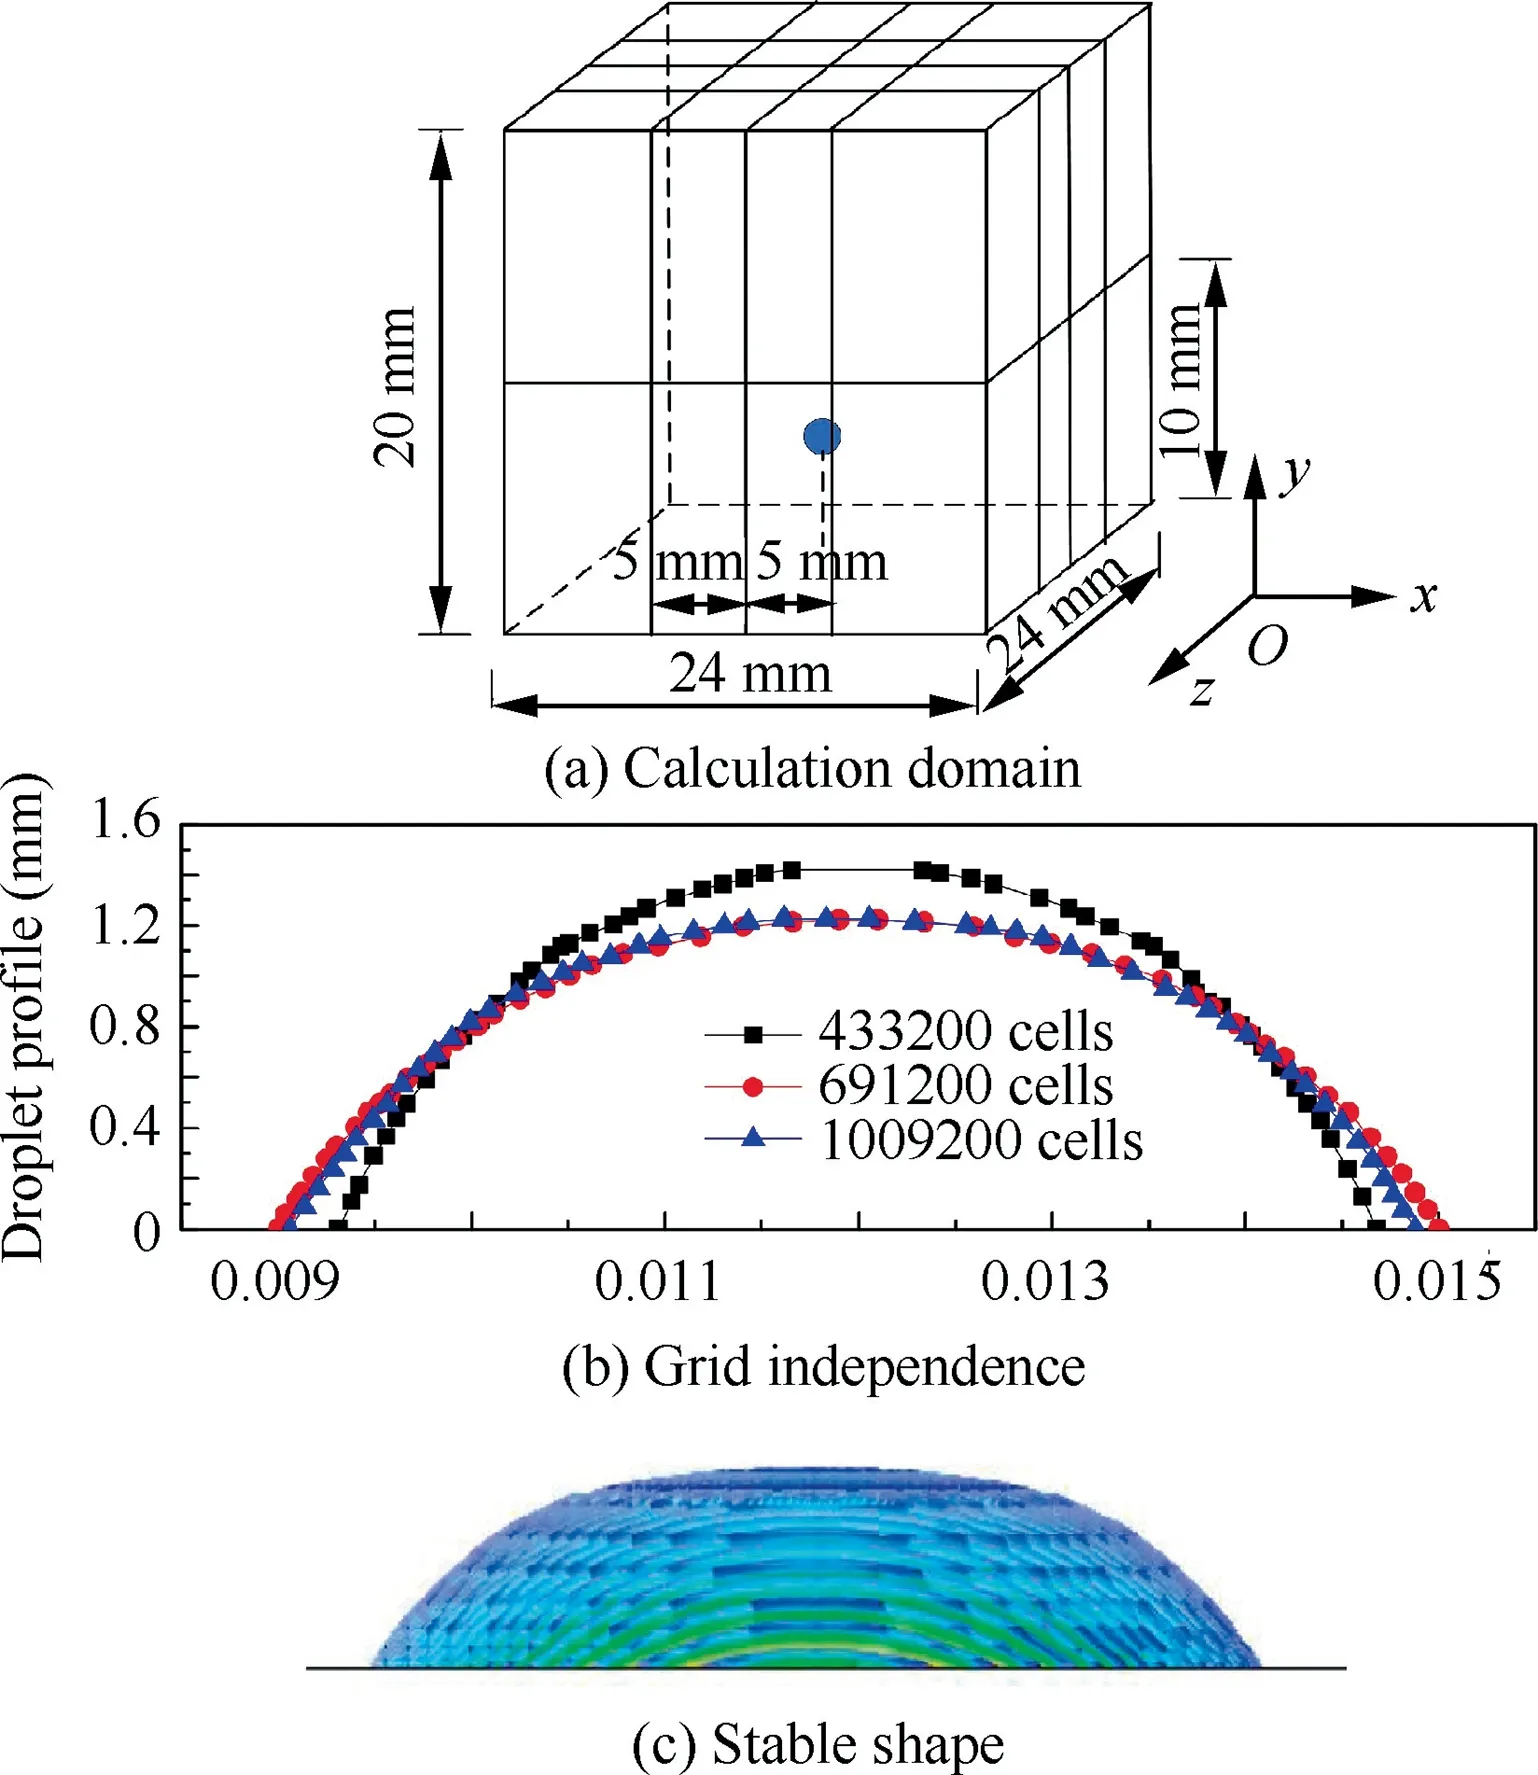
Fig. 7 First glycerine droplet impact on a flat plane.
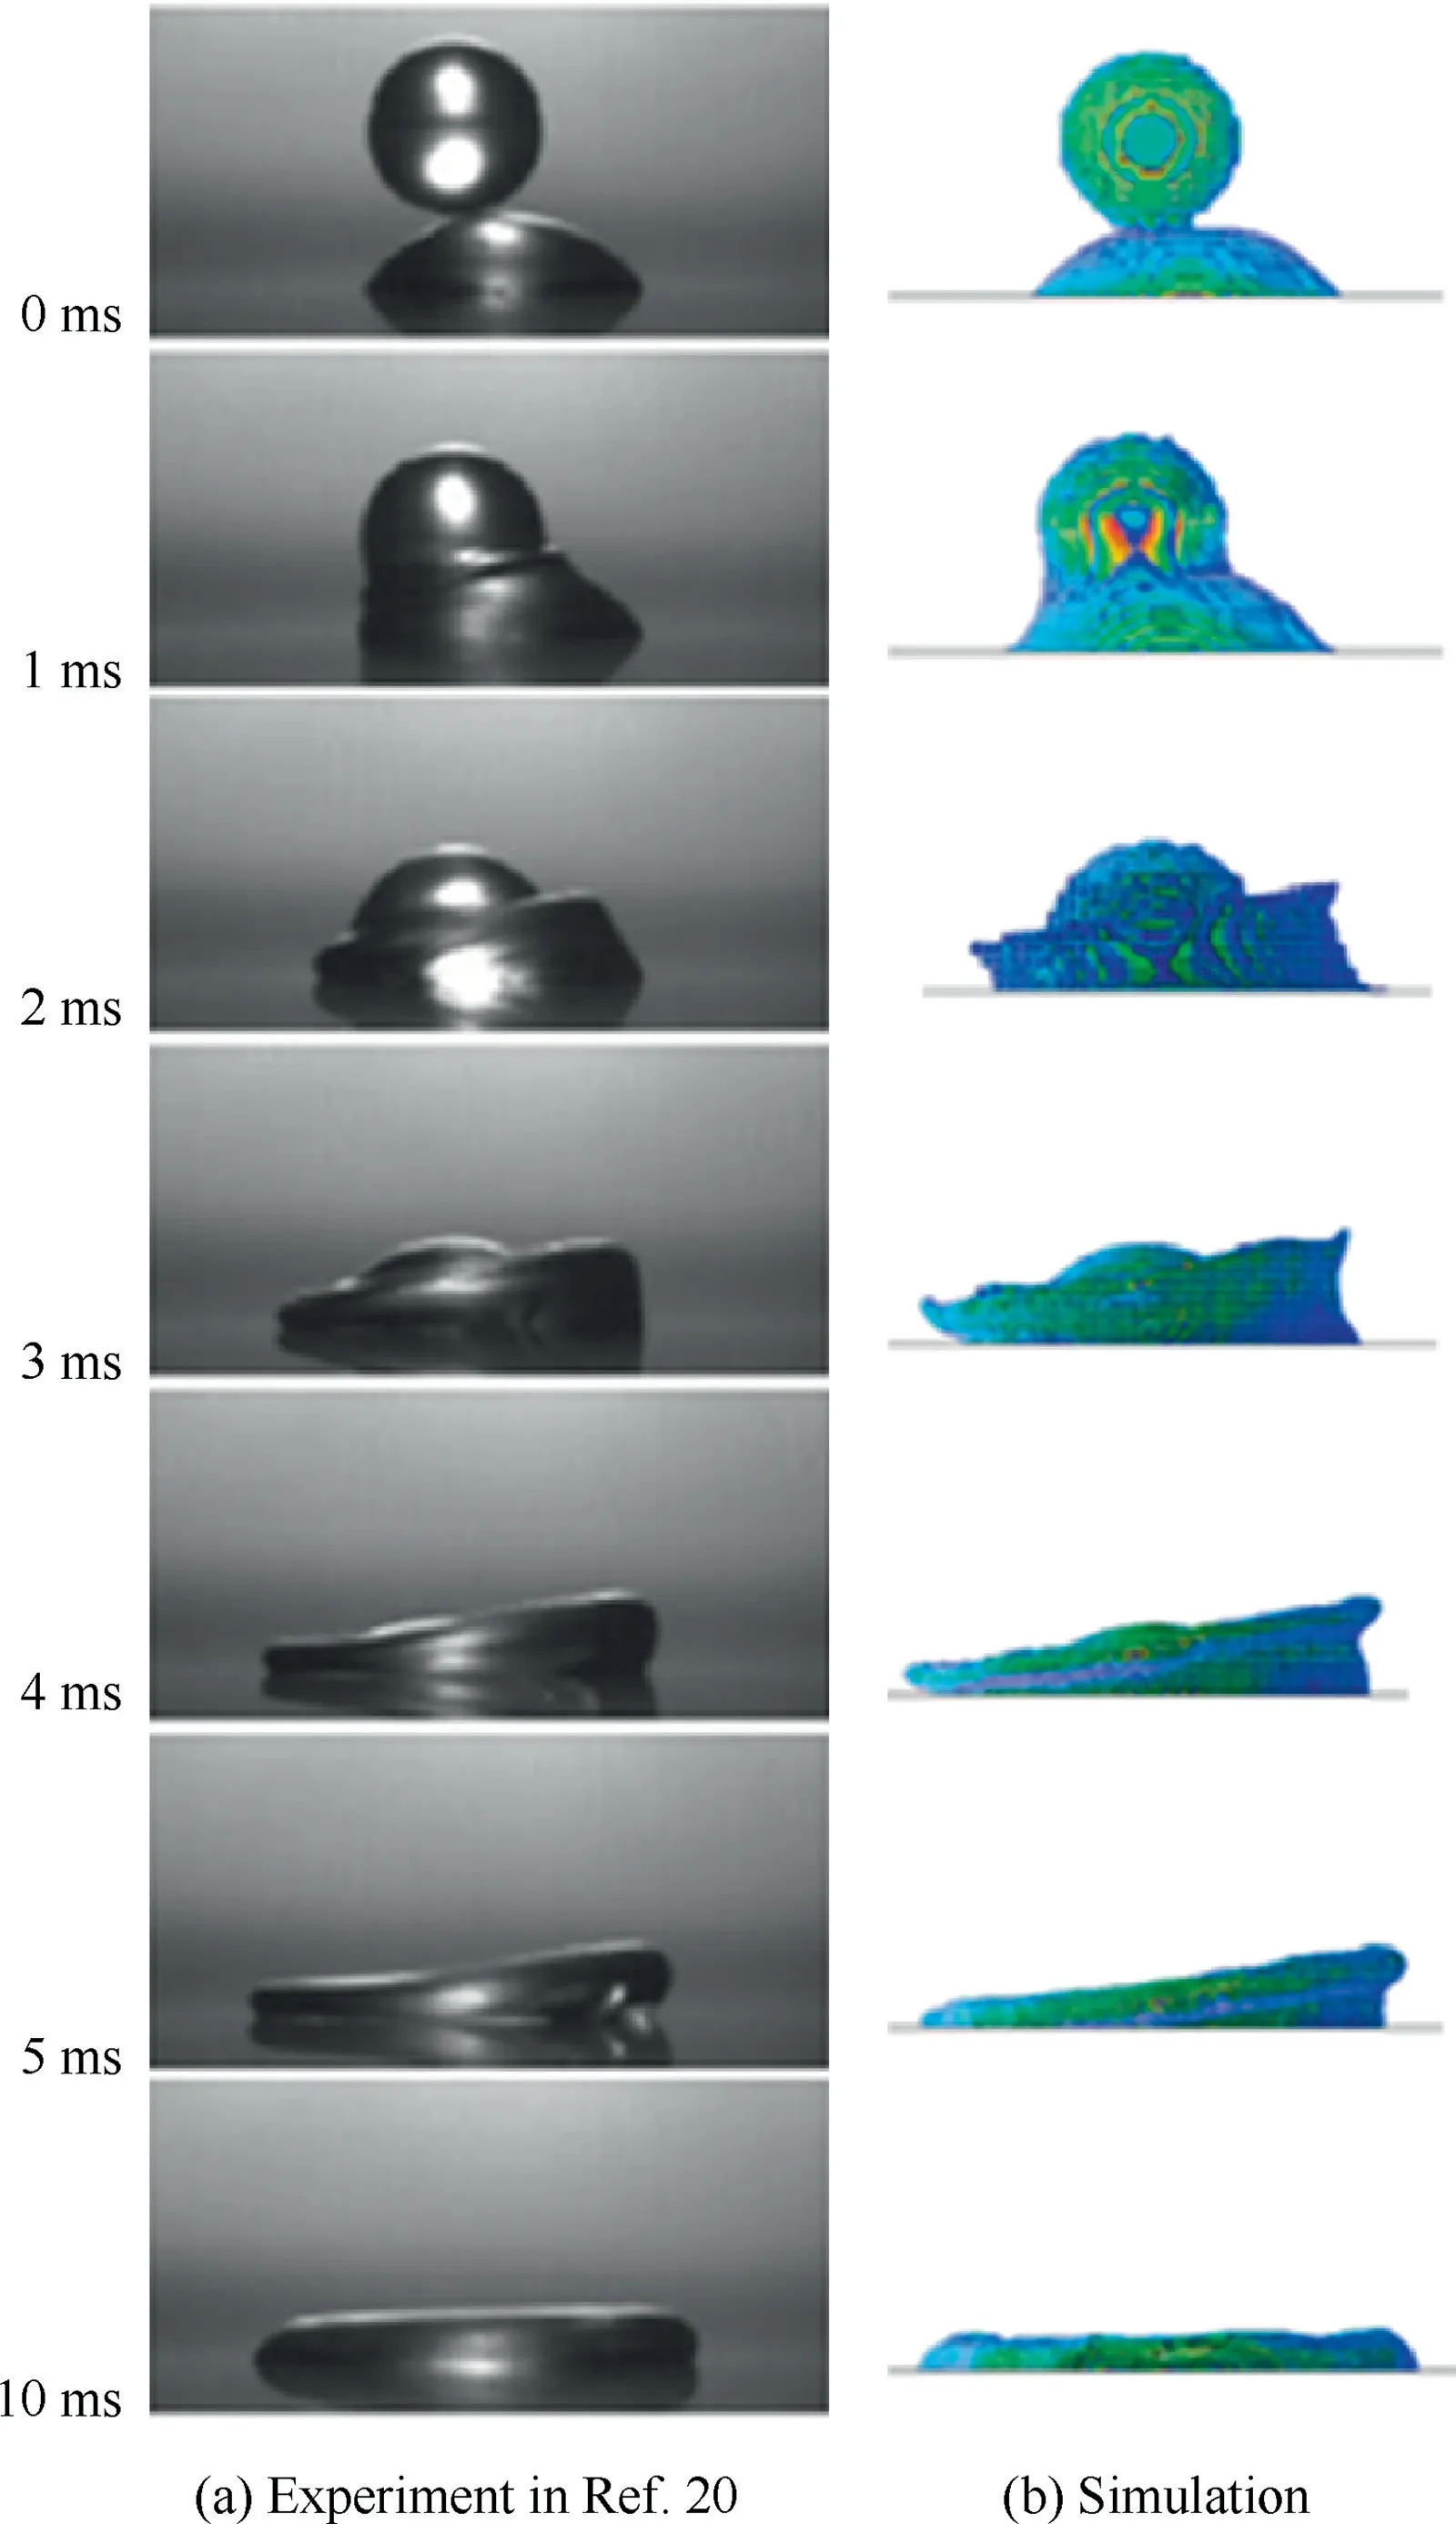
Fig. 8 Flow behavior after impact.
The second droplet is then injected at a distance of 0.73 mm shifted in x direction from the first one. The flow behavior after contact is recorded and compared with the experimental results as shown in Fig.8,where the colourmap in Blue Green and Red(BGR)format changes from blue to red when the liquid volume fraction increases from 0.5 to 1.
It can be seen from Fig.8 that at 0 ms,the lower surface of the second droplet just comes into contact with the upper edge of the first one, and both of them maintain their own original shape. As the second drop falls and sinks into the first one, a slanted bulging contact line appears, and gradually spreads around, thus forming a circular table with a lower left side and a higher right side. After 10 ms, the two droplets completely merge to form a pancake. All of the aforementioned details are well captured by the DPM-VOF coupled algorithm used in this paper as well as match well with the experimental results. Thus, a conclusion can be drawn that the algorithm is accurate enough to simulate the droplet growth and deformation, and can be used to simulate the multiphase flow in the next step.
3.2. Freeze of single droplet
In this section,‘‘a single droplet impacts and freezes on a cold flat plate” is used as the verification case, and the fixed-grid enthalpy method is used for the numerical calculation to simulate the corresponding freezing of liquid water. The results are compared with the experiment observed in Ref.21 to verify the accuracy of the algorithm to lay the foundation for the subsequent simulation of initial icing roughness.
For better comparison, a water droplet with a diameter of 800 μm and temperature of 20.5°C is taken as the research object, which is consistent with the experiment. It drops vertically down onto the-2°C aluminum plate.The contact angle between the droplet and the plate is set as 75°. According to estimation of the shape of the spreading droplet, a 0∙021m×0∙021m×0∙0055m cube is selected as the calculation domain, and the spreading area is locally encrypted to better capture the shape of the phase-interface.
The results of numerical simulation using the fixed-grid enthalpy method are compared with the photos taken in the experiment. The phase and temperature T change during the freezing process are shown in Fig. 9 and Fig. 10. The upper black and white picture is the experimental result, and the lower contour is the CFD result. In addition, the dashed line box is the cross-sectional view of the spherical liquid in the solid line box.
It can be seen from Fig. 9 that the water droplet stabilizes into a spherical shape after falling on the cold plate, where the colourmap in BGR format changes from blue to red when the liquid fraction increases from 0.1 to 1.0. Since the lower surface of the droplet is in contact with the aluminum plate under water frozen point, it gradually freezes from bottom to top. The solid–liquid phase-interface is not obvious at 0.5 s.Due to the disturbance on the upper part of the droplet,a small amount of scattered liquid water begins to transform into a solid state.
This phenomenon is particularly obvious in Fig. 10, where the colourmap in BGR format changes from red to blue when the temperature decreases from 24°C to 0°C.The temperature contour at 0.5 s illustrates that the temperature distribution inside the droplet is extremely uneven just after impact. As the heat further dissipates outside, obvious solid–liquid stratification has occurred at 5.0 s, and the ice front is approximately at the lower 1/3 to 1/2 height of the droplet. At 20.0 s, the ice front moved up to the upper 1/3 height.
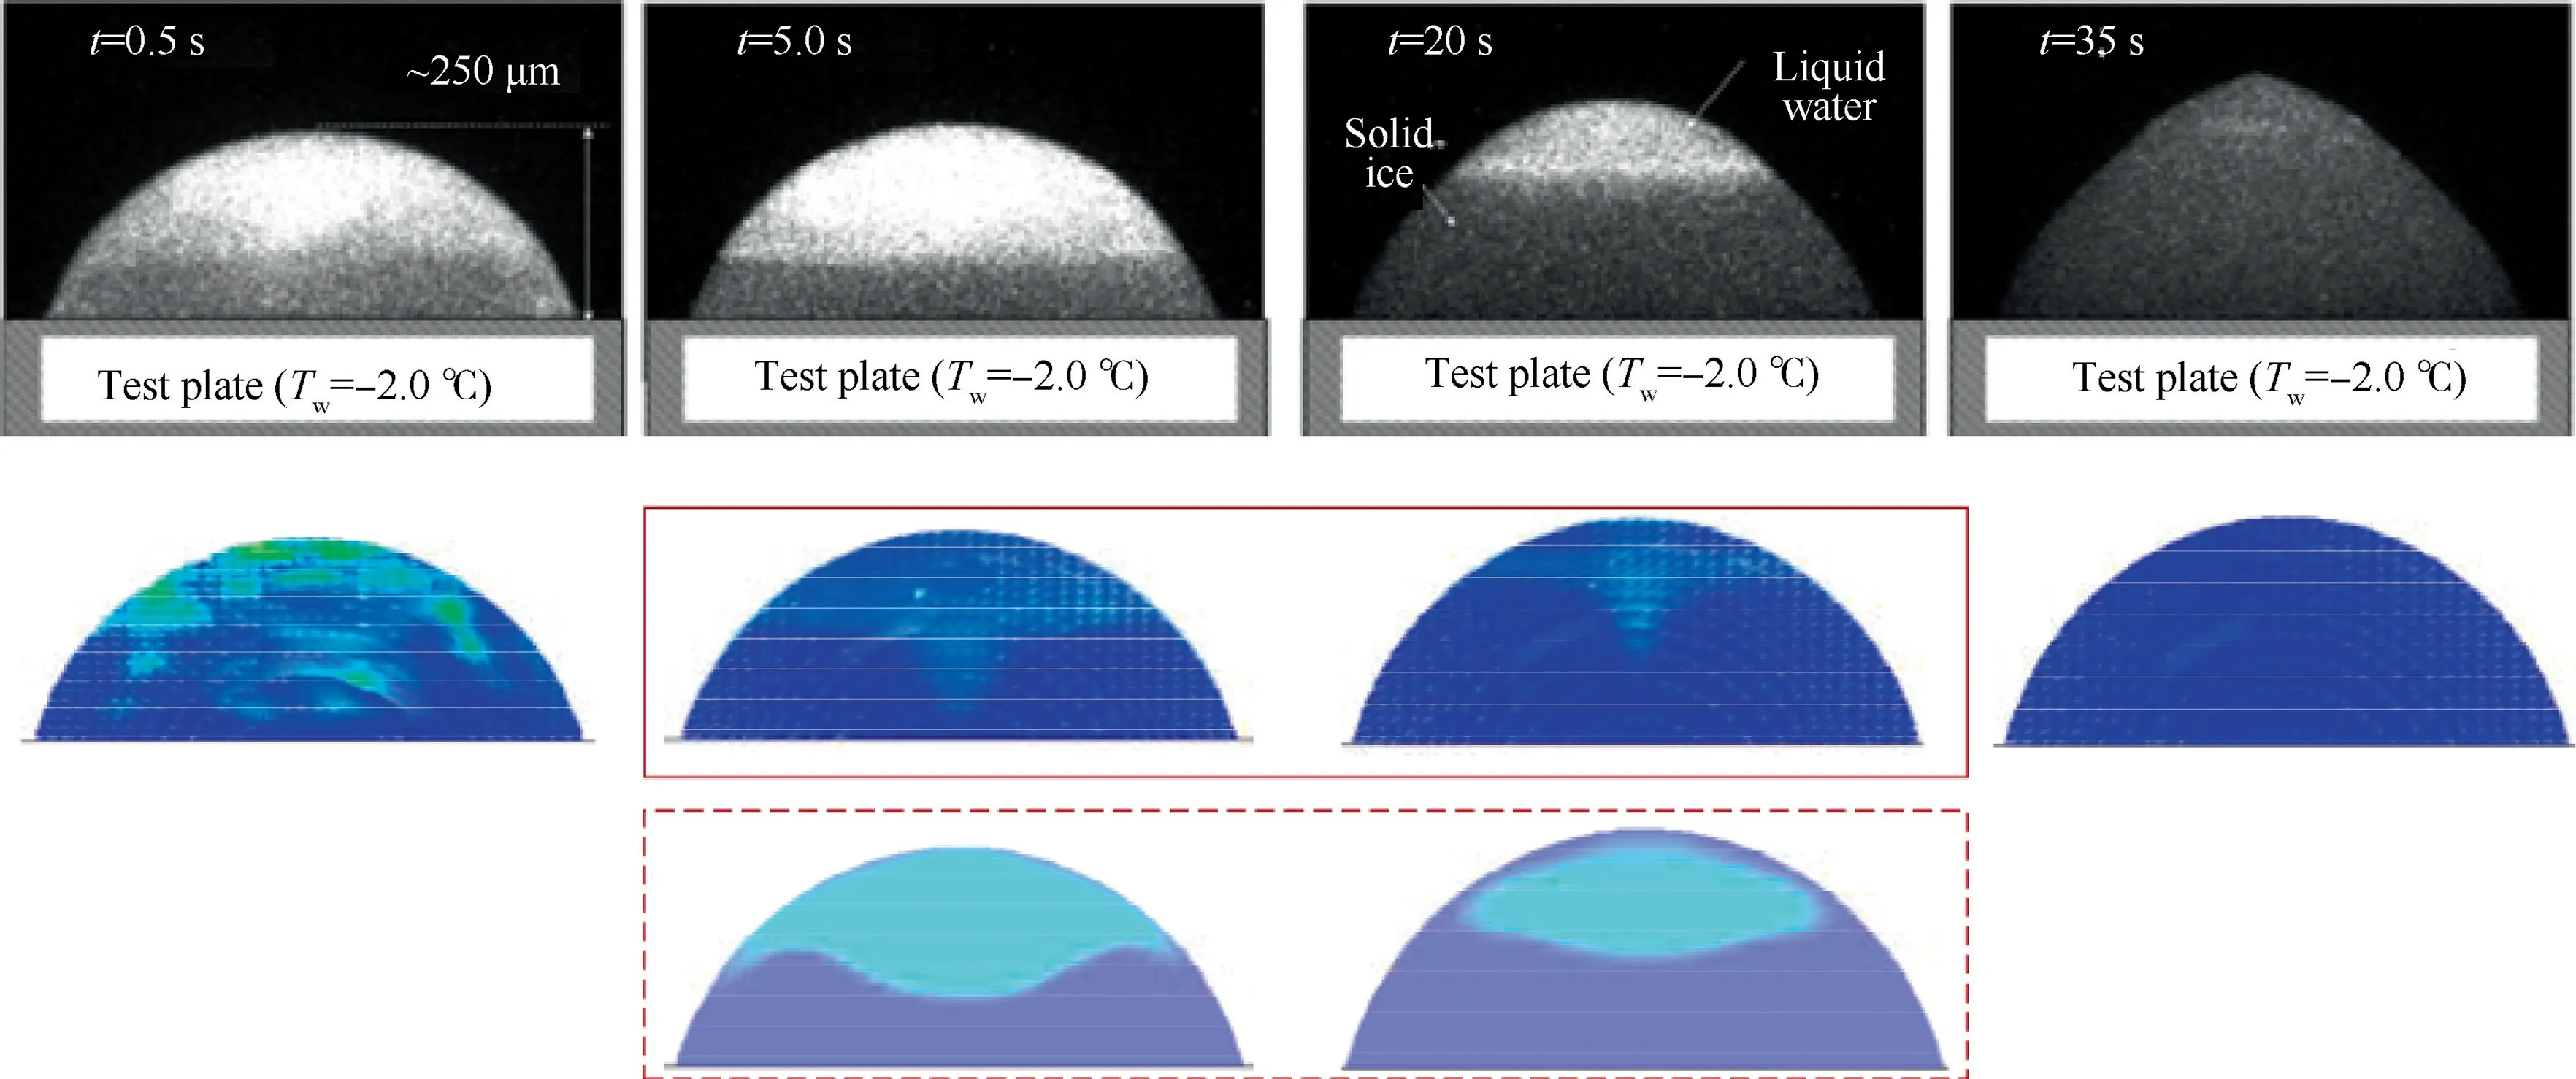
Fig. 9 Comparison of phase change of simulation results and experiment.
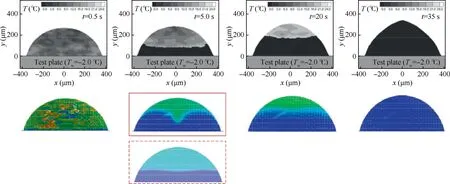
Fig. 10 Comparison of temperature change of simulation results and experiment.
The phosphorescent marking was used in the experiment to observe the inside of the droplet. To facilitate comparison, a symmetrical section of the droplet on the xoy plane is made to further observe the internal phase change and temperature distribution, as shown in the dashed box in Fig. 9 and Fig. 10. It can be found that the movement of the ice front inside the droplet is basically consistent with the experiment.Besides that, the temperature of lower 1/3 droplet has fallen to the freezing point at 5.0 s, while the upper keeps a higher temperature because it does not directly exchange heat with the cold bottom surface, and still maintains a liquid state.The situation is similar at 20.0 s. After 35.0 s, the whole droplet was frozen into opaque ice, and the overall temperature dropped below 0°C.
It is found that the numerical simulation results are basically consistent with the experimental observations, indicating the effectiveness of the fixed-grid enthalpy method in simulating the icing process of water droplets and can be used to simulate the subsequent icing roughness formation.
However, some reasons may contribute to the difference between simulation and experiment. Firstly, the ratio of the computational domain to the droplet size is about 26 to control the mesh size, which is much smaller than that in the experiment. Therefore, the existence of solid walls will affect the flow and distribution of airflow in the calculation domain.The bottom cold air affected by the cold aluminum plate flows along the wall to the center, and exchanges heat further with the outer surface of the droplet, leading to the fact that the outer surface slightly freezes while the inside is still in a liquid state. Secondly, the effect of surface tension and density variation make the frozen droplet form a small tip on the top of surface, as shown in the experimental results in Fig. 9 and Fig. 10, while they were not considered in the current simulation to reduce the calculation time.
4. Numerical simulation and analysis of initial ice roughness
4.1. Numerical simulation
In order to explore the distribution characteristics of the initial icing roughness and its influence on the heat transfer process,the integrated fixed-grid enthalpy DPM-VOF algorithm, as verified in Section 3,is used to numerically simulate the initial icing process from droplets impact to form ice particles.
4.1.1. Boundary conditions and parameter setting
The wing using NACA0012 airfoil with a 0°angle of attack,a chord length of 0.15 m and a spanwise width of 0.01 m is modeled, where three-dimensional computational domain and mesh are shown in Fig.11.The grid size near the wall is equivalent to the size of droplets and is settled according to the exponential law in the normal direction and chordwise direction.Due to the almost even distribution of droplets in z direction, the number of nodes is set as 101 in spanwise direction evenly. Therefore, 2.64 million cells are used here.
To simulate the super-cooled large droplets impingement with environment temperatures of 253.15 K and 263.15 K,particles with a diameter of 2×10m are released 1 m distance from the leading edge in x direction,with an initial velocity of 20 m/s and temperature the same as the environment.The particles which interact with the continuous phase are injected in an array at a particle time step Δt=1×10and the total flow rate is set as 5.0175×10kg/s according to the parameters aforementioned. The surface temperature is consistent with the ambient temperature.Other boundary conditions are listed in Table 1.The calculation time step is set to 5×10s.
4.1.2. Calculation results
In the icing experimentof the same size airfoil,the formation of ice particles on the front edge can be observed within 100 s when the Liquid Water Content (LWC) is about 1 g/mand the diameter of the droplet is about 10m. In this research,the LWC is set as 2 g/mand the large droplet with a diameter of 200 μm is used. Therefore, the obvious influence of initial icing on surface roughness can be observed in the order of 10s.
The numerical simulation results of ice particles on the surface within 3 ms when the ambient temperature Tis 253.15 K and 263.15 K are shown in Fig. 12, where the colourmap in BGR format changes from blue to red when the dimensionless liquid fraction increases from 0.1 to 1.0.
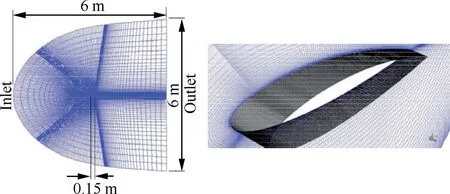
Fig. 11 Calculation domain and grid.
It is illustrated by the longitudinal comparison of Fig.12 at different time that ice particles mainly scattered on the foremost edge of the wing when icing started. As time increases,the coverage of ice also increases. Lots of supercooled water droplets impact at a similar position,leading to the local accumulation of ice particles and the increase of surface roughness.
The influence of different ambient temperatures on the extent of icing can be obtained by the horizontal comparison of Fig.12.At the same time,both the coverage and the roughness of icing on the surface when the ambient temperature is 263.15 K are larger than those of 253.15 K. The reasons are as follows. First, when the ambient temperature is higher,the released latent heat lost to the air through convective heat transfer during the phase change process is less, and thus a higher proportion of heat can be used to melt the ice on the surface.Therefore,the water in the adjacent areas is connected to each other and continues to freeze during the flow process.The ice roughness increases when the melted water flows onto the frozen particles and refreezes. Second, the density of ice decreases when the temperature goes higher, leading to the increase of the volume of ice particles. This phenomenon is consistent with the result of Chang’s research,which draws a conclusion that the maximum icing roughness decreases as the ambient temperature decreases.
4.2. Analysis
4.2.1. Distribution characteristics of initial ice roughness
From the calculation results of the ambient temperature of 253.15 K and 263.15 K,it can be found that due to the characteristic that the supercooled water droplet itself‘‘cannot maintain a liquid state after being disturbed”,it freezes immediately after impacting on the airfoil surface, and the released latent heat will cause partial fusion of ice particles to form backflow.
The airfoil is flattened to further compare the icing roughness distribution of the upper and lower surface after freezing for 3 ms, regarding the stagnation point of the airfoil as the zero position, and the upper and lower airfoil coordinates are set positive and negative respectively.Taking the characteristic line at the middle position in z direction when the ambient temperature is 253.15 K as an example, the local condition within the front 10% chord length range, which can be observed obviously, is shown in Fig. 13. The overall distribution of initial icing roughness can be divided into three regions:(A) the roughness of the ‘‘platform” around the zero point is relatively low and the change is relatively insignificant. (B)The roughness value rises sharply along the downstream direction of the ‘‘platform” on both sides; then in the range of about 0.012 m (8% chord length), the roughness gradually decreases as the distance from the stagnation point increases.The surface roughness is the most obvious in this area. (C)The roughness is extremely small,and the surface of the structure returns to its normal state without freezing. These three regions correspond to 1, 2, 3 in Fig. 13.
In addition,the overall distribution rules and regional divisions on both sides are similar,but the specific icing roughness distributions on the upper and lower surfaces are not completely symmetrical. There are many factors that may cause this phenomenon, such as the combined effect of gravity, airflow, surface tension, the randomness of the distribution of water droplets, and the difference in the ‘‘original roughness”of the structure due to other factors such as materials or manufacturing.This in turn causes differences in the flow of supercooled water droplets.

Table 1 Boundary conditions.
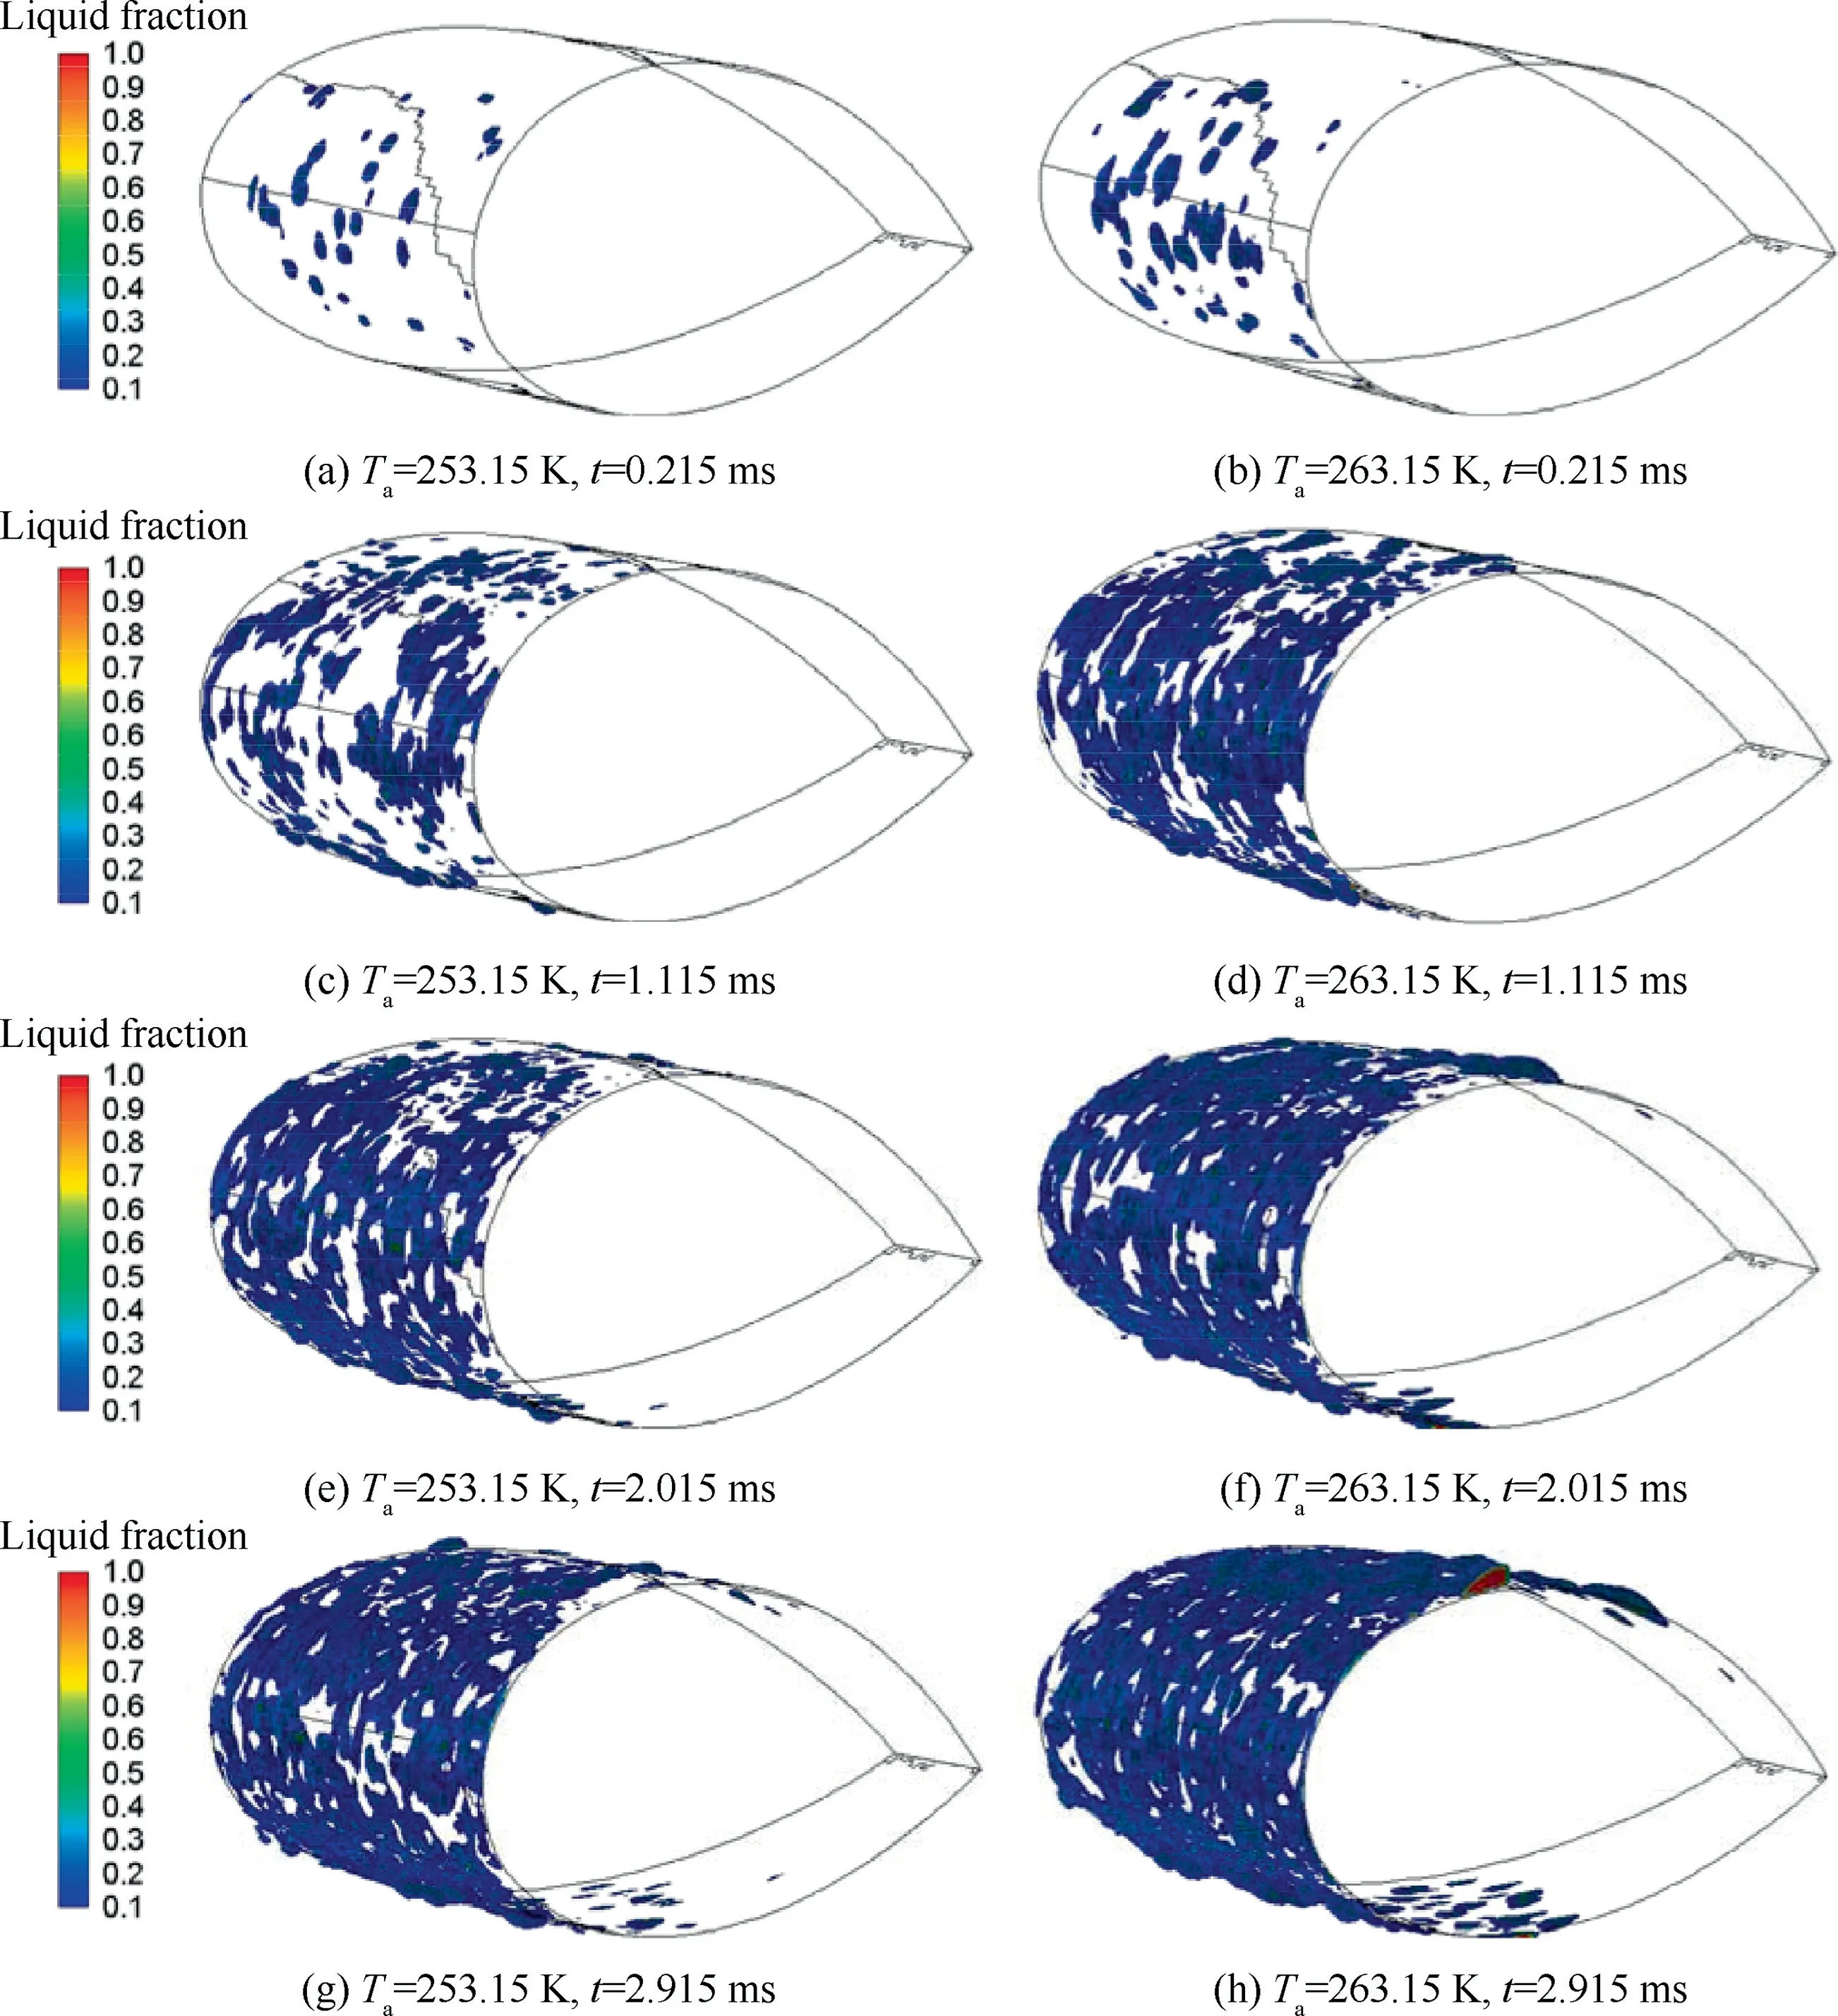
Fig. 12 Numerical simulation results of ice distribution.
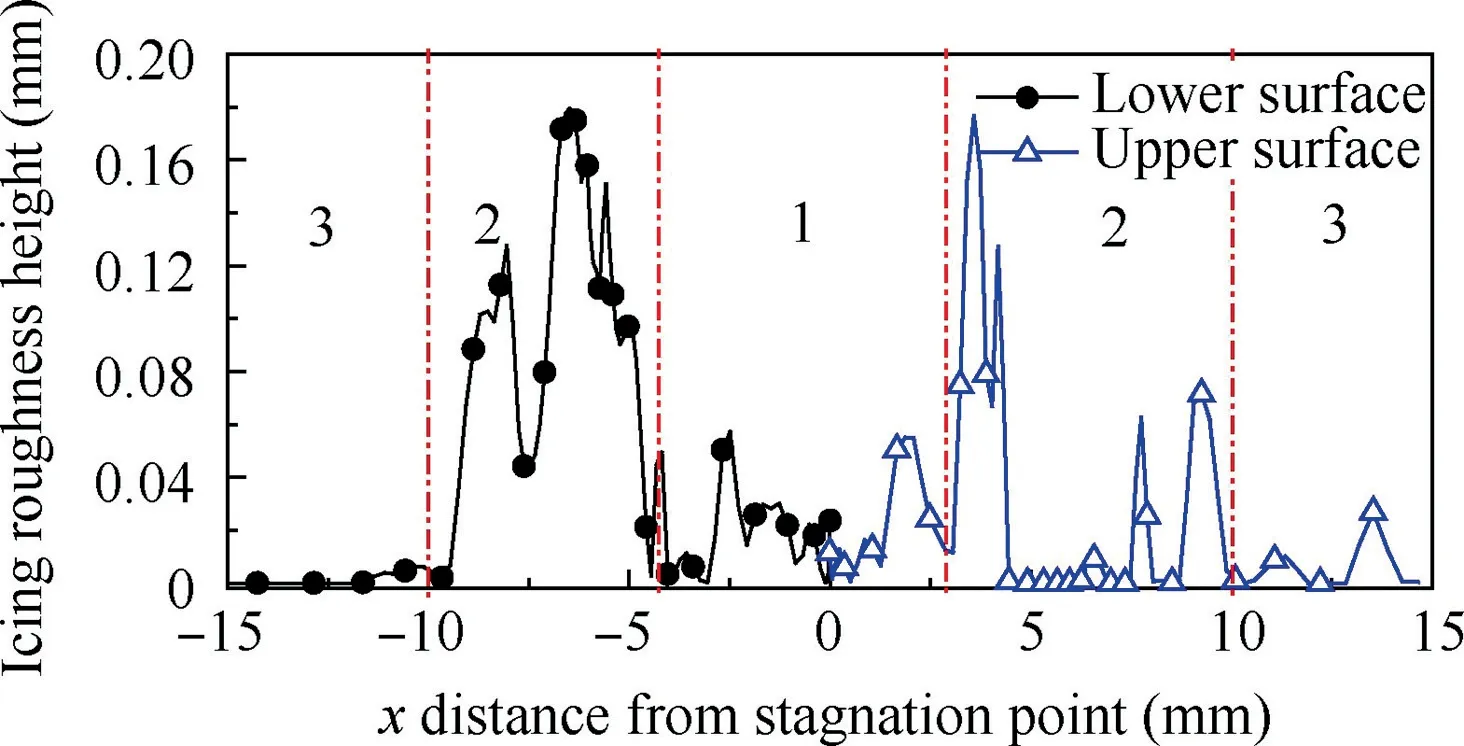
Fig. 13 Local distribution of icing roughness within front 10%chord length range.
To better demonstrate the distribution characteristics, a three-dimensional height map of the icing roughness height of the upper surface leading edge is shown in Fig. 14. It can be seen that, there is an area with obvious roughness downstream of the stagnation point and it decreases gradually in chordwise direction and staggers in spanwise direction.
Furthermore, some assessment parameters of roughness at different time are statistically given in Table 2, including the arithmetic average roughness R, the maximum height of the profile Rand the ten points height irregularities R, which indicate that the accumulation of ice particles increases with the development of icing process.

Fig. 14 Icing roughness distribution of upper surface within front 20% chord length range.

Table 2 Assessment parameters.
4.2.2. Effects of initial ice roughness on heat transfer process
The formation of icing roughness can obviously affect the flow patterns of airflow. For instance, there is mixing between gas molecules at different temperatures in the turbulent zone due to icing roughness, which increases the heat transfer rate,and thereby enhances the convective heat transfer between the surface and the surrounding airflow. Moreover, the convective heat transfer coefficient also determines the amount of energy contained in each physical process such as friction,evaporation, and sublimation.
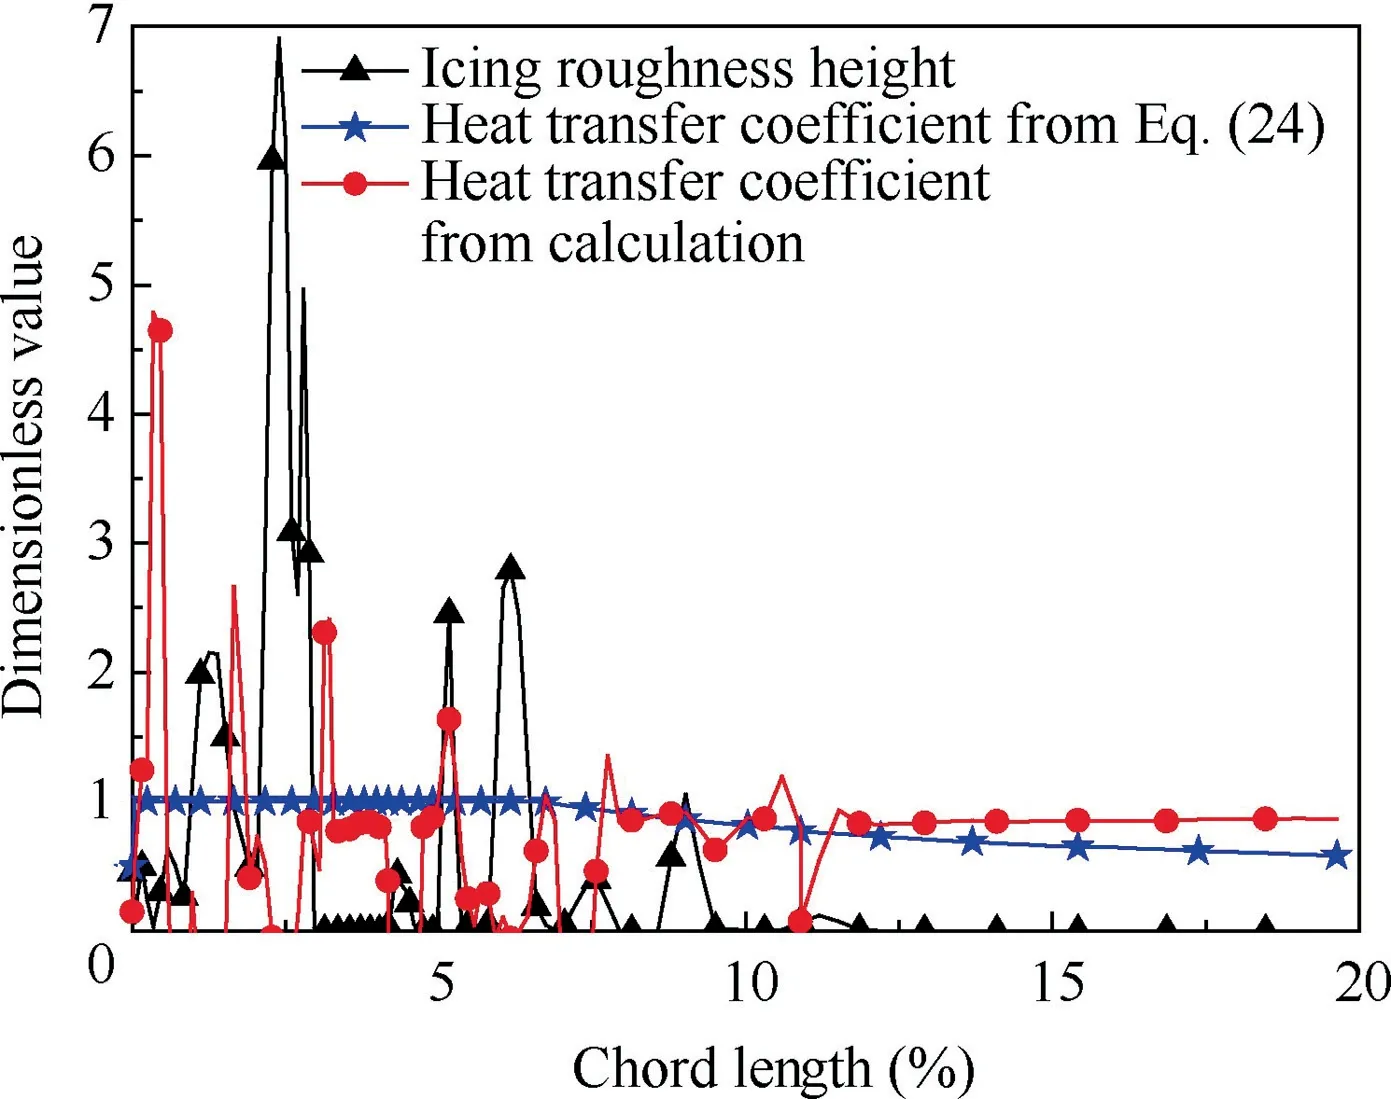
Fig. 15 Comparison of surface heat transfer coefficients with icing roughness within front 20% chord length range.
Through analysis of the icing roughness distribution characteristics,it is found that along the upper/lower surface,there is a relatively low roughness platform region first, then the icing roughness increases significantly and the disturbance effect on the surrounding airflow increases accordingly,thereby strengthening the convective heat exchange between the icy surface and the airflow. The numerical calculation results are extracted to make a further comparison, taking the characteristic line at the middle position in z direction as an example. Fig. 15 illustrates the dimensionless comparison within the front 20% chord length range, where the data on the 5% chord length position are selected as the benchmark.The black line is the ice roughness height on the upper surface,the blue one is the heat transfer coefficient calculated by empirical formula Eq. (24) without considering the ice roughness,and the red one is calculated by temperature distribution obtained from analogizing with velocity. It is shown in Fig.15 that the trend of the convective heat transfer coefficient calculated by temperature distribution is consistent with that of the roughness formed by freezing of supercooled water droplets. It should be noted that the heat transfer coefficient on the characteristic line is influenced not only by the ice roughness on the same line but also by surrounding ice particles.This result fully shows the obvious influence of icing roughness on flow and heat transfer.

where Nu is Nusselt number,Re is Reynolds number,and Pr is Prandtl number.
At the same time, the convective heat transfer of different regions on the icing surface is significantly different. The uniced downstream surface is relatively flat,thus the surrounding airflow is less disturbed and the convective heat transfer coefficient is also small. The influence will be further strengthened by the development of the airflow.When ice accumulates in the leading edge area to a certain extent, the irregular surface caused by the rough ice particles leads to the flow transition,which makes the distribution of the convective heat transfer coefficient become complicated.
5. Conclusions
(1) An integrated fixed-grid enthalpy-DPM-VOF algorithm with the ability to solve the multiphase heat transfer problem during icing process is established to give more detailed demonstration of the formation of the initial icing roughness.(2) Improvements in terms of determining the criterion of transformation from DPM to VOF and allocating source items during transformation are made to balance the calculation accuracy and efficiency. The accuracy and reliability of the improved algorithm are verified by comparing the results of simulation and experiment in Ref. 20, which match well.
(3) Details of the formation and movement of droplets as well as the phase change and heat transfer during the icing process are successfully revealed.
(4) The distribution characteristics of the initial icing roughness,heat transfer coefficients calculated by CFD and by empirical formula without considering the impact of icing roughness are compared. It preliminarily shows that the variation trend of the heat transfer coefficient calculated by CFD is consistent with the initial icing roughness,indicating that the formation of icing roughness can significantly enhance the convective heat transfer effect between the surface and the surrounding airflow, and affect the ice shape in turn.
The authors declare that they have no known competing financial interests or personal relationships that could have appeared to influence the work reported in this paper.
This work is supported by the National Natural Science Foundation of China (No. 51706244) and National Science and Technology Major Projects of China (No. 2017-VIII-0003-0114).
 Chinese Journal of Aeronautics2022年7期
- Chinese Journal of Aeronautics的其它文章
- An online data driven actor-critic-disturbance guidance law for missile-target interception with input constraints
- Study on excitation force characteristics in a coupled shaker-structure system considering structure modes coupling
- Smooth free-cycle dynamic soaring in unspecified shear wind via quadratic programming
- Active and passive compliant force control of ultrasonic surface rolling process on a curved surface
- High dynamic output feedback robust control of hydraulic flight motion simulator using a novel cascaded extended state observer
- Composite impact vector control based on Apollo descent guidance
