Study on excitation force characteristics in a coupled shaker-structure system considering structure modes coupling
Guiwei ZHANG, Xiaochen WANG, Zhichun YANG
School of Aeronautics, Northwestern Polytechnical University, Xi’an 710072, China
KEYWORDS Electrodynamic shaker;Force characteristics;Galerkin’s approach;Lumped parameter model;Parameters estimation
Abstract The interaction between an elastic structure and electrodynamic shakers commonly exists in Ground Flutter Simulation Tests(GFST)with multi-point excitations,causing a considerable discrepancy between the practical excitation forces and desired ones.To investigate the excitation force characteristics on a cantilever beam excited by a voltage-sourced electrodynamic shaker,the coupled shaker-beam system is modeled to derive the excitation force formula using Hamilton’s principle and Galerkin’s approach. Simulation results using the multi-mode beam model coupled with the shaker model are in good agreement with experimental results,verifying that the proposed multi-mode method can accurately predict the excitation force. Furthermore, parametric studies show that the influence of system parameters on the excitation force is related to the shaker’s operating mode. Unlike in current mode of shaker, when the beam resonant frequency approaches the suspension frequency of shaker armature, the variation of excitation force amplitude in voltage mode is no longer minimal. Meanwhile, if the exciting point in the GFST is located far away from the modal node,it is essential to compensate the force because the accuracy of tests can be reduced dramatically. The coupled shaker-beam model proposed in this paper can provide the basis for compensation measures.
1. Introduction
Due to the wide operating frequency band and small waveform distortions, electrodynamic shakers have been widely used to provide the excitation force in experiments.Recently, electrodynamic shakers are adopted in the Ground Flutter Simulation Test (GFST),which is conducted on a real aircraft structure. It uses the excitation forces generated by multiple shakers to simulate the unsteady aerodynamic force actuating on the structure under a given simulated airspeed to obtain the aeroelastic characteristics of the structure on the ground(without the wind tunnel). Compared with the wind tunnel flutter test,it eliminates the errors caused by the procedure of scaling the real structure to the wind tunnel test model and saves time and money, as well. Nevertheless, when using the electrodynamic shaker(s) to excite a flexible structure, there exists the interaction between the structure and shaker(s). On the one hand, the dynamic characteristics of the shaker will affect the vibration response of the structure; on the other hand,the flexibility of the structure will alter the excitation force in turn. Owing to this interaction, especially in the case of multi-point excitations, the excitation forces on the structure by shakers are not the same as expected. Both the amplitude and phase of the actual excitation force will vary dramatically with the structure’s vibration, especially at resonant frequencies of the structure. At this point, i.e., the so-called force drop-out phenomenon, the amplitude of excitation force decreases, and the phase lead or lag relative to the reference occurs. This interaction has motivated a large number of researchers to analyze the dynamic characteristics of shakers and the interaction between shakers and structures excited.
Based on the shaker’s physical models,Langconducted an experimental analysis on shaker dynamics, then developed a 4 Degree-of-Freedom (DOF) lumped parameter model. Ricci et al.identified the parameters of the shaker model through experiments. And the paper proved that this parameter model proposed in referencecan accurately reflect the electromechanical coupling characteristics of an electrodynamic shaker.Subsequently,the studyestimated the parameters of the shaker by impedance method. With increasing attention paid to the nonlinear phenomena, Saraswat and Tiwaristudied the position-dependent stiffness and electromechanical coupling factor related to shaker armature. Besides, they established a nonlinear model based on experiments. Maillou et al.established a nonlinear viscoelastic model of shaker suspension by Hammerstein model to characterize its low-frequency mechanical behavior.Martino and Harripresented a blocking structure approach as an alternative for shaker parameters determinationin the case of a high damped electrodynamic shaker. Considering lateral vibration of shaker table, Hoffait et al.included the torsional and rotational DOFs of shaker armature into the lumped parameter model and identified the model parameters by modal tests. Recently, Zheng et al.established a simplified mechanical model of the 6-DOF vibration test system such that eight exciters are modeled as spring damper pairs, and the shaker table is assumed to be rigid.
When a shaker is attached to a structure, its dynamic characteristics will alter the boundary conditions of the structure by introducing additional stiffness and damping into the interface. Correspondingly, there will exist huge variations in structural dynamic characteristics.In addition, the flexibility of the structure will alter the excitation force in turn.The variation of the excitation force with frequency can become quite severe in certain measurement situations. Vibration tests usually require the shaker to excite the structure in a manner that either the vibration response or excitation should meet a specific profile.Force amplification or dropout might make the test structure surface experience overor under-testing when the frequency approaches the resonance frequency of the structure. For GFST, we need to ensure that the amplitude and phase of the excitation forces are consistent with the reference inputs to shakers, i.e., the emulated aerodynamic forces, which is crucial to the success of the test. In view of the coupled electrodynamic shakerstructure system, it is necessary to analyze the variation of force with frequency and the influence of system parameters on it during the pre-test phase so one can provide principles for subsequent compensation measures.
Consequently, many researchers have studied the parameters affecting the excitation force: Tomlinsontheoretically analyzed the influence of magnetic field on the excitation force of shaker. Olsenconsidered the stiffness of the force sensor and developed an electromechanical coupling model of a shaker, concluding that the notch value of the force can be increased by a light shaker armature. On this basis, Raoinvestigated three models consisting of the structure and its attachment with shaker: (A) a grounded structure with a rigidly attached shaker, (B) a grounded structure attached to a shaker by a stinger, and (C) a free structure suspended by a shaker. They attributed the source of the force variation to the dynamic interaction between the mechanical part of the shaker and structure, together with the shaker’s electromagnetic characteristics. Considering the structural model as a continuous system, Tomlinsondeduced the theoretical formula of actual force using the modal superposition method and found that actual forces applied to a linear structure were dependent on the generalized structural characteristics (i.e.,generalized mass, stiffness, damping, and modal shape constants of the exciting point) and shaker’s dynamics. Varoto and Oliveiraestablished a coupled shaker-structure model based on the acceleration transmissibility and analyzed the influence of excitation signal types and amplifier operating modes on the force. Furthermore, they derived the theoretical formula of force transmissibility between the excitation force on the structure and the electromagnetic force generated on the shaker armature.The result shows that the excitation force is related to driving point Frequency Response Functions(FRFs) of structure and shaker.Dargahsystematically analyzed the excitation force characteristics of shakers in experiments and derived a theoretical formula of the force transmissibility for the coupled system with a 2-DOF structure excited by two shakers.Theoretical analyses indicated that the force transmissibility was related to excitation frequency, shaker impedance, and the response of structure. Simulation of a 5-DOF mass-spring-damper system, excited by two identical shaker models, reveals that the force spectra are smoothed in the presence of multiple shakers.The relationship between the transfer function matrix of the excitation force and the dynamic characteristic of the system excited by two shakers in current modes is presented qualitatively based on an equivalent model with two DOFs and is verified in experiment.From a modeling viewpoint, the excitation forces are calculated and considered to couple a detailed Finite Element(FE)model with a lumped parameter model of shaker by Hoffait.Later,Mare et al.coupled the modal model of a structure (derived from a FE model) with a simple calibrated electromechanical model of shakers using dynamic substructuring and the excitation forces of shakers are calculated based on the coupled model. Based on the same method, Zhang et al.established a parametric model of the excitation force in the shaker-cantilever plate excitation system. Zhang et al.experimentally investigated the excitation force of shaker in a strongly nonlinear structure. Near the structural resonant frequency,the amplitude of the excitation force might decrease as the input voltage increased, causing the amplitude-frequency curves of the force to cross over each other.
Most of the mentioned references have carried out the parameter analysis of the excitation force exerted on a simplified structure model, including a single DOF or two DOFs,which is coupled to shaker model.However, the errors caused by the simplification in the structure model and by the coupling among structural modes were ignored in the above simulations, which may cause a large discrepancy between the simulation results and the experimental ones.The discrepancy can be successfully solved by considering a detailed FE modelor FRFfrom the modeling viewpoint. Inspired by them, it is necessary to investigate the excitation force characteristics based on a multi-mode structural model coupled with the shaker model.
The following sections are arranged as follows: the lumped parameter shaker model (with a power amplifier operating in voltage mode) is derived in Section 2 and then coupled to the cantilever beam model, forming the coupled shaker-beam model to derive the excitation force formula later.In Section 3,parameters of the coupled model are identified and verified by experiments. In Section 4, convergence analyses are performed,then the excitation forces,predicted by numerical simulation and obtained by experiments, will be compared and discussed. Subsequently, parametric studies are conducted to investigate the effects of the position of exciting point and system parameters on the excitation force in Section 5. Finally,conclusions are presented in Section 6.
2. Modeling of the excitation force
In this paper, a cantilever beam excited by an electrodynamic shaker is investigated. A schematic overview of the coupled shaker-cantilever beam system is shown in Fig. 1. The length of the cantilever beam is l = 0.4 m, and the cross-section size is b×h=20.04 mm×5.09 mm,where b and h are the width and thickness of the cantilever beam, respectively. The material of the beam is aluminum alloy with a density of 2680 kg/m.The shaker is described as a vibration system with the equivalent mass m,flexure stiffness k,and viscous damping coefficient c.The distance between the clamped end of the beam and the exciting point is z= 0.304 m, indicating the position of the sensors (i.e., a laser displacement sensor and a load cell).The electromagnetic force Fexerted on the shaker armature can be divided into two parts: one is used to excite the shaker armature itself;the other one F,which is measured by the load cell, is used to excite the cantilever beam.
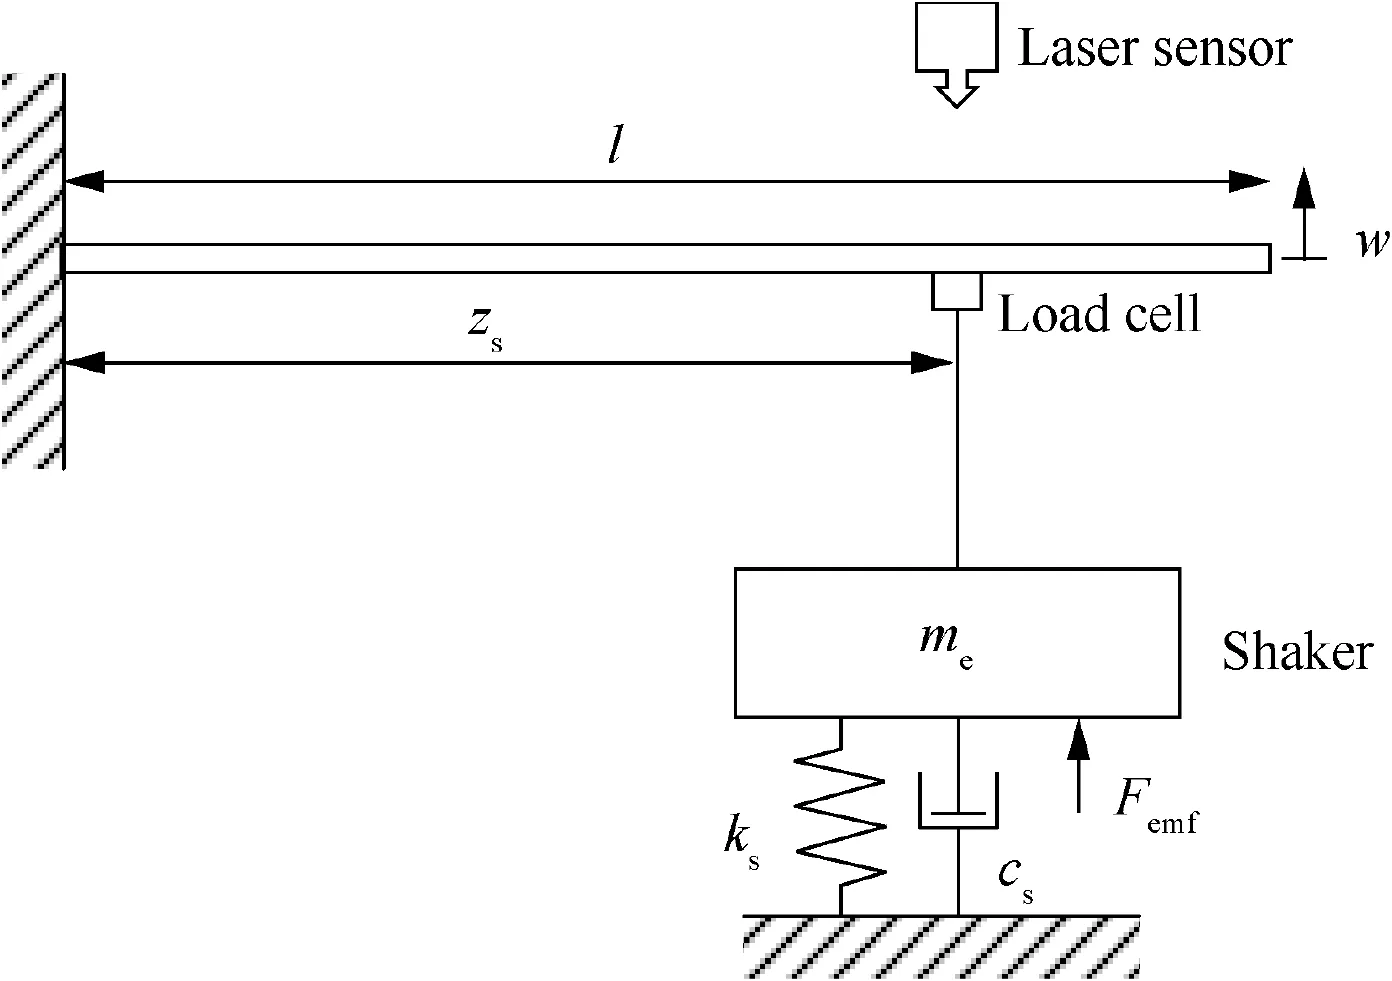
Fig. 1 Sketch of coupled shaker-cantilever beam system.
2.1. Lumped parameter model of shaker

where uand u are the input and output voltage of the amplifier, respectively, and G is the gain constant.
Fig. 2(b) depicts the mechanical part of the shaker model.The shaker’s armature with suspension is modeled as a single DOF lumped parameter system with the mass m, stiffness k, and viscous damping coefficient c. The vertical displacement wdescribes its mechanical motion. The armature is driven by electromagnetic force F(t) = κI(t), which is proportional to coil current I.The mass of armature mis part of the total equivalent mass m, as shown in Fig. 1. Additionally, the latter includes the masses of the stinger and the load cell. It might be noted for modeling the mechanical part of the shaker that the shaker base is assumed to be rigidly constrained to the ground. Otherwise, the resulting mechanical model of the shaker should have more DOFs.
The mechanical system of the shaker is coupled with the coil circuit. Thus, the resulting shaker model constitutes a 2-DOF electromechanical coupling system,

where F´is the force exerted on the shaker armature by the structure. The parameters of the shaker model are determined experimentally. During the identification procedure of the unknown parameters for the shaker model, the bare shaker is used, i.e., F´= 0 N.
2.2. Parameter identification procedure for shaker model
In this section, we will describe the identification procedure in detail. Mechanical parameters of the shaker, including the armature mass m, flexure stiffness k, and damping coefficient c, are measured by the additional mass method.First,we calculate the suspension frequency ffor a bare shaker and then the frequency ffor the loaded shaker with an additional rigid mass block Δm using the PolyMAX algorithm. The following equations at natural frequencies fand f, corresponding to the bare shaker and the loaded shaker, are


Fig. 2 Lumped parameter model of electrodynamic shaker.
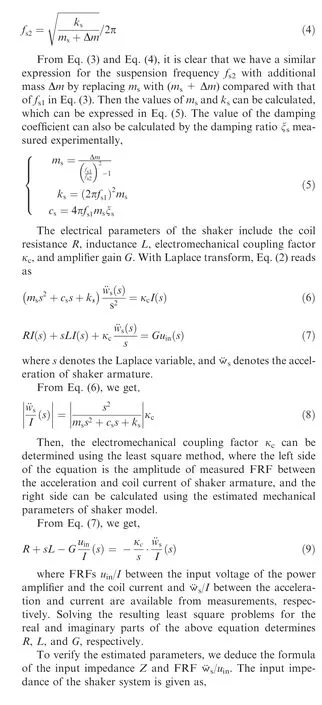

2.3. The coupled shaker-cantilever beam model
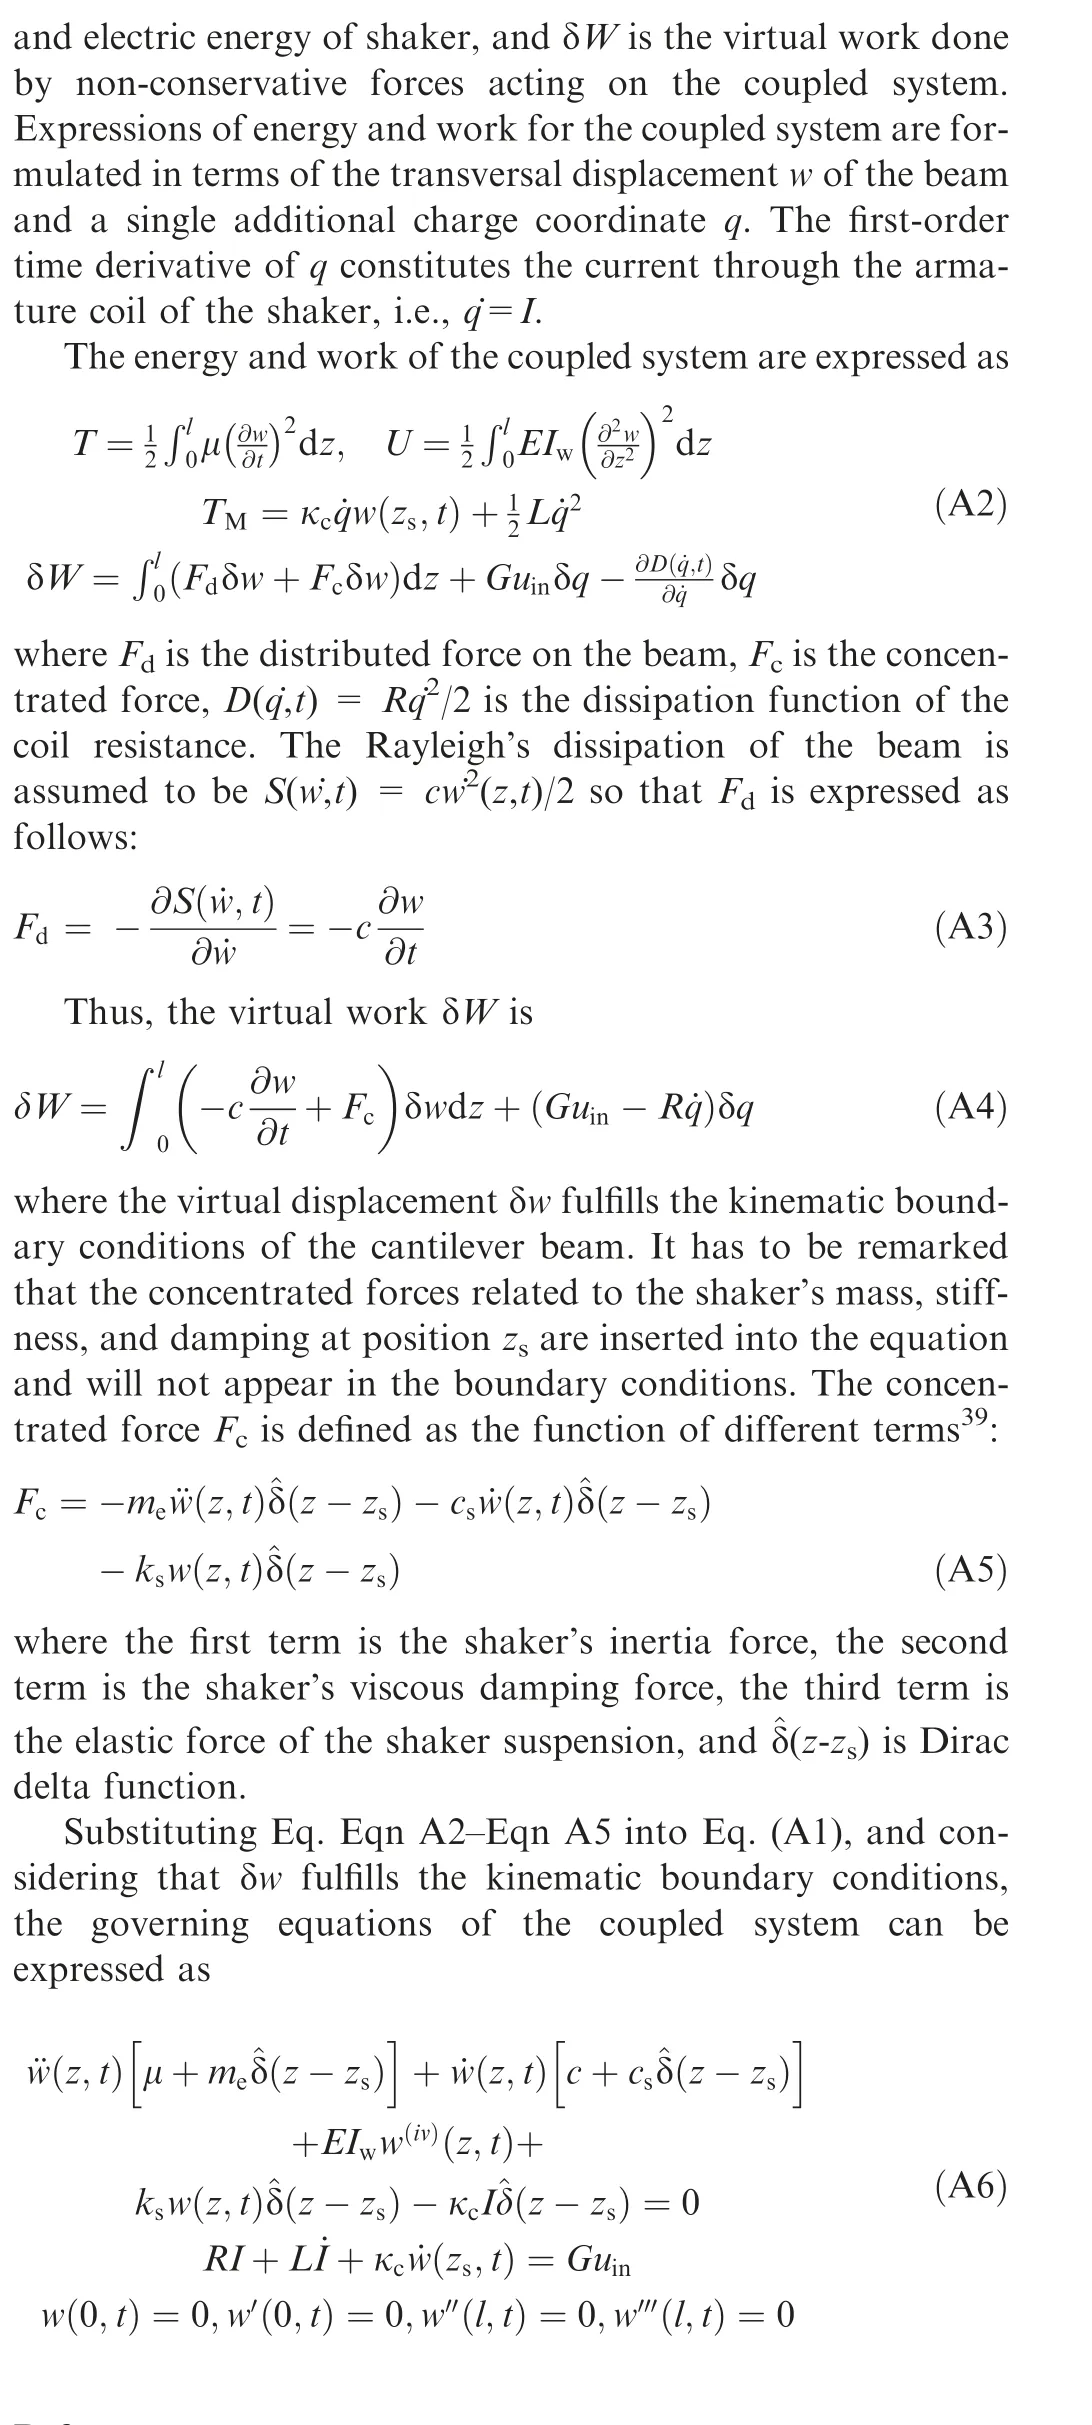
In order to simulate the excitation force, the coupled system sketched in Fig.1 can be modeled as a mono-dimensional system where z ∊[0,l]and t ∊[0,∞]are the spatial and time variables, respectively. The beam can be described as a Euler–Bernoulli cantilever beam with a uniform section along the axis direction, the moment of inertia I= bh/12, mass per unit length μ = ρbh, elastic modulus E, and damping coefficient c. The coupled shaker-beam model and boundary conditions will be derived by the charge-displacement formulation of Hamilton’s Principle,and details of the derivations are given in Appendix A:

where ^δ (z-z) is Dirac delta function. It can be seen that the governing equations are composed of a fourth-order PDE(Partial Differential Equation) together with a first-order ODE(Ordinary Differential Equation).In this paper,dynamic characteristics of the shaker are taken into account in the equation of motion as external forces employing Dirac delta function, namely concentrated inertia force, elastic restoring force, and damping force.Therefore, the boundary conditions of the coupled system are the same as those of the cantilever beam.
2.4. Excitation force model
This section presents the Multi-Mode beam model coupled with the shaker model(the coupled shaker-MM beam model),finalizing the formulation for calculating the excitation force acting on the beam by Galerkin’s approach.
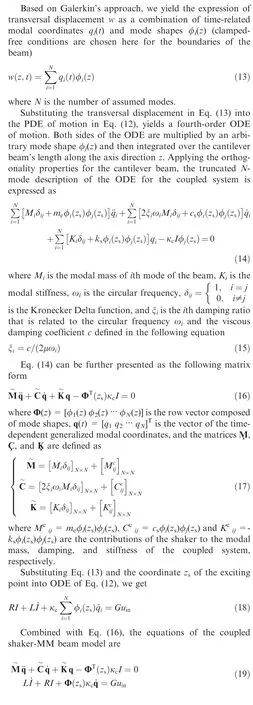
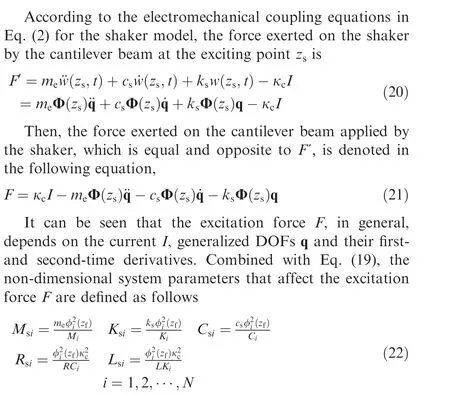
where Mis the ith modal mass ratio between the equivalent mass mof shaker and the ith modal effective mass M/φ(z)of the beam,Kis the modal stiffness ratio between the flexure stiffness kof the shaker and the ith modal effective stiffness K/φ(z),Cis the modal damping ratio between the shaker damping coefficient cand the ith modal effective damping C/φ(z), Ris the modal electrical damping ratio between the shaker electrical damping κ/R and the ith modal effective damping C/φ(z),Lis the modal electrical stiffness ratio between the shaker electrical stiffness κ/L and the ith modal effective stiffness K/φ(z), and zis the exciting point.The influence of system parameters on the excitation force will be analyzed in Section 5.2.
3. Identification of the system parameters
According to the coupled shaker-MM beam model obtained in Section 2.4,the values of the unknown parameters will be identified by experimental modal analysis.
3.1. Identification of parameters for shaker model
As described previously in Section 2.2,the identification experiments were carried out.The linear sinusoidal sweep signal was supplied to the amplifier, with the frequency band range of 1–100 Hz and sweep time of 100 s.The suspension frequencies of the shaker armature, with and without the additional mass Δm, respectively, and modal damping ratio ξare listed in Table 1. The identified parameters of the shaker model are listed in Table 2.parameters together with the electromechanical coupling factor, and the measured one (red dashed line). The existence of bare shaker suspension frequency f(about 16.196 Hz),which corresponds to the natural frequency of the assembled system composed of shaker armature and suspension, is obviously identifiable and observable in Fig. 3(a). Besides, the synthesized FRF curve is in good agreement with the measured curve.

Table 1 Identification experiments for mechanical parameters of shaker.

Table 2 Parameters of the shaker model.
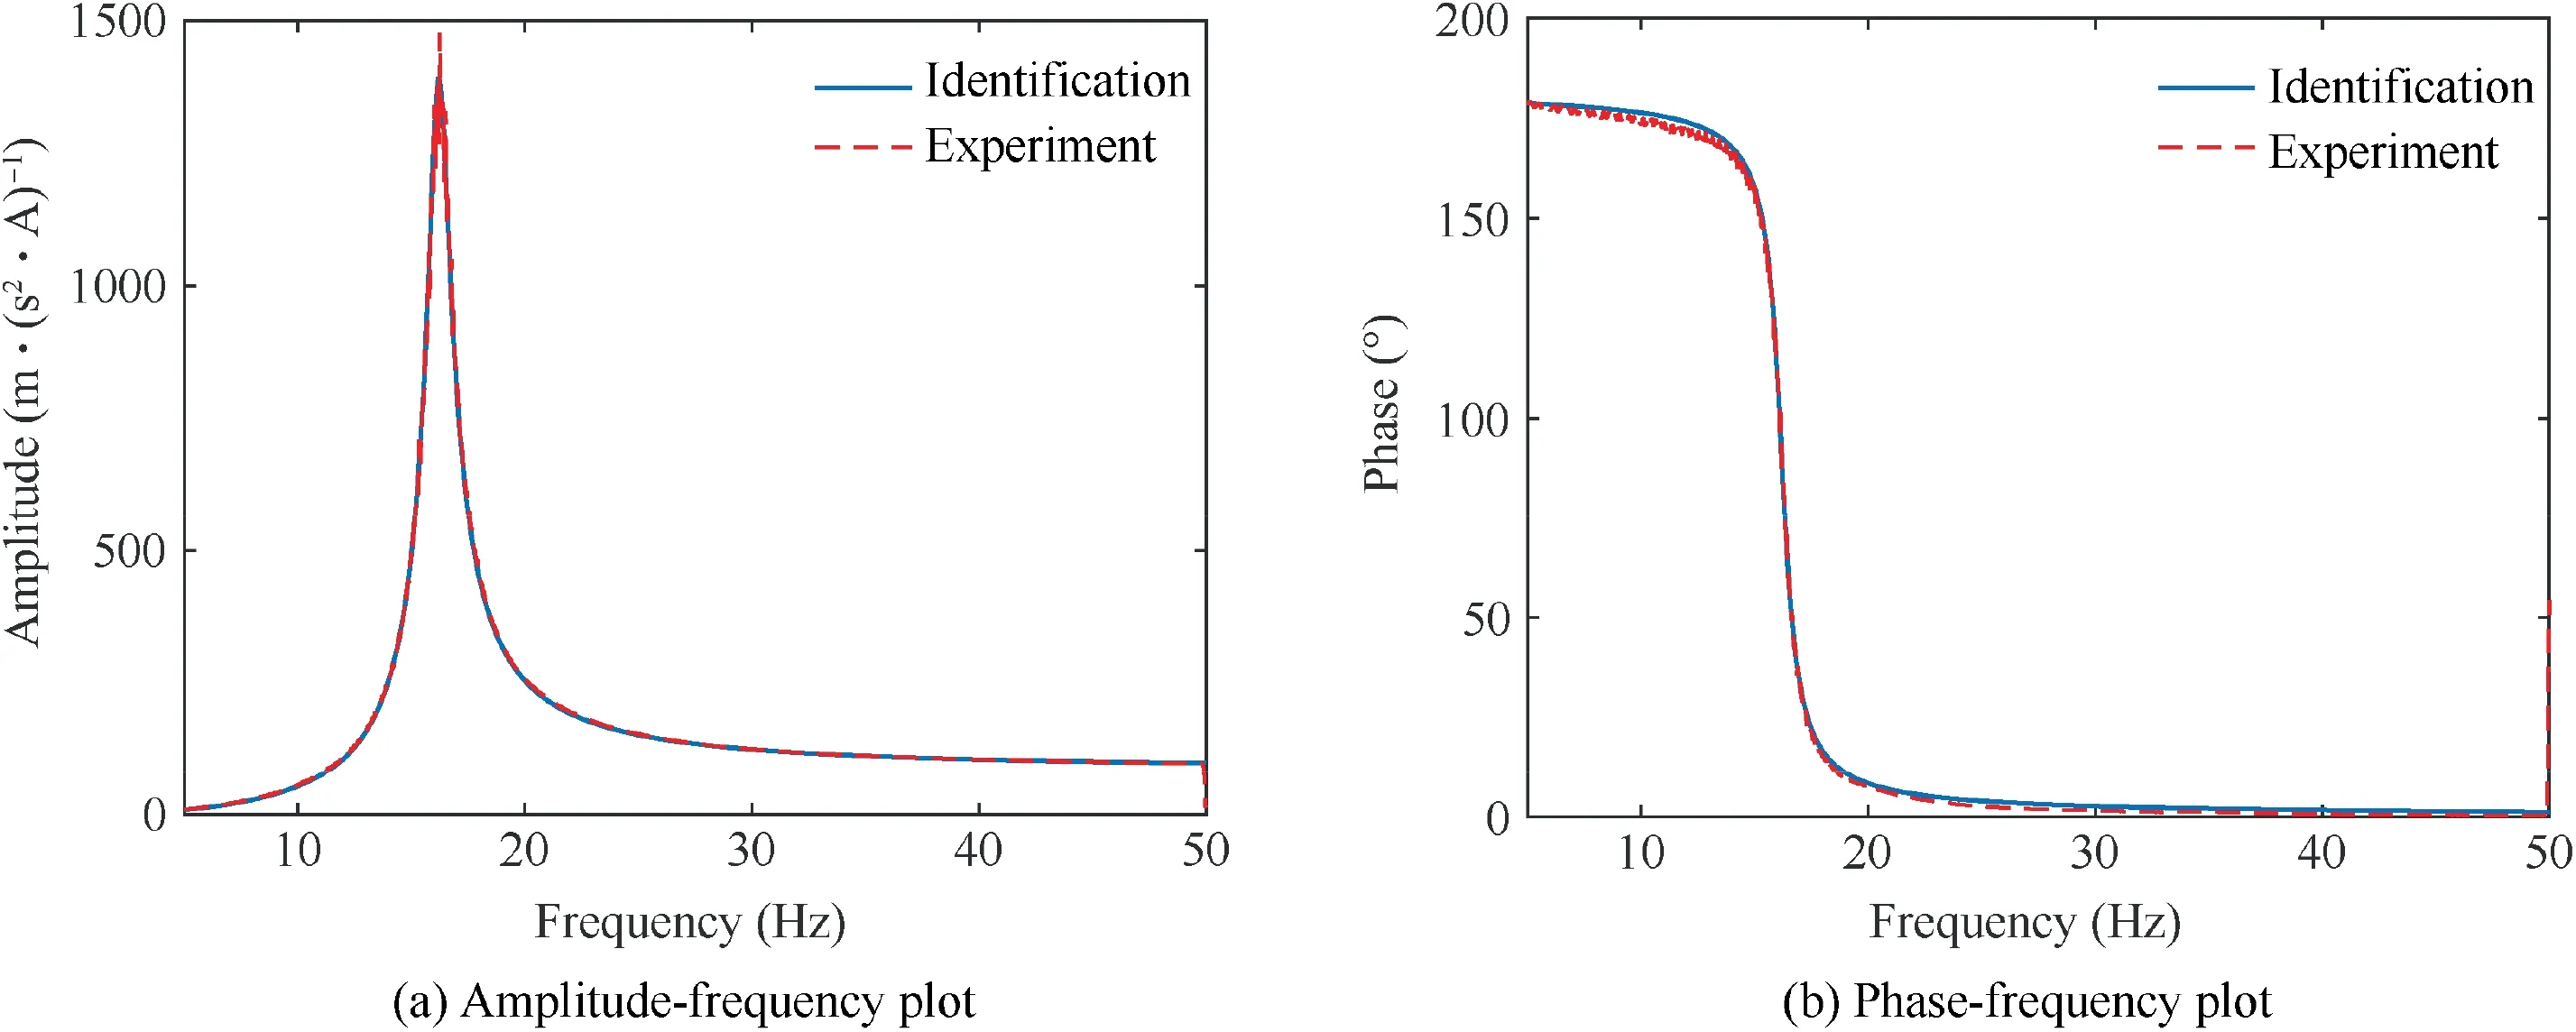
Fig. 3 Comparisons of measured and identified FRFs between the acceleration and coil current of shaker armature.
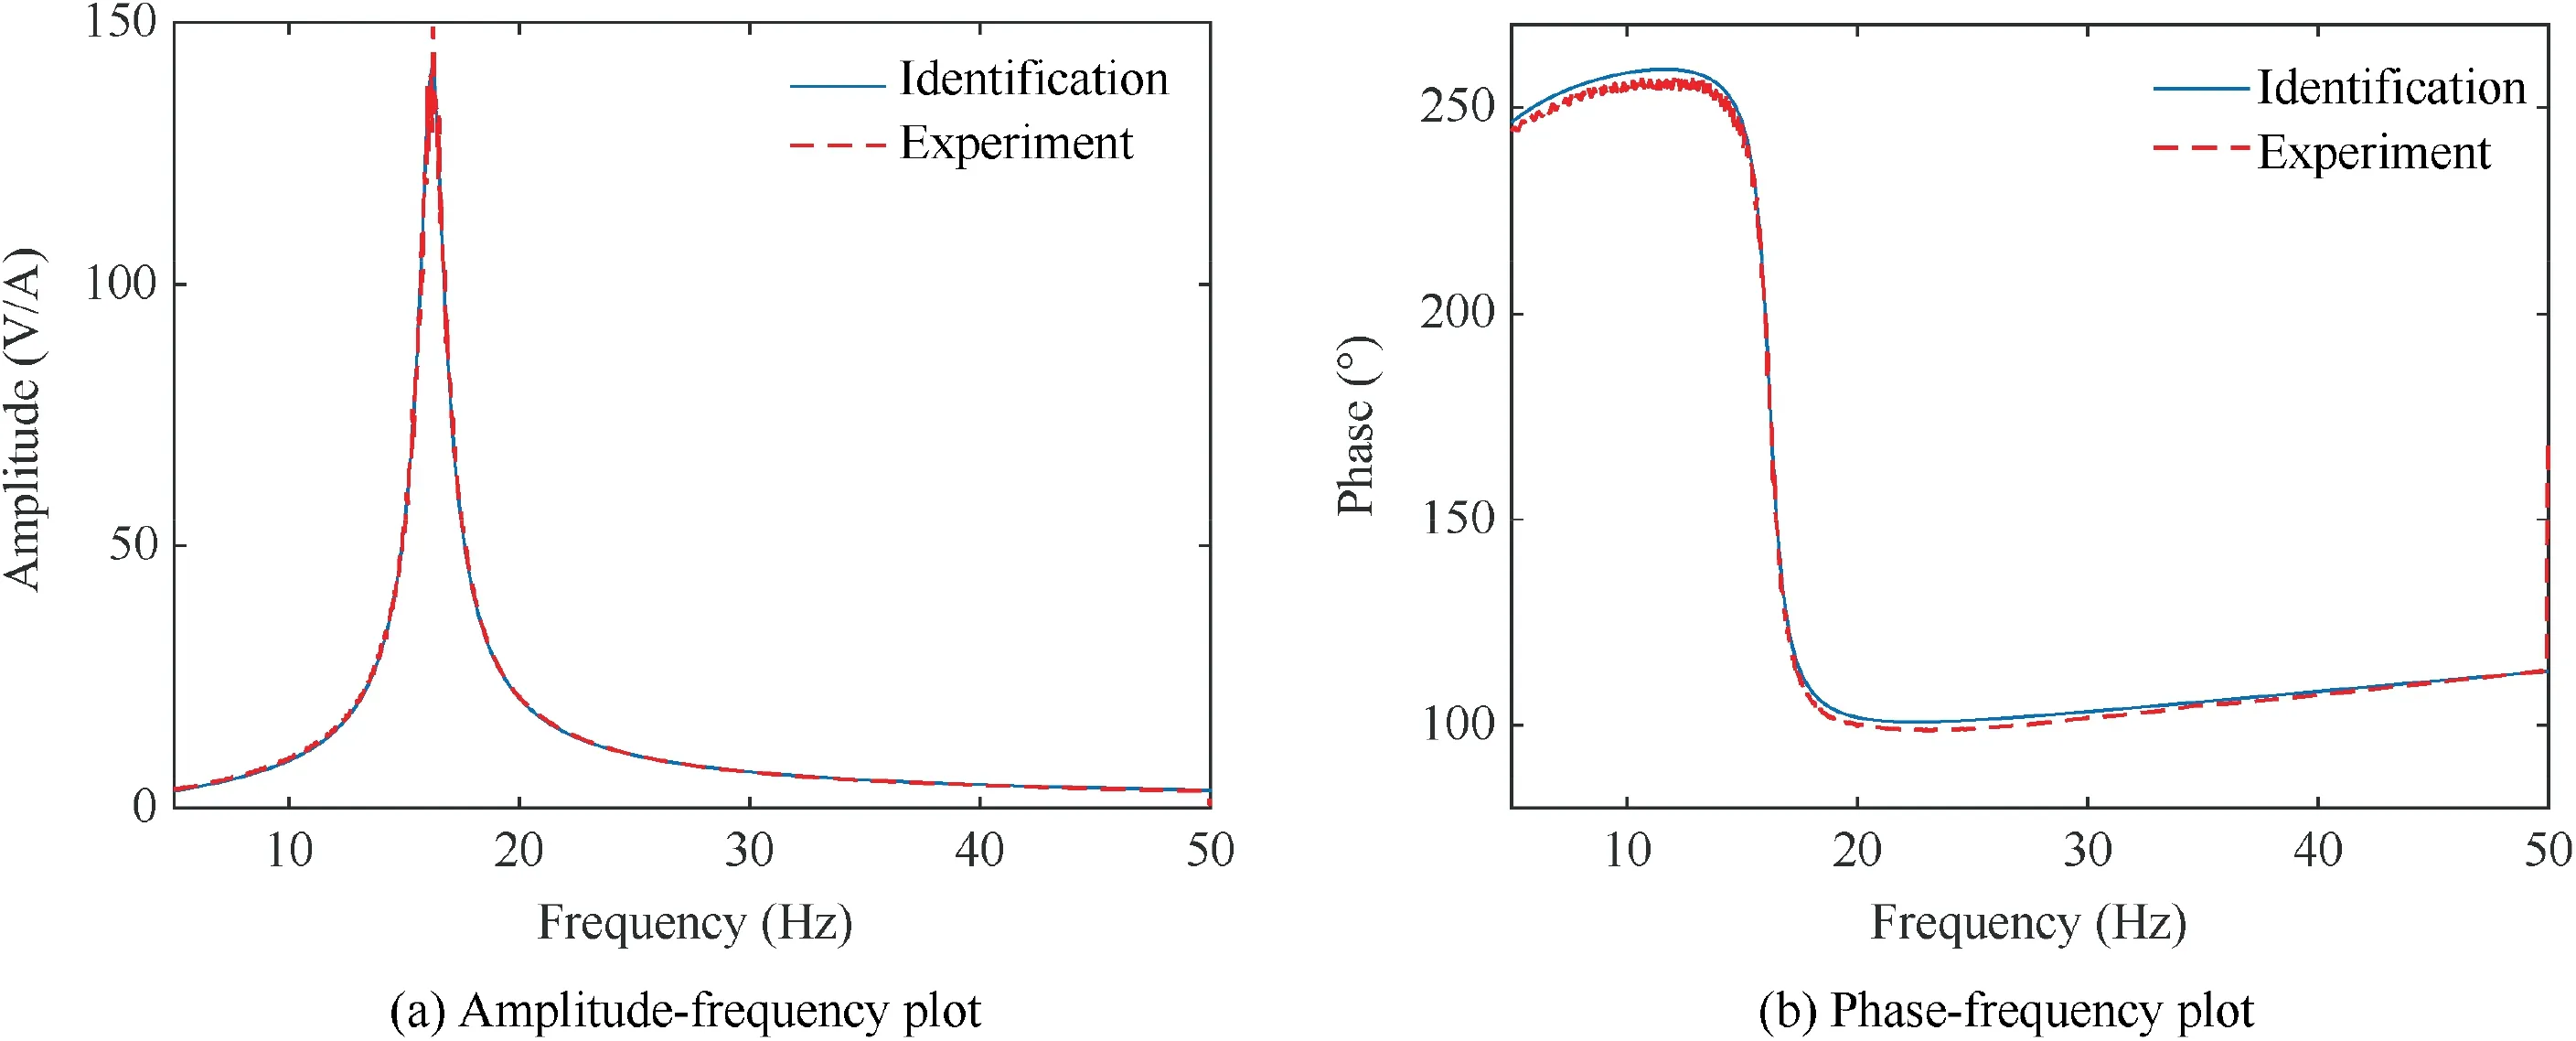
Fig. 4 Comparisons of measured and identified total input impedance Z of shaker armature across the input terminal of the amplifier.
Fig.4 shows that the total input impedance Z of the shaker system measured across the input terminal of the amplifier.Similarly, the impedance curve calculated using the identified electrical parameters can well reflect the variation of the measured curve. When the frequency of input signal to the power amplifier approaches f,the mechanical admittance of the suspension system increases significantly. As a result, there exists a resonance peak in the total input impedance Z. As can be seen in Fig.4(a)and described in Eq.(10),the total impedance will encounter a maximum value at f.
To further verify the shaker model parameters, comparisons between the identified and the measured results,in terms of the time-domain responses and FRFs,are depicted in Fig.5.Red dashed and blue solid curves represent the experimental and identification results,respectively.Sweep time is 100 s with the frequency range from 1 Hz to 100 Hz so that the excitation frequency reaches fat about 16.35 s.When the excitation signal frequency gets close to f,the velocity of the shaker armature increases significantly. As shown in Fig. 5(a), the coil current decreases dramatically due to the influence of back voltage E. Thus, the effects of measurement noise on the accuracy of FRF become severe at f.When the excitation frequency is lower than f, the amplitude of the calculated total input impedance at the input terminal of the amplifier is lower than the experimental value,resulting in the current amplitude measured in the experiment being lower than that in the simulation. When the excitation frequency is above f, the total input impedance is overestimated, resulting in the current amplitude measured in the experiment being higher than that in the simulation.

Fig. 5 Comparisons between experimental results and numerical ones, in terms of time histories and FRFs.

Table 3 Geometrical and material parameters of the cantilever beam model.

Table 4 Modal characteristics of cantilever beam.
For armature acceleration, the correlation between the experimental results and the simulation ones is good,and the amplitude and phase errors can be negligible. It is noticed that no resonance peak is observed in Fig. 5(c)-(d) because the response of the shaker’s electrical circuit has been taken into account. Since FRF ẅ/uis calculated by referred to input voltage rather than the current as shown in Fig. 3, system damping is the combination of suspension damping cand electrical damping κ/R. The latter term is caused by back voltage Eand can increase the system damping considerably. Thus,shaker armature will experience a more damped response.Because of the electromechanical coupling effect, the resonance peak in armature acceleration will shift from the suspension resonant frequency (f) to the electromechanical resonance frequency. As a result, the acceleration amplitude will increase with the increase of the excitation frequency until it reaches the electromechanical resonant frequency.
In conclusion, the simulated responses have a good correspondence with the measured results, validating the shaker model determined in Section 2.1. We may conclude that the developed dynamic model of the shaker can precisely reflect the electromechanical coupling characteristics of the shaker and predict the response of shaker armature in a broad frequency range.
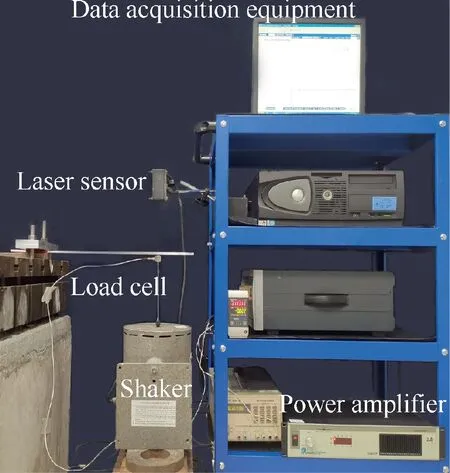
Fig. 6 Experimental set-up of the coupled shaker-cantilever beam system.
3.2. Identification of parameters for cantilever beam
The majority of unknown parameters for the coupled shaker-MM beam model, mainly the shaker model, have been identified in the previous section. Now, the remaining ones for the cantilever beam will be identified. Besides, considering the modeling errors,the real value of elastic modulus E of the cantilever beam is also considered as an additional parameter to be identified. The first three modal damping ratios and elastic modulus of the cantilever beam are determined in the modal test. Table 3 lists the geometric and material parameters of the cantilever beam model.As can be seen,the elastic modulus E is identified to be a tiny little bit lower than the theoretical value (71 GPa), which may be due to the following two facts:
1) the clamped boundary conditions in the experiment are not ideal as considered in the model;
2) axial strain and axial inertia of the beam are not considered in the beam model, which may result in an overestimation of the natural frequencies of the model.
The first three natural frequencies and modal damping ratios of the cantilever beam are listed in Table 4. The experimental results revealed that the first natural frequency is equal to 25.045 Hz, the second natural frequency is equal to 156.596 Hz, and the third natural frequency is 434.253 Hz.At the same time,the frequencies of the beam model exhibited slightly different values,the errors of which were less than 1%.It shows that the Bernoulli beam model can describe the dynamic characteristics of the cantilever beam. As noted, the damping ratios measured in the experiment will be used for the subsequent sections.
4. Experimental verification of the excitation force model
Comparisons have been made between the numerical and experimental results to verify the developed excitation force model in this section.
4.1. Experimental set-up
A picture of the coupled shaker-cantilever beam system is shown in Fig. 6. The cantilever beam is rigidly constrained to the test rig and transversely excited by a shaker(MB Modal 50)attached at the position z. The excitation signal produced by the signal generator (Quarc, Quanser) is amplified by a power amplifier (MB SL500VCF) and then supplied to the shaker.The up end of the load cell(PCB 208C03)is connected to the cantilever beam,and the bottom end is connected to the shaker through a stinger. A laser displacement sensor (KEYENCE LK-G150) measures the displacement of the exciting point without contact. All data are collected by data acquisition equipment (LMS SCADAS). No feedback signal is used to control the excitation force on the beam. Consequently,the actual excitation force will not be proportional to the input voltage injected into the amplifier due to the interaction between the shaker and the cantilever beam. Therefore, it is necessary to develop the coupled shaker-beam model for predicting the excitation force.
It should be noticed that the gain constant of the amplifier used herein equals G=-3.65 and that the equivalent mass of the shaker, including the stinger, load cell, and shaker armature, equals m= 0.2185 kg. Thus, the suspension frequency of the loaded shaker is reduced to f= 15.051 Hz. The frequency range of the swept sine test is selected as 1–300 Hz,which covers the first two natural frequencies of the cantilever beam.
4.2. Convergence analyses
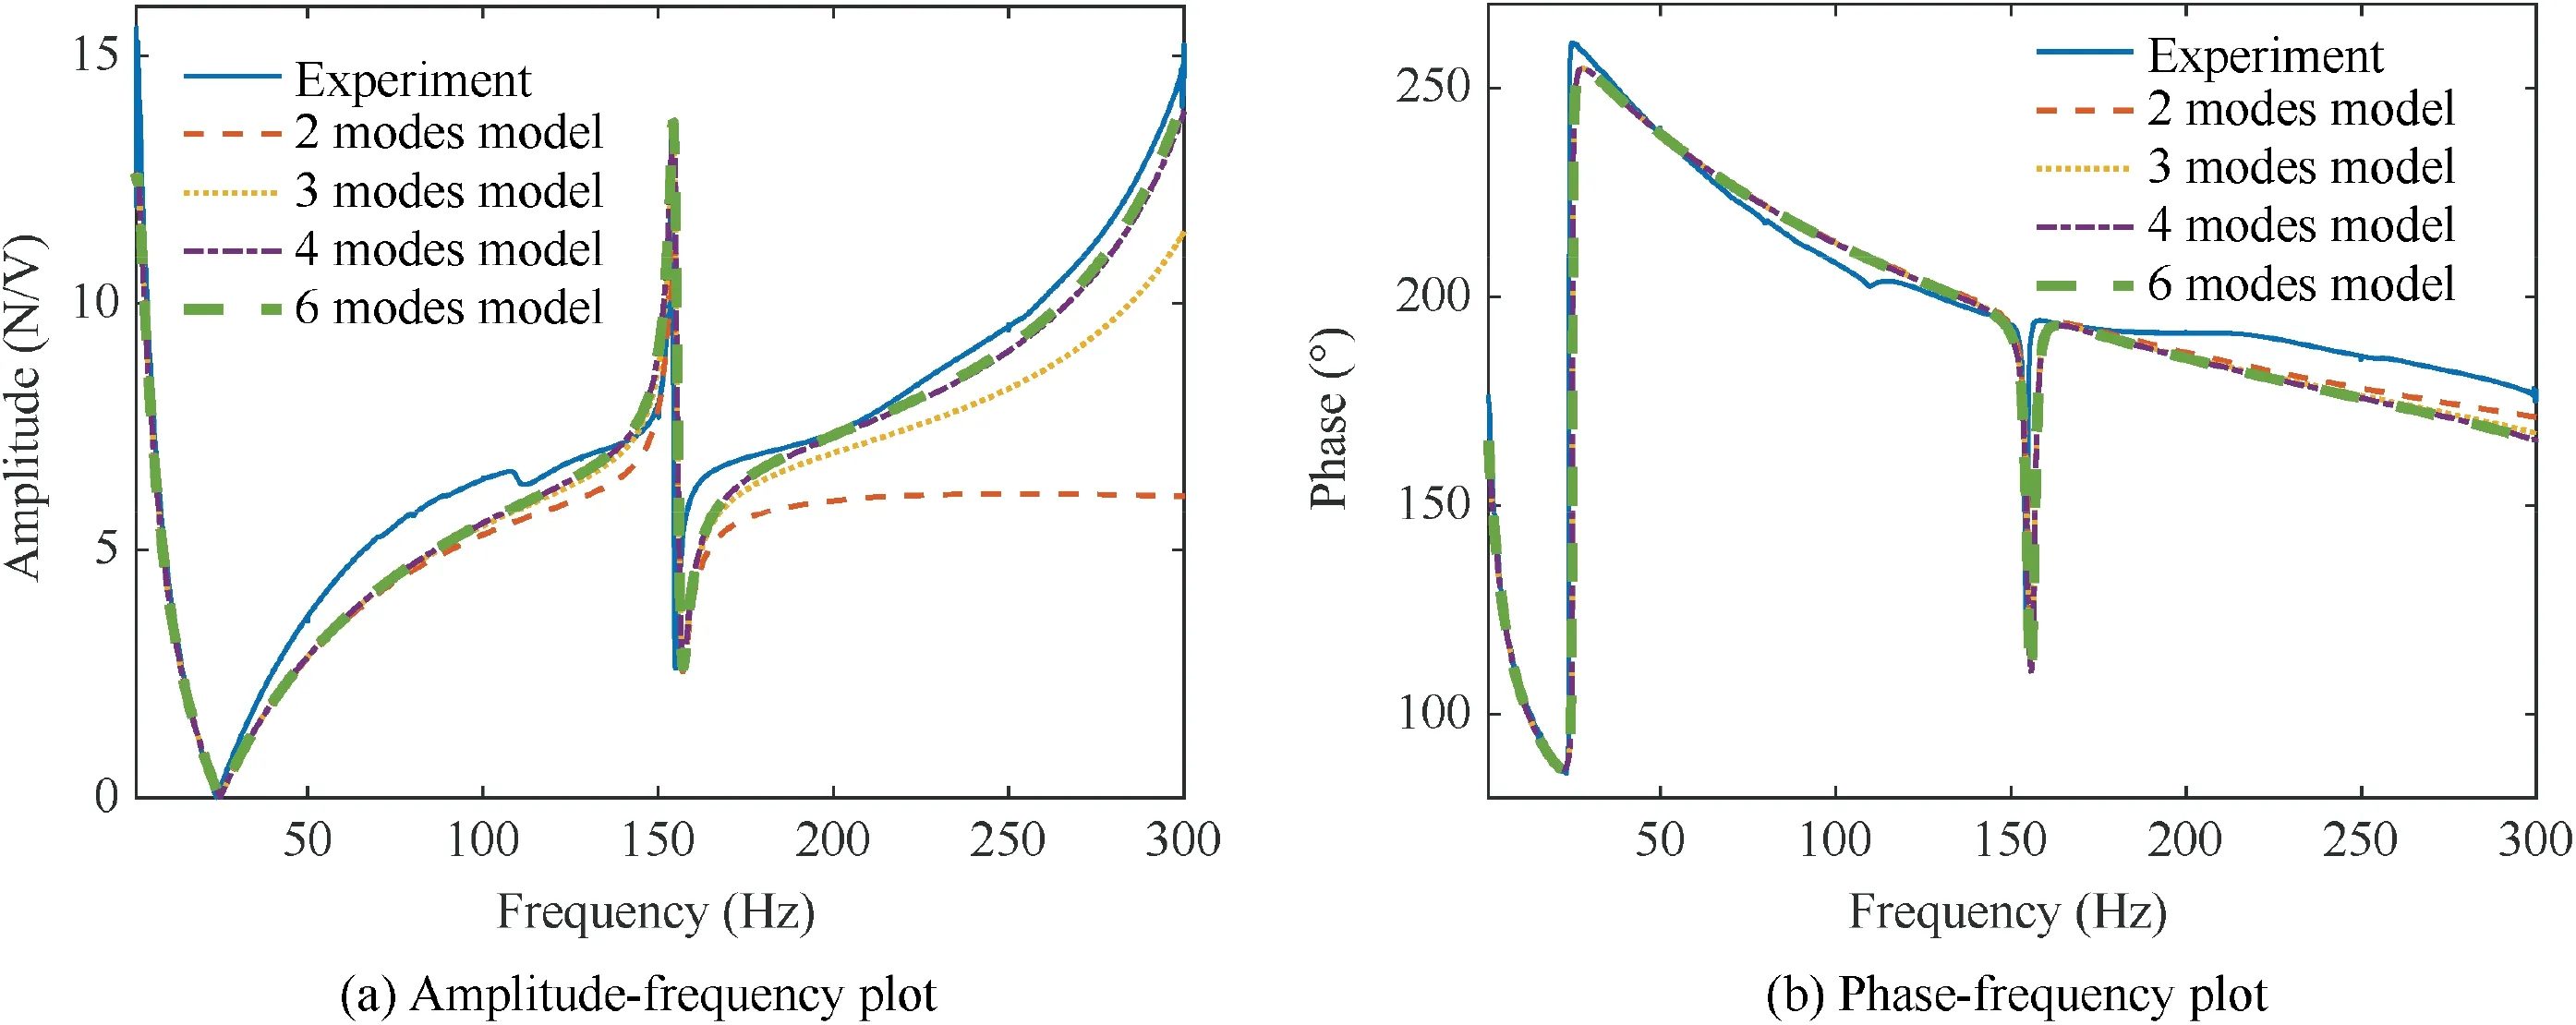
Fig. 7 Comparisons of the experimental results and numerical ones for FRF between the excitation force and input voltage.
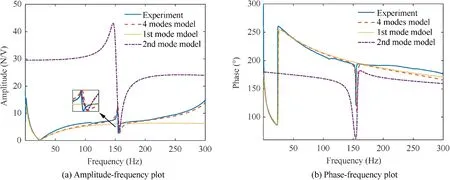
Fig. 8 Comparisons of simulated results between coupled shaker-SM beam models and coupled shaker-MM beam model.
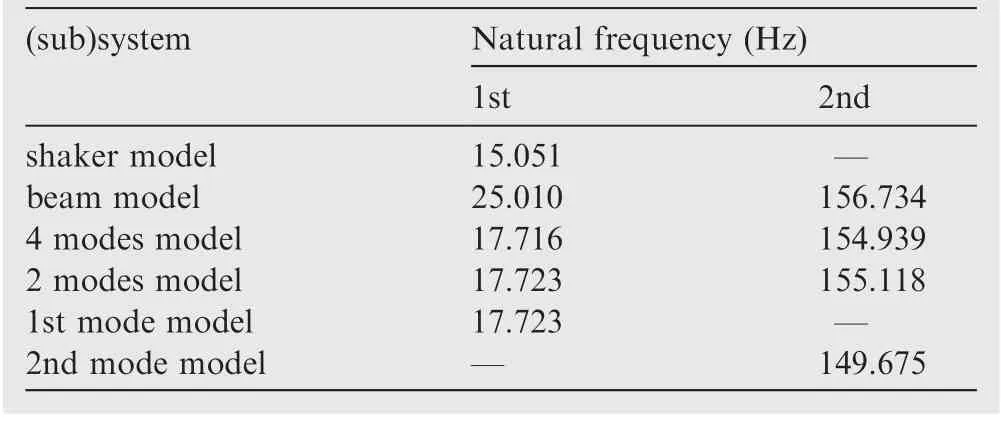
Table 5 Natural frequencies of dynamic systems.
In order to determine the number of assumed modes N required in Eq.(13), four of the coupled shaker-MM beam models,superposing the first two(N=2),three(N=3),four(N = 4) or six modes (N = 6) of the cantilever beam, respectively,will be used in the simulation.These four models will be referred to as the 2 modes model, 3 modes model, 4 modes model,and 6 modes model,respectively,later on in this paper.For the 6 modes model, it actually has thirteen state variables as described in Eq.(19), i.e., the generalized coordinate qand its first-time derivative q˙(j=1,2,∙∙∙,6)along with coil current I. The modal damping ratios of the first three modes used in the simulation are shown in the last row of Table 4. In particular, the other three are assumed to be 0.1%.
Compared with the force signal’s auto-spectrum,FRF F/ubetween the excitation force and input voltage of the amplifier can more clearly depict the force variation at structural resonant frequencies. In addition, it can also show the variation characteristics of the phase. Therefore, FRF F/uis chosen here.
Comparison of FRF (F/u) between the experiment (blue solid line) and simulation results are depicted in Fig. 7. At low frequencies(near the first resonant frequency of cantilever beam), the results obtained using the 2 modes model (red dashed line)are compared to those obtained by the other three models, showing that no significant differences are detectable,as the contribution of the first mode of the cantilever beam prevails dominantly. As the excitation frequency increases(near the second resonant frequency of cantilever beam), the simulation results of both the 4 and 6 modes model (purple dashed-dotted line and green thick dashed line) are closer to the measured results than those of either 2 modes model or 3 modes model (yellow dotted line), which indicates that 4 modes model and 6 modes model can predict the amplitude and phase of the excitation force more accurately. Further, it is found that the differences between the simulation results obtained by the 4 modes model and 6 modes model can be negligible.
In addition, the simulation results based on the Single-Mode beam model coupled with the shaker model(the coupled shaker-SM beam model) are plotted together with the experiment results (blue solid lines) and simulation results of the 4 modes model(red dashed line)as shown in Fig.8.The coupled shaker-SM beam model, including the first, and the second beam mode,is referred to as the 1st mode model and 2nd mode model,respectively.The yellow dotted line and purple dasheddotted line represent the results of 1st mode model and 2nd mode model,respectively.Compared with the 4 modes model,the coupled shaker-SM beam model cannot reflect the characteristics of the excitation force except in the vicinity of the natural frequency of beam.As for the 2nd mode model,the error between the simulation results and the experimental results is enormous, especially in the vicinity of the peak frequency.
The modal frequencies of the coupled shaker-beam models consisting of the mechanical part of the shaker model and different beam models, separately, are listed in Table 5 together with the modal frequencies of the shaker model and beam model alone. Compared with 1st mode model or 2nd mode model, the discrepancies in modal frequencies of 2 modes model are caused by the modal coupling of the first two modes.It indicated that the coupling among different modes of the cantilever beam will alter the natural frequency of the coupled shaker-cantilever beam system. Thus, the coupled shaker-SM beam model cannot describe the dynamic characteristics of the coupled system correctly. Comparisons of the frequencies between the 2 modes model and 4 modes model confirm the residual effects of the higher-order modes on the coupled system.
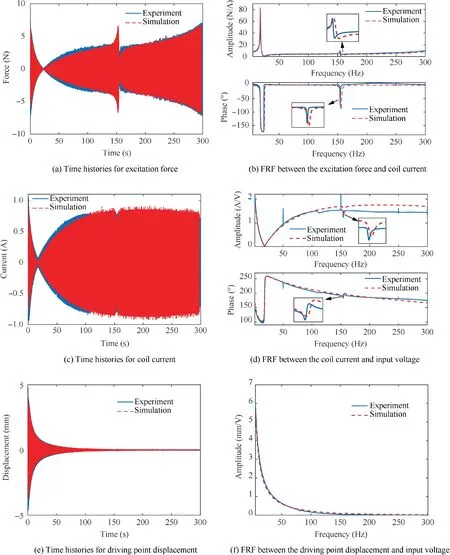
Fig. 9 Comparisons of experimental results and simulated ones for time histories and FRFs of coupled system.
Hence,the 4 modes model is adequate to consider the residual effects of the higher-order modes beyond the bandwidth(1–300 Hz) for the coupled shaker-beam system and will be adopted for further model validation accounting for efficiency.As can be seen in Fig. 7(a) and Fig. 8(a), the excitation force on the structure increases at first with increasing excitation frequency in the vicinity of 150 Hz.It reaches the maximum value at a frequency called the peak frequency, which is associated with the resonant frequency of the coupled system (corresponding to the frequency of the 4 modes model in Table 5,154.939 Hz).Then it decreases and reaches the minimum value at the notch frequency associated with the second resonant frequency of the cantilever beam alone (f= 156.734 Hz). Consequently, the so-called force drop-out phenomenon typically occurs with drop-out and amplification.In the end,the amplitude begins to increase again. Since f(15.051 Hz) is lower than the second resonant frequency of the cantilever beam f(156.734 Hz), the resonant frequency of the coupled shakerbeam system (154.939 Hz) will be lower than the corresponding frequency fof the cantilever beam.Thus,the force amplification appears before the force attenuation.In the vicinity of the first resonant frequency of the cantilever beam(f= 25.010 Hz), the peak of excitation force vanishes, and the reason will be explained in Section 5.2. Because the gain constant of the amplifier used in this study is negative,the initial phase of the excitation force F relative to the input voltage of the shaker uin the phase-frequency curve is 180°, which deviates from the results in Refs. 23–24. The phase-frequency curve also reveals a phase lag.The phase of the excitation force relative to udrops to the minimum value near the resonant frequency of the cantilever beam then rises beyond it.
4.3. Comparison between experimental and numerical results
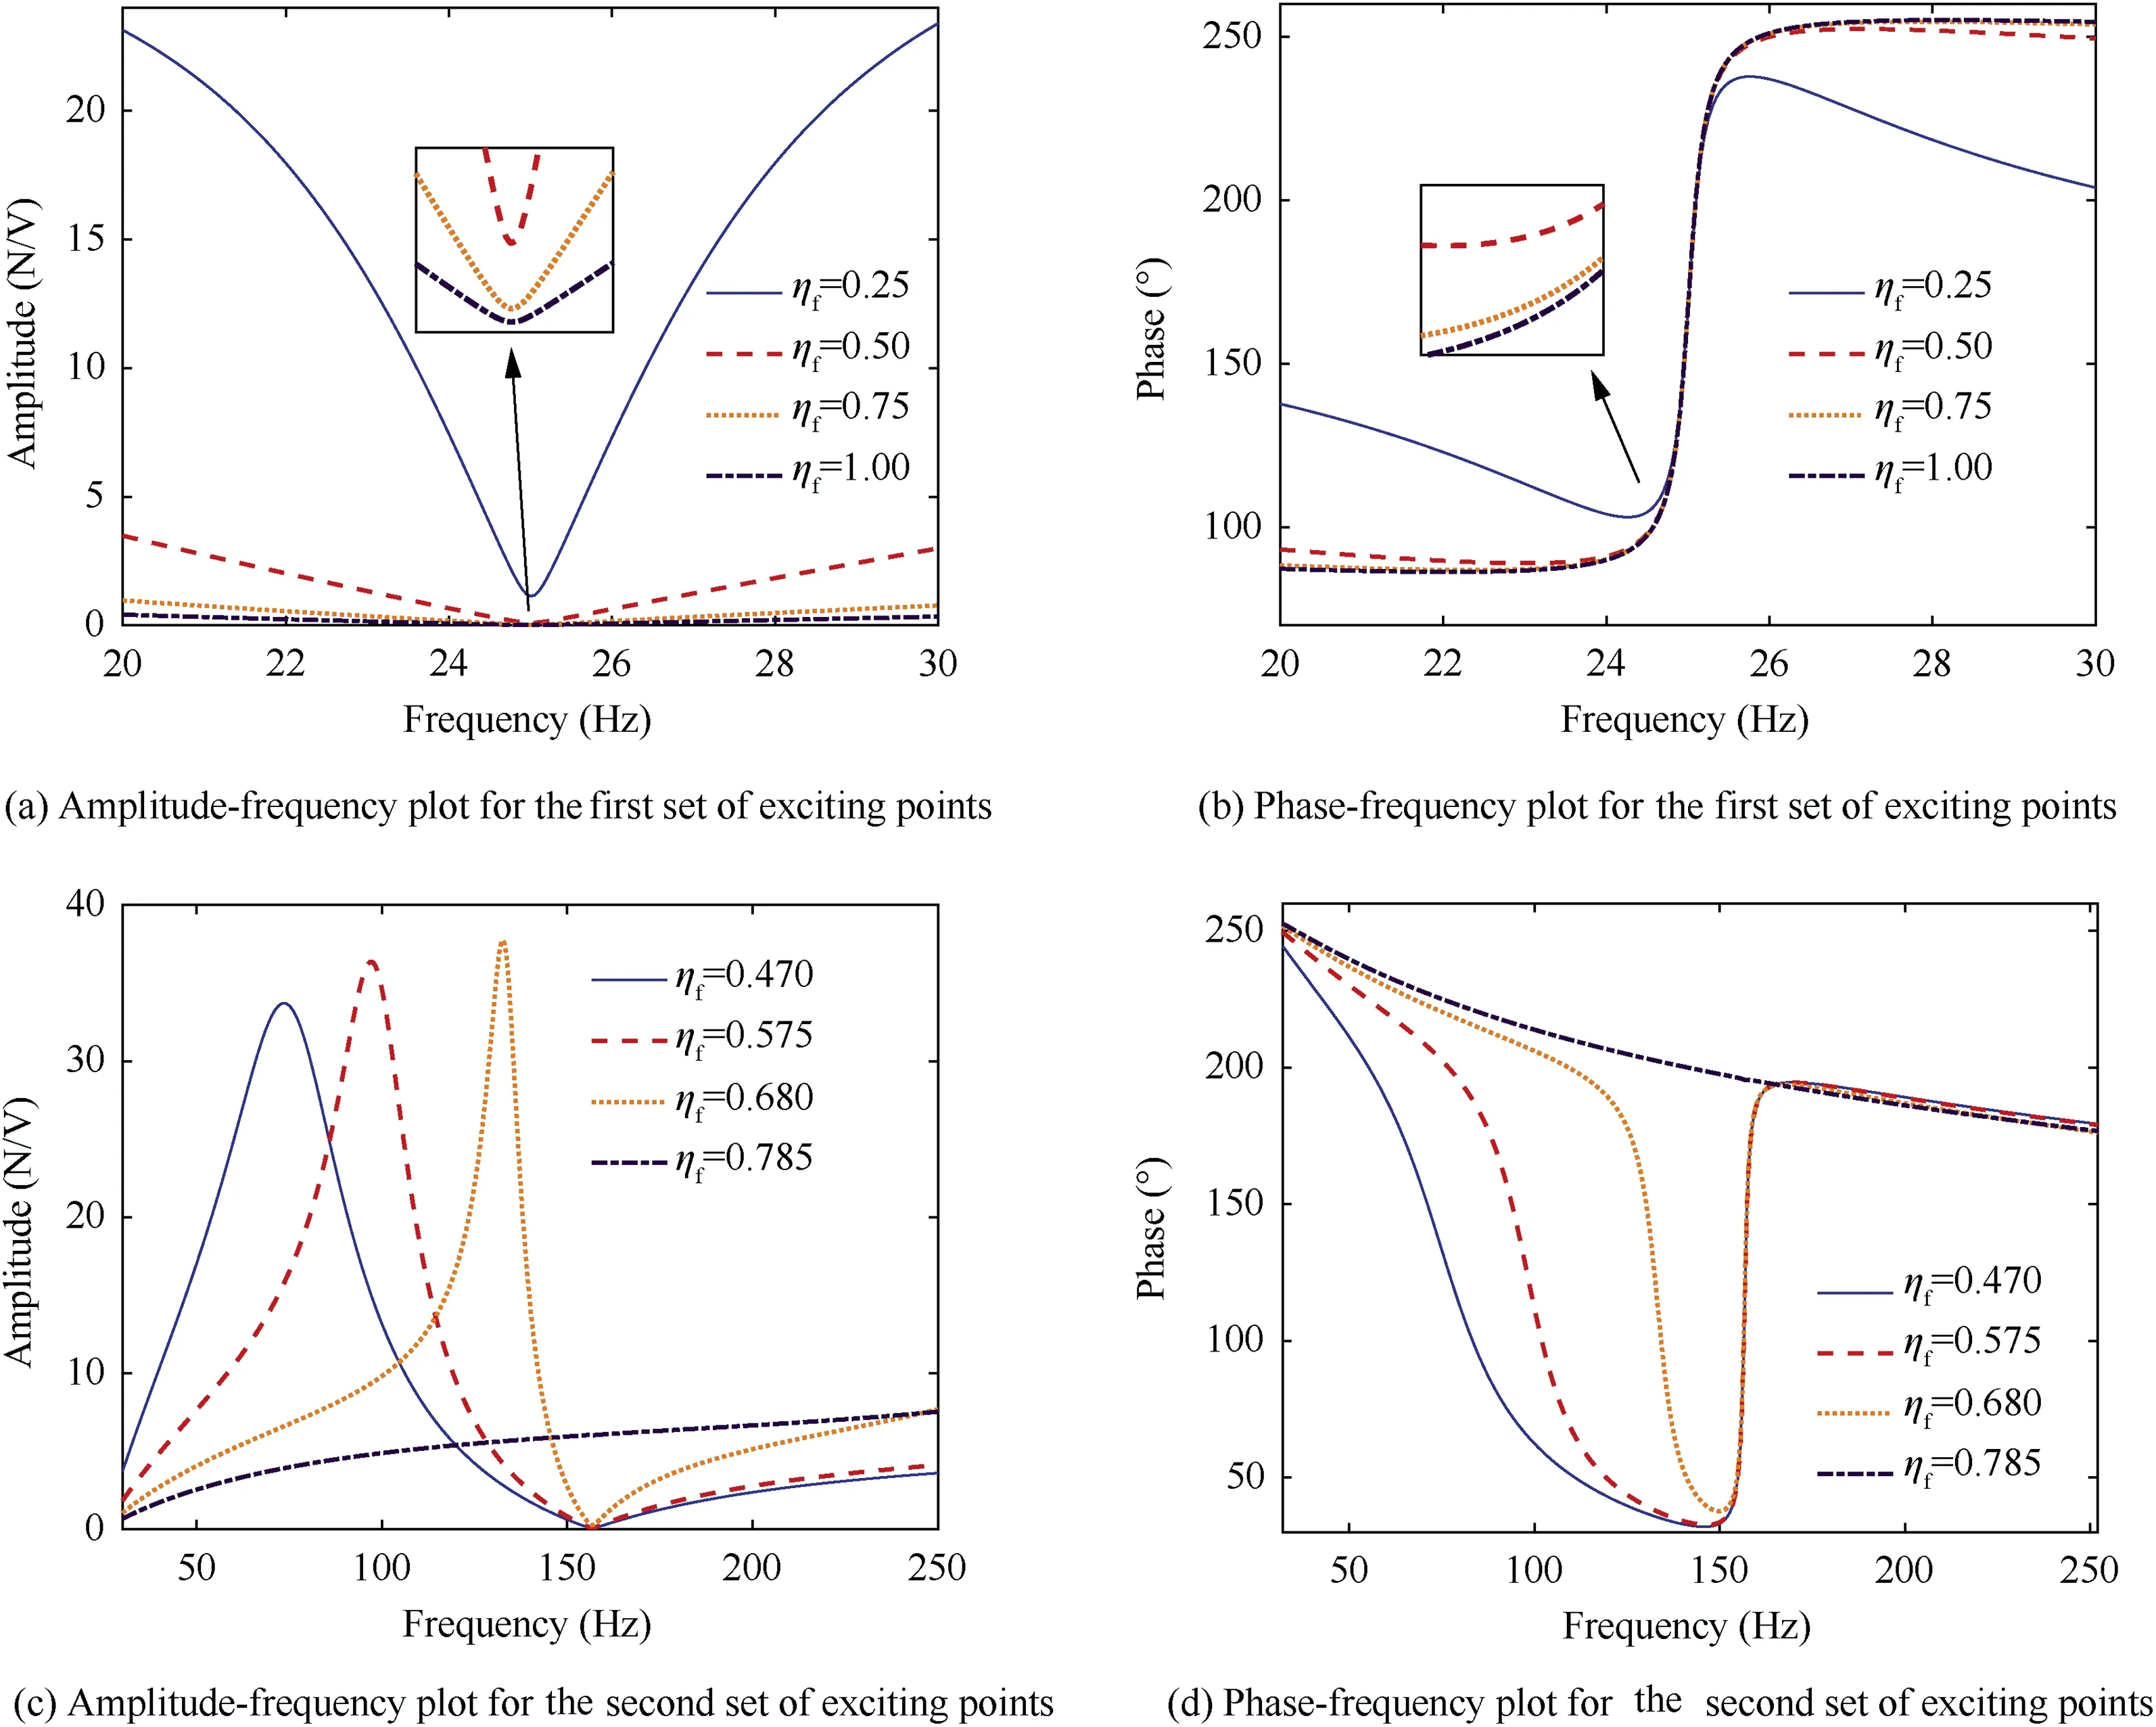
Fig. 10 The variation of the excitation force with the exciting point when the shaker operates in voltage mode.
Further,time histories and FRFs obtained by experiments and simulations are compared in Fig. 9 in terms of shaker force,coil current, and driving point displacement. Fig. 9(b) shows the FRF between the excitation force and coil current, in which it can be clearly seen that the force amplitude rises firstly and then drops with increasing frequency. The peak frequencies correspond to the natural frequencies of the 4 modes model(17.716 and 154.939 Hz),and the notch frequencies correspond to the natural frequencies of the beam alone (25.010 and 156.734 Hz). In the phase-frequency plot, the phase lag can be observed obviously near 25.010 and 156.734 Hz. For coil current, the current amplitude decreases at resonant frequencies of the cantilever beam in Fig. 9(c)-(d). As shown in Fig. 9(b) and (d), errors between the experiment and simulation results in both amplitude-frequency and phase-frequency plots are low near the first resonant frequency of the coupled shaker-beam system. However, the frequencies corresponding to the peak or notch values of the amplitude in simulations,mainly the second notch frequency, have deviated from those in experiments, as shown in the zoom-in plots. Fig. 9(e)-(f)show the simulated displacements at the exciting point are in good agreement with the experimental results.
Although there are still some discrepancies, a relatively good agreement has been obtained between the simulation and the experiment results.Comparison results have confirmed that the developed multi-mode model can describe the dynamic characteristics of the coupled shaker-cantilever beam system, which can be used for subsequent parametric studies.
5. Parametric studies for the excitation force
We will investigate the parameters affecting the excitation force transmitted by the shaker to the beam in this section.The variation characteristics of the excitation force with exciting point and system parameters are obtained when the shaker operates in voltage mode. Force transmissibility F/Fbetween the excitation force transmitted into the beam (F)and the reference electromagnetic force (F) generated on the armature is an essential factor that indicates which portion of the electromagnetic force Fhas been transmitted to the structure. When the shaker operates in current mode, the coil current of the shaker armature is constant, i.e., Fis constant, so force transmissibility can reflect the excitation force characteristics of the shaker operating in current mode. For comparison, force transmissibility is also analyzed in this section.
5.1. Influence of the exciting point on the excitation force
Considering that the nodes for the first two mode shapes of the cantilever beam are in general different, two sets of exciting points are selected, including the node and anti-node of each mode shape as far as possible. For the first set, exciting points are η= z/l = 1/4, 1/2, 3/4, and 1, where η= 1 corresponds to the anti-node of the first mode shape, and η= 0 is the clamped end corresponding to the node. The excitation frequency range is selected, covering the first resonant frequency of the cantilever beam. For the second set, the exciting points are η= 0.470, 0.575, 0.680, and 0.785, where 0.785 is at the node of the second mode shape, and 0.470 is in the vicinity of the anti-node. The excitation frequency range is selected, covering the second resonant frequency of the cantilever beam.
Fig.10 shows the amplitude-and phase-frequency curves of the excitation force applied by the shaker attached at different positions when the shaker is operating in voltage mode. The results for the first set of exciting points are depicted in Fig.10(-a)-(b). As the location of the exciting point gets close to the node of the first mode shape (η= 0), the amplitude of force increases, with decreasing the modal constant φ. Moreover,the phase deviation relative to the input voltage udecreases.It means that the phase lag decreases with decreasing the modal constant φif the excitation frequency is lower than f. If the excitation frequency is higher than f, the phase lead will still reduce.Eventually,the phase will approach 180°once the exciting point is at the node, i.e., η= 0. As noted in Fig. 10(c), different amplitude-frequency curves cross each other with the second set of exciting points η. The amplitude of force no longer monotonously increases with the decrease of the modal shape constant φat the same excitation frequency. However, the notch values of force still increase monotonously. Moreover, the peak frequencies of the amplitude-frequency curves are shifted toward f. In the phase-frequency plot Fig.10(d),the phase lag decreases covering a narrower bandwidth as the exciting point is close to the node of the second-order mode shape of the cantilever beam.Once the exciting point is precisely at a node, i.e., the purple dashed-dotted line in Fig. 10(c)-(d), the variations of the excitation force in amplitude and phase are negligible, and even the peak/notch will no longer appear in these curves.
Fig.11 shows the amplitude-and phase-frequency curves of excitation force applied by shaker attached at different positions when the shaker is operating in current mode. Similar phenomena are observed as those in Fig.10.As the modal constant φdecreases, the notch value of the force amplitude will increase, and the peak frequency in amplitude-frequency curves is shifted toward the corresponding resonant frequencies near f(i = 1,2). The phase will approach 0° eventually,and the phase lag decreases. Comparing Fig. 11(a) with Fig. 11(c), when the excitation frequency is close to the first resonant frequency of the cantilever beam, the amount of the force transmissibility approaches 1, indicating that the majority portion of the electromagnetic force Fis used to excite the cantilever beam. As the excitation frequency increases in Fig. 11(c), the amplitude of force transmissibility is far less than 1.Thus,only a small portion of the electromagnetic force Fis used to drive the cantilever beam,with a large part driving the shaker armature.
Through the above analysis, when the exciting point gets close to a node for a concerned mode shape (by definition,φequals 0 at this point),the modal shape constant is reduced.As described in Eq.(17),the contributions of the shaker to the modal inertia, damping, and stiffness of the coupled system decrease. Thus, the resonant frequencies of the coupled systems are shifted to the corresponding resonant frequencies of the beam. And the variations of the phase of the excitation force are reduced. On the contrary, if zis at an anti-node,the contributions increase significantly, and the phase of the force can be varied considerably.

Fig. 11 Variation of excitation force transmissibility with exciting point.
5.2. Influence of system parameters on the excitation force
According to the estimated parameters of the coupled model in Section 3 and assuming that the exciting point η= 1/4, the non-dimensional parameters are calculated using Eq. (22)and then listed in Table 6. This section aims to perform parametric studies on the excitation force, attempting to evaluate the variation characteristics of the excitation force with system parameters, i.e. mass ratio M, stiffness ratio K, damping ratio C, electrical damping ratio Rand electrical stiffness ratio L. When one set of these parameters are changed,e.g., M(i = 1,2,∙∙∙,4), the remaining parameters remain unchanged.
For a convenient comparison, the frequency axes of the amplitude- and phase-frequency curves are normalized by f.The ratio f/fholds about 6.27. When the shaker operates in current mode, the coil current of the shaker is constant,so the influences of R and L need not be considered.Therefore,only the influences of mass ratio M, stiffness ratio Kand damping ratio Con the excitation force transmissibility will be analyzed in Section 5.2.point is no longer at M= K(0.0274), where the resonant frequency of loaded shaker fis equal to f. It is noted in Table 5 that K/M<1(i.e.f/f<1)holds for the five values of Min this case. Thus, the peak frequency of force amplitude will be lower than the notch frequency when the excitation frequency is close to f. Besides, the turning point of Mis smaller than 0.1840, therefore the notch value throughout decreases with the increase in MMeanwhile,the peak frequency moves towards f.
In the phase-frequency plot Fig. 12(b), the phase lag produced for the excitation frequency being lower than the resonant frequency of the cantilever beam fcan be increased with increasing the mass ratio M. In contrast, the phase lead for the excitation frequency being higher than fwill be decreased.

Table 6 Non-dimensional system parameters of the coupled shaker-beam system.
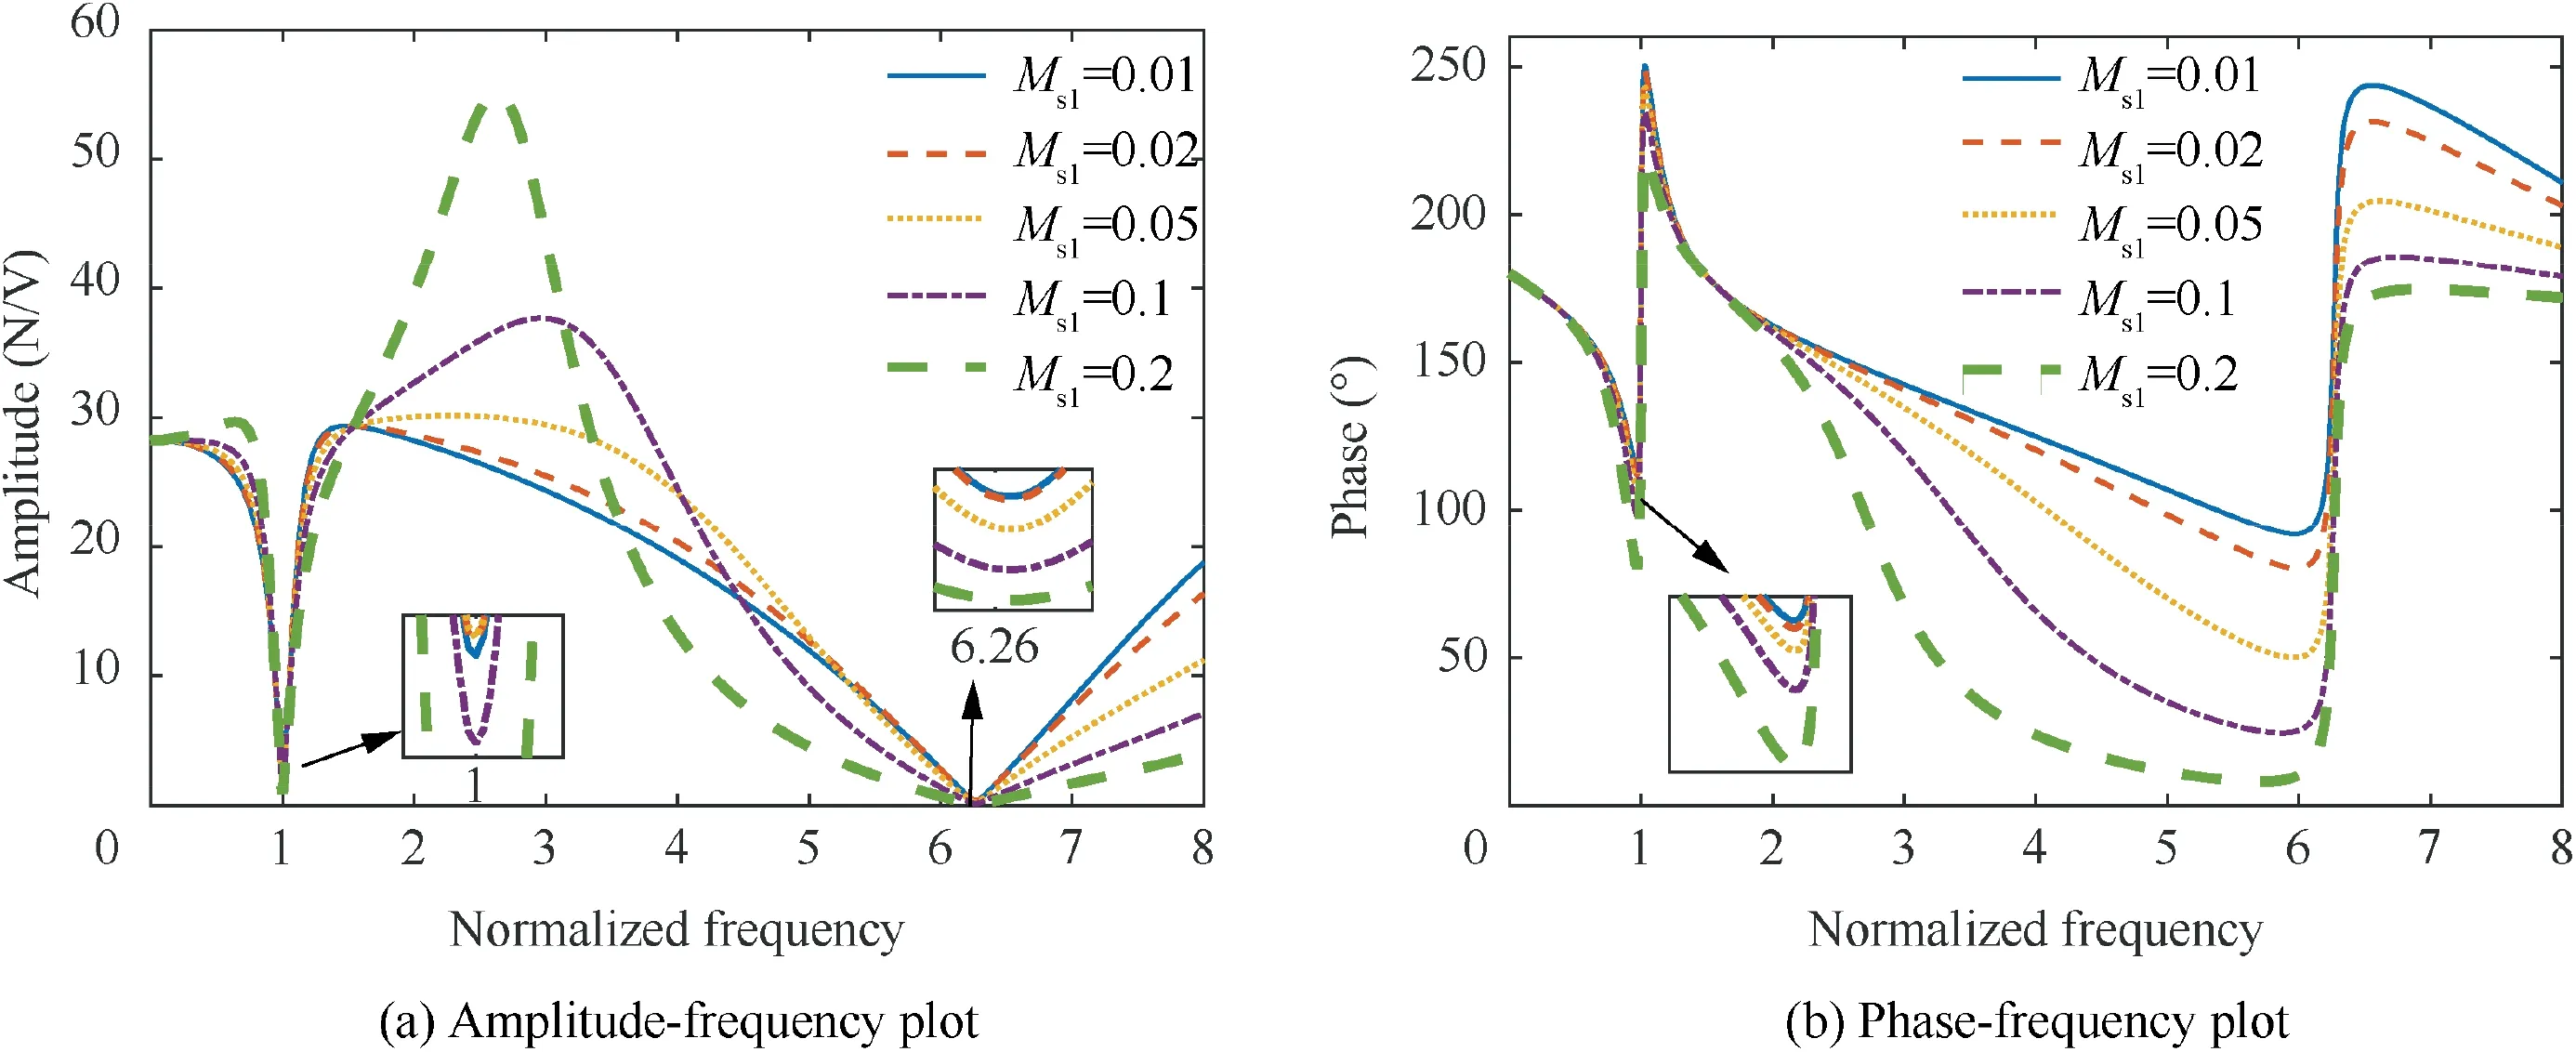
Fig. 12 Variation of excitation force with mass ratio Msi when shaker operates in voltage mode.
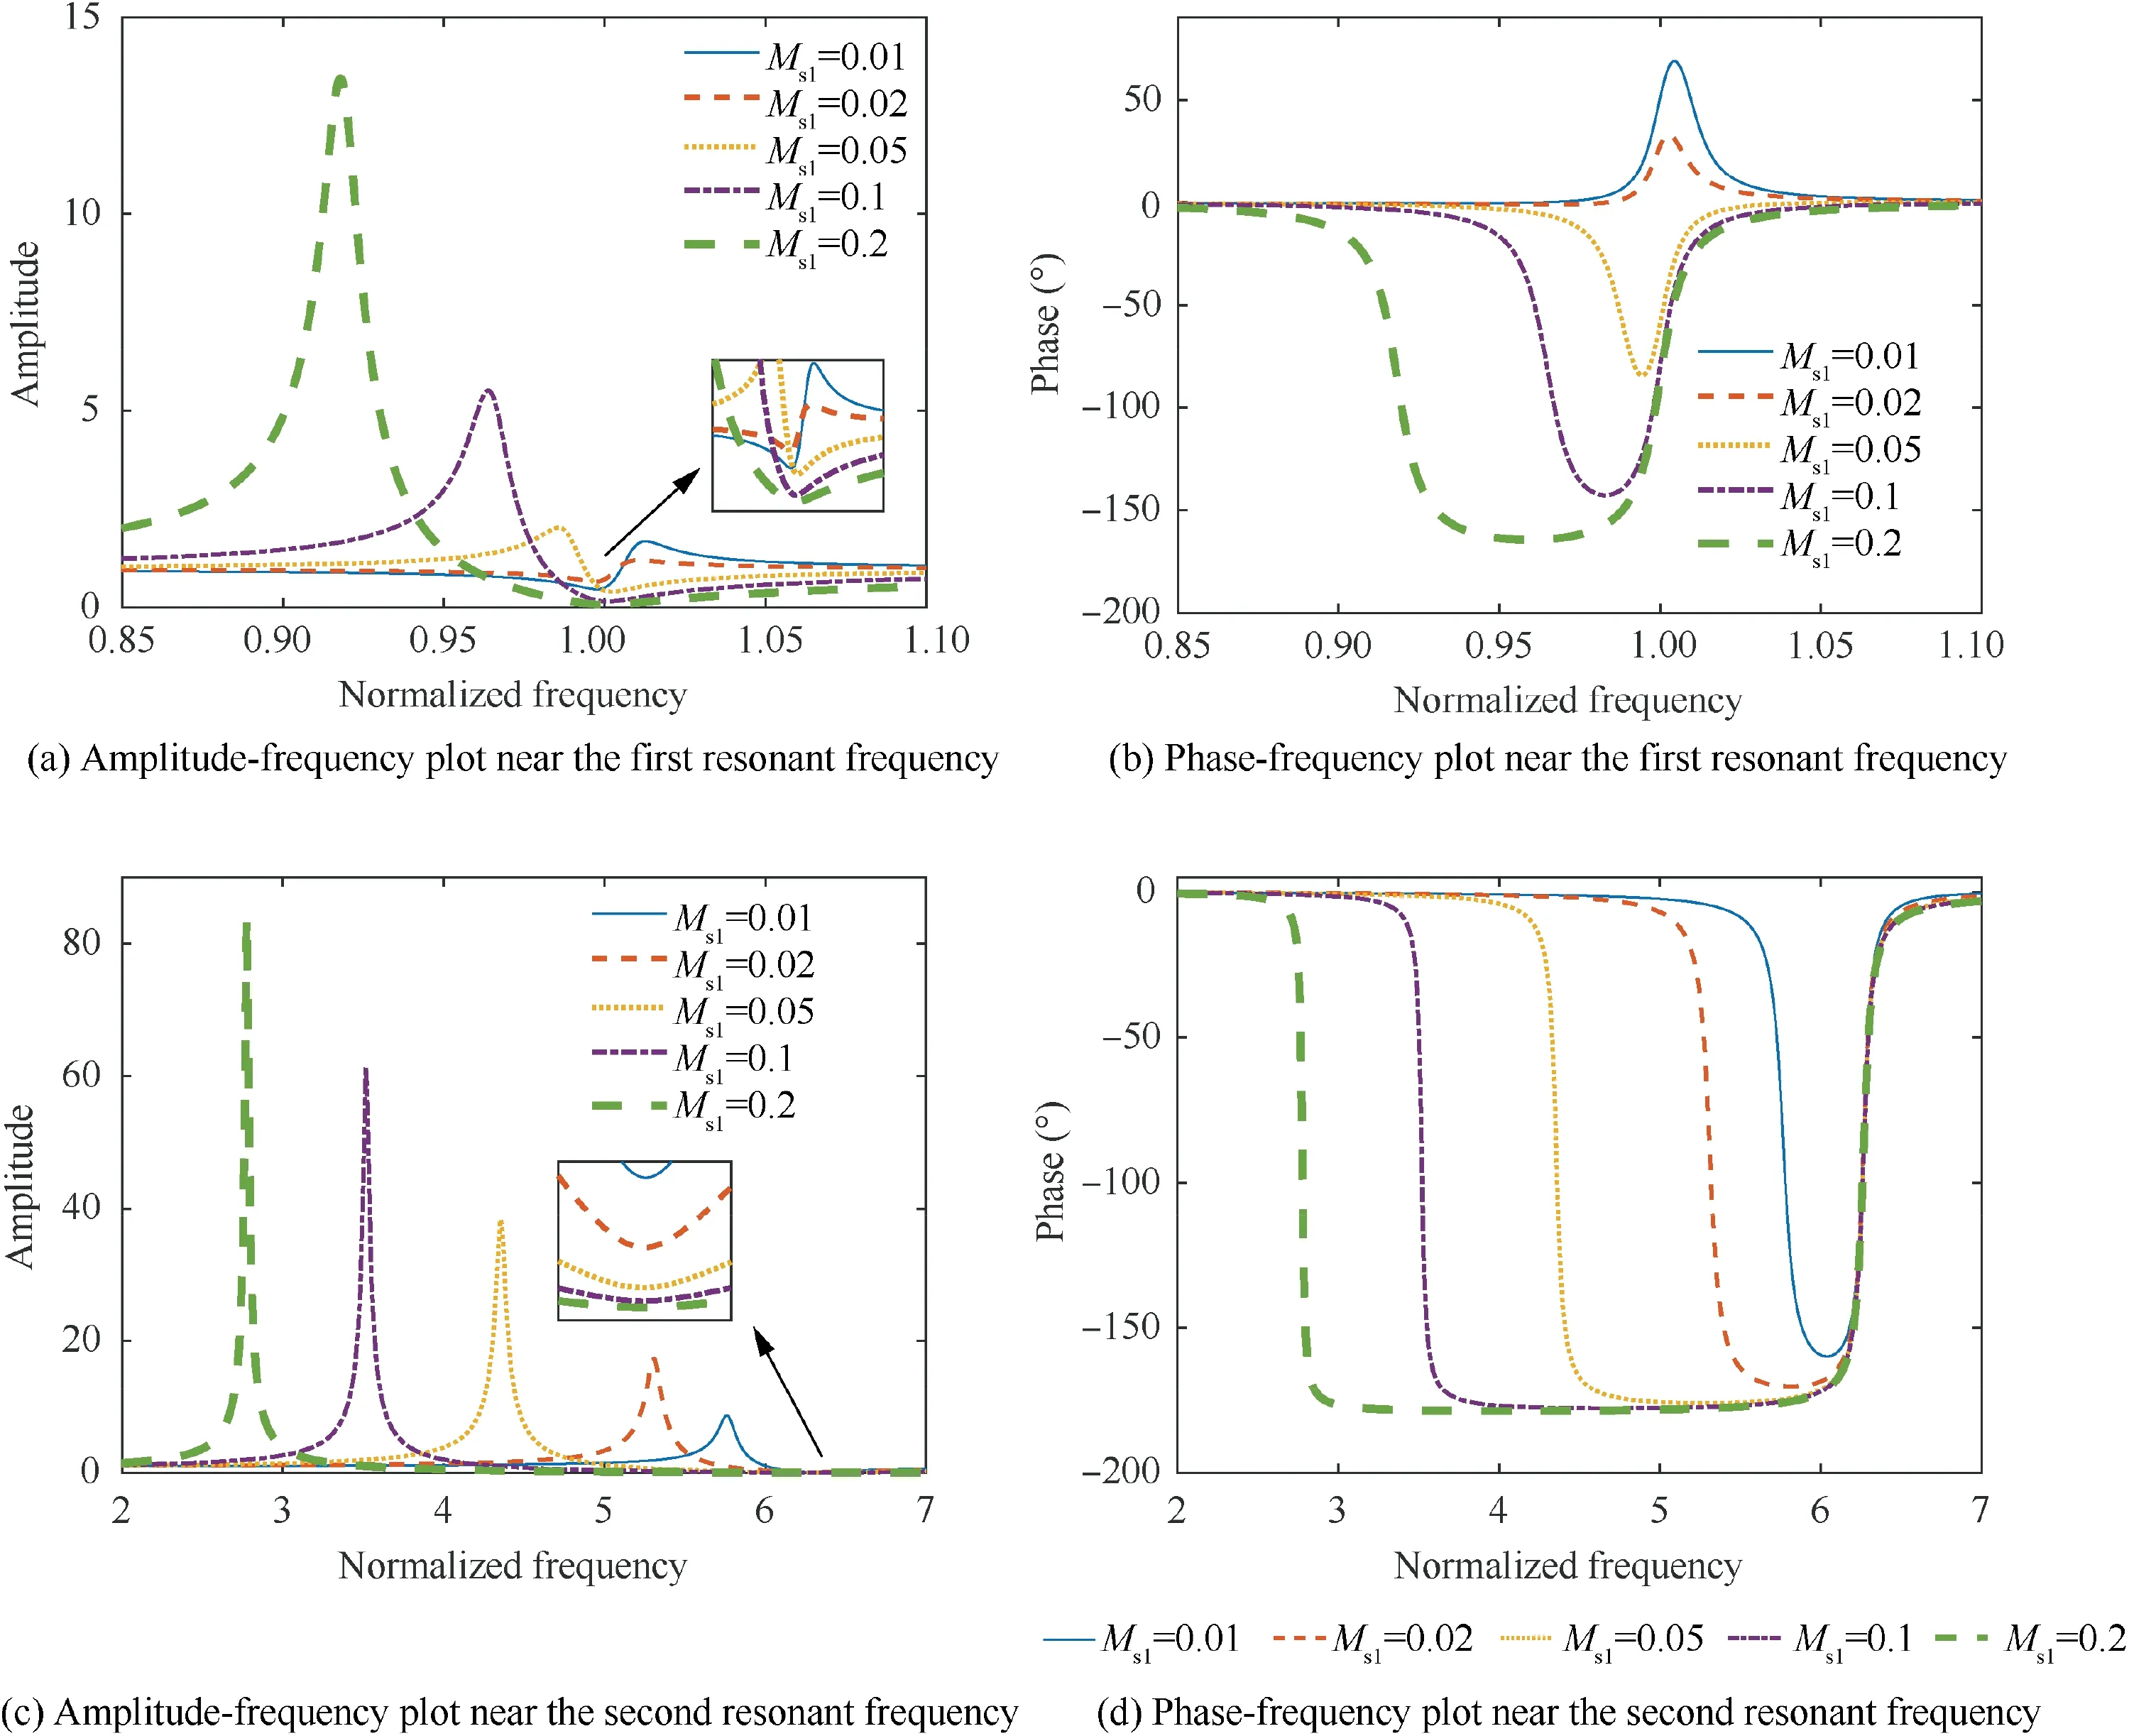
Fig.13 The variation of the excitation force transmissibility with mass ratio Msi at frequencies near the first two resonant frequencies of the cantilever beam.
Fig.14 shows the variation of the excitation force with stiffness ratio Kwhen the shaker operates in voltage mode.Kis set with five values (0.01, 0.05, 0.1, 0.5, 1, respectively), while the corresponding K(i=2,3,4)is changed accordingly.With the increase in stiffness ratio K, the notch value of force amplitude firstly increases and then decreases at frequencies near f, where the turning point is no longer at K= M(0.0756). When K/Mis larger than 1 (i.e., f/f> 1), the peak frequency of amplitude will be higher than the notch frequency, i.e., the purple dashed-dotted line and green thick dashed line in the figure. The peak value of amplitude increases, and the peak frequency is shifted to a higher value toward f. It needs to be emphasized that the values of Kare altered as 0.0047, 0.0234, 0.0468, 0.2342, and 0.4684,respectively. All of them are lower than M(1.3913 in this case), i.e., K/M< 1, so the peak frequency of amplitude will be lower than the notch frequency. With increasing the stiffness ratio K, the notch value can be increased, but the peak value will be decreased.
In the phase-frequency plot Fig.14(b),with increasing stiffness ratio K, the phase lag can be decreased when the excitation frequency is lower than the resonant frequency of the cantilever beam f. In comparison, the phase lead will be increased when the excitation frequency is higher than f.
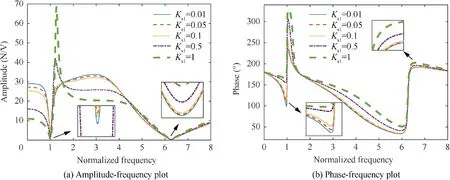
Fig. 14 The variation of the excitation force with stiffness ratio Ksi when the shaker operates in voltage mode.
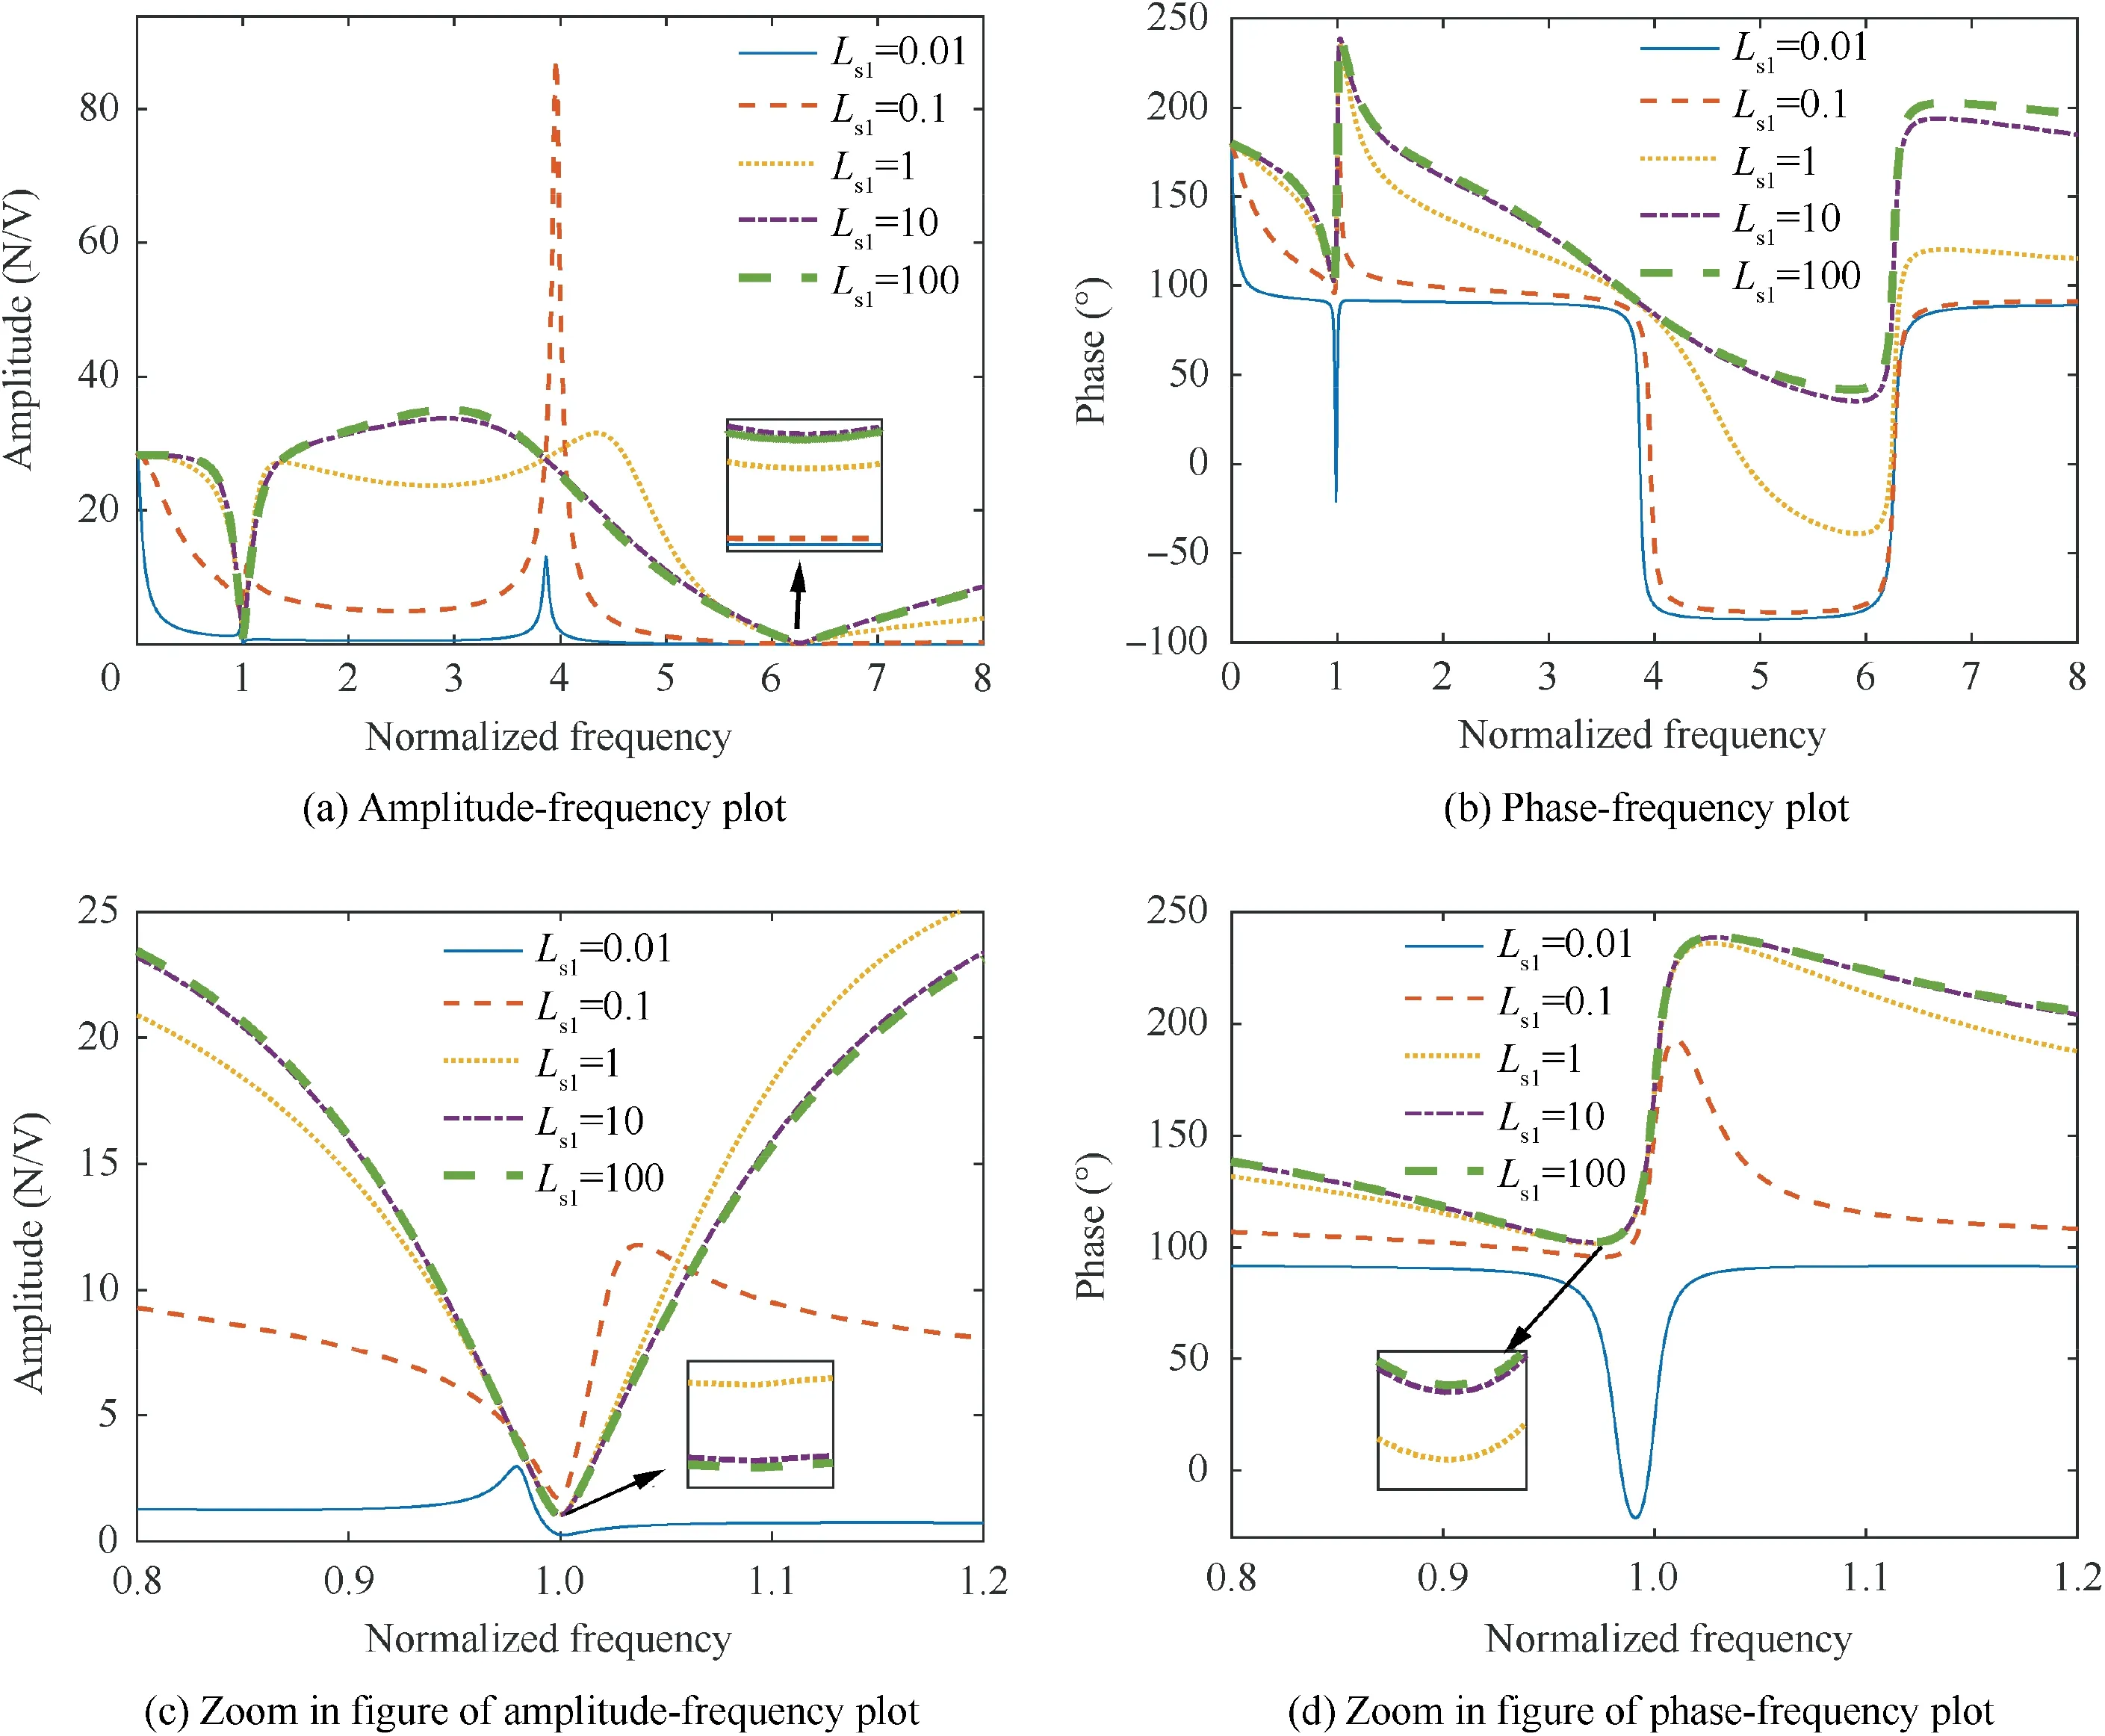
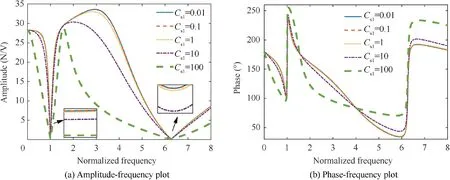
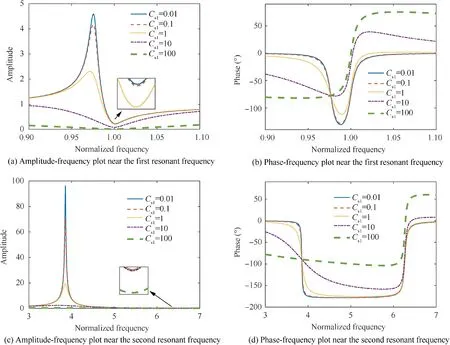
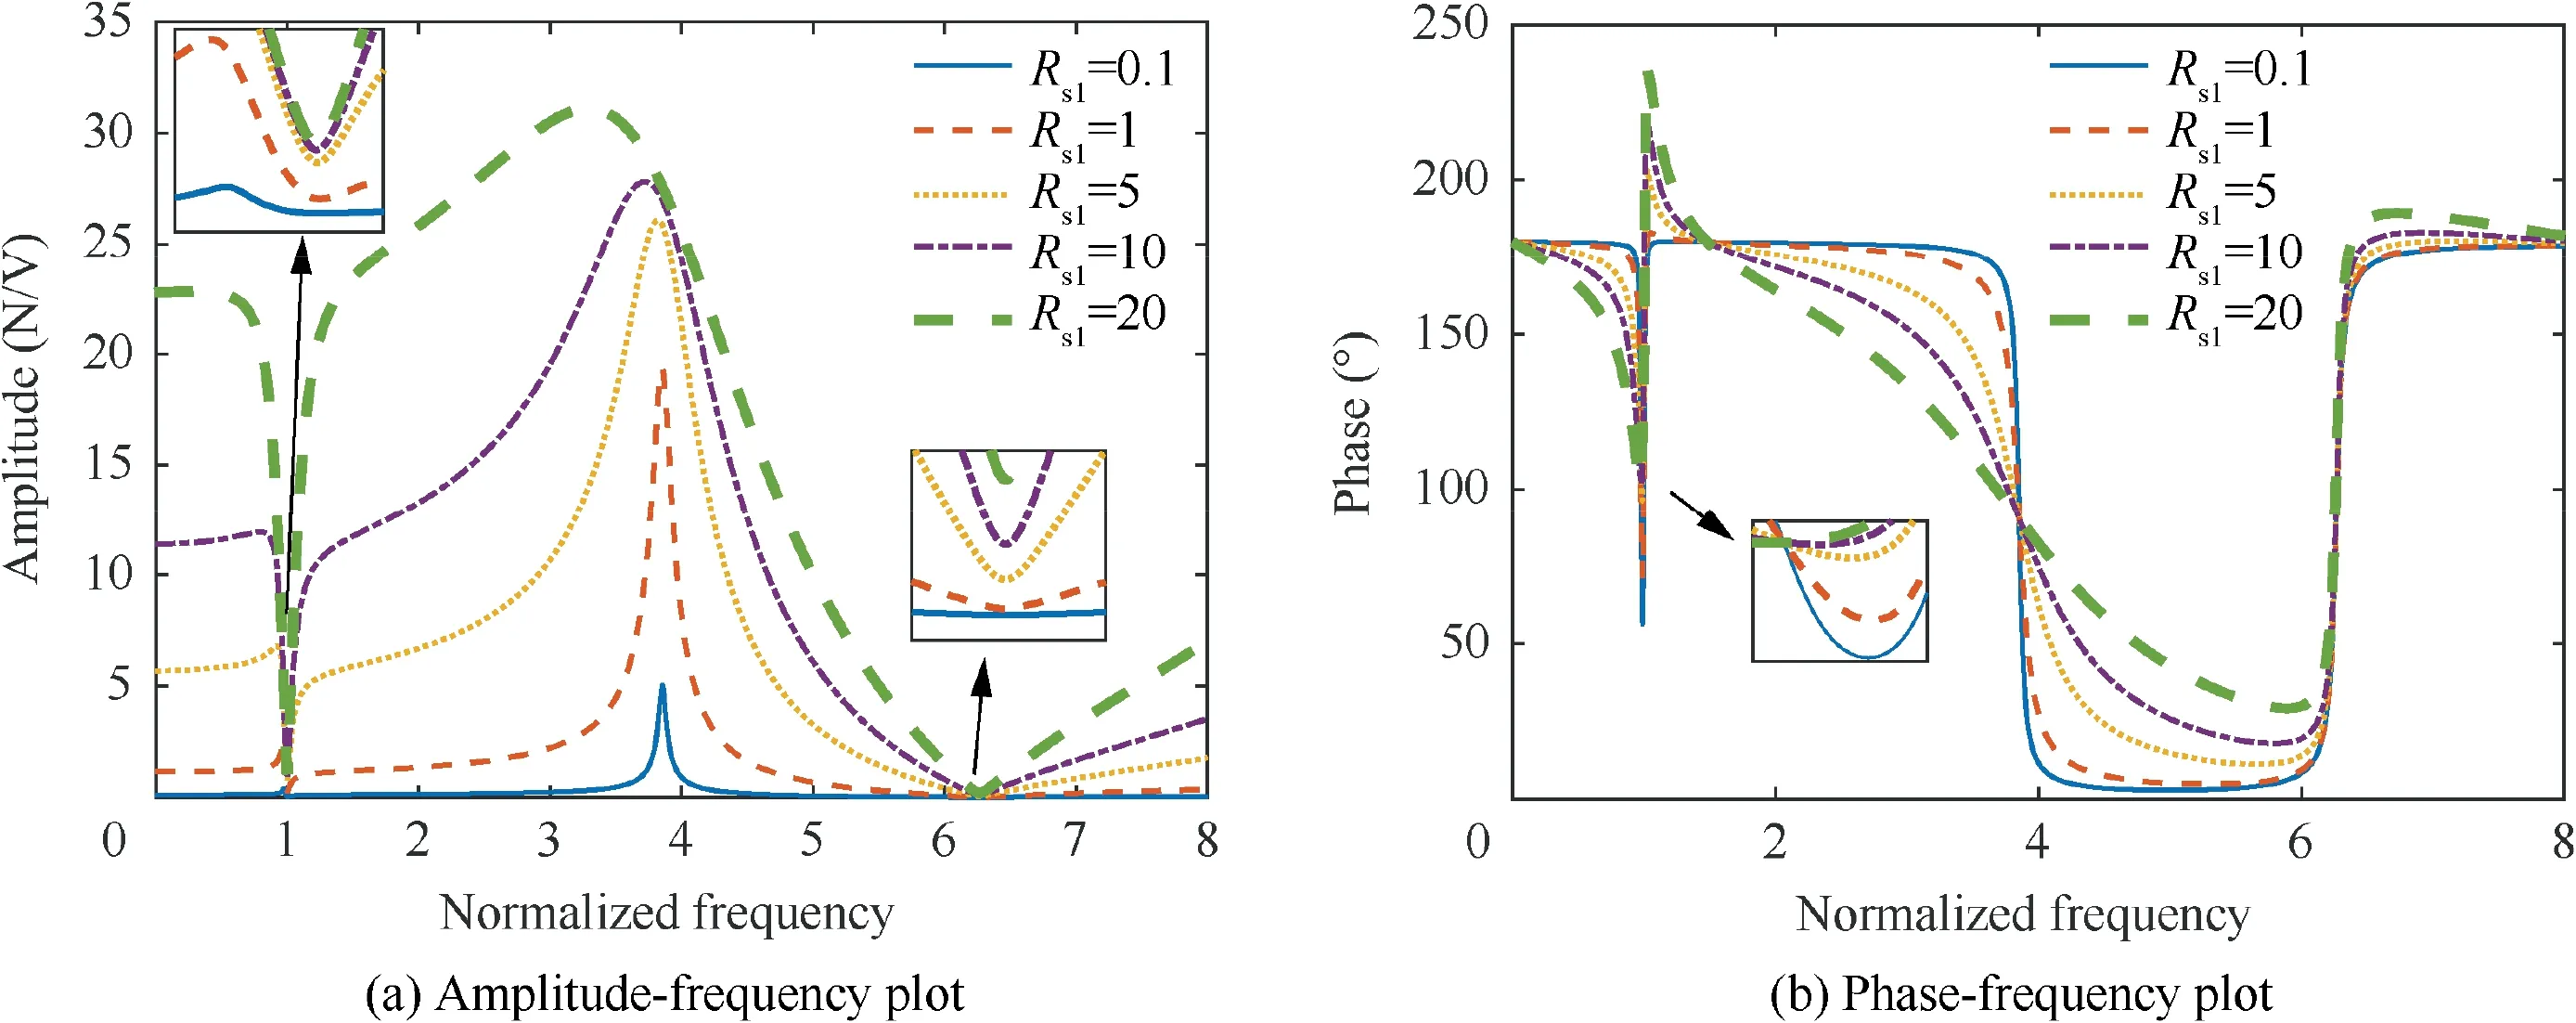
Fig.15 shows the variation of the excitation force with stiffness ratio Kwhen the shaker operates in current mode. With the increase in stiffness ratio K, the notch value of force amplitude firstly increases and then decreases at frequencies near fin Fig. 15(a), where the turning point is at K= M(0.0756). When K/M< 1, depicted as the blue solid line and red dashed line,the variations of amplitude and the phase lag decrease with the increase in K. When K/M> 1, the variations of the amplitude and phase become more drastic with the increase of the stiffness ratio K. The notch values decrease,but the phase lead increases.In the case of K Fig.16 shows the variation of the excitation force with electrical stiffness ratio Lwhen the shaker operates in voltage mode. Lis set with five values (0.01, 0.1, 1, 10 and 100,respectively),while the corresponding values of Lare altered as 0.0047, 0.0468, 0.4684, 4.6839 and 46.8391, respectively.With the increase of the electrical stiffness ratio L, the notch value of force amplitude firstly increases and then decreases at frequencies near f. In the phase-frequency curves, with increasing electrical stiffness ratio L, the phase lag can be decreased when the excitation frequency is lower than the resonant frequency of the cantilever beam f. But the phase lead will be increased when the excitation frequency is higher than f. Particularly when the electrical stiffness is small, the excitation force’s peak will exist in Fig. 16(c), which explains the phenomenon at frequencies near fin Fig.7,where the electrical stiffness ratio Lequals 403.8177. Fig. 17 shows the variation of the excitation force with damping ratio Cwhen the shaker operates in voltage mode.Cis altered with five values (0.01, 0.1, 1, 10, and 100), while the corresponding Cis increased accordingly. With the increase in damping ratio C, the notch value of force amplitude decreases. For the phase-frequency curves, the effects of damping ratio Cand Con the force differ from each other:with increasing C, the phase variation is increased throughout; with increasing C, the phase lag is decreased when the excitation frequency is lower than the second-order resonant frequency of the cantilever beam f.In contrast,the phase lead is increased when the excitation frequency is higher than f. Fig. 18 shows the variation of the excitation force with damping ratio Cwhen the shaker operates in current mode.With the increase in damping ratio C,the peak and notch values of force amplitude decrease.When the excitation frequency is lower than the resonant frequency of the cantilever beam f,with increasing C, the phase lag with a broader band is decreased. When the excitation frequency is higher than the f, the phase lead is increased. Fig.19 shows the variation of the excitation force with electrical damping ratio Rwhen the shaker operates in voltage mode. Ris altered (0.1, 1, 5, 10, and 20, respectively), while the corresponding Ris increased accordingly. With the increase in R,the notch value and peak value of force amplitude increase. In the phase-frequency curves, with increasing damping ratio R, the phase lag can be decreased when the excitation frequency is lower than the resonant frequency of the cantilever beam f. By compassion, the phase lead will be increased when the excitation frequency is higher than f.Similarly, when the electrical damping ratio Ris small, the excitation force’s peak will exist. Fig. 15 Variation of excitation force transmissibility with stiffness ratio Ksi at frequencies near the first two resonant frequencies of cantilever beam. Fig.16 The variation of the excitation force with electrical stiffness ratio Lsi when the shaker operates in voltage mode and its zoom in figures near the first resonant frequency of beam. Fig. 17 Variation of excitation force with damping ratio Csi when shaker operates in voltage mode. When the shaker operates in current mode, the influence rules of different system parameters on the excitation force are different: 1) the effects of mass ratio Mand stiffness ratio Kon the excitation force depend on the ratio of Kto M.When K/M< 1, the variation of force amplitude and its phase lag will be decreased by increasing K/M. On the contrary, when Kis larger than M, the amplitude and phase variation are increased.Therefore,if the ratio of Kto Mis close to 1, the variation of the force amplitude and phase in the concerned frequency band is minimal, which is consistent with the conclusion obtained in Ref. 21. 2) with the increase in damping ratio C,the peak or notch values of the force amplitude decrease. When the shaker operates in voltage mode, the effects of different system parameters on the excitation force are different: Fig. 18 Variation of excitation force transmissibility with damping ratio Csi at frequencies near the first two resonant frequencies of cantilever beam. Fig. 19 Variation of the excitation force with electrical damping ratio Rsi when the shaker operates in voltage mode. 1) increasing mass ratio M, stiffness ratio K, or electrical stiffness ratio Lwill make the notch value of force amplitude increase firstly and then decrease,where the turning point is not equal to K/M= 1,which is different from the characteristics of the excitation force when the shaker operates in current mode. Decreasing damping ratio Cor increasing electrical damping ratio Rwill increase the notch value of force amplitude. 2) The phase lag produced for the excitation frequency being lower than the resonant frequency of the cantilever beam fcan be decreased by increasing stiffness ratio K, electrical stiffness ratio L, damping ratio C, and electrical damping ratio Ror by decreasing mass ratio M. In comparison, the phase lead will be increased when the excitation frequency is higher than f. Compared with C, the damping ratio Chas a different effect on the phase. With the increase in C, the phase variation is increased throughout. In this paper, the excitation force characteristics of a single electrodynamic shaker actuating a cantilever beam are revealed and investigated. (1) A coupled shaker-MM beam model is established to derive the excitation force formula and validated by experiments. Comparison results showed that the simulation results based on the coupled shaker-SM beam model have a poor agreement with experimental results.In contrast, the coupled shaker-MM beam model can reflect the excitation force characteristics accurately.Therefore,the multi-mode of the cantilever beam should be introduced in the coupled shaker-beam model. (2) Parametric studies show that the influences of system parameters on the excitation force applied by the shaker in voltage mode differ from that in current mode: (A)when K/M= 1, the amplitude variation of shaker force in voltage mode is not minimal, which will be affected by L; (B) the effect of damping coefficient C(i=1,2)on the phase of the excitation force relative to the input voltage of the shaker is different with each other;(C)only when the electrical damping ratio Rand electrical stiffness ratio Lis small, there will exist the peak in the excitation force amplitude.Meanwhile,when the exciting point is far away from a node for a concerned mode shape,the larger the mode shape constant,the more considerable the variation degree in the phase of force will be. (3) In the GFST,the exciting points have been optimized in order to simulate the distributed unsteady aerodynamic forces through a finite number of concentrated loads equivalently.Once the exciting point is located far away from the node of a specific mode shape,the considerable shaker force varying with frequency will enlarge the discrepancy between practical excitation force and the desired one,which reduces the test accuracy dramatically. Thus, it is crucial to compensate the force for improving the test accuracy, especially when the shaker is operating in voltage mode. The proposed coupled shaker-MM beam model can be further used for the compensation. The authors declare that they have no known competing financial interests or personal relationships that could have appeared to influence the work reported in this paper. This study was co-supported by the Overseas Expertise Introduction Project for Discipline In-novation (111 Project,BP0719007) and the National Natural Science Foundation of China (No. 12002280). The motion equation of the coupled shaker-beam model and its boundary conditions will be derived by the charge-displacement formulation of Hamilton’s Principle: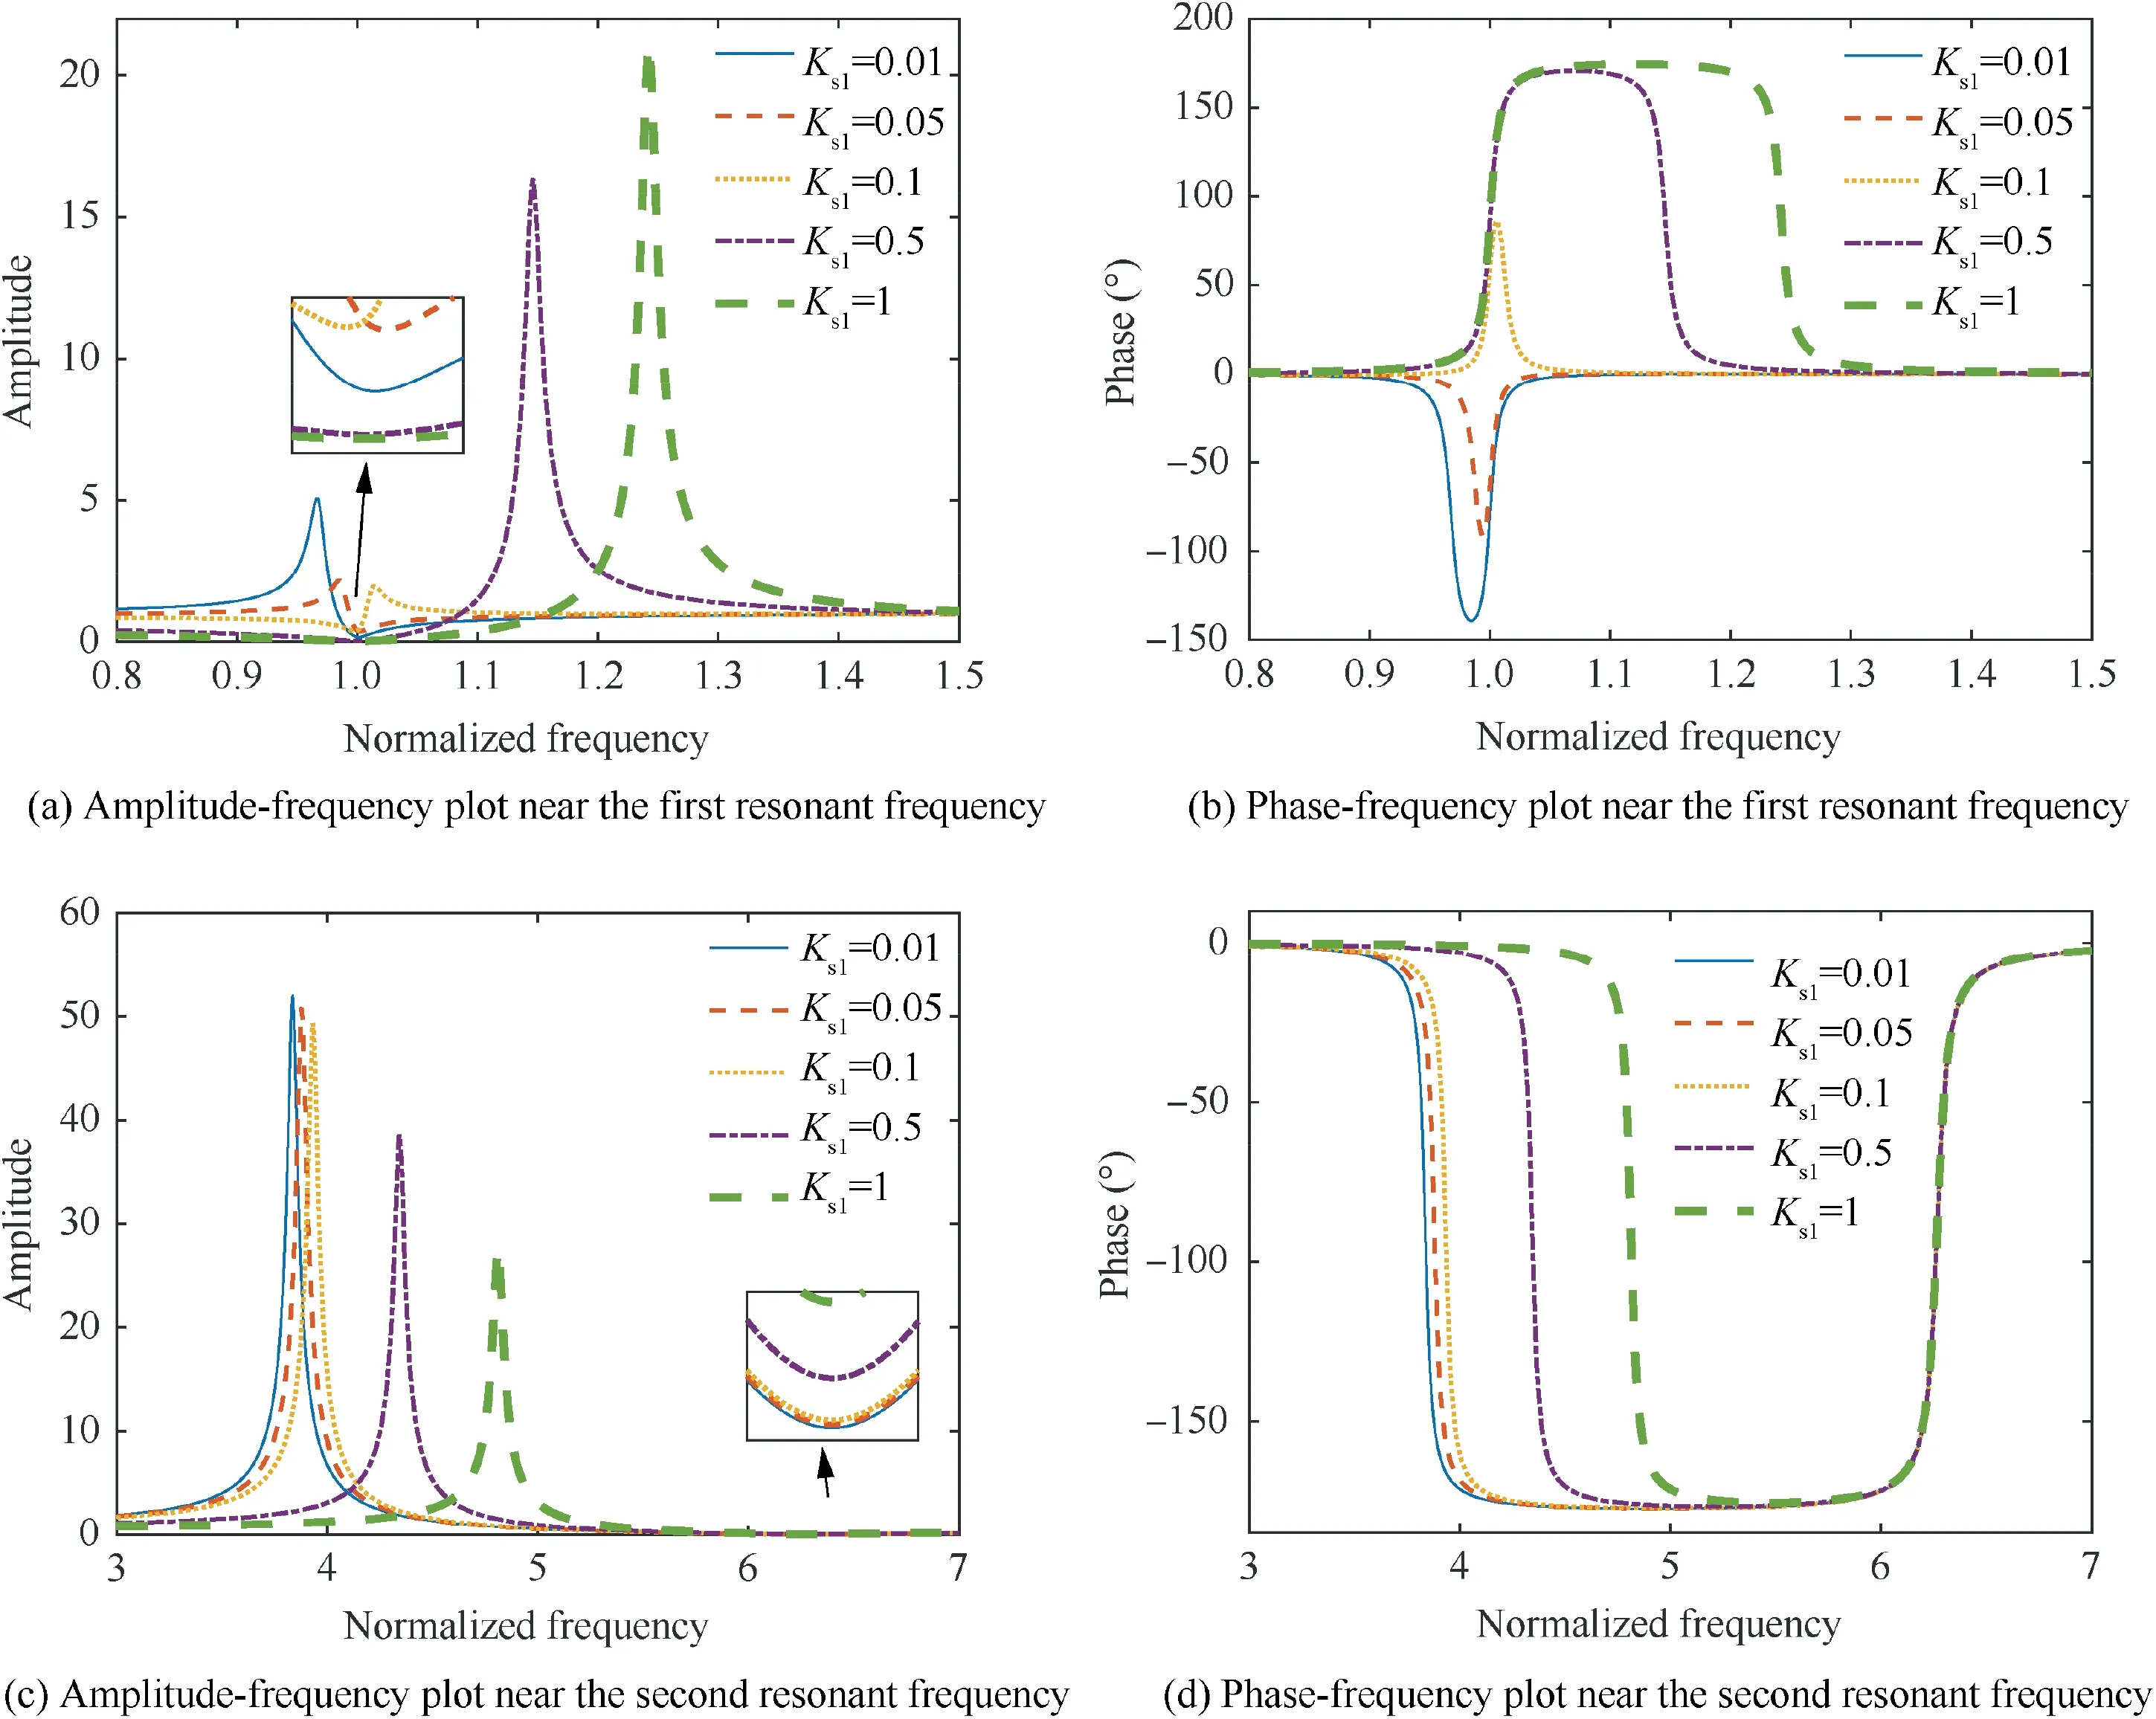
6. Conclusions

 Chinese Journal of Aeronautics2022年7期
- Chinese Journal of Aeronautics的其它文章
- An online data driven actor-critic-disturbance guidance law for missile-target interception with input constraints
- Smooth free-cycle dynamic soaring in unspecified shear wind via quadratic programming
- Active and passive compliant force control of ultrasonic surface rolling process on a curved surface
- High dynamic output feedback robust control of hydraulic flight motion simulator using a novel cascaded extended state observer
- Composite impact vector control based on Apollo descent guidance
- Optimal trajectory design accounting for the stabilization of linear time-varying error dynamics
