Investigation on low total temperature combustion characteristics of kerosene-fueled supersonic combustor
Jianping LI, Kai WANG, Guiqian JIAO, Zilong LIAO, Jindong LI
School of Engine and Energy, Northwestern Polytechnical University, Xi’an 710072, China
KEYWORDS Blockage ratio;Combustion characteristics;Combustion efficiency;Kerosene equivalence ratio;Low temperature
Abstract In this paper, the combustion characteristics of kerosene-fueled supersonic combustor under the conditions of Mach number 2.0, the total temperature at 700 K and the total pressure at 520 kPa(simulated flight Mach number at 3.5)were studied by using the flame stabilizing method of cavity and strut from three aspects such as blockage ratios,kerosene equivalence ratios,location and quantity of injection holes.The results showed that:(A)The combustor with the strut realized the independent and stable combustion of kerosene. The combustion-induced back pressure in the block test with blockage ratio of 20%and 10%destroyed the inlet flow conditions;while the blockage ratio was 7.3% and 5%, the incoming flow conditions when kerosene was burned stably were not destroyed.(B)The kerosene Equivalence Ratio(ER)was more likely to be disturbed upstream than the induced back pressure when it rose,and an excessively high-ER would reduce the combustion efficiency; when the equivalence ratio was constant, the combustion efficiency of the blockage ratio of 7.3% was higher than the blockage ratio of 5%. The combustion efficiencies were 0.86(ER=0.13) and 0.78(ER =0.19) when the blockage ratio was 5%, respectively; the combustion efficiencies were 0.89(ER=0.16)and 0.82(ER=0.19)when the blockage ratio was 7.3%,respectively; the combustion efficiencies were 0.51 (ER = 0.25), 0.81 (ER = 0.3), 0.65 (ER = 0.34) and 0.62(ER=0.42)when the blockage ratio was 20%,respectively.(C)The porous injection provided behind the strut was beneficial to the atomization of kerosene and improved the combustion efficiency of kerosene; the second injection after the cavity would reduce the combustion efficiency due to insufficient oxygen and combustion space.This study expanded the working range of ramjet and provided a reference fuel injection scheme for Turbine-Based Combined Cycle(TBCC)engine.ⓒ2021 Chinese Society of Aeronautics and Astronautics.Production and hosting by Elsevier Ltd.This is an open access article under the CC BY-NC-ND license(http://creativecommons.org/licenses/by-nc-nd/4.0/).
1. Introduction
The Turbine-Based Combined Cycle (TBCC) propulsion system is a combination of a turbine engine and a ramjet engine.It can achieve a complete transition from low-speed to highspeed flight,and has better performance and safety than rocket propulsion. Due to the limitations of various aerodynamic parameters, most scramjets are difficult to work under flight Mach number 4.0.Therefore,whether the effective connection between the speed and thrust can be achieved has become the biggest technical difficulty of the TBCC engine.
Since the 1970s, the United States has successively carried out multiple research projects including IFTV, HRE, and SCRAM.The scramjet missile (SCRAM)program had made a major technological breakthrough in the design of supersonic combustors.The success of the X-43A flight test validated the research results that the United States had made in the field of scramjet for more than 40 years,which greatly promoted the research work of subsequent hypersonic aircraft. The X-51A also provided a possible platform and technical support for the United States to achieve rapid global strikes. Its nearspace hypersonic flight capability had excellent penetration advantages and could easily break through the defenses of current advanced air defense systems.Russia was also at the international leading level in the research of hypersonic flight technology.Among them,the Khofod plan was Russia’s earliest scramjet flight test plan. This was the first time in the world that the conversion of scramjet from subsonic combustion mode to supersonic combustion mode during the flight of Mach number 3.5–6.5 had been completed.In addition to the United States and Russia, other countries in the world were also closely following the footsteps and actively carrying out research on hypersonic technology. As early as the 1960s,France carried out the mechanism and test research of scramjets,and then actively cooperated with Germany and the European Missile Group and made significant progress.After the UK disclosed the detailed development plan of the SABRE engine 1/4 scale verification machine in September 2016, it announced that it was building a test facility for the first ground test of the SABRE engine.
In a scramjet, the position of the shock wave changed with the back pressure, which aggravated the instability of the shock wave behavior.Chang et al.studied the combustion characteristics of liquid kerosene fuel in a supersonic combustor, and discussed the formation mechanism of flame stripping. The inlet Mach number was 2.8, the total temperature was T= 1680 K, and total pressure P= 1.87 MPa.The results showed that the flame structure could be divided into two states:the flame detached state and the flame attached state. The equivalence ratio and the plasma jet igniter could affect the flame state. The core flame would spread into the mainstream by increasing ER, expanding the flame width.Numerical results showed that the reflux in the low-velocity zone in the boundary layer was the inducement of flame flashback. Zhang et al.of the National University of Defense Technology studied the flame characteristics of hydrogen fuel with an inlet Mach number 2.52.The interaction between heat release and jet cavity played a crucial role in the mode transition. During the flame stabilization process, setting two injectors in series(30 mm and 10 mm upstream of the cavity)was a fuel injection scheme that was conducive to supersonic ignition, and a solid and stable flame would be obtained during the combustion process.For the supersonic combustion mode, there was no obvious flow separation near the cavity,and the flame could be stabilized in the cavity shear layer and the recirculation zone. For the stamping mode, the high back pressure generated by fuel heat release created a largescale recirculation zone upstream of the cavity,which provided good combustion conditions and stabilizes the flame.Huang et al.from Xi’an Jiaotong University studied the influence of water (HO) suspension on the spontaneous combustion characteristics of kerosene/air mixture, and obtained the structural characteristics of the flame front. The results showed that the promoting effect of HO was better than the inhibitory effect on RP-3 reactivity.Due to the instability of the initial fire core,the addition of hydrogen could increase the turbulent combustion speed by reducing the size of the wrinkled flame front. During the design of the combustor,adding hydrogen and COmight be a potential method to adjust the combustion intensity in the combustor.The wrinkled structure of hydrogen-added flame was finer and more corrugated than that of hydrocarbon fuel flame.The main reason was that the size of the wrinkled structure of the syngas flame was smaller. Tian et al.of China Aerodynamics Research and Development Center conducted experiments on the flame stability with throttling function.When the throttling air flux ratio increased to 13.7% or 24.5%, kerosene could be successfully ignited, and the combustion was stable and strong. With the help of throttling air, the spark plug could successfully ignite cold kerosene, and the ignition delay time was only 1/3 of the original. Under the same equivalence ratio, the hydrogen injected from the upstream injection hole burned more intensively than the hydrogen injected from the downstream injection hole. Due to the thermodynamic roar,a shock wave was generated in the isolation section.The shock wave reduced the high-speed airflow, and also improved the fuel mixture in the combustor. Moderate flame oscillation was conducive to combustion enhancement, and cavities with larger relief angle tended to show stronger flame oscillation and shorter ignition distance.At the same time,compared with two parallel injection holes (10 mm upstream of the cavity), the injection scheme of two serial injection holes (30 mm and 10 mm upstream of the cavity) was more conducive to ignition. The upstream and downstream flames provided proper temperature and velocity fields between the two cavities, which was the cause of flame transients. When the equivalence ratio was relatively high, compared with the case of a low equivalence ratio, the flame reignition and strong flame backfire reduced the duration of flame blowing,and ultimately led to more effective heat release.
In supersonic combustion, the time for proper mixing was very short. The injection technology and the quality and flow pattern of the mixture(fuel +oxidant) were the main parameters that determine flame stability.Vankova and Fedorovaused the Favre average Navier-Stokes equation and the k-ω SST (Shear Stress Transport) turbulence model to introduce the numerical results of the spontaneous combustion and supersonic combustion of cold hydrogen jets under the incoming flow condition of Mach number 2.0.It was found that the combustion layer in the numerical calculation was closer to the bottom wall of the channel than in the experiment,and the temperature of the reaction product was reduced by 10%.Aravind and Kumarmodified the basic strut to generate additional vortex in the direction of the airflow to improve the mixing performance of fuel and air. The study found that the interaction between the shock wave and the shear layer increased the intensity of local turbulence, and the change of the pillar geometry improved the mixing and combustion performance. The low-pressure vortex could significantly distribute fuel and expand the cavity mixing area, and the fluid accumulation in the cavity increased with the increase in the aspect ratio.Oamjee and Sadanandannumerically studied the effect of fuel injection position in a supersonic combustor on combustion performance. The simulation showed that the counter-rotating vortex in the cavity played a vital role in fuel diffusion and fuel injection penetration.Compared with the upstream position of the cavity, the injection position in the cavity could increase the fuel dispersion area by about 55% and increased the combustible plume area by about 55%-90%.In addition,the increase in the free flow Mach number limited the mixing rate and jet interaction.Ochs et al.used experiments and Large Eddy Simulation (LES)to study the premixed flame core in a supersonic flow. It was found that when the fire core interacted with the expansion of the supersonic gas flow,the flame core deformed into a reactive vortex ring.The stable numerical simulation of high-speed turbulence needed to determine the dissipation value of interaction with molecular diffusion.The performance and flame characteristics of the combustor were affected by the fuel distribution scheme.As the fuel equivalence ratios increased,the initial flame was strengthened, and the core flame spread into the main flow,thereby expanding the flame width.The initial flame propagated to the side wall of the combustor to ignite the fuel on the wall surface, thereby forming a wall flame. The flame oscillation characteristics were also closely related to the flow state.The difference in the flame propagation process under supersonic and subsonic flow conditions led to the difference in flame oscillation characteristics.
TBCC engines combine turbine engines and scramjets,which have better performance and safety than rocket propulsion.However,due to the limitation of the total temperature in front of the turbine and the material structure, the current upper limit of the maximum working speed of the turbine engine is usually difficult to exceed the Mach number 2.2,and the scramjets start to work at about Mach number 4.Therefore, the modal conversion and speed connection between the turbine engines and the scramjets have become the biggest technical difficulty of the TBCC engine.This paper adopted the idea of reducing the lower limit of the working Mach number of the scramjets to study the combustion performance of the supersonic combustor under the low Mach number and low total temperature inflow state, and provided technical support for the demonstration of the TBCC engine.
This paper analyzed the results of investigations on the combustion characteristics of supersonic combustors at home and abroad, and found that the current research team did not have any ignition tests on supersonic combustor at 700 K, and the lowest temperature was only about 840 K.Therefore, this article carried out the combustion experiment of kerosene under the condition (inlet Mach number 2.0,700 K, and 520 kPa). This paper studied the ignition performance,stable combustion performance and kerosene combustion efficiency of kerosene fuel under low temperature conditions. This study expanded the working range of ramjet and provided a reference fuel test scheme at low Mach numbers.
2. Test plan
2.1. Test equipment and model
The test in this paper was based on a resistance heating directconnected test system (Fig. 1), using a supersonic combustor test model with a single-cavity flame stabilizer (Fig. 2). The total length of the combustor was 809 mm, the entrance size was 30 mm × 40 mm, the length of the isolation section was 275 mm, and the expansion angle behind the cavity was 2°.In this paper,the liquid kerosene fuel injection in the combustor model adopted a pressure nozzle-small hole spray atomization, and the fuel was broken into small droplets through the small holes under the action of high-pressure airflow.So,the diameter of hydrogen injector was 1 mm,and the injection method was vertical injection on the wall. Two kerosene nozzle of 0.3 mm diameter were set up to spray vertically on the wall,one was located upstream of the cavity,and the other was located downstream of the cavity.
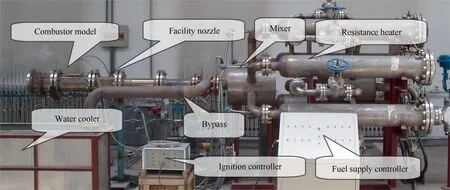
Fig. 1 Resistance heating direct-connected test system.

Table 1 Test inflow status and kerosene equivalence ratios.

Fig. 2 Geometric configuration diagram of combustor test model.
The inlet flow conditions of the supersonic combustor and the fuel equivalence ratio were shown in Table 1. This article stipulated that the Blockage Ratio (BR) was defined as:BR = the maximum windward area of the strut (the product of the height and the width)/the cross-sectional area of the isolation section. The injection block shown in Table 2 was selected for testing.Corresponding blockage ratios of injection blocks in this paper were 0%, 20%, 10%, 7.3% and 5%,respectively, and the diameter of kerosene injection holes was 0.3 mm. Case A showed the spray block without strut. Case B and Case C were spray blocks with blockage ratio of 20%,and the cross-sectional dimensions of the two struts were both 8 mm×15 mm.Case D was a spray block with blockage ratio of 10%, and the cross-sectional size of the strut was8 mm × 15 mm. Case E was a spray block with blockage ratio of 7.3%, and the cross-sectional size of the strut was 8 mm×11 mm.Case F was a spray block with blockage ratio of 5%, and the cross-sectional size of the strut was 4 mm × 15 mm.
2.2. Supersonic test images
Fig.3 showed the timing diagram of pioneer hydrogen guiding kerosene ignition control.Fig.4 showed a picture of the flame at the exit of the combustor when kerosene was injected at two points(Ke01,Ke02).It could be seen from the Fig.4 that in the stage of hydrogen combustion alone,the hydrogen equivalence ratio was relatively low,and the flame failed to reach out of the combustor outlet; in the stage of hydrogen and the first kerosene combustion together,the combustor outlet caught obvious flame; after the hydrogen was removed, the flame did not change significantly; at the two-point kerosene co-combustion stage, the total equivalence ratio increased significantly due to the second point of kerosene injection, and the distance of the flame out of the combustor significantly increased.
Fig. 5 was a graph showing changes in fuel injection pressure and wall pressure at different times. In the initial stage when the kerosene control valve was opened,its injection pressure fluctuated violently and generated a pressure peak much higher than the stable injection pressure value, but it immediately dropped to the stable injection pressure value. This phenomenon was called ‘‘water hammer phenomenon”.Except for the pressure peak at the initial moment, the kerosene injection pressure was relatively stable at other moments.At about 155 s,the kerosene injection at the second point started. At this time, there was a large pressure fluctuation in the kerosene injection pressure at the first point with a pressure spike. This was because the pipelines before the two kerosene valves were the same. When the kerosene valve was opened at the second point, the liquid kerosene first rushed to the new outlet, accompanied by ‘‘water hammer phenomenon.” After that, the two kerosene injection pressures immediately returned to a stable pressure value.
2.3. Analysis method
(1) One-dimensional analysis method
Since the data acquisition system in this article can only collect wall pressure values,it is relatively thin for subsequent test analysis.Therefore,a one-dimensional analysis method is used here to convert the measured wall pressure distribution into other valuable aerodynamic parameter distributions,including Mach number (Ma), static temperature (T) and total temperature (T) distribution.
The stationary one-dimensional flow equation considering variable cross-section, chemical reaction, and wall friction is as follows:
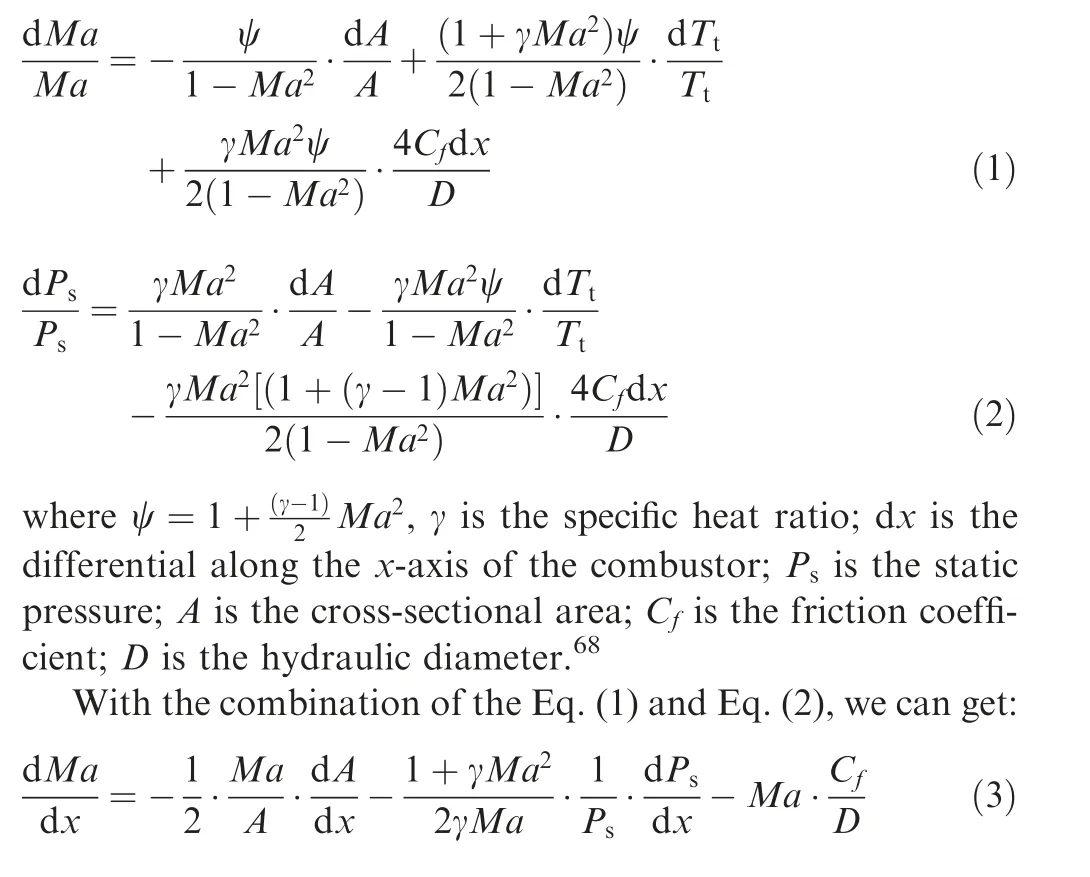
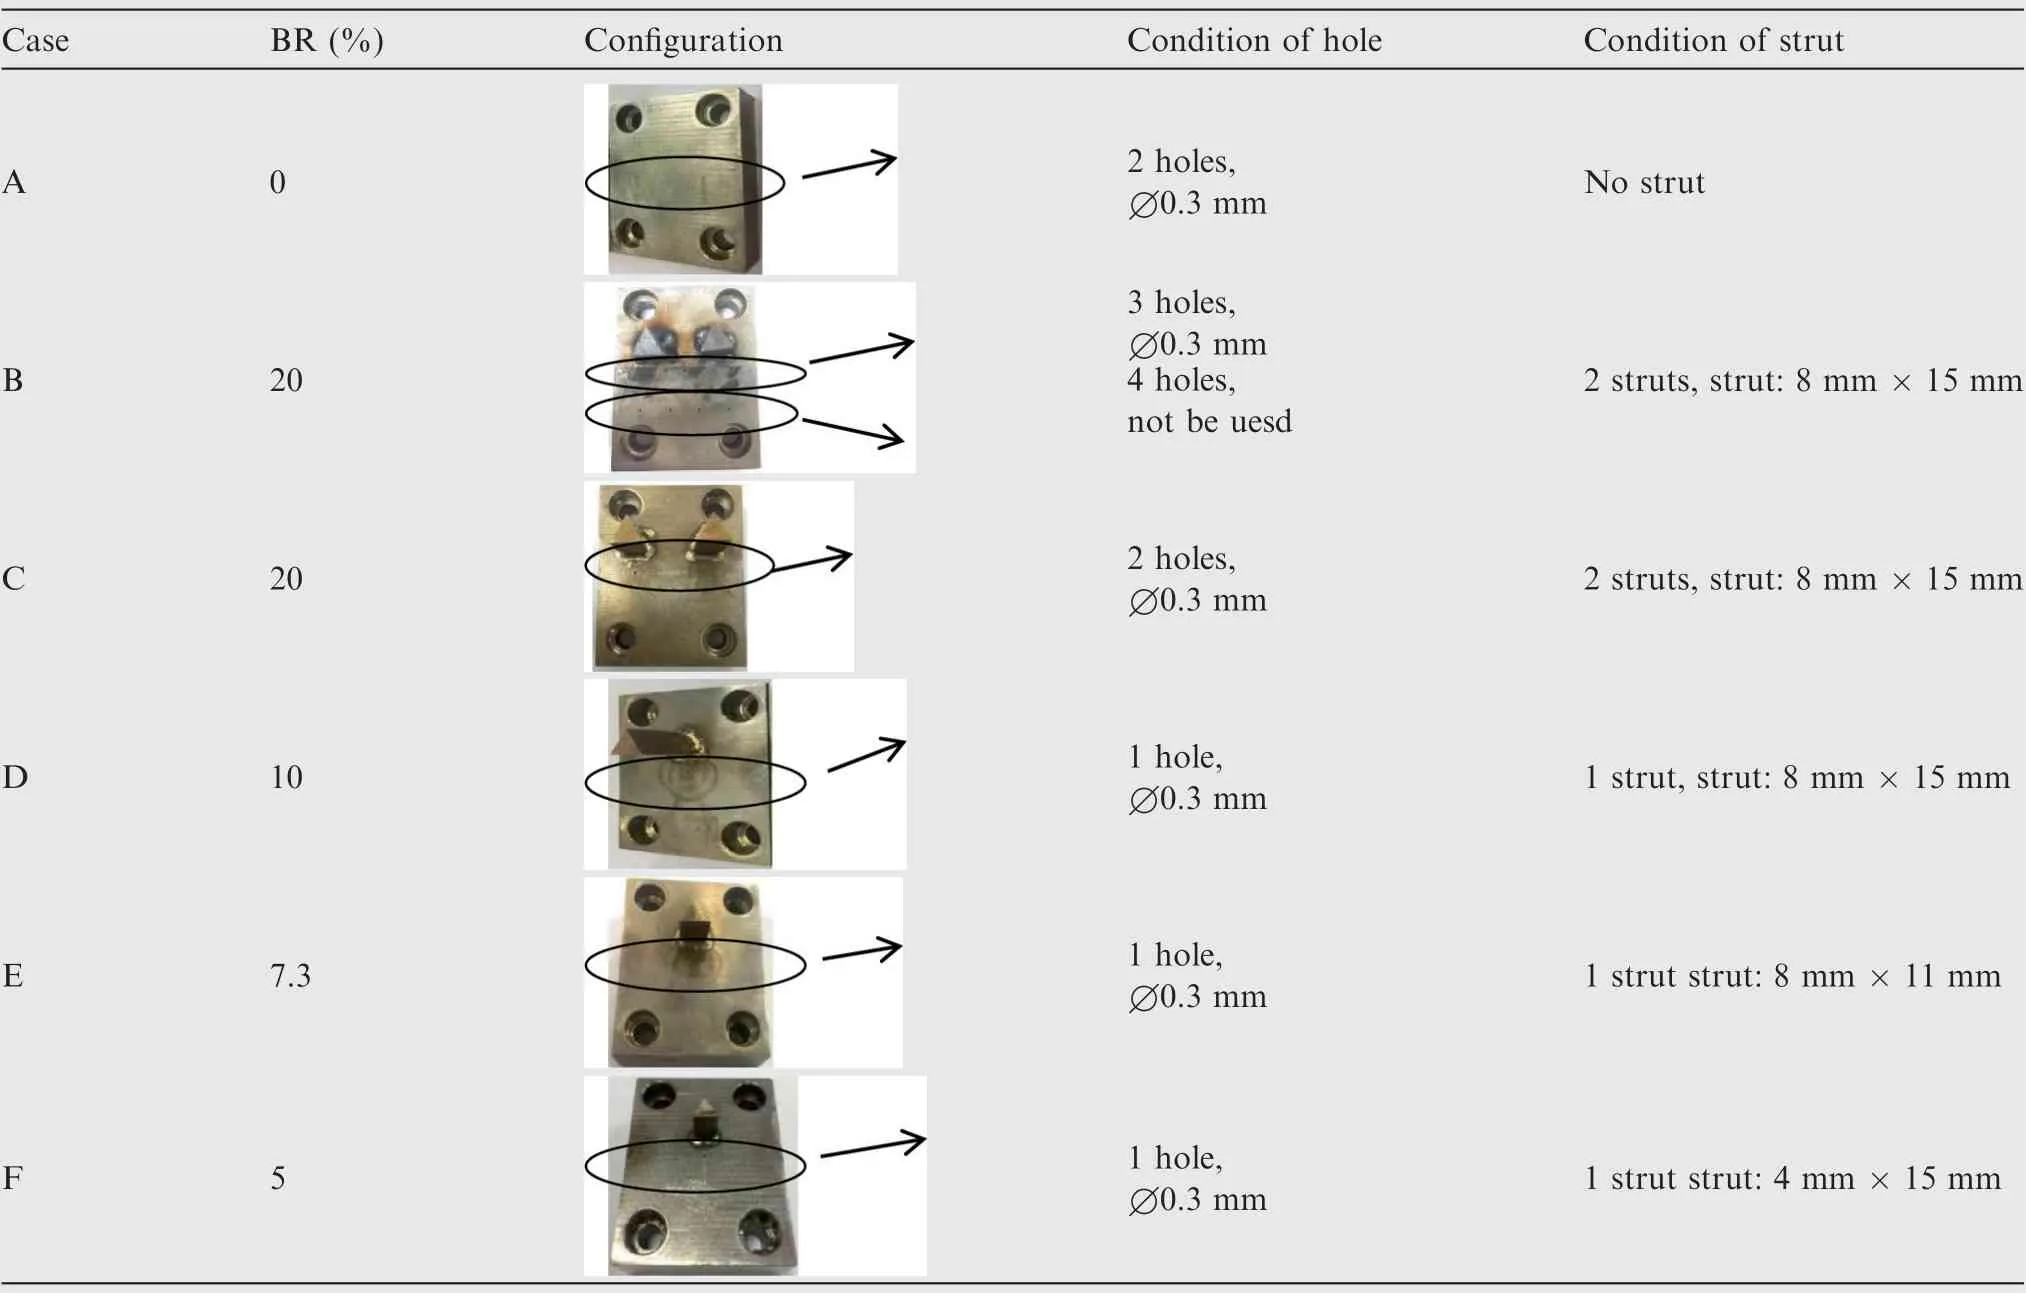
Table 2 Kerosene injection blocks with different blockage ratios.

Given the static wall pressure (P), the flow Mach number(Ma) and total temperature (T) could be obtained by using Eq. (3) and Eq. (4). Other airflow parameters, such as static temperature (T) and total pressure (P), could be obtained through pneumatic relations.
(2) Combustion efficiency
Due to the limitation of measurement equipment, it was still difficult to measure the composition of the gas at the outlet of the combustor at this stage, and the combustion efficiency could not be obtained through experimental means.The simulation method could obtain the composition of the gas flow out of the combustor. In this paper, the chemical reaction equations for the content of each component were considered in the data analysis program and numerical simulation. The chemical reaction equation of hydrocarbon fuel was as follows:

Fig. 3 Pioneer hydrogen guiding kerosene ignition control sequence.

Fig. 4 Photos of flame at exit of combustor at each stage.
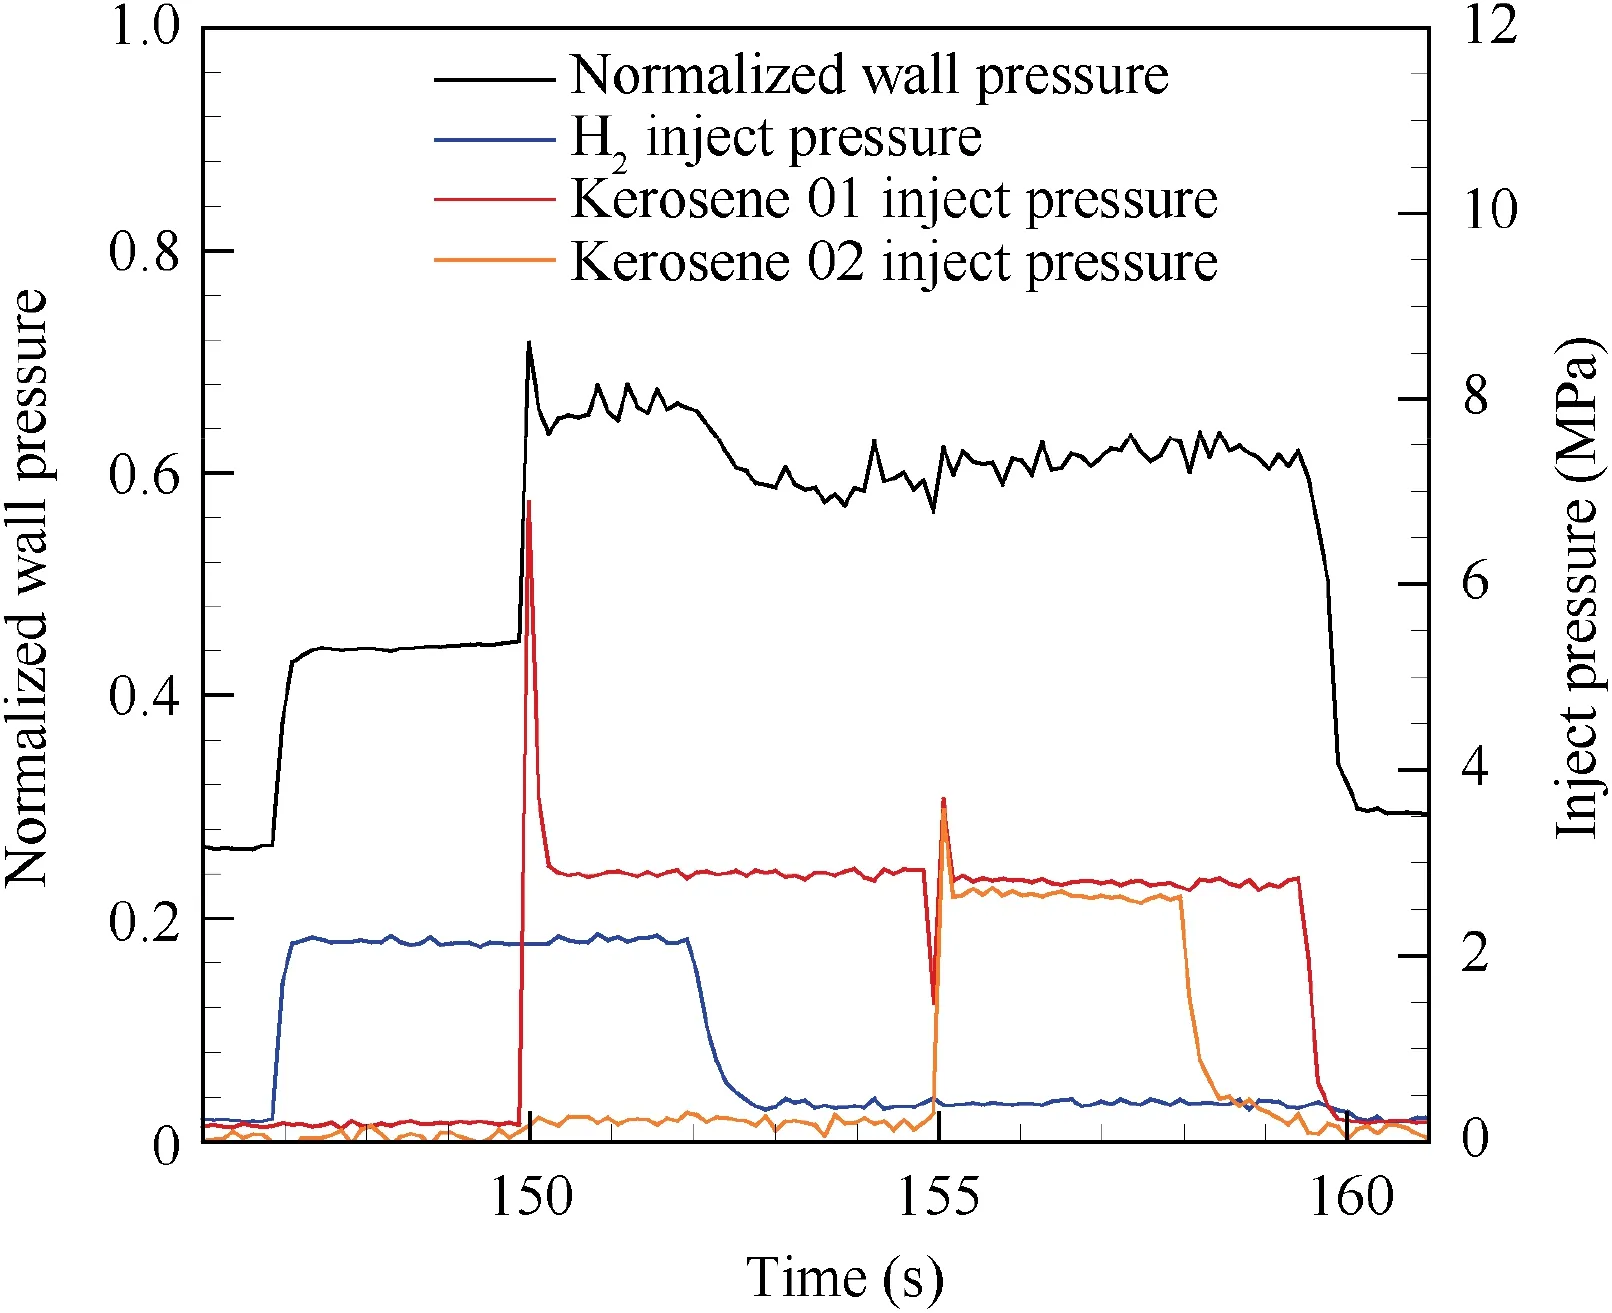
Fig. 5 Changes in fuel injection pressure and wall pressure with time (two points of kerosene).

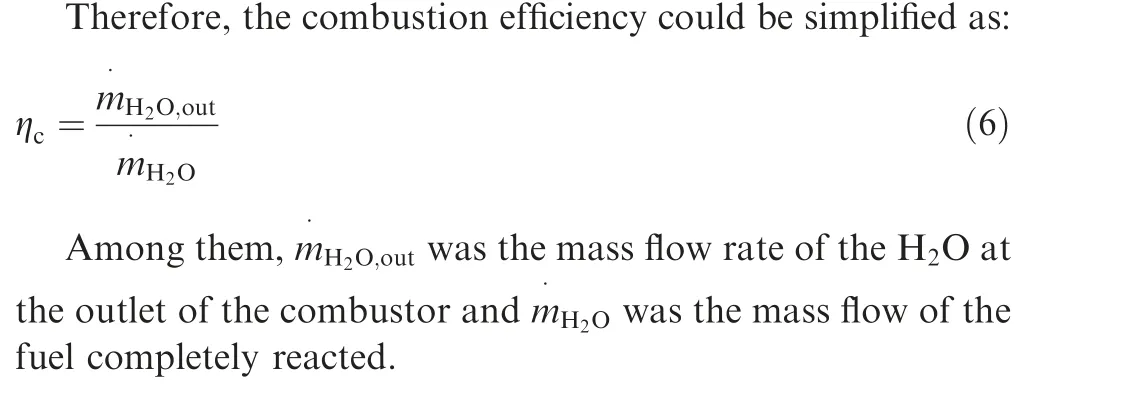
If x=0 and y=1 were in the reaction equation,it was the hydrogen fuel reaction equation. When the fuel equivalence ratios and the combustion efficiency were determined as η,Eq. (5) could be used to determine the composition of the mixed gas before and after the chemical reaction.
3. Test results and analysis
3.1. Error analysis of test
(1) Measurement error. Fig. 6(a) showed that a recording with a duration of 0.02 s would contain 401 sampling points at the location of x=305 mm.The test measurement equipment itself had the measurement error range of the test data. The measurement range of the pressure sensor was 0–0.8 MPa, and the relative error range of the pressure measurement was 0.8%–1%.
(2) Random error. The resistance heater used in this research could heat pure air to 500–1000 K, but the heating of the resistance wire itself had a certain error,the error range of the total temperature of the test was generally ±1.0% to ±1.5%.
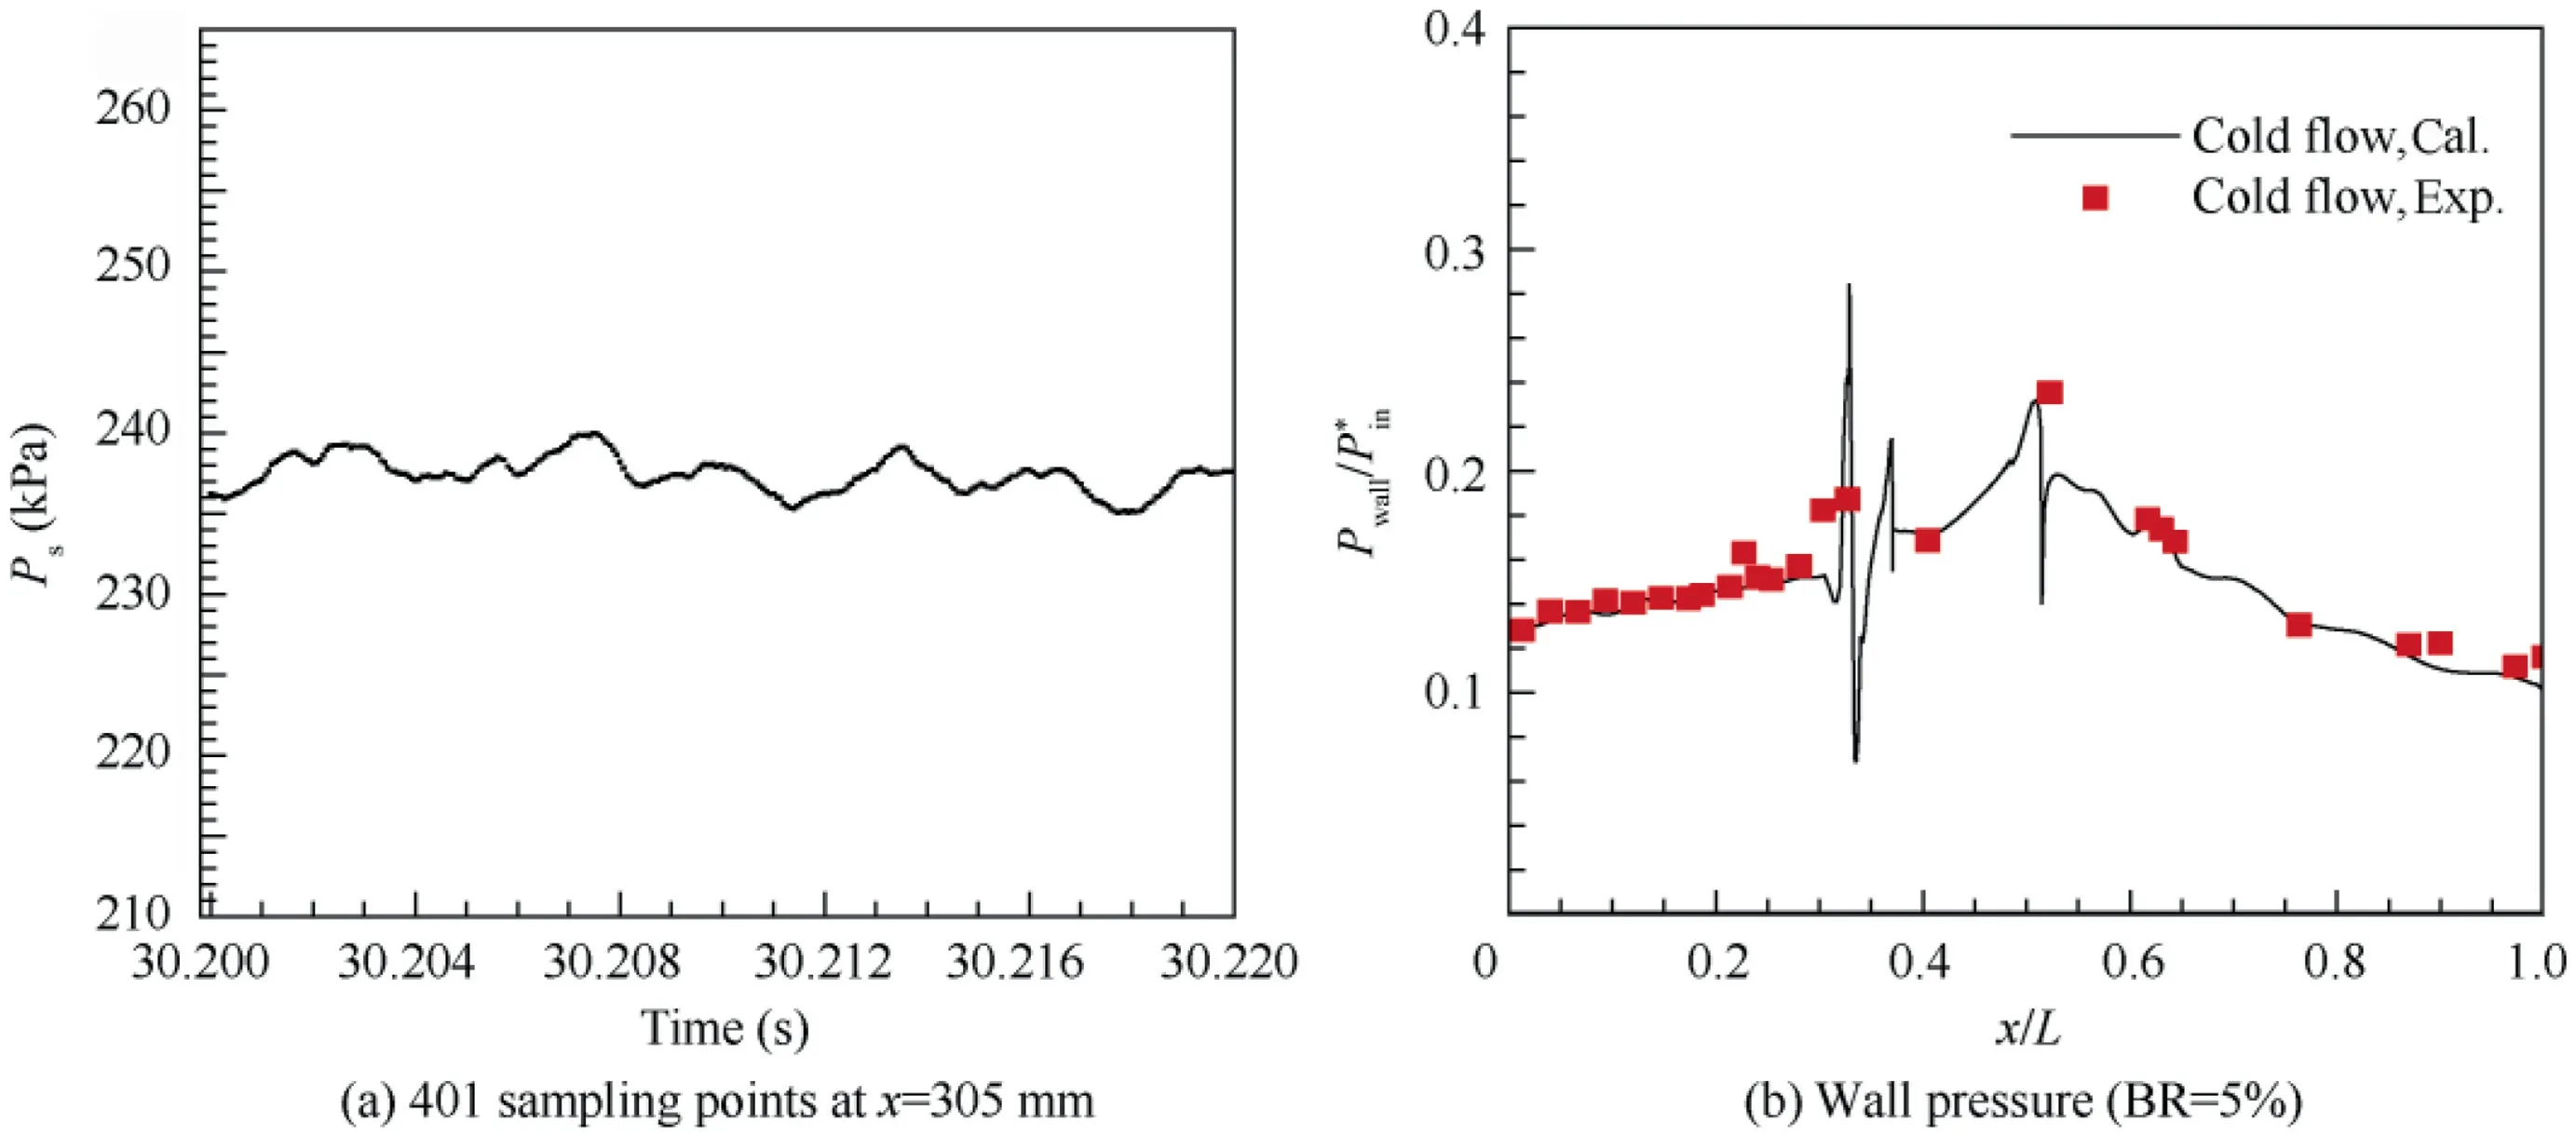
Fig. 6 Test error analysis.
(3) Uncertain error. (A) The experimental model used in this research had only 28 wall pressure measurement points. After the experimental values were measured, a smooth pressure distribution curve was obtained by fitting, which would result in the inaccurate acquisition of the values between adjacent measurement points. (B)The numerical simulation results of CFD showed that the pressure distribution curve fluctuated to a certain extent due to the complex shock wave system in the isolation section. This article compared the experimental values with the numerical calculation results and found that although the data analysis method in this article had certain errors,its parameter distribution trends were very similar to the numerical calculation results, as shown in Fig.6(b)(Pis wall pressure of the combustor,P*is the total pressure of the inlet of the combustor and L is the length of the combustor).
3.2. Influence of strut blockage ratios on combustion characteristics
The tests using injection blocks with different blockage ratios were shown in Table 3. The blockage ratios for the five test runs were: 0%, 20%, 10%, 7.3%, and 5% respectively.
Fig.7(a)showed the wall pressure distribution of blockage ratio experiments,including two stages of single point injection(Ke01) and two-point injection (Ke01 + Ke02); Fig. 7(b)showed the kerosene combustion efficiency of different blockage ratios experiments under the ER = 0.18–0.25. Fig. 8 showed the Mach number distribution map under 5% and 7.3% test conditions. The kerosene ignition control sequence of‘‘060801”was shown in Fig.3(a);the kerosene ignition control sequence of‘‘110806”was shown in Fig.3(c);the kerosene ignition control sequence of the remaining two points tests was shown in Fig. 3 (b).
It could be seen from Fig. 7 and Fig. 8 that:
(1) When a non-strut spray block (that is, the blockage ratio was 0%) was used for the test, the hydrogenremoved kerosene could not achieve independent and stable combustion, and the wall pressure was the same as the pressure in the cold flow state. In the analysis of the experiments with different blockage ratios, we found that when the spray block with a larger blockage ratio (ie, the blockage ratios were 20% and 10%) was used for the test, kerosene successfully achieved independent and stable combustion.However, the induced back pressure propagated forward to the entrance of the isolation section, destroy-ing the incoming flow conditions. At this time, the Mach number of the combustor entrance of the‘‘080103” and ‘‘080407” was lower than the incoming flow Mach number 2.0. This was because the induced back pressure generated by combustion quickly spread to the entrance of the combustor, destroying the incoming flow conditions, and might cause the engine to stop and stall. When the spray block with a smaller plugging ratio (7.3% and 5%) was used for the test, the induced back pressure of the kerosene single combustion stage did not propagate to the inlet of the isolation section, and the incoming flow conditions were not destroyed.

Table 3 Test status of injection blocks with different blockage ratios.
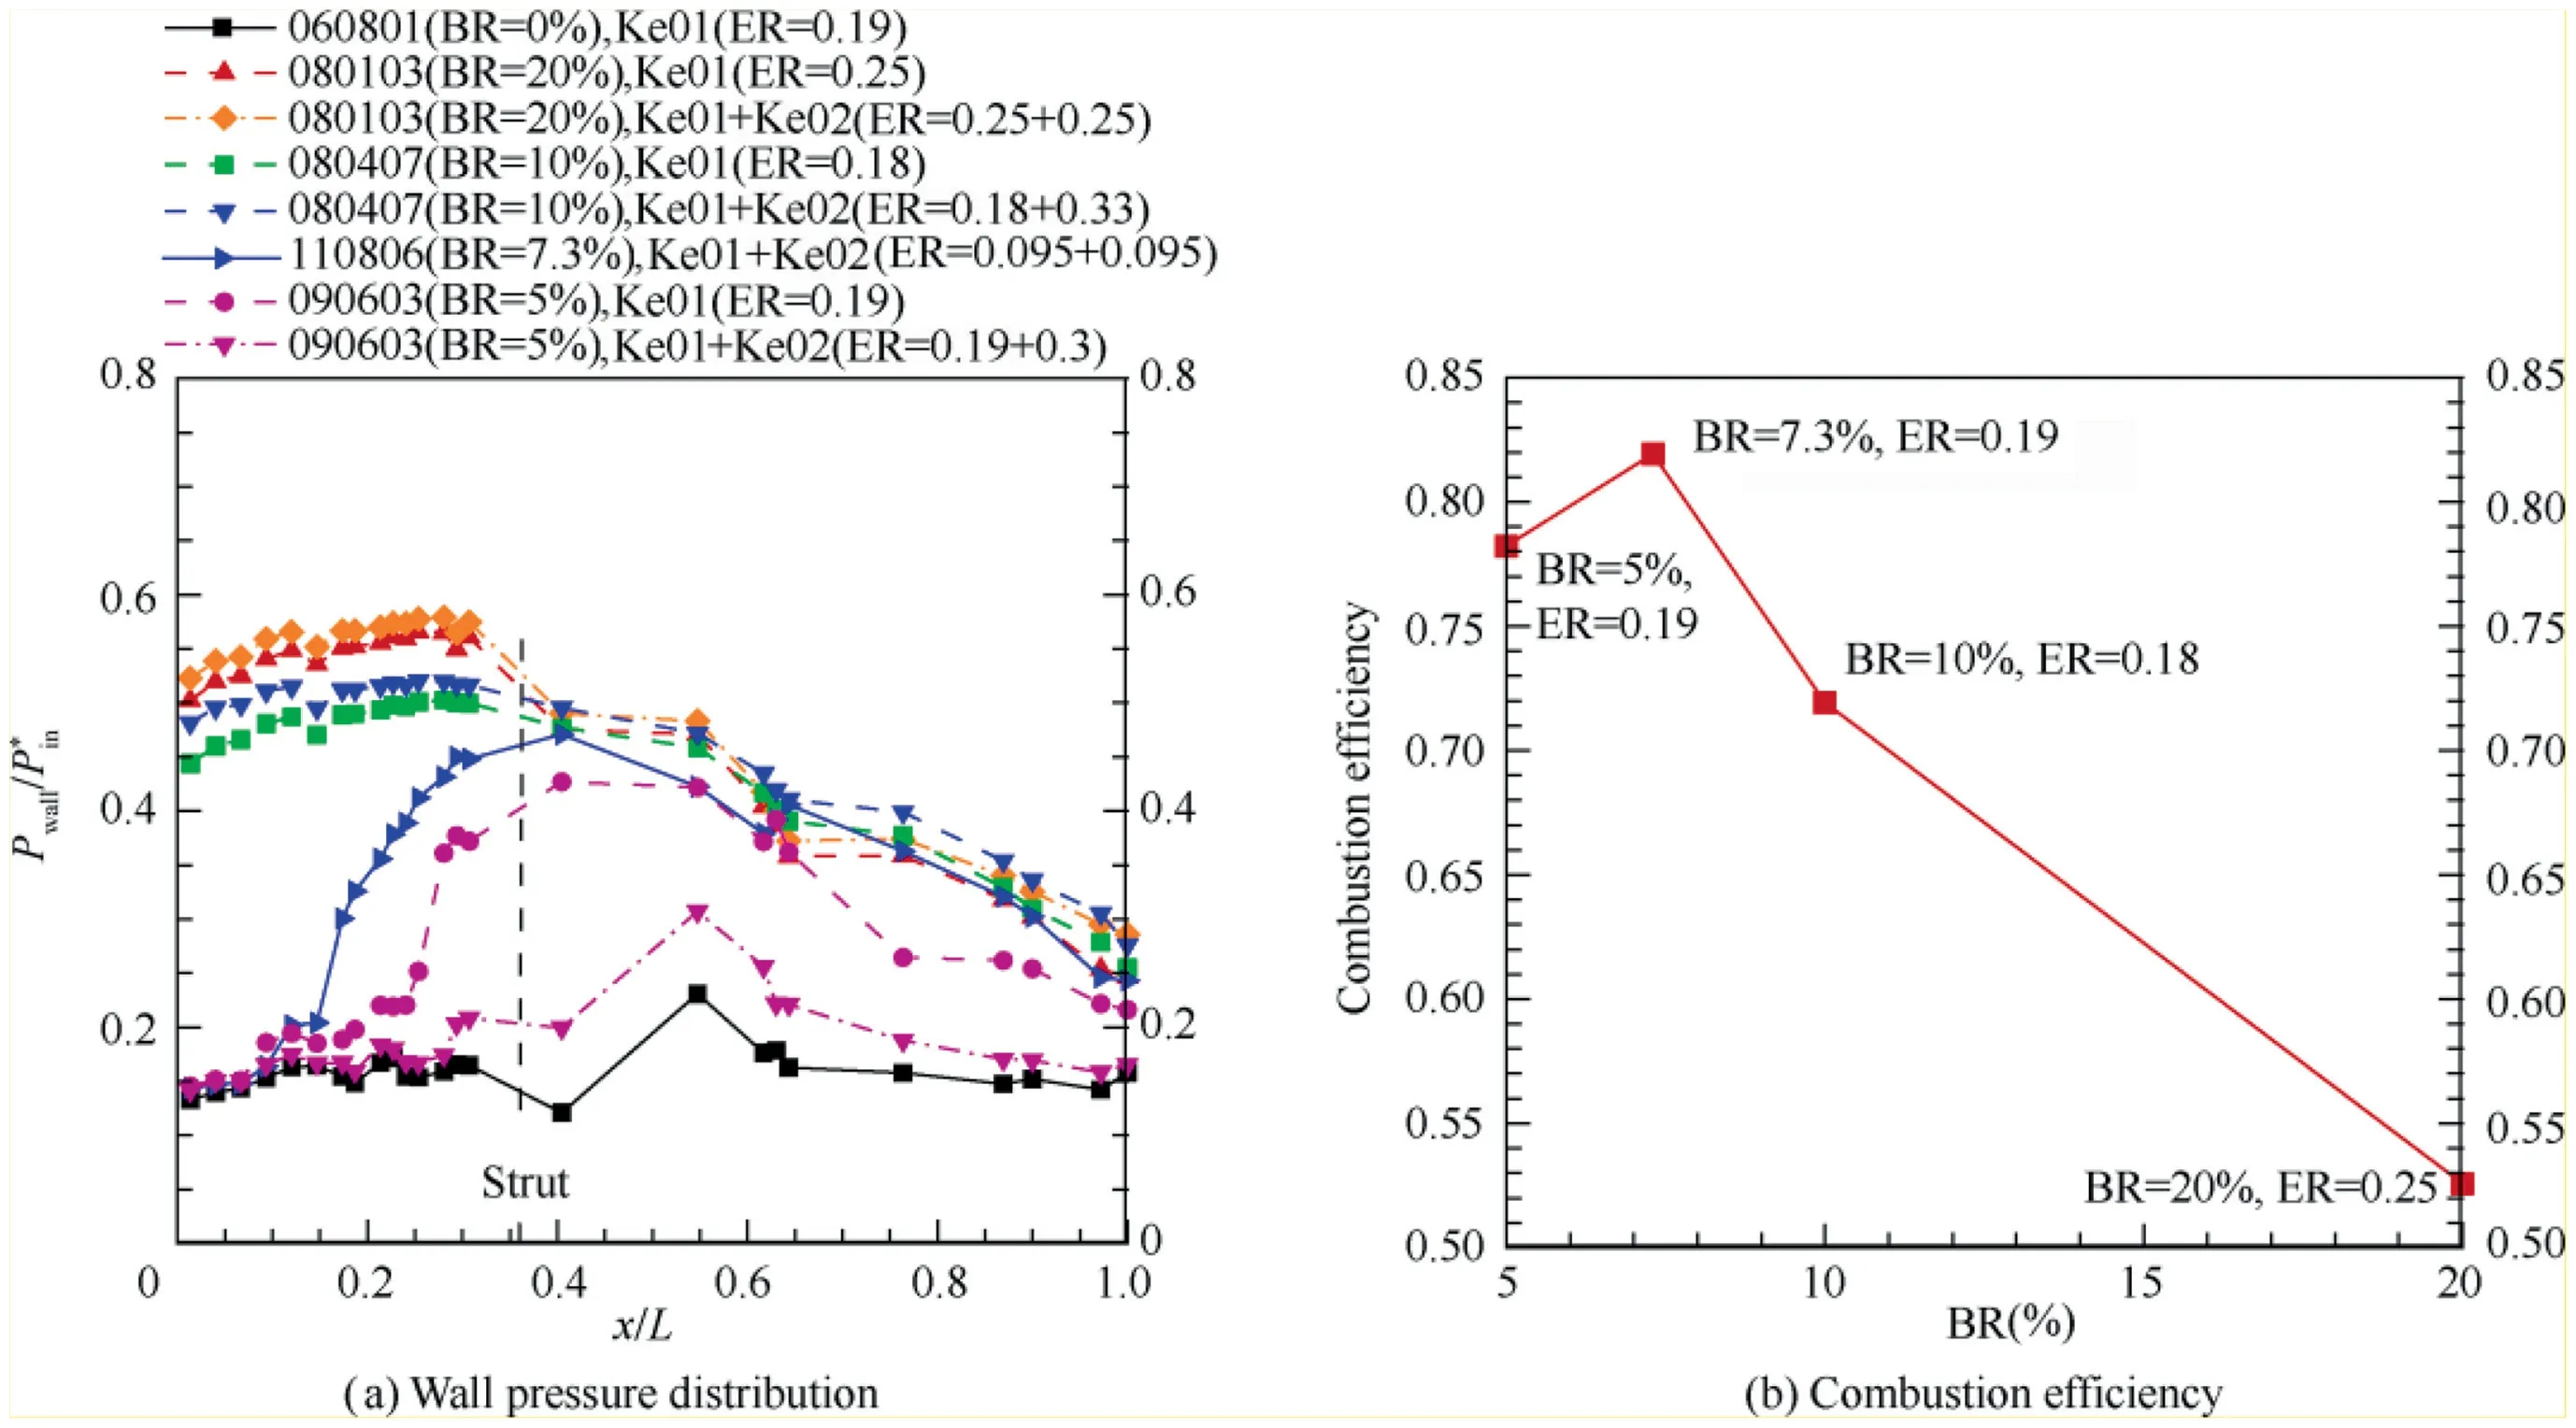
Fig. 7 Wall pressure distribution and combustion efficiency under different blockage ratios.
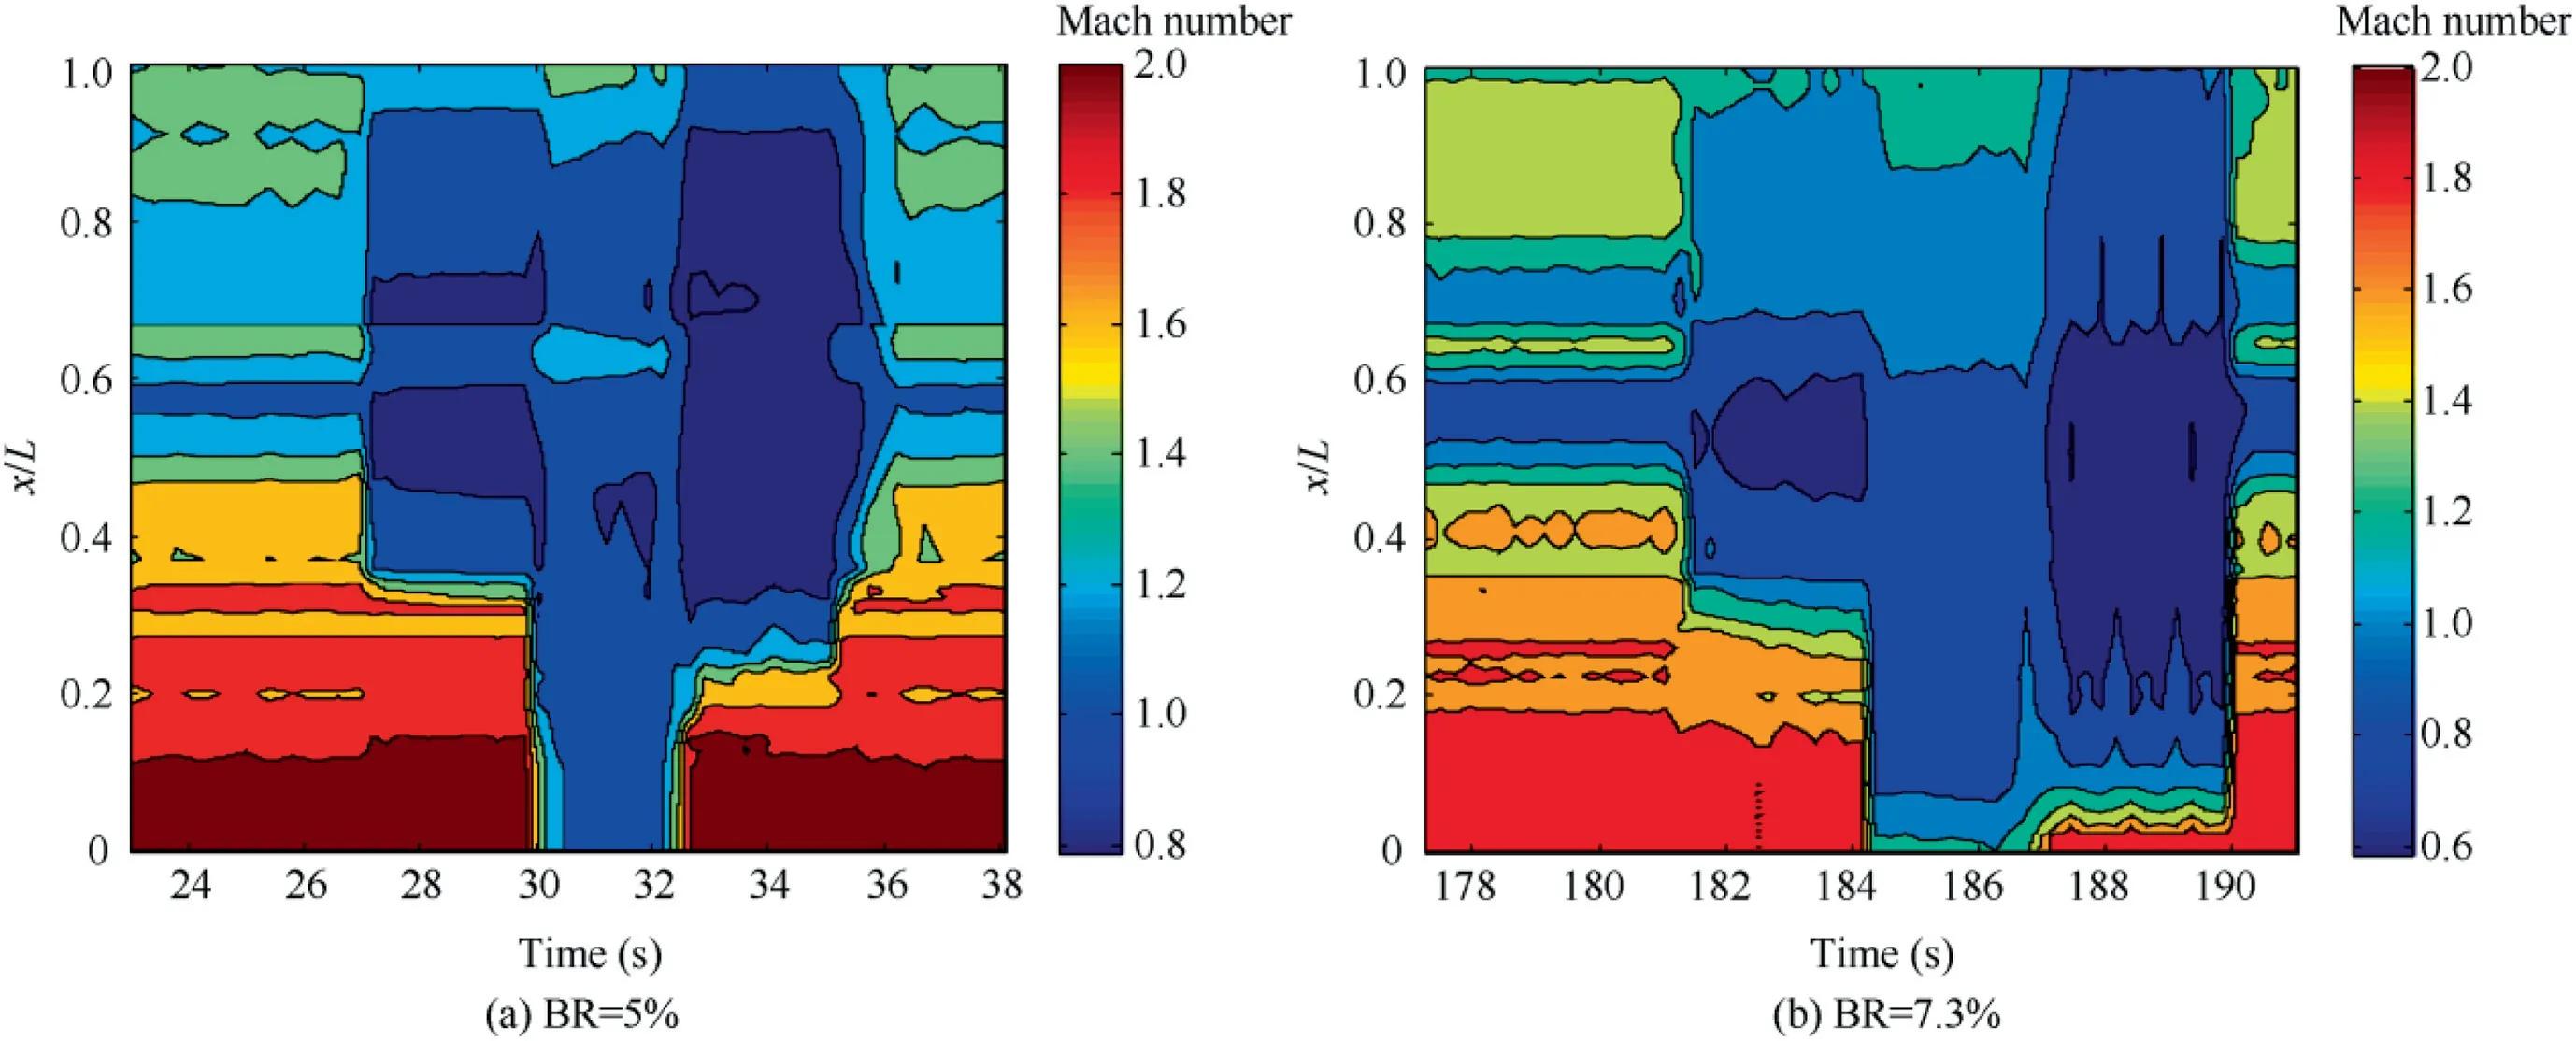
Fig. 8 Distribution map of Mach number under different blockage ratios (ER = 0.19).
(2) Compared with the block test with a blockage ratio of 5% (ER = 0.19), the wall pressure was higher when the block with a blockage ratio of 7.3% was used for the test (Ke01 + Ke02, ER = 0.095 + 0.095). This was because under the same equivalence ratio, as the blockage ratio increased, the flow of airflow was more hindered, the flow rate was lower, the temperature was higher, and the ignition success rate and combustion efficiency were higher. However, it could be seen from Fig. 7(b) that as the blockage ratio increased, the combustion efficiency did not show a linear change trend,but first increased and then decreased.
Therefore, we concluded that the airflow velocity in the combustor with the strut was lower, and the static temperature and static pressure in the ignition area increased, which would improve the ignition success rate and combustion performance of the combustor. When the kerosene equivalence ratio was the same, the larger the blockage ratio was, the easier it was for the induced back pressure to propagate to the upstream of the combustor until it reached the entrance of the isolation section, destroying the incoming flow conditions. Therefore, while using the strut to improve the ignition success rate and combustion performance, the strut with a proper blocking ratio should also be selected to prevent damage to the flow conditions at the entrance of the isolation section.
3.3. Effect of fuel equivalence ratios on combustion characteristics
Test runs using different equivalence ratios were shown in Table 4. Pioneer hydrogen equivalence ratio range: 0.05–0.15, kerosene equivalence ratio range: 0.095–0.50. Blockage ratios using injection blocks were: 0%, 20%, 7.3% and 5%.
Fig. 9 (a) was the wall pressure distribution experiment using different equivalence ratios; Fig. 9 (b) was the kerosene combustion efficiency under different equivalence ratios conditions.Fig.10 was the distribution map of the combustor Mach number under 5% blockage ratio. The kerosene ignition control sequence of‘‘110806”was shown in Fig.3(c);the kerosene ignition control sequence of ‘‘09060302” was shown in Fig. 3(b). The kerosene ignition control sequence of other tests was shown in Fig. 3 (a).

Table 4 Test status of different equivalence ratios.
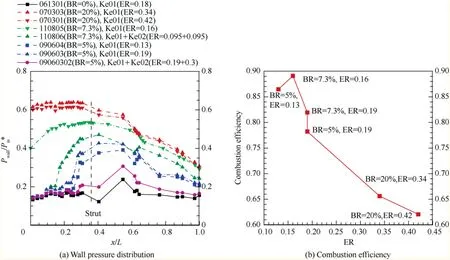
Fig. 9 Wall pressure distribution and combustion efficiency under different injection strategies.
From Fig. 9 and Fig. 10:
(1) In the two tests while using the injection block with blockage ratio of 20%, different combustion stage by removing pioneer hydrogen could stably burn, but the incoming flow state had been severely damaged. The incoming flow Mach numbers of ‘‘070303”(ER = 0.34) and ‘‘070301” (ER = 0.42) were 0.58 and 0.6 respectively. Even if the equivalence ratio continued to increase, the increase in wall pressure would not be very large. This was because kerosene could not fully burn due to its poor atomization effect.
(2) In the two tests of‘‘090604”(ER=0.13)and‘‘090603”(ER = 0.19), kerosene could be burned alone after removing the hydrogen,and in the separate combustion stage of kerosene, back pressure did not appear at the entrance of the isolator, which also showed that the intake port before the isolation section was still working normally. When the ER = 0.13, the subsonic combustion area of the combustor was x/L = 0.4–0.9; when the ER increased to 0.19, the subsonic combustion area of the combustor became larger, and it extended from the isolation section x/L = 0.28 to the outlet of the combustor.
Experiments with struts with the same blockage ratio, we could see that the increase of the ER would cause the wall pressure to rise significantly, and at the same time, the subsonic combustion area of gradually increased. It could be seen from the experimental data that an excessively higher equivalence ratio would lead to insufficient kerosene combustion and lower combustion efficiency.
3.4. Effect of number and location of injection holes on combustion characteristics
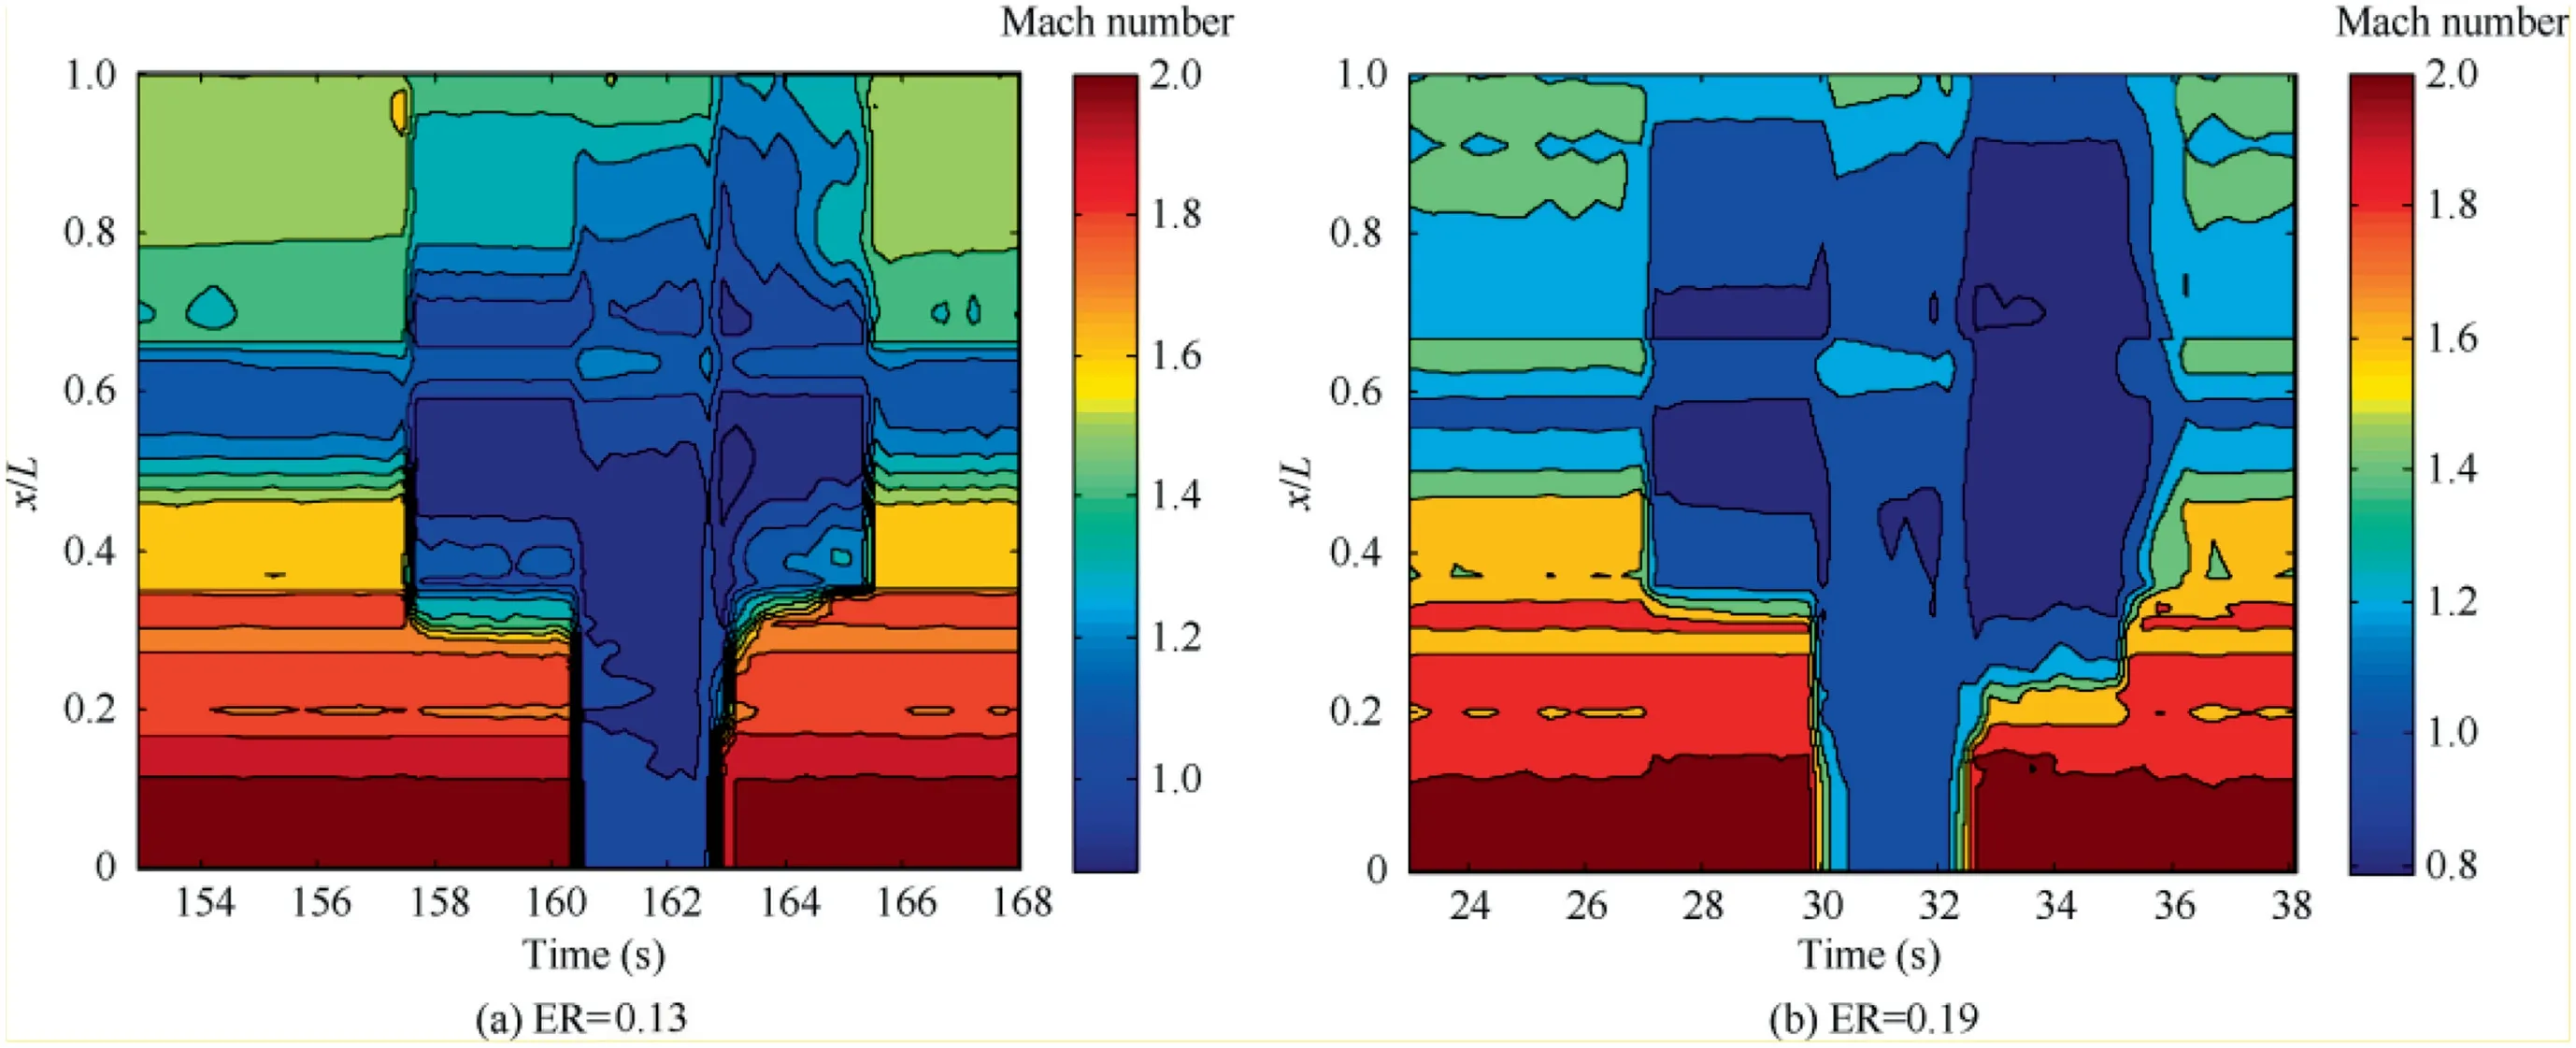
Fig. 10 Distribution map of Mach number under different equivalence ratios (BR = 5%).

Table 5 Test status of number and position of different injection holes.
Table 5 showed the test runs of injection blocks with different numbers of injection holes. The number of injection holes behind the strut was 1–3,and that behind the cavity was 1.The blockage ratios of 7 tests were 0%,20%and 7.3%respectively.3-hole injection was used in the case of‘‘072702”and the injection point was set in front of the cavity; 2-hole injection was used in the cases of ‘‘061301” and ‘‘070303” and the injection point was set in front of the cavity;2-hole injection was used in the cases of ‘‘08010302” and ‘‘110806” and the two injection points were set in front of the cavity and behind the cavity respectively; single hole injection was used in the case of‘‘110805” and the injection hole was set in front of the cavity.
Fig.11(a)showed the wall pressure distribution of different test vehicles with different injection holes layouts; Fig. 11 (b)showed the combustion efficiency corresponding to each test vehicle.Fig.12 was the Mach number distribution cloud chart of the test with 7.3% blockage ratio, in which ‘‘110805” was the single point injection in front of the cavity,the equivalence ratio was 0.16, the kerosene ignition control sequence was Fig. 3 (a); ‘‘110806” was the simultaneous injection of each point in front of and behind the cavity, the total equivalence ratio was 0.19, and the kerosene ignition control sequence was as shown in Fig. 3 (c). The kerosene ignition control sequence of ‘‘08010302”was shown in Fig. 3(b); the kerosene ignition control sequence of other tests was shown in Fig.3(a).From Fig. 11 and Fig. 12 we knew:
(1) When the blockage ratio was 20%, compared with the test results of ‘‘070303” (ER = 0.34, 2 holes in front of the cavity), although the equivalence ratio of‘‘072702” (ER = 0.3, 3 holes in front of the cavity)was relatively low, because of its more injection holes,the atomization effect of kerosene was better, the mainstream was fully mixed, and the combustion efficiency was higher. The injection holes of ‘‘070303”(ER = 0.34, 2 holes in front of the cavity) could not make the kerosene atomize well, and the combustion efficiency was low. After ‘‘08010302” (ER = 0.25 + 0.25, 2 holes in total before and after the cavity) realized the combustion of single point kerosene, the second point kerosene was injected after the cavity, and the pressure change before and after the injection was not obvious, which indicated that the kerosene at the second point was not ignited by the flame at the back edge of the cavity. When the kerosene equivalence ratio was relatively large,the kerosene cannot be fully burned due to insufficient combustion space and low oxygen content.
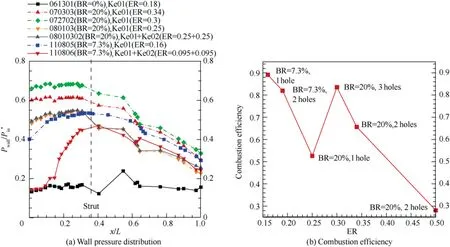
Fig. 11 Wall pressure distribution and combustion efficiency under different injection holes layouts.
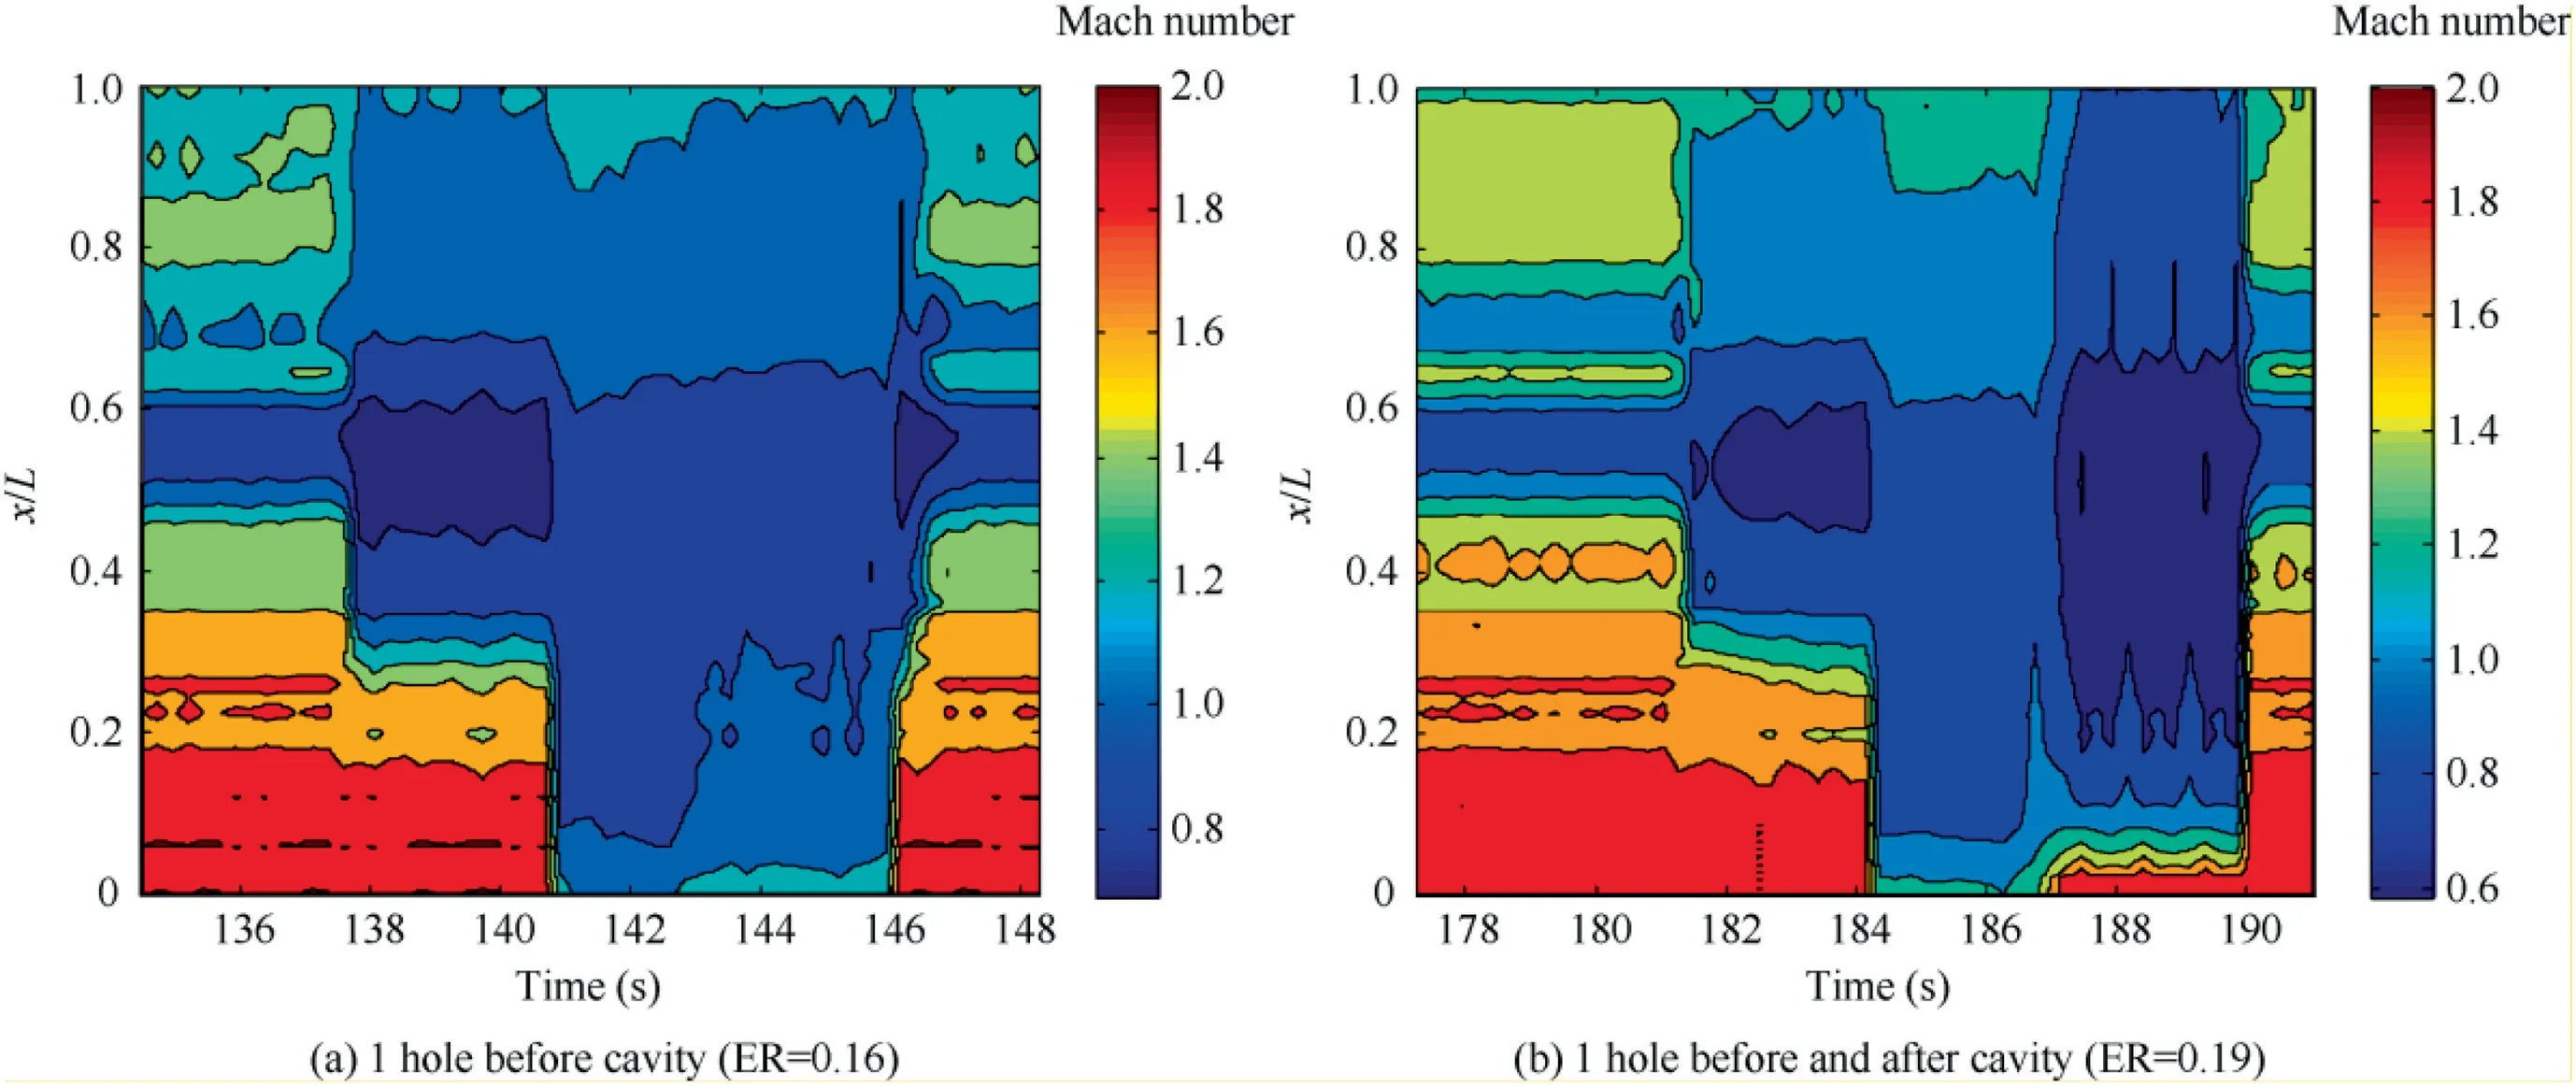
Fig. 12 Distribution map of Mach number under different injection holes layout test conditions (BR = 7.3%).
(2) When using injection block with 7.3%, ‘‘110805”(ER = 0.16) was set as a single point injection in front of the cavity. Although the kerosene with hydrogen removed could be fired, its pressure to propagate to the inlet of the isolation section. ‘‘110806”(Ke01 + Ke02, ER = 0.095 + 0.095) was equipped with a injection hole in front of the cavity and at the back of the cavity, and sprayed fuel at the same time.After removing the hydrogen, the kerosene burned successfully and the incoming flow at the inlet of the isolation section were not destroyed. This showed that injection in front of the cavity enabled the combustor to have a higher combustion efficiency, but the back pressure was easy to be transmitted forward; the injection hole behind the cavity could effectively reduce the back pressure transmission effect, and the heat release area extended to the downstream of the combustor,but the combustion efficiency was low.
From the above test results and analysis,it was shown that more injection holes were conducive to kerosene atomization,and the combustion efficiency was higher,but the pressure was easy to propagate upstream. The injection hole was arranged in front of the cavity, which was conducive to the full mixing of kerosene and air flow in the cavity shear layer,so as to make kerosene burn better and make the flame move to the downstream of the combustor; the injection hole was arranged in the cavity, which would reduce the combustion efficiency, for the kerosene behind the cavity would reduce the combustion efficiency due to the insufficient oxygen and combustion space.
4. Analysis of numerical simulation results of combustion characteristics
In this paper, the grid division of the combustor test configuration adopted the structured grid method.The numerical calculation adopted the SST turbulence model, the WAVE droplet secondary breaking model, the coupled implicit solution format, the Gauss-Seidel iteration method, and the inviscid flux selected the AUSM format. The convection term selected the second-order upwind discrete format. The inlet of the combustor selected the pressure inlet condition, and the outlet selected the pressure outlet condition. The wall of the combustor was set as an adiabatic non-slip wall boundary condition, and the liquid would rebound after colliding with the wall. The grid height of the first layer was 0.01 mm, and the grid volume was 740000 (Fig. 13). The combustion flow field with 5% and 7.3% blockage ratio was simulated, and the calculation status was shown in Table 6.The fuel injection hole is located behind the strut of the central axis of the upper wall and is at a position x/h=2.31 from the front edge cavity,where h is the depth of the cavity. Vertical injection of kerosene is used.The numerical simulation of kerosene combustion in this paper adopted the 12-component 13-step finite rate reaction model proposed by Kundu et al.
This paper gave a comparison chart of pressure distribution between the calculated value and the test value in cold and combustion state (Fig. 14). It was not difficult to see from Fig.14 that the calculated value and the test value in cold state were in good agreement, and each test value fitted more accurately on the calculation curve. However, there was a certain error in the fit between the calculation curve and the test value in combustion. This was because there was a complicated shock wave system in the isolation section, and the pressure fluctuation was very obvious. The calculation result in the expansion section was lower than the wall pressure test value.In short, the fitting effect of the simulating results and the experimental values in either cold or the combustion state were more real and intuitive,and the distribution trend tended to be consistent. Therefore, we believed that the numerical calculation method used in this article had a relatively reliable degree of authenticity.
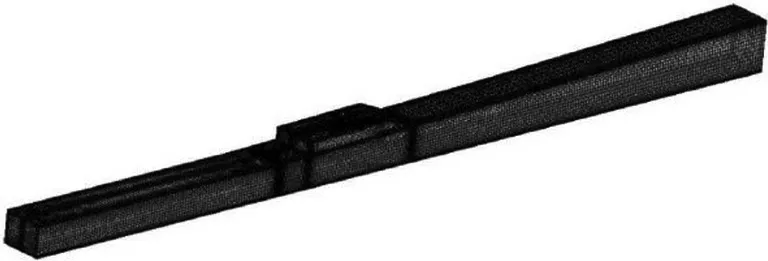
Fig. 13 Three-dimensional numerical calculation grid of supersonic combustor.

Table 6 Numerical simulation calculation status.
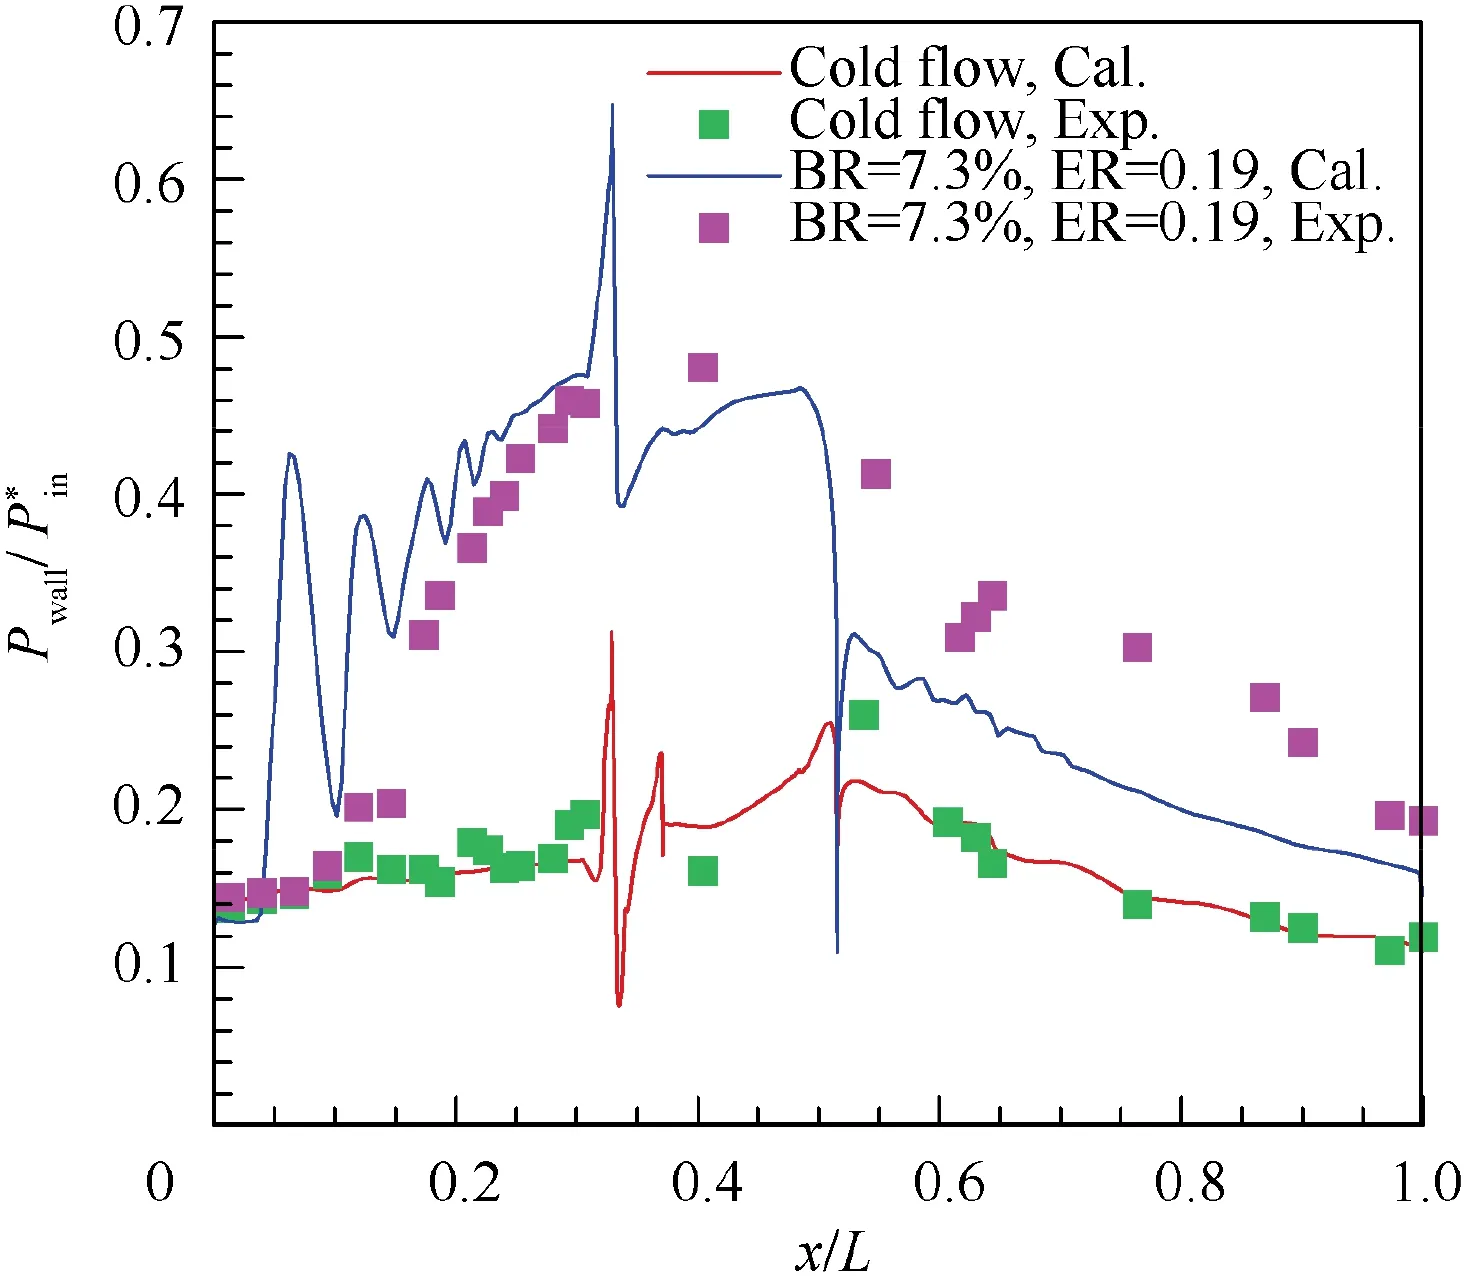
Fig. 14 Comparison of wall pressure distribution under cold flow and combustion conditions.
Different mesh generation methods or the number of meshes may affect the simulation results. In order to ensure the accuracy of the numerical simulation calculation results,the grid independence test was performed on the model grid to obtain the best and most accurate numerical simulation results. In this paper, three structured grids were constructed with 480000, 740000, and 1070000 grids. Under the same inflow conditions and fuel supply strategies,the numerical simulation calculations on three grids were performed and verified with test results. Fig. 15 showed the calculation results. As shown in Fig. 15, the overall calculation effect and change trend of the three grids were almost the same and the calculation results were not much different and could be ignored.This paper chose a structured grid of 740000 grids for numerical simulation calculation. On the whole, the numerical calculation results in the burning state were basically consistent with the distribution trend of the experimental measurement results.Therefore,the numerical calculation method used in this paper had certain reliability and rationality, which could be used to analyze the flow field of the combustor.
Figs. 16(a) and (b) showed the Mach number and static temperature distribution cloud diagrams with different equivalence ratios when blockage ratios were 5%and 7.3%,respectively. The test with blockage ratio of 5% was a single-point injection in front of the cavity, and a test with blockage ratio of 7.3% was a single-point injection in front of the cavity(ER = 0.16) and simultaneous injection at two points before and after the cavity (ER = 0.095 + 0.095).
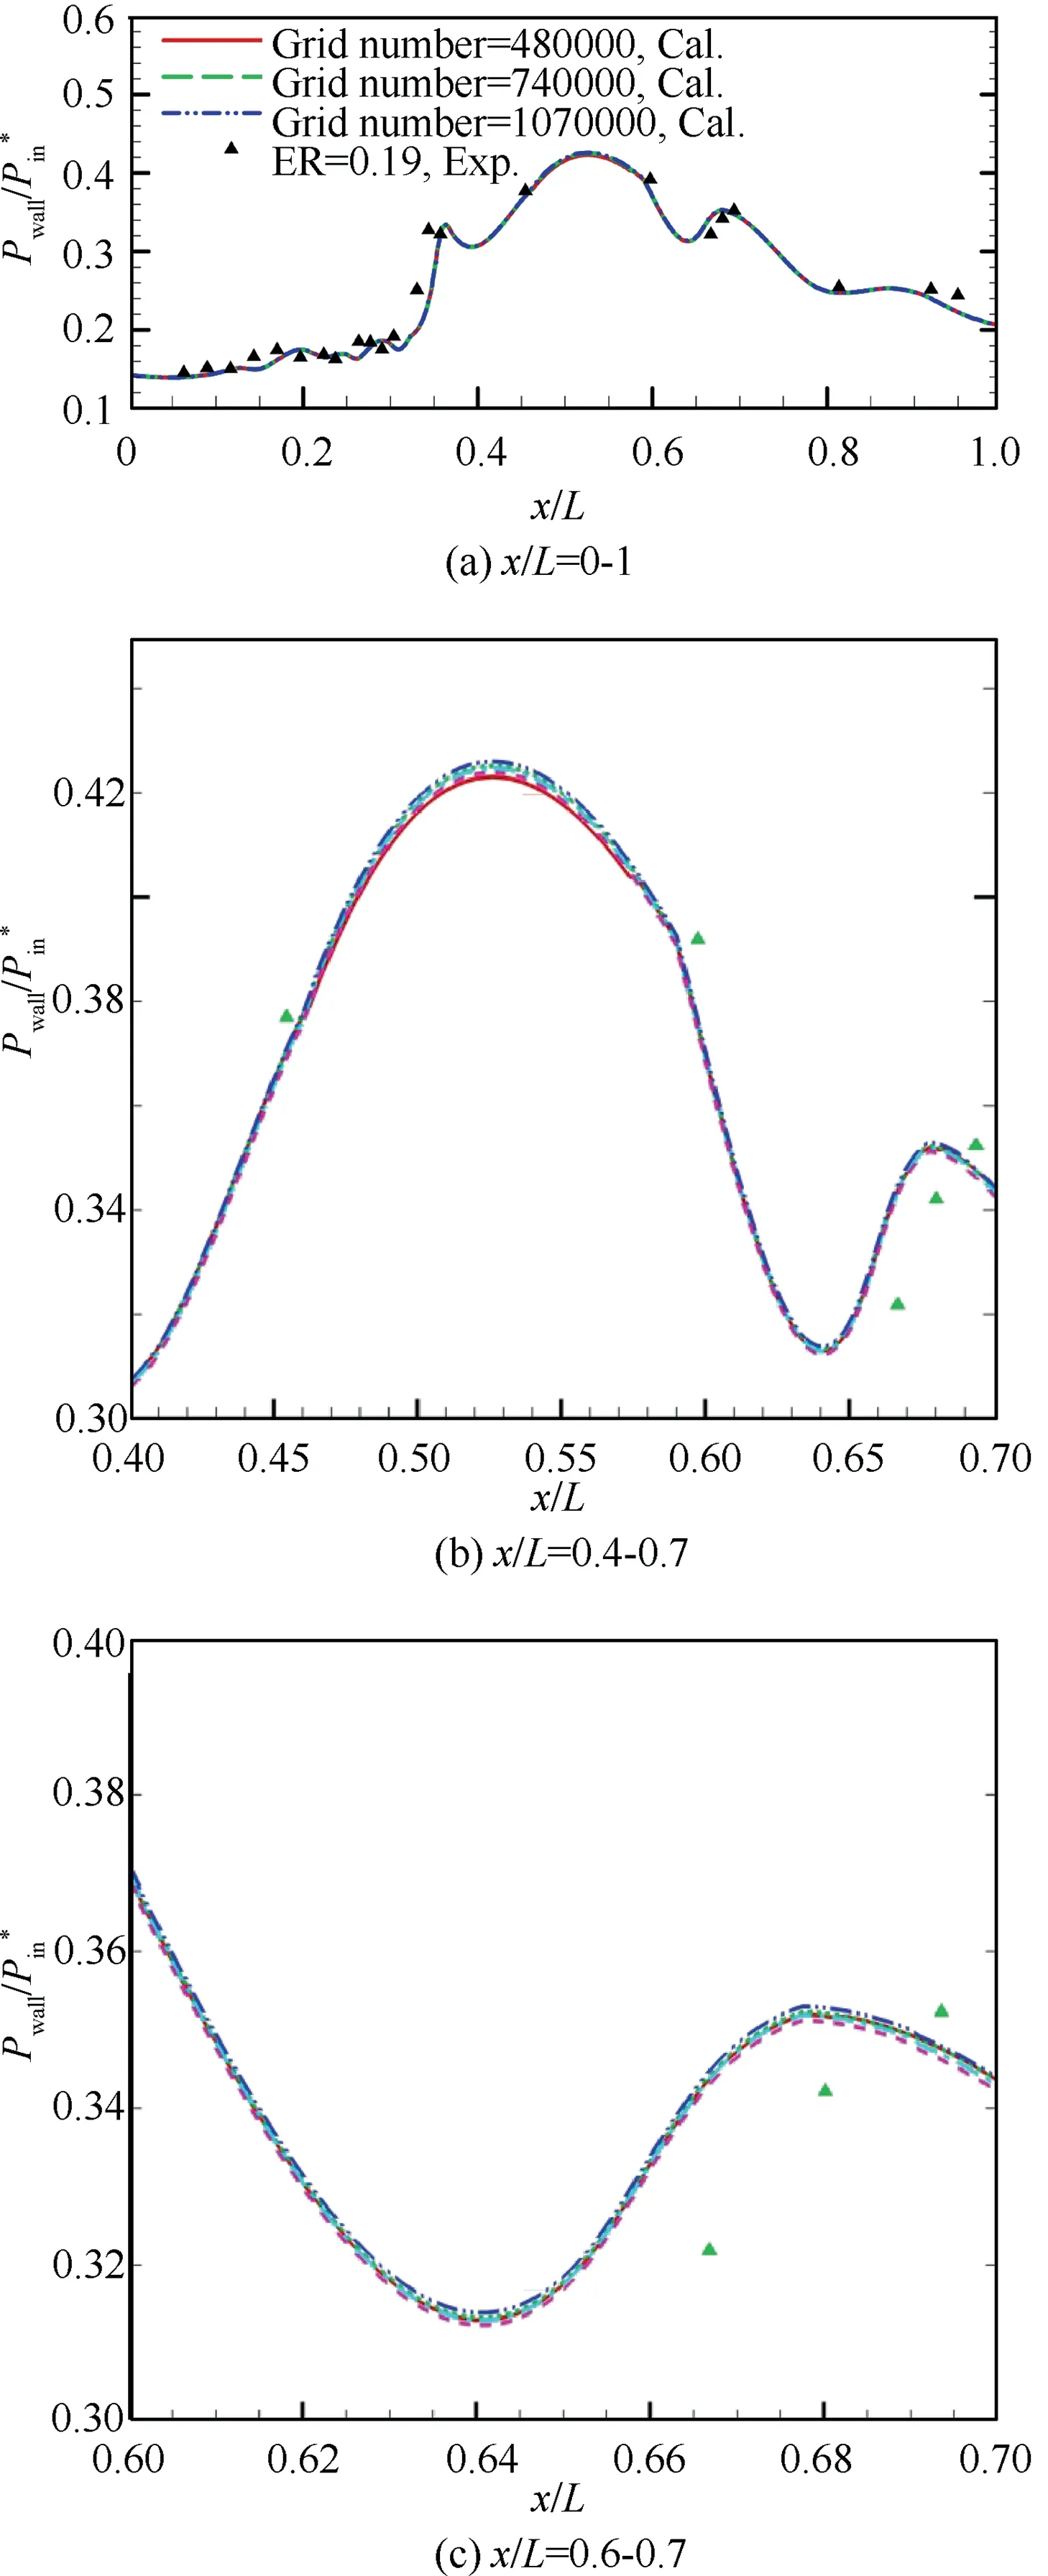
Fig. 15 Grid independence test result (along x axis).
It could be seen from Fig. 16, with the increase of equivalence ratio and blockage ratio, the separation of surface layer phenomenon became more serious.The single-point injection in front of the cavity made the fuel and air fully mix and burn in the cavity shear layer,and induced back pressure to destroy the incoming flow conditions. However, the strategy of two-point injection before and after the cavity reduced the fuel content in the cavity. Compared with the single-point injection, the induced back pressure of the two-point injection only spread to x/L=0.07.It could be seen that the kerosene behind the cavity could not be fully burned due to insufficient combustion space and low oxygen content,thereby reducing the combustion efficiency.
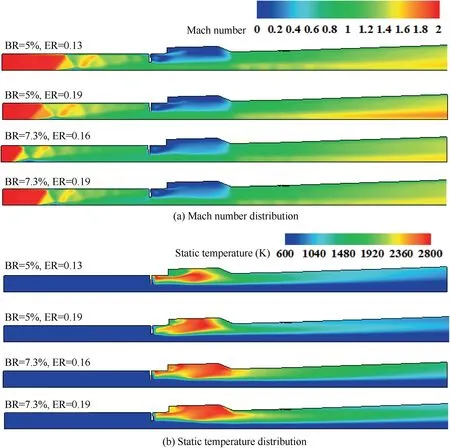
Fig. 16 Mach number and static temperature distribution of central section of combustor.
Fig.17 was the distribution cloud diagram of the mass fraction of HO generated behind the strut in the four combustion states. The mass fractions were M= 0.02, 0.04 and 0.06 respectively.The area where M=0.02 was the initial combustion area where HO components were generated. Fig. 18 showed the HO mole fraction distribution cloud diagrams of the three sections of the combustor in four combustion states, including the central section and two x-axis crosssections (x/L = 0.413 and 0.468).
From Figs.17(a)and(b),it could be seen that the blockage of the strut in front of the nozzle hole was relatively small(only 5%).After the kerosene was sprayed from behind the strut, most of it gathered inside the cavity. The main combustion area of kerosene approached the upper wall from the axis of the combustor by increasing ER, and then gradually diffused in the cavity until it almost filled the entire cavity. The initial combustion zone where the HO component was formed was mainly concentrated in x/L = 0.36–0.46. It could be seen from Figs.17(c)and(d)that after increasing the blockage ratio of the strut (from 5% to 7.3%), the flow velocity in the area behind the strut was lower, and static pressure were higher.After the combustion flame was filled in the cavity, the initial heat release area expanded to the downstream of the isolator.Compared with the blockage ratio of 5%,the combustion zone in Fig. 17(c) had expanded from x/L = 0.46 to x/L = 0.52.Moreover,since Fig.17(d)showed two points of fuel injection before and after the cavity, the initial combustion area was mainly concentrated around x/L = 0.36–0.51, and then expanded to x/L = 0.69.
From Figs. 18(a) and (b), we seen that the injection holes behind the strut were all single-hole injection methods. With the increase of ER,the combustion area in the cavity gradually became larger,and the HO produced gradually increased.The main combustion area of the combustor was from the point of the front wall of the cavity to the position near the combustor axis,and rapidly spread in the cavity.From Figs.18(c)and(d),it could be seen that due to the larger strut, the air flow was subject to greater resistance, the kerosene in the cavity was burned more fully, and the combustion efficiency was higher.The use of two-point fuel injection could expand the combustion area and effectively suppress the phenomenon of induced back pressure forwarding, but the combustion efficiency was lower than that of single-hole fuel injection.
5. Conclusions
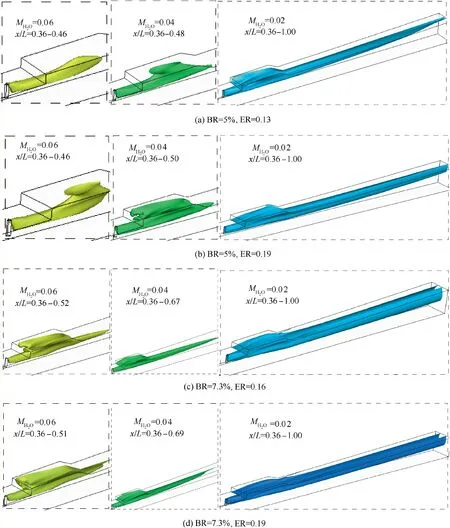
Fig. 17 H2O mass fraction distribution cloud diagrams behind strut.
Aiming at the problem that scramjet cannot work normally under low Mach number flight conditions, in this paper, the flame stabilization method combining the cavity and the strut was used to analyze the combustion characteristics of the kerosene fuel supersonic combustor at low temperature from three aspects of different blockage ratios,different equivalence ratios and different kerosene injection holes. The test conditions in this paper were: the combustor inlet Mach number was 2.0, the total temperature was 700 K, the total pressure was 520 kPa, and the corresponding flight Mach number of the scramjet was 3.5. The experimental configuration of the combustor used in this paper can work normally at a flight Mach number of 3.5,which extends the lower limit of the operating Mach number of the scramjet.
Compared with the flight conditions of high Mach number,the working conditions of scramjet with low Mach number were more severe. Kerosene needed to rely on the joint assistance of cavities,struts and pioneer hydrogen to achieve stable combustion at low temperatures.Larger blockage ratios(20%and 10%)were likely to cause the pressure to propagate to the isolation section, thereby destroying the inlet conditions and causing the inlet to not work properly. When the blockage ratios were relatively small(7.3%and 5%),the kerosene alone burned stably, the incoming condition was not damaged and the inlet could work normally. This showed that this paper had achieved the technical verification of the normal operation of the scramjet at a flight Mach number of 3.5.Moreover,as the ER increased, the pressure was more likely to be disturbed upstream to destroy the incoming flow conditions, and an excessively high equivalence ratio would result in lower combustion efficiency. The porous injection provided behind the strut was beneficial to the atomization of kerosene and improved the combustion efficiency of kerosene; the second injection added behind the cavity would reduce the combustion efficiency due to insufficient oxygen and combustion space.
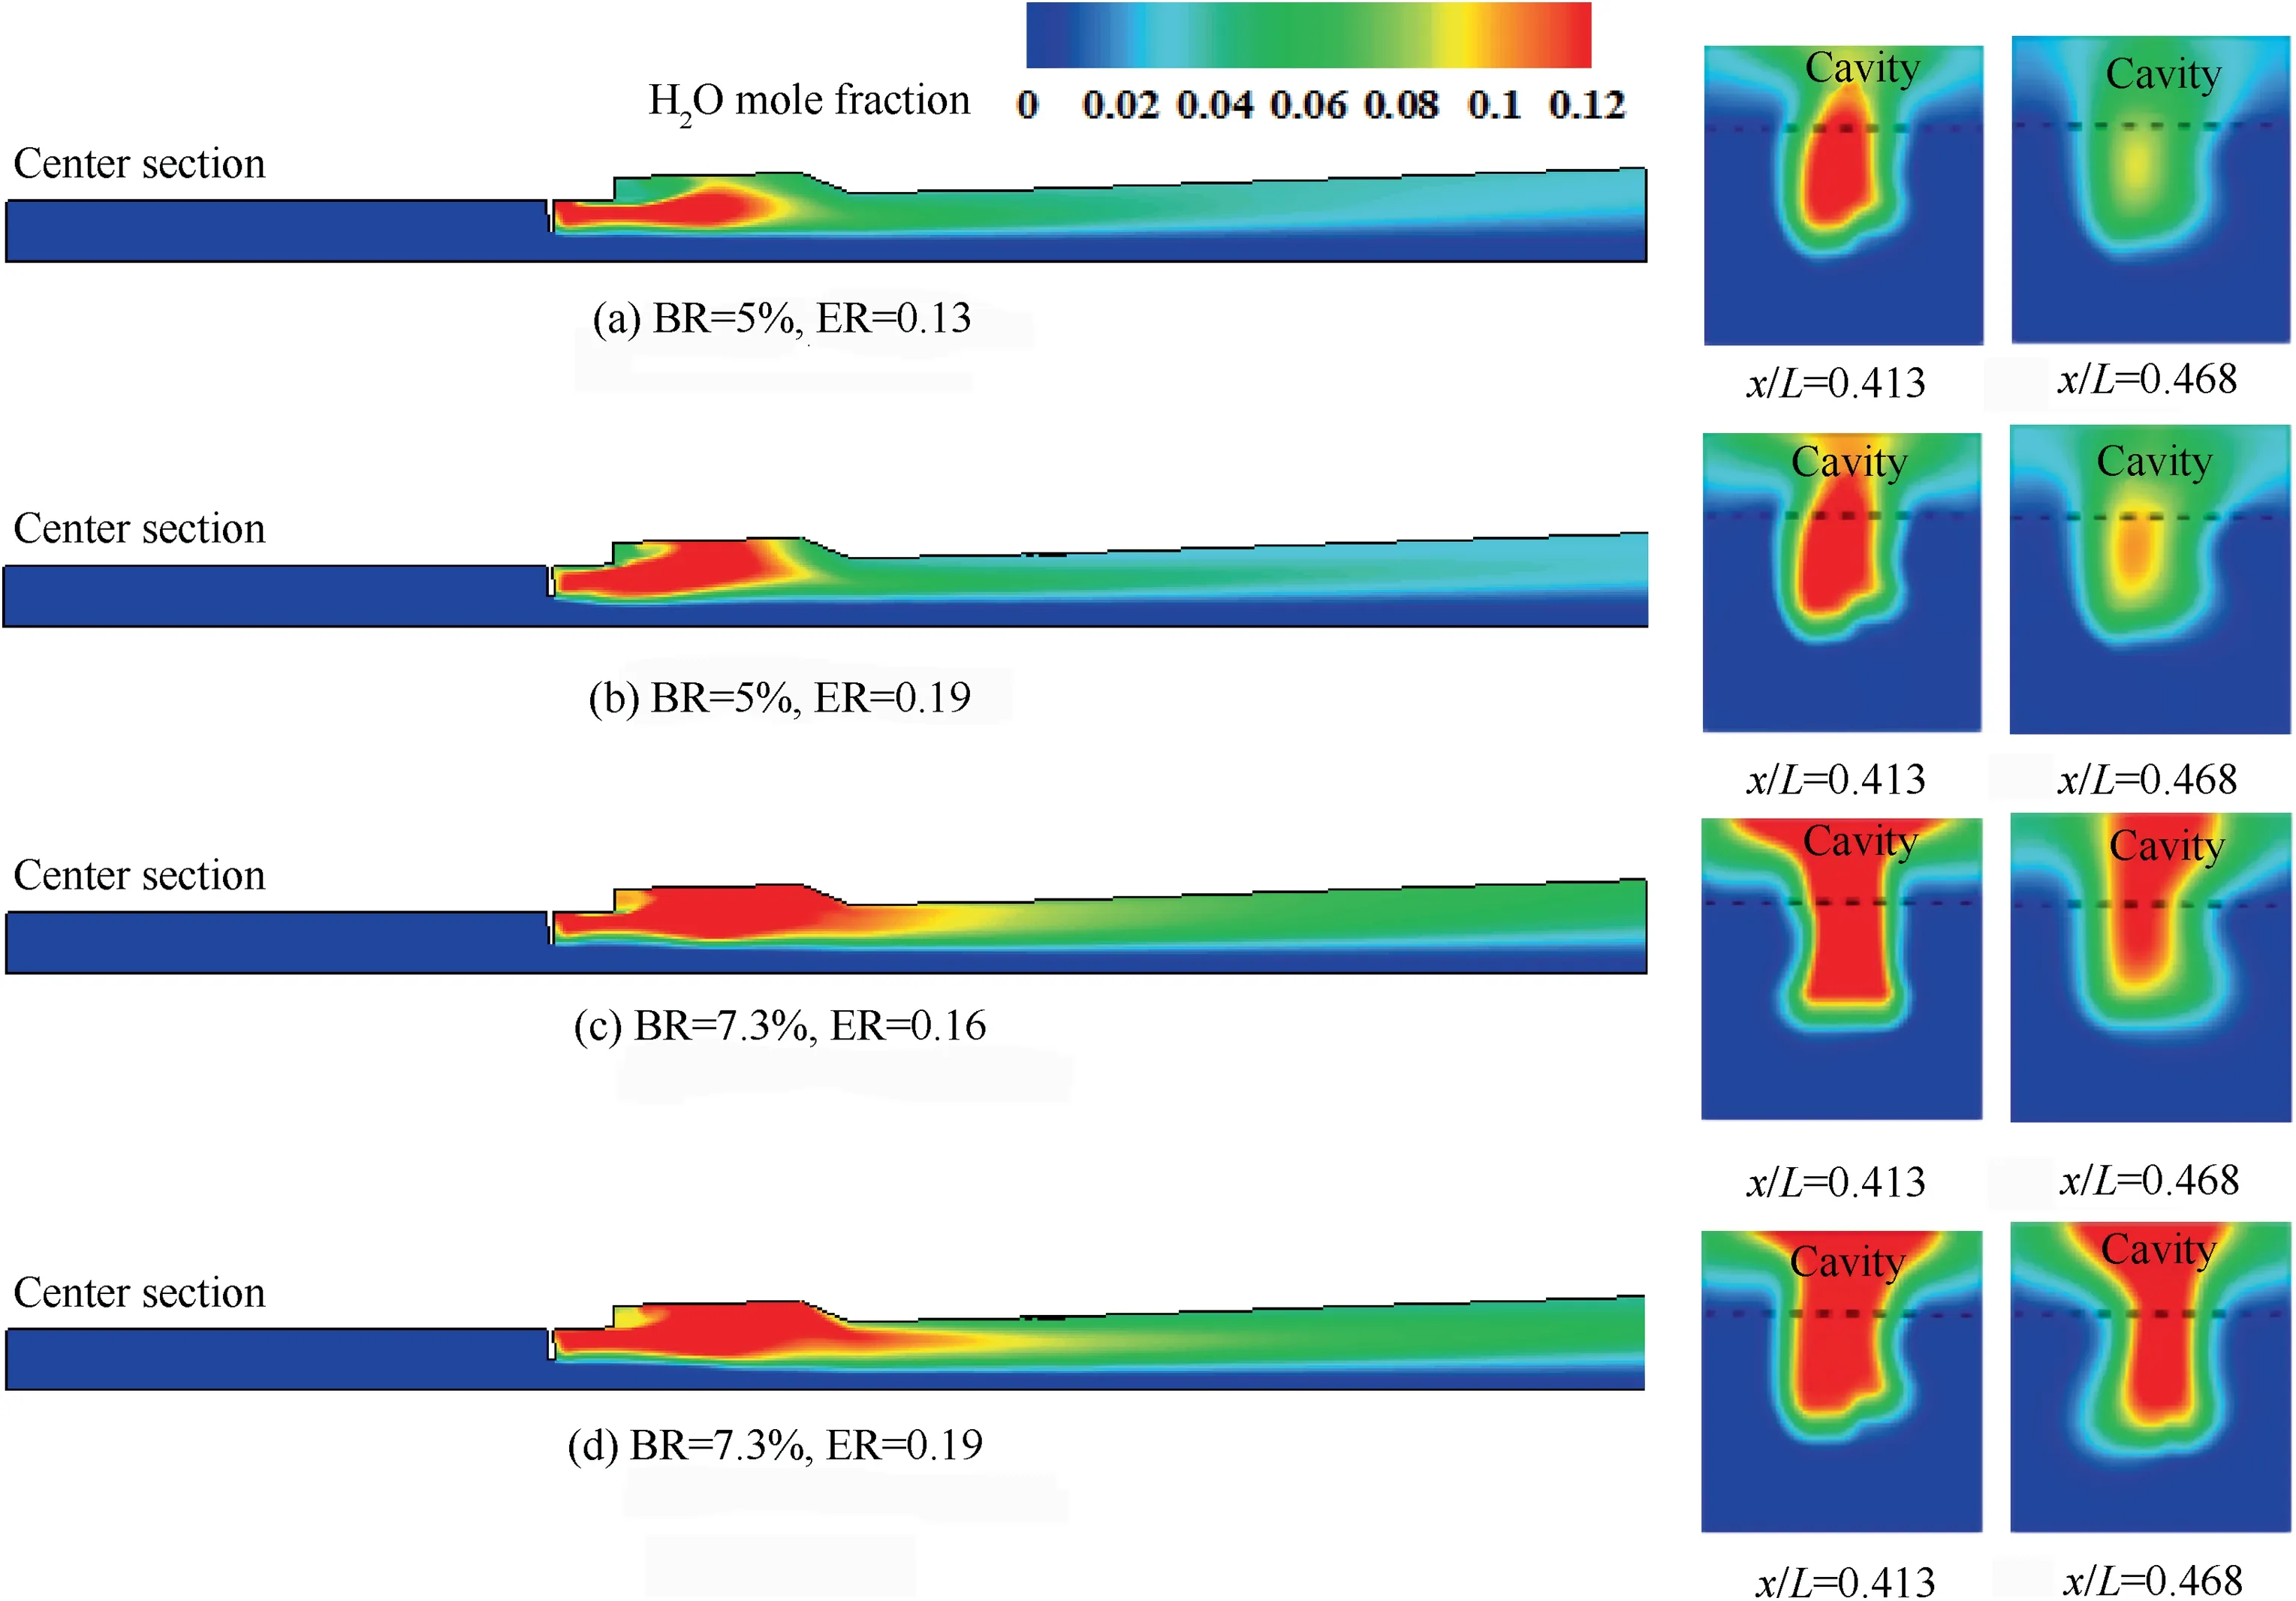
Fig. 18 H2O mole fraction distribution cloud diagrams of different section of combustor.
The authors declare that they have no known competing financial interests or personal relationships that could have appeared to influence the work reported in this paper.
Sponsored by the Seed Foundation of Innovation and Creation for Graduate Students in Northwestern Polytechnical University, China (No. CX2020132).
 Chinese Journal of Aeronautics2022年7期
- Chinese Journal of Aeronautics的其它文章
- An online data driven actor-critic-disturbance guidance law for missile-target interception with input constraints
- Study on excitation force characteristics in a coupled shaker-structure system considering structure modes coupling
- Smooth free-cycle dynamic soaring in unspecified shear wind via quadratic programming
- Active and passive compliant force control of ultrasonic surface rolling process on a curved surface
- High dynamic output feedback robust control of hydraulic flight motion simulator using a novel cascaded extended state observer
- Composite impact vector control based on Apollo descent guidance
