Experimental investigation of shock-buffet criteria on a pitching airfoil
Mehran MASDARI, Aghil ZEINALZADEH, Mohammad Ali ABDI,Mohammad Reza SOLTANI,c
a Faculty of New Sciences and Technologies, University of Tehran, Tehran 1417614418, Iran
b Department of Aerospace Engineering, Sharif University of Technology, Tehran 11365-11155, Iran
c Department of Aeronautical and Astronomical Engineering, University of Washington, Seattle, WA, USA
KEYWORDS Airfoil;Buffeting;Experimental analysis;Hysteresis loops;Pitching motion;Shock wave;Wavelet analysis
Abstract An experimental investigation of the shock-buffet phenomenon subject to unsteady pitching supercritical airfoil around its quarter chord has been conducted in a transonic wind tunnel. The model was equipped with pressure taps connected to the fast response pressuretransducers. Measurements were conducted at different free-stream Mach number from 0.61 to 0.76.The principle goal of this investigation was to experimentally discuss the shock-buffet criterion over a SC(2)-0410 supercritical pitching related to the hysteresis loops of total drag and trailing edge pressure, the behaviour of the shock wave foot location, the pressure distribution over the upper surface,and by implementing the wavelet analysis of the normal force.To ensure capturing the buffet phenomenon by utilizing these criteria, a pressure port has been drilled exactly at the trailing edge of the airfoil where its output was used to detect the buffet phenomenon for different conditions.Visual representation of the flow using the shadow graph flow visualization technique for different test cases is further used to illustrate the unsteady shock wave motion. A comparative analysis of experimental measurements shows that the conducted criteria confirm each other when the buffet phenomenon occurs at the position of the oscillating cycle.
1. Introduction
Shock-wave oscillation has been a subject of various studies as early as 1950s.However, after more than sixty years of researches in this exciting field, the Shock-wave/Boundary-Layer Interaction (SBLI) over stationary and oscillating airfoils has not been still fully understood.Transonic buffet occurs when the structure of SBLI burstsand is often associated with large amplitude, autonomous shock wave oscillations due to the SBLI in which the aerodynamic loads start to fluctuate at low frequency. Such flow instabilities would limit the flight envelope,compressor blades,and severe structural vibrations and aileron buzz.
Various criteria have been successfully concluded that are still used as an indication of the buffet onset.Common criteria of the normal force and trailing edge pressure coefficient divergence are investigated by Lee, Polentzand Sousaet al.presented a new criterion based on the chordwise movement of the aerodynamic center to estimate the transonic buffet onset of transport aircraft.The application of spectral analysis has also been implemented in numerous researches to extract the characteristic of the shock wave oscillation in a time–frequency domain. Kouchi et al.experimentally investigated the buffet onset using the wavelet analysis of time-resolved imaging on the upper surface of a fixed mounted supercritical airfoil equipped with vortex generators. A detailed numerical study of the SBLI around a supercritical airfoil at high Reynolds has been conducted by Szubert et al.in which buffet phenomenon was carried out using the Power Spectral Density(PSD) of the wall-pressure fluctuations at three different locations on the surface of the airfoil as well as in the wake.In that work, the amplification of the low-frequency buffet mode in the shock-wave region was also tracked through wavelet analysis. Modal analysis of the shock-buffet is also a powerful mathematical tool to predict the dynamical mode pair or the buffet mode. In this regard, Poplingher et al.and Zhaonumerically studied RA16SC1 and OTA15A supercritical airfoils,respectively using the Proper Orthogonal Decomposition(POD) and Dynamic Mode Decomposition (DMD) modal approaches.
Several experimental, as well as numerical kinds of research, have been conducted to describe the buffet mechanism over some of NACA airfoils with and without forced oscillation.Furthermore, various wind-tunnel tests have been conducted over the matrix of family-related supercritical airfoil developed by NASA, reported by Harris,have been carried out in some significant researches. Zhao et al.for instance, investigated the buffet boundaries of a SC(2)-20714 thick supercritical airfoil and utilized RMS of pressure coefficient as a criterion of buffet onset. The principal goal of this contribution is to experimentally gain deep insight of the shock-buffet criterion over a thin airfoil from this family known as SC(2)-0410 under pitching motion. This investigation has been carried out in an open circuit suction-type wind tunnel at various free stream Mach numbers. Preliminary investigations included measurements of the steady pressure distribution and flow visualization at Mach numbers from,Ma= 0.27 to 0.85 for a fixed mounted model. A method to detect the buffet onset based on the surface pressure distribution for that fixed mounted supercritical airfoil was introduced by Golestani et al.Moreover, the effects of wall porosity on the flow around this airfoil was investigated.Masdari et al.experimentally studied the buffet phenomenon over that fixed mounted airfoil at various Mach numbers as well as angles of attack, and found that the buffet onset at Ma= 0.66 and α=4.9° occurs with frequency of 80 Hz.In addition to the experimental test of this type of supercritical pitching airfoil in transonic regime, further researches about the impact of reduced frequency on the time lag in pressure distribution in a pitch-pause-return motion has been previously investigated.Following the experimental studies over SC(2)-0410 supercritical airfoil,in this paper,a detailed discussion of various buffet onset criteria is presented by means of the hysteresis loops of the total drag and trailing edge pressure coefficient, the behaviour of the shock wave foot location, the pressure distribution over the upper surface, and by implementing the wavelet analysis of the normal force integrated from the upper surface pressure distribution of the airfoil.
2. Experimental setup
All experiments were conducted in a transonic wind tunnel.This is a conventional open-return type tunnel with a 60×60 cmtest section and operates at free-stream Mach numbers ranging from Ma= 0.4 to 2.5 thru changing the nozzle profile as well as the engine RPM. The tunnel is equipped with variable perforated walls, ceiling, and floor, to prevent shock reflection during the transonic operations.Fig. 1(a) shows a view of the wind tunnel test section with the perforated walls and a 2D model installed across the side walls. The Mach number distribution along the centerline Maof the test section at transonic speeds for various Mach numbers are shown in Fig. 1(b). The data were obtained by Amiri et al.,who studied the steady flow quality assessment of this transonic wind tunnel and improved its performance criterion in the transonic regime based on the operational requirements of the various existing transonic wind tunnels.Vertical lines mark the position of the airfoil in the test section.Apart from this,a chamber was beside the walls to control the boundary layer thickness via an additional power plant system.
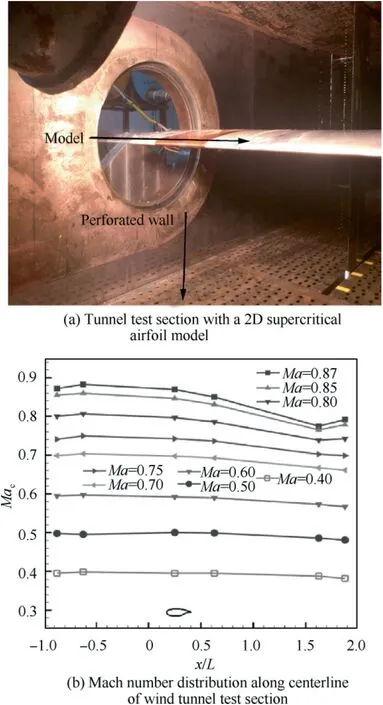
Fig. 1 Wind tunnel specifications.
All data were collected via an A/D, 24 bit, 64 channels board. Furthermore, data acquisition from high-frequency Kulite sensors (CCQ-093-15D) was done by means of a controller. The nominal and maximum operating pressure was 15 PSI.The maximum reaction time is in order of μs.The maximum error at maximum voltage (100 mV) is 0.1% full scale.The Sampling frequency was set at 2 kHz and a low-pass filter was designed and implemented in the acquisition program with a cut-off frequency of 500 Hz.
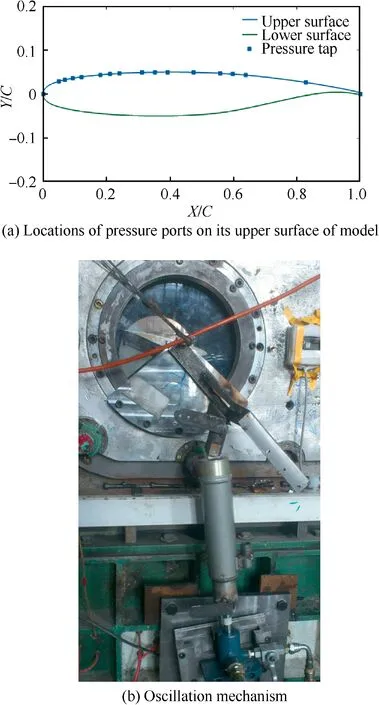
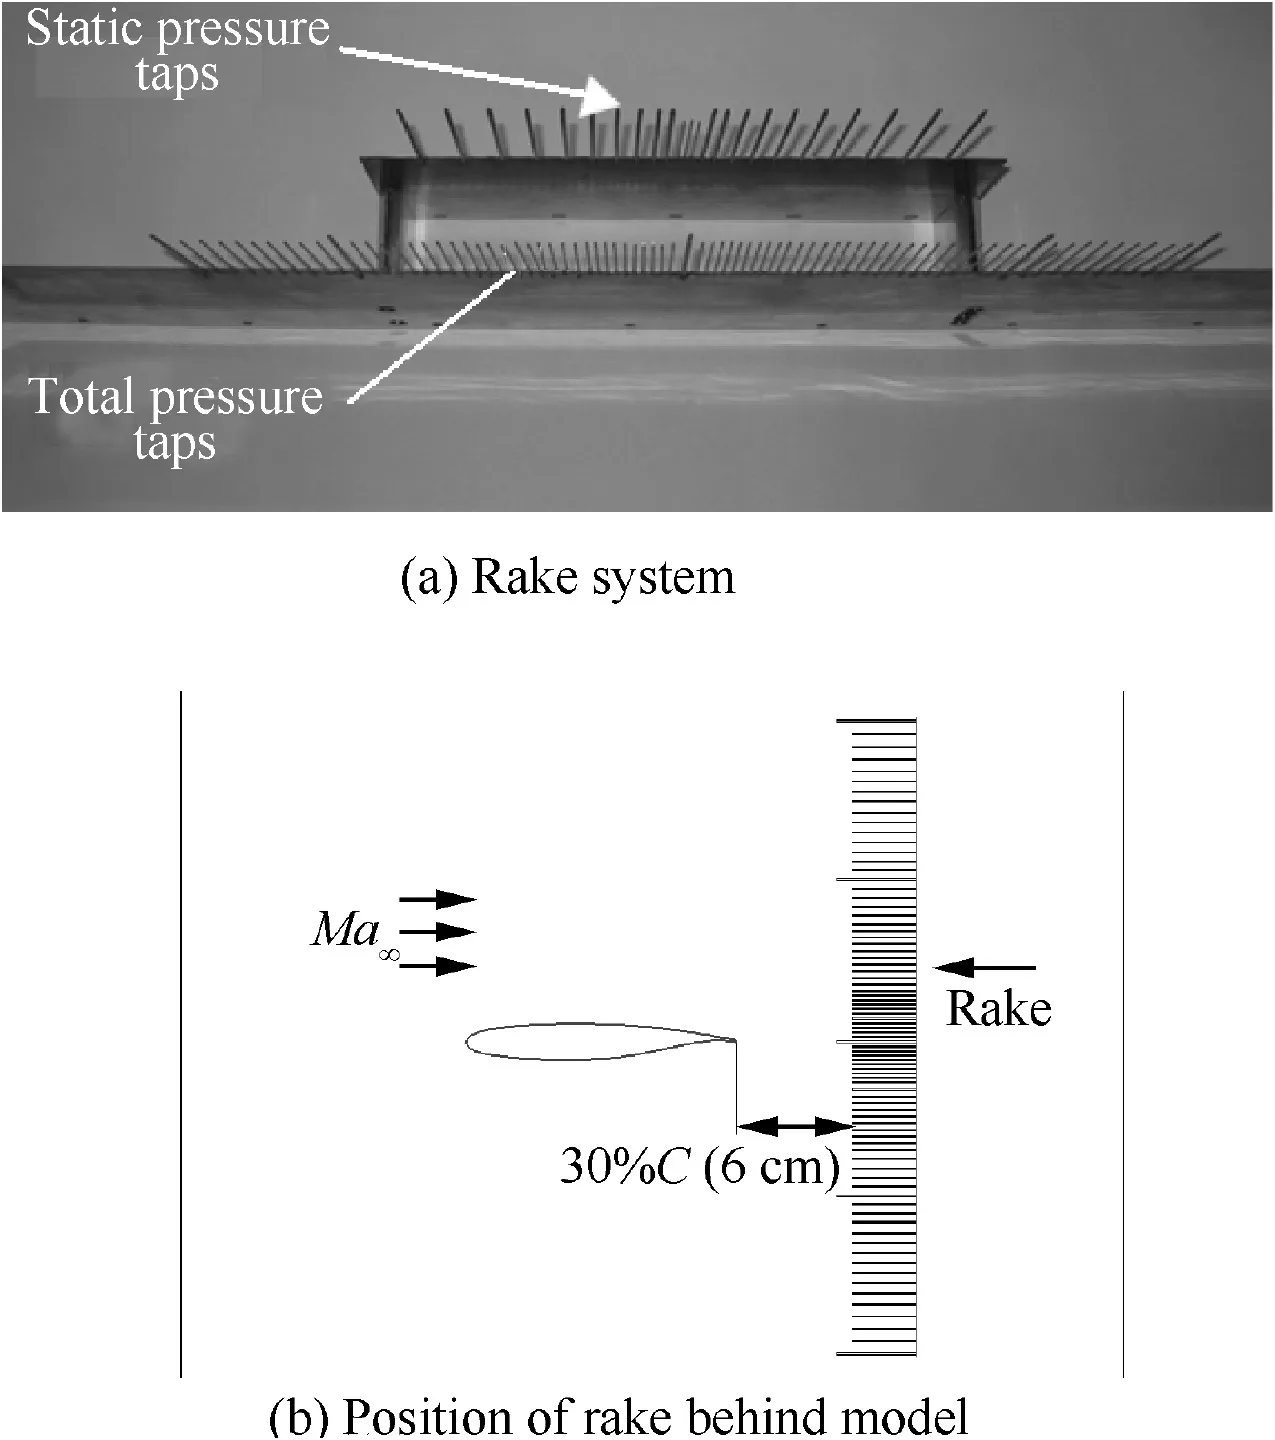
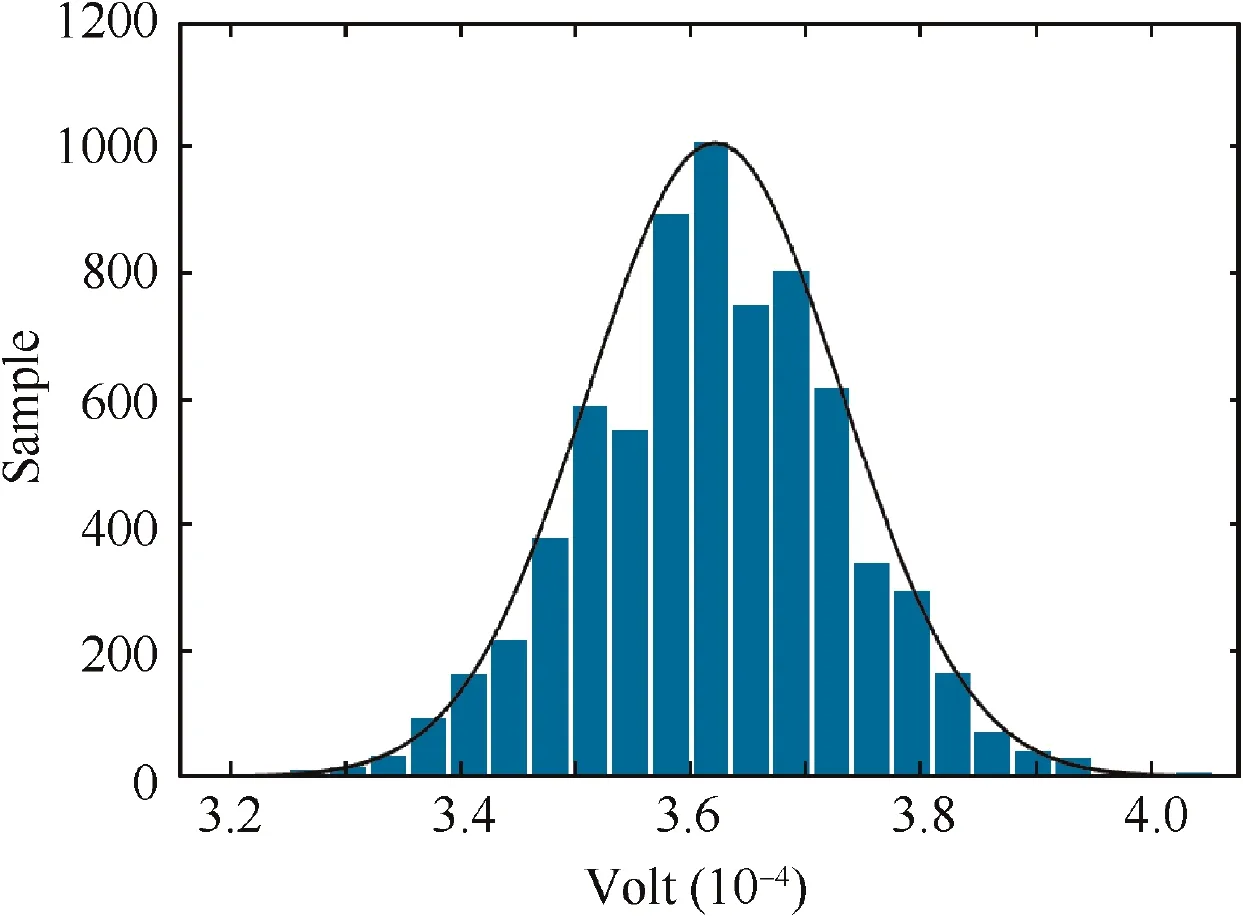
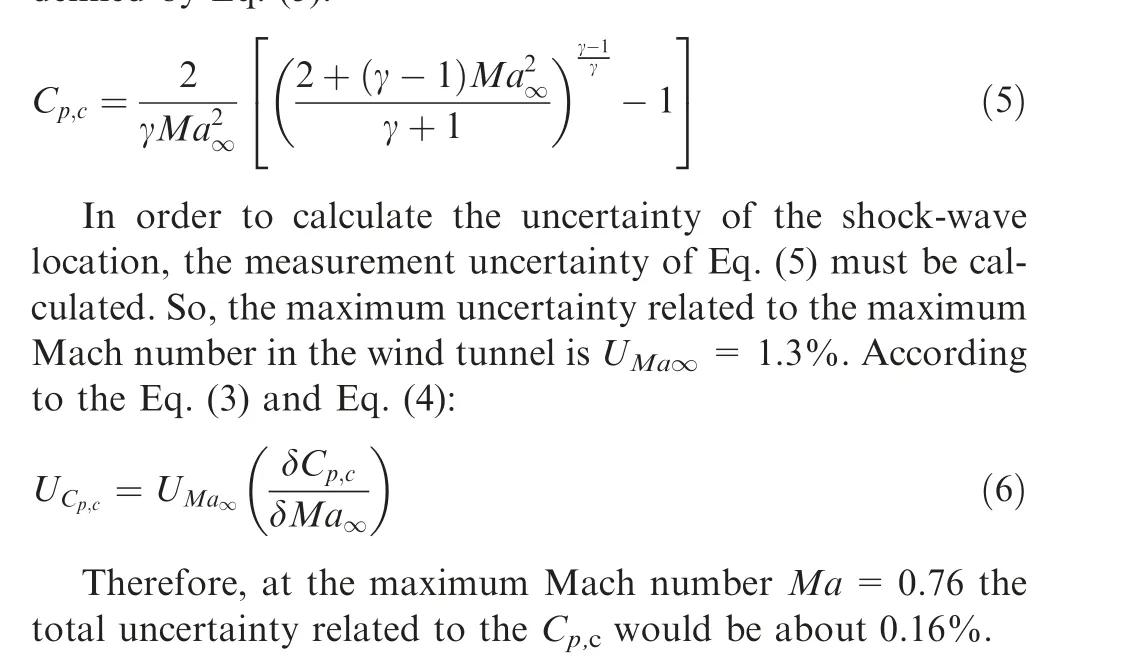
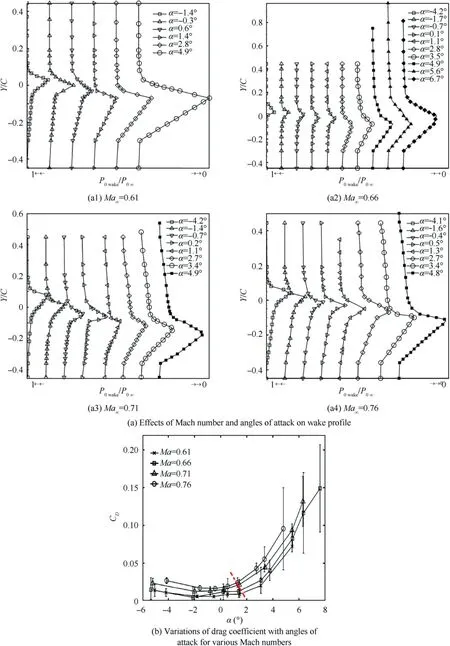
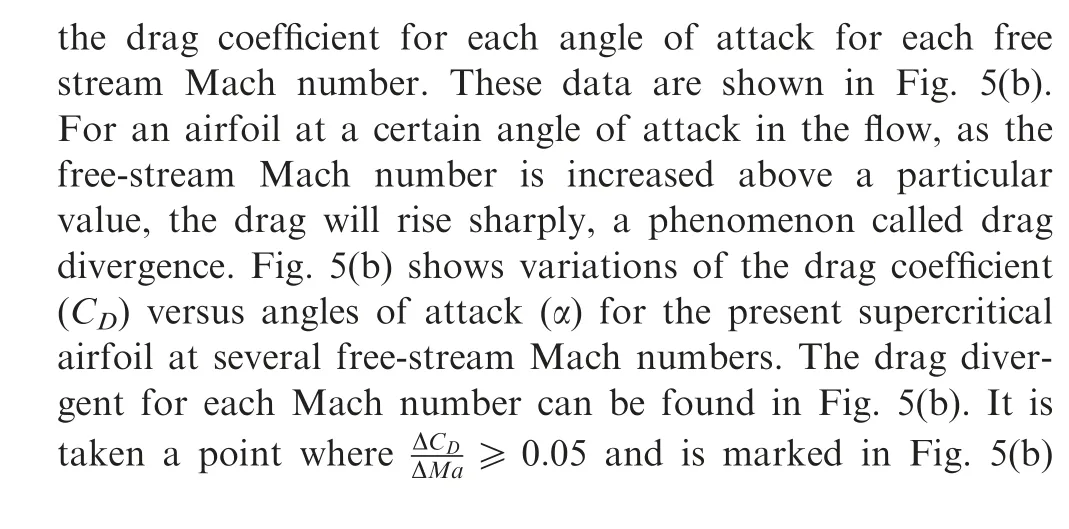
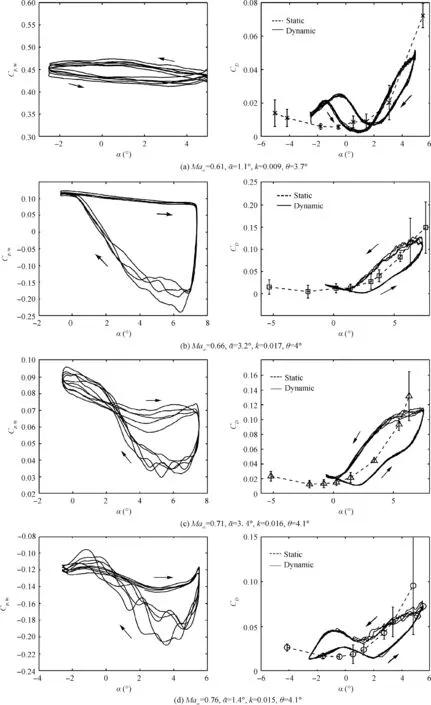
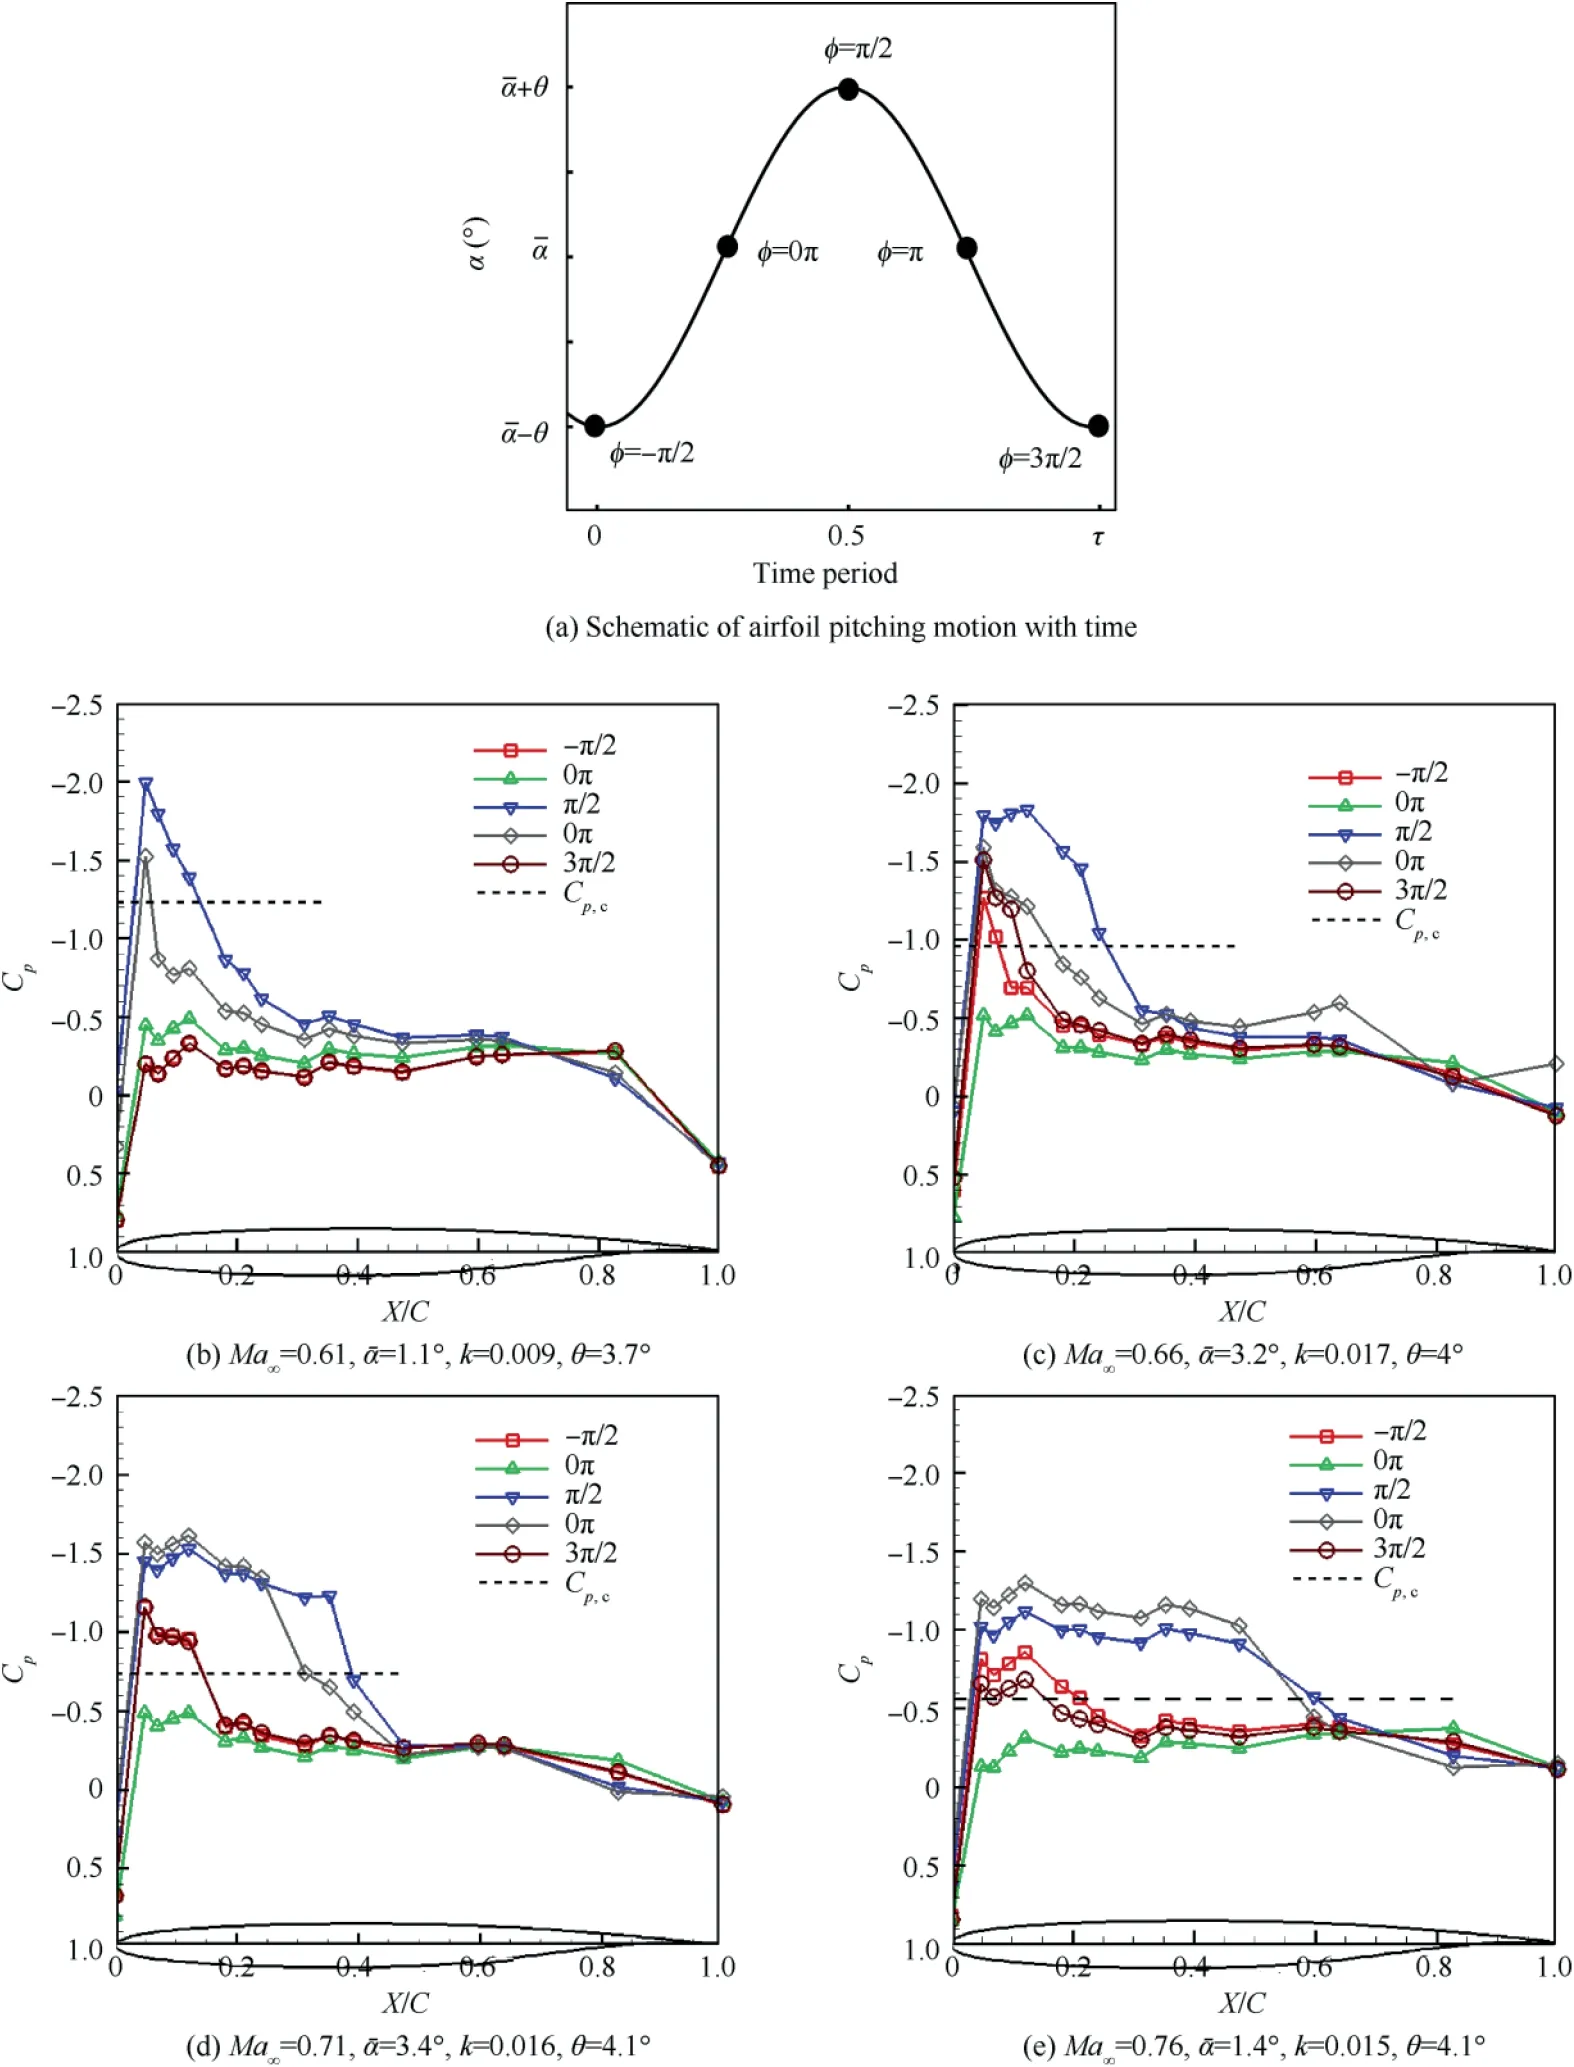
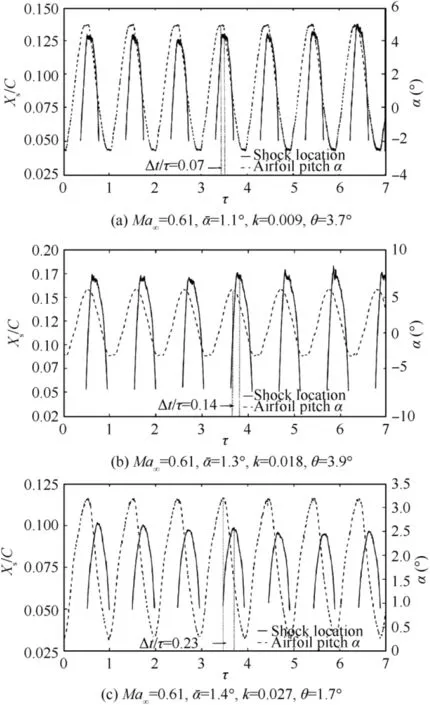
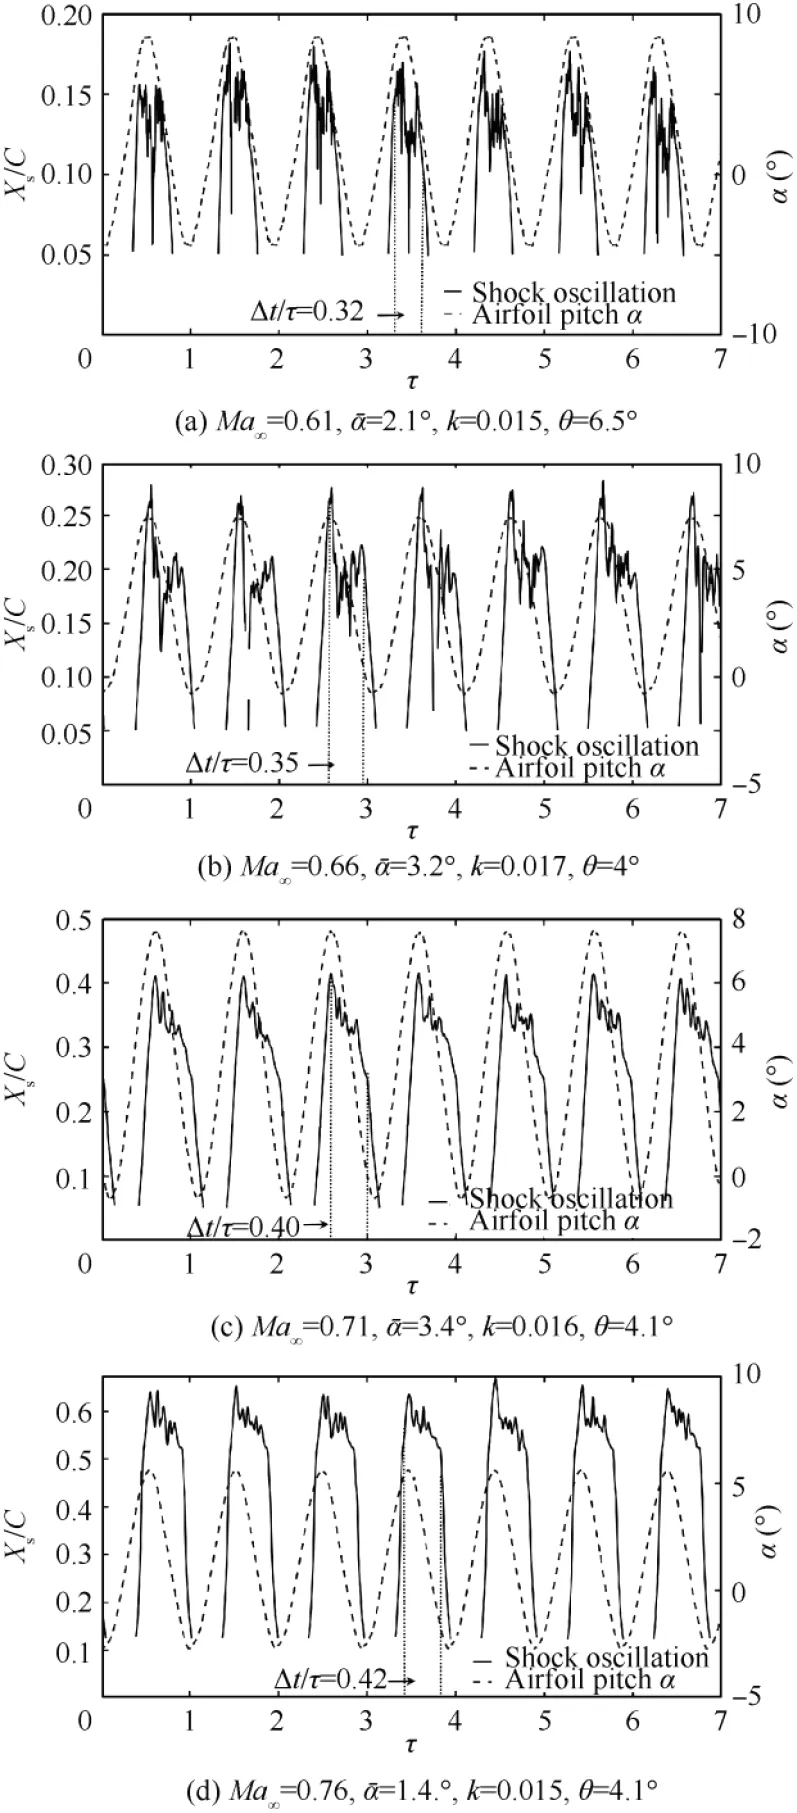
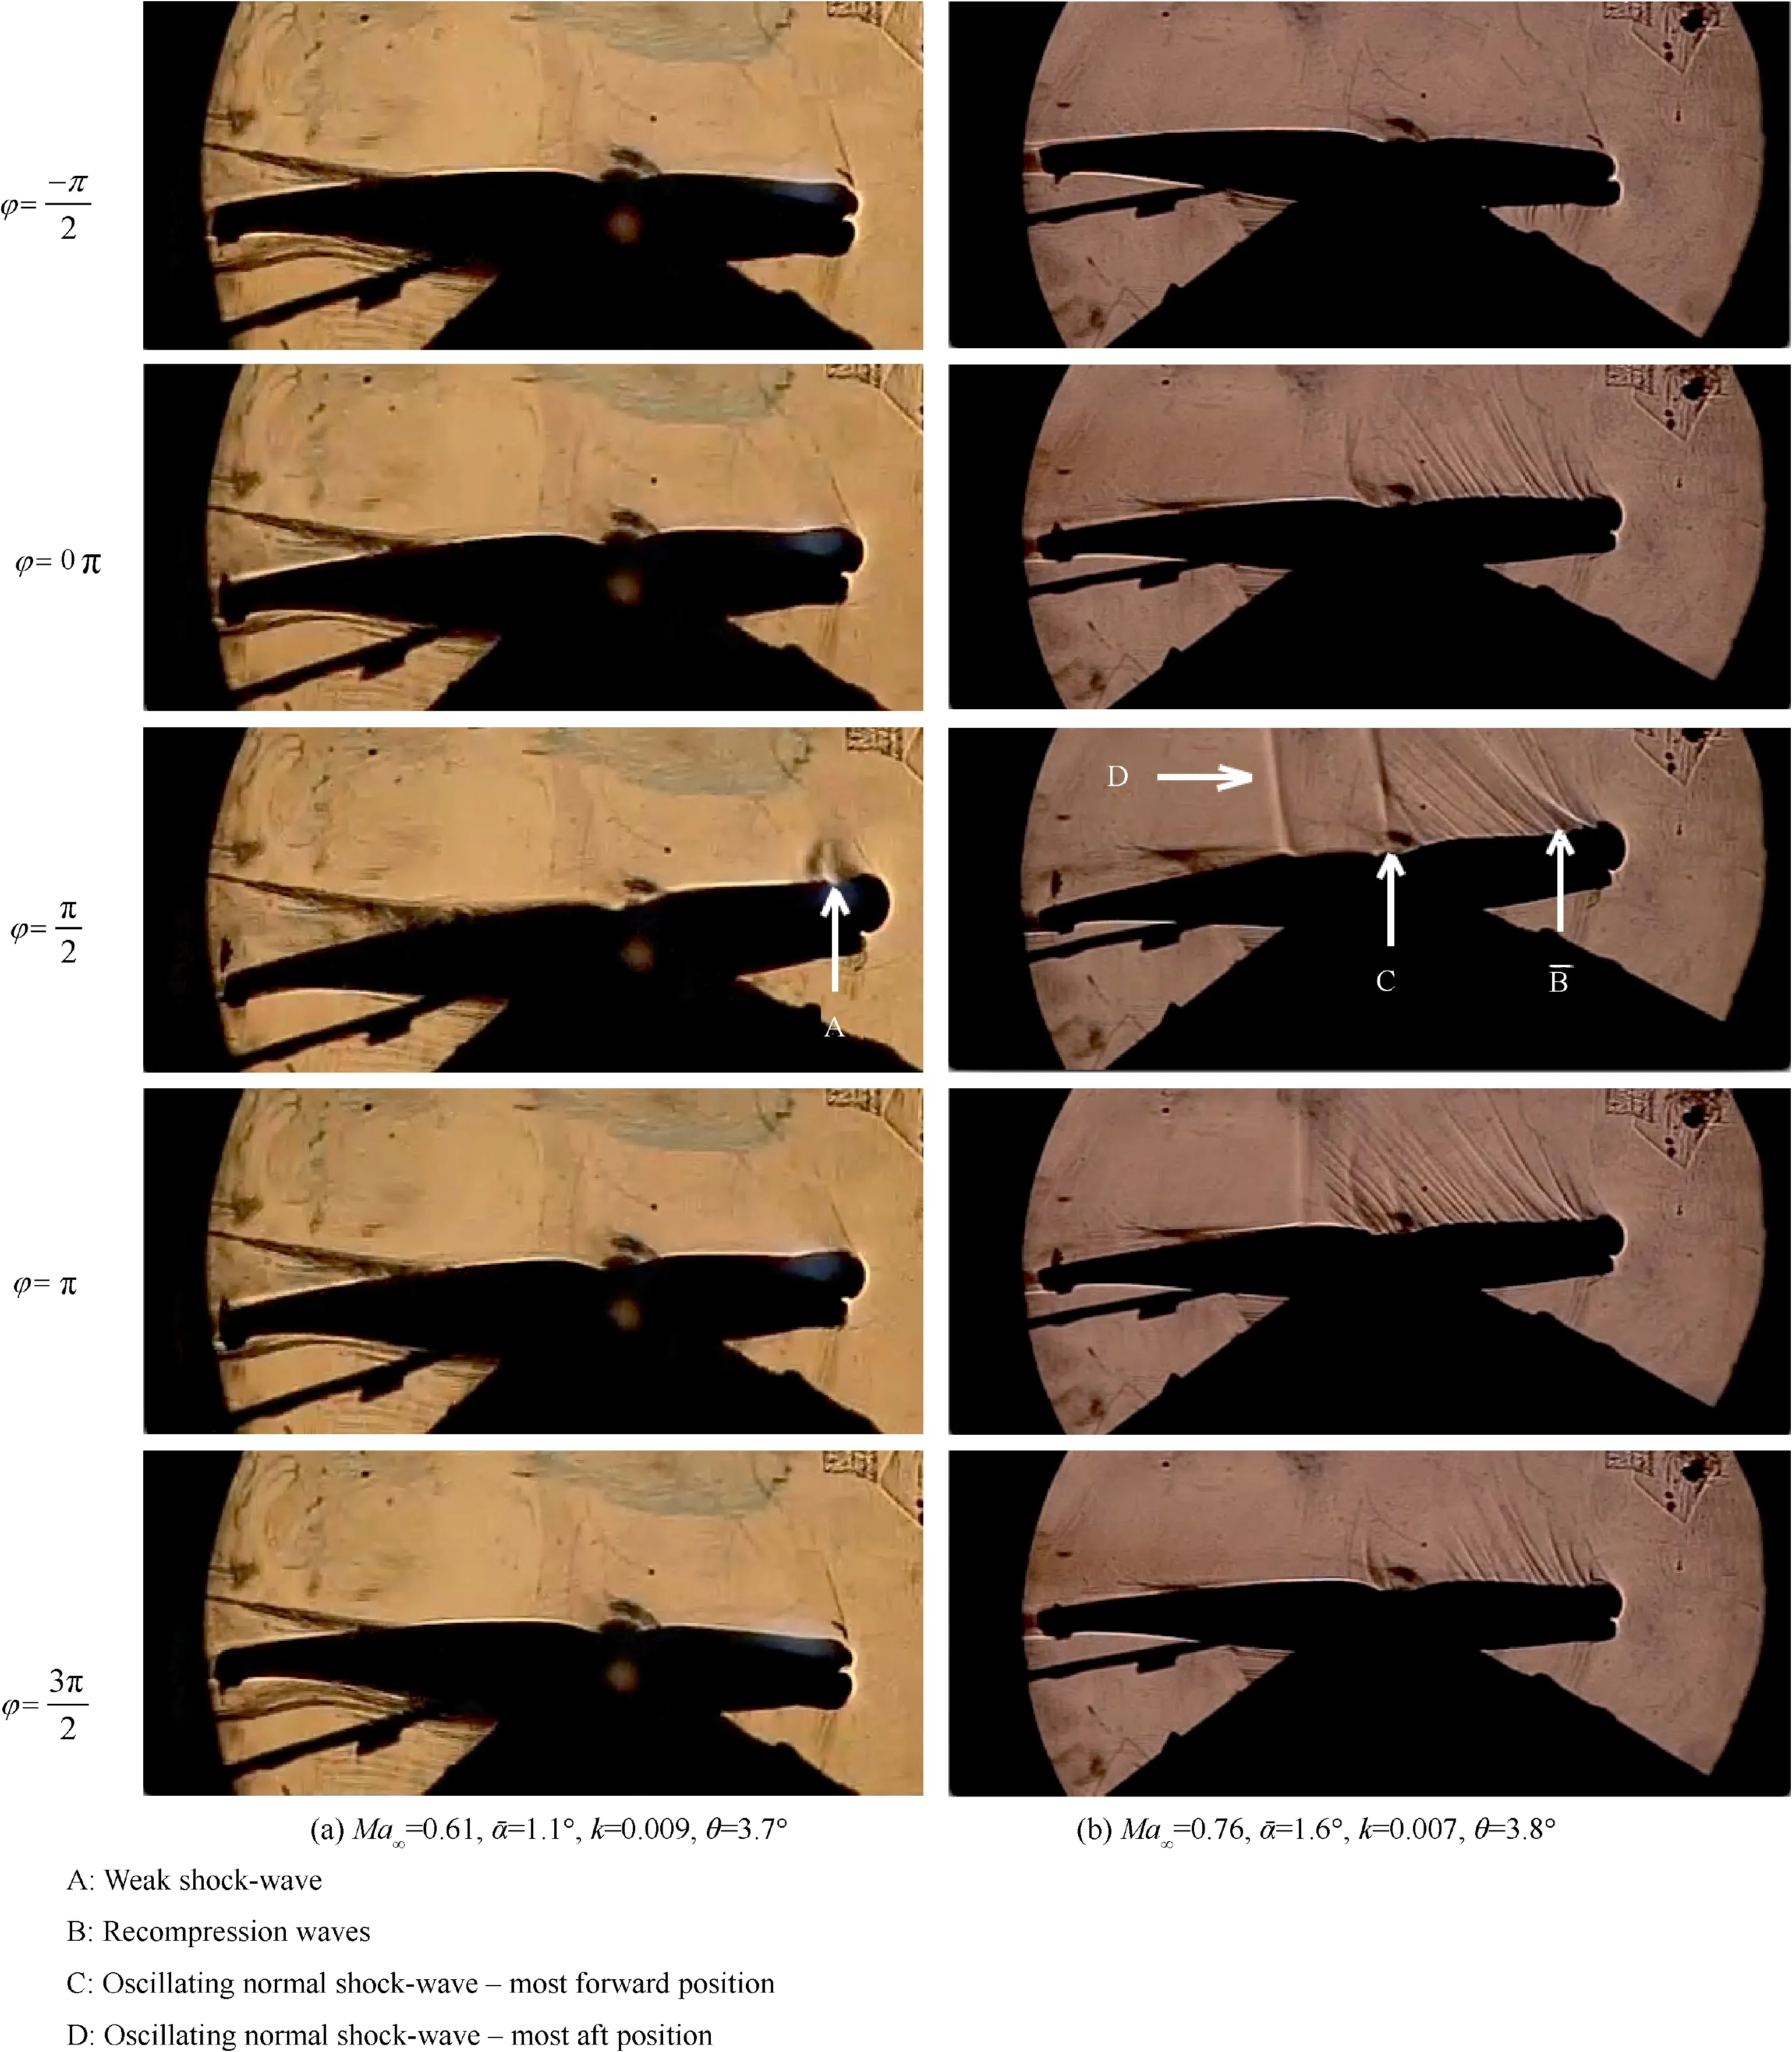
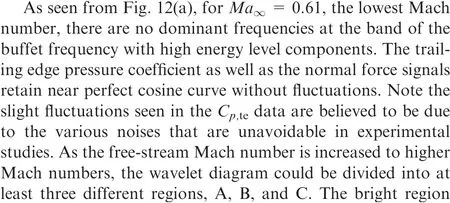
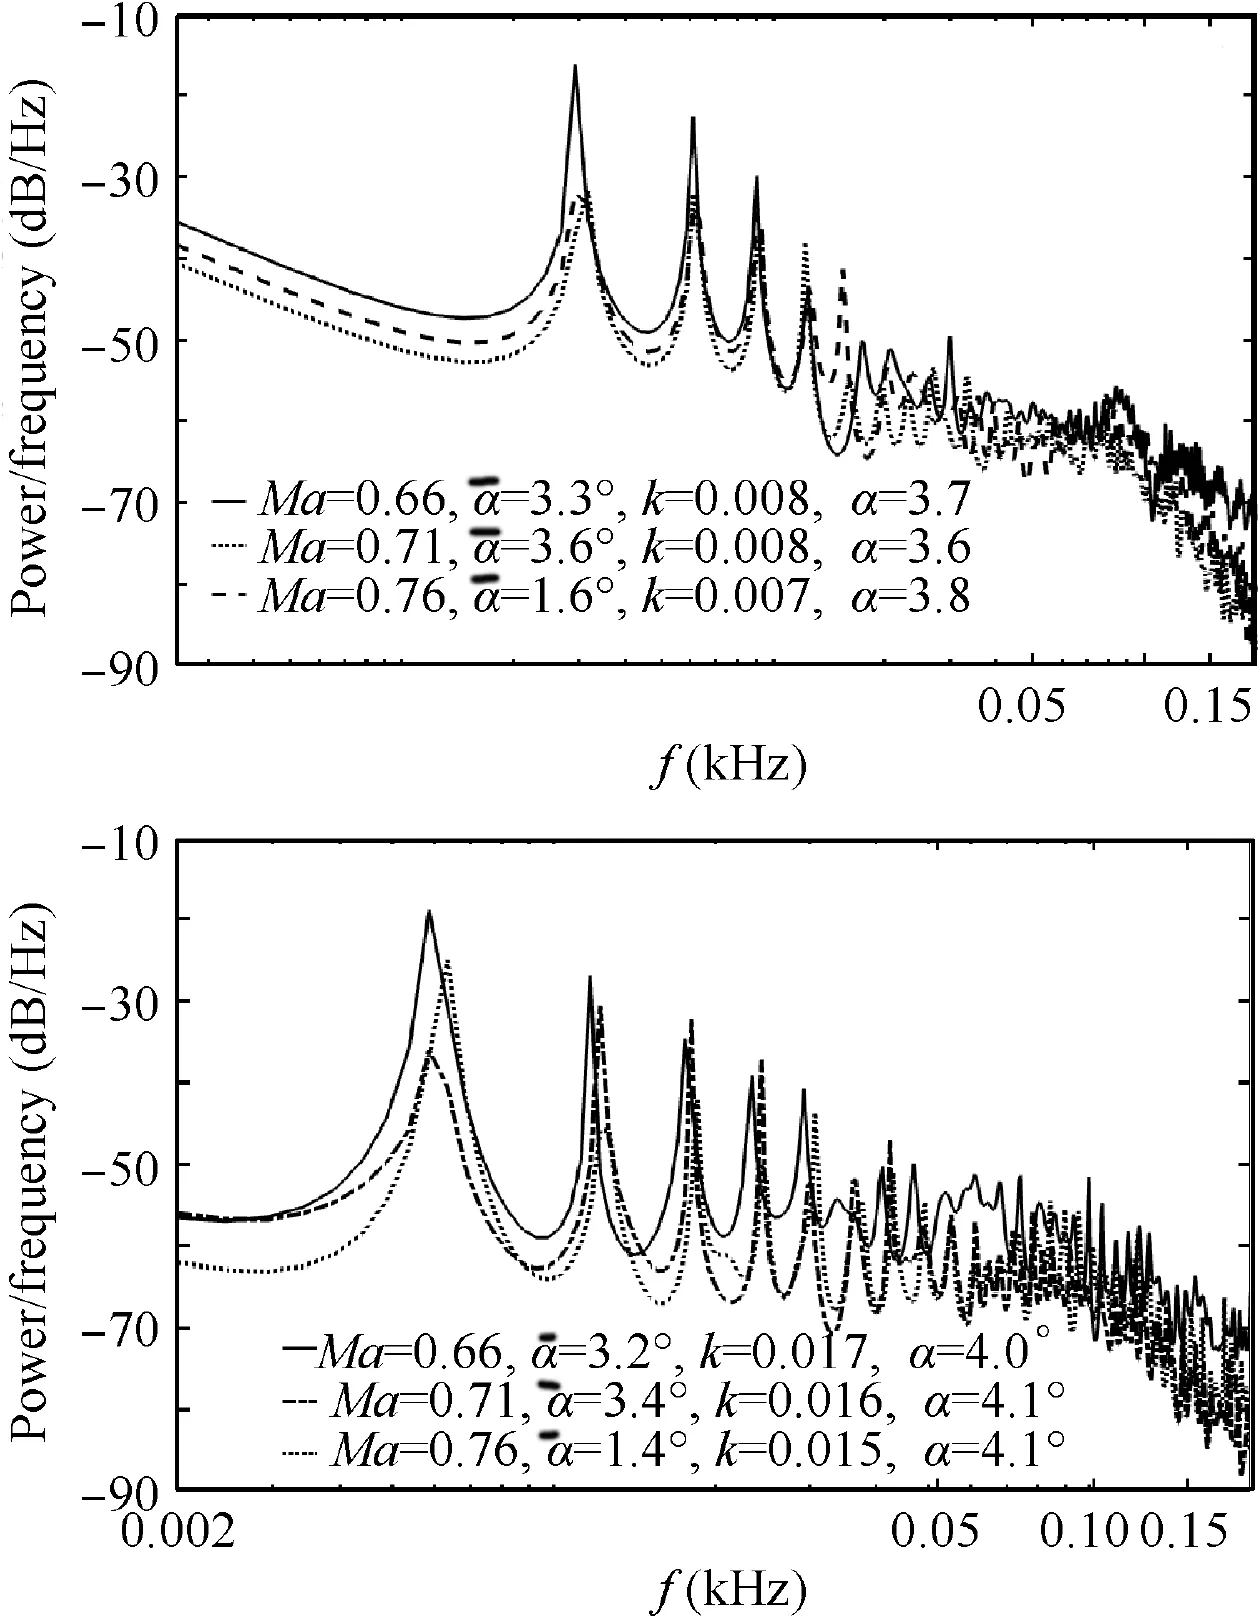
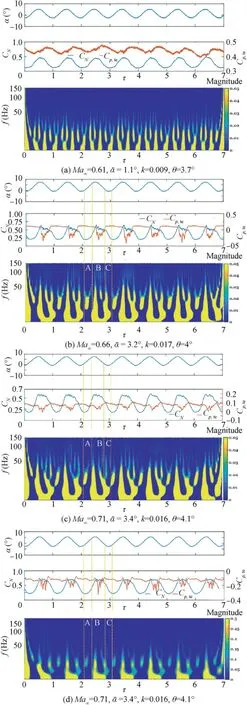
All data were acquired at free-stream Mach numbers of Ma=0.27 to 0.85,but this paper aims to focus on the Mach number ranges between 0.61 According to important researchesthe resonance and phase lead appeared near the buffet onset when the airfoil forced movement frequency was close to the buffet frequency.The frequency lock-in occurs and stays present until the structural nature frequency is near the double buffet frequency.In the present article, the maximum attainable oscillating frequency in the wind tunnel is 9 Hz, corresponding to k=0.027. The maximum natural frequency of the model,including all supports that was calculated, is also about 38 Hz. As discussed in the following sections, the pitching supercritical airoil would have an extended buffet frequencyband about 80 to 150 Hz, which is too much higher than the maximum oscillating frequency of the pitch motion.Therefore,all results of this paper will not meet lock-in and resonance zones. The Mach numbers have been determined based upon the previous static tests over this airfoil.For the current tests,the pitch motion was of the sinusoidal type motion: where α- is the mean angle attack of the motion, θ is the amplitude. Attempt to measure pressure distribution of a forced pitching airfoil using Kulite and pressure transducers sensors is a reliable technique in different experimental researches to conduct state-of-the-art measurement techniques. In this regard,Sugioka et al. installed both Kulite and pressure transducer sensors over the suction side of a NASA Common Research Model (CRM) airfoil and conducted phase-lock lifetimebased Pressure-Sensitive Paint(PSP)technique to obtain pressure distribution on the surface of a pitching airfoil at each phase by the phase-lock method.Fig.2(a)shows the location of Kulite sensors installed on the upper surface of the present thin SC(2)0410 supercritical airfoil with forced pitching oscillation.The forced oscillations are induced by an electric actuator on one side of the test section,as shown in Fig.2(b).The airfoil model had a span of 60 cm and a chord (C) of 20 cm. In addition to the upper surface pressure distribution, two rakes were installed behind the model. The rakes were used to measure the wake profile behind the model, as shown in Fig. 3(a). Due to some limitations, the utmost distance that the rakes could be positioned behind the model was at 30%of the chord, as shown in Fig. 3(b). Since the distance from the airfoil TE to the rake was not far enough to ensure the static pressure recovery within the wake, a static rake was also incorporated in the wake to measure the static pressure inside the wake; hence the wake profile and the corresponding wake drag would be accurate.All pressure ports static and total were connected to very high-frequency Kullite sensors located very close to each port to ensure an accurate unsteady measurement with minimum possible pressure lags. The pressure data’s uncertainty was calculated and for all transducers were about 1.8% of their full scale. There are two main sources of errors in experimental tests,namely bias and precision. All sensors’ bias errors are considered the mean difference between two sets of offset data for a certain pressure transducer sensor. The precision error is also considered as a triple time of the standard deviation for a certain sensor signal.Therefore,one can calculate the uncertainty(U) for each sensor from Eq. (3), where Band Pstand for the bias error and precision error, respectively. The total amount of errors of pressure sensors in each test is calculated from Eq. (4). Table 1 Parameters of forced airfoil oscillation,XCrot =0∙25 Fig. 2 Supercritical airfoil model and oscillation mechanism. Fig. 3 Wake measurement mechanism. Fig. 4 Normal distribution of a sample sensor at X/C=21%. Fig.5(a)shows the effects of free-stream Mach number on the wake profile behind the airfoil at various angles of attack.The free-stream Mach number is varied from Ma=0.61 to Ma= 0.76, and for each Mach number, wake total pressure (P)for multiple angles of attack are obtained. The wake profiles obtained from both static and total rakes show that as the angles of attack increase, for a constant Mach number, the wake thickness increases. From this figure, one can calculate Fig. 5 Effects of angles of attack and free-stream Mach number on wake and drag. The formation of the hysteresis loops at higher Mach numbers is hugely complicated. From the concepts of unsteady aerodynamics, it can be inferred that the load hysteresis loops are formed due to the flow lag and lead phenomenon,such as separation,reattachment,etc.,during each oscillating cycle.In an unsteady compressible flow regime around a pitching airfoil,an SBLI may also be formed and then vanish periodically.As soon as the SBLI structure vanishes, the static pressure right at the trailing edge of the airfoil will diverge, and the buffet phenomenon will occur. An advantage of using these hysteresis loops criteria is that they are able to predict how much of a complete cycle is under buffeting flow. Furthermore, when the installation of a pressure port near the trailing edge is not feasible for airfoils having thin trailing edges, hysteresis loops gain an intuitive insight into the phenomenon. Fig. 6 shows variations of C, and the wake drag versus the involved hyperparameters.The drag coefficient is obtained by the wake pressure data measured behind the airfoil. The wake pressure was measured by the high-frequency miniature pressure transducers located at the end of the stainless-steel tubes of both total and static rakes to ensure minimum time lag. The measured pressure data for each angle of attack were then integrated to get the corresponding drag coefficient. It is seen that for Ma=0.61,Fig.6(a),the trailing edge pressure coefficient loops(C)are counterclockwise and do not show severe discrepancies during both upstroke and downstroke motions as well as no sign of divergence is detected from these data.Further,the drag variation loop is clockwise,as seen from Fig. 6-a. In the next case related to Ma= 0.66, Fig. 6(b),there is no fluctuation in the hysteresis loops during the upstroke portion of this motion.However,they cover a significant amount of the cycles when the airfoil in its downstroke phase of the motion,Fig.6(b).Furthermore,the clockwise hysteresis loops related to Care seen to diverge strongly near the maximum angle of attack.This is a condition where the buffeting phenomenon is believed to occur for the pitching airfoil,which induces a massive flow separation into the wake region periodically and also contributes to the fluctuation of the total drag hysteresis loop, Cvariations in Fig. 6(b). Further, the variation of the drag hysteresis loop changes from a semiclock-wise direction in Fig. 6(a) to the counterclockwise one,Fig.6(b).The same behaviour is seen for the free-stream Mach number of Ma= 0.71, Fig. 6(c). Fig. 6(d) shows that these fluctuations have covered a larger portion of the cycle, and the directions remain the same as the previous case.According to these results,one can define a criterion for the buffet onset as a condition where the direction of the hysteresis loops of the trailing edge pressure and total drag coefficients with angle of attack turns into clockwise and counterclockwise,respectively,while buffet phenomenon occurs. Interestingly, in this situation,it is seen that the hysteresis loops show fluctuations during a portion of their oscillation cycle. Fig. 6 Total drag hysteresis loops for different test cases. Fig. 7 Pressure distribution over upper surface of airfoil for different test cases. Fig. 8 Effects of oscillating frequency on shock-wave motion(Type B). Fig.9 Shock-wave location at buffet flow for different test cases. Fig. 11 shows the power spectral density of the normal force(C) signal for this pitching airfoil for k=0.008 and k=0.016 corresponding to f=3 Hz and f=6 Hz respectively. The dominant lowest frequency seen from these signals spectral properties stems from the airfoil’s periodic motion or the forced oscillation. The other consequent lower spikes are harmonies of the first dominant frequency. Other following narrow band frequency characteristics are considered evidence of the buffet phenomenon for a 2D airfoil model. The wavelet application will fulfil the lack of spectral information of signal energy in the time domain. For the current tests, all signals recorded by the sensors located on the upper surface of the airfoil experience high transient flow.Therefore,most of the signals are time-domain signals in their raw format and contain dominant spectral components that appear in time.In this paper,the wavelet transforms of the normal force signal calculated by integrating the surface pressure distribution, is obtained. For a good representation of the periodic buffet, the wavelet analysis of the normal force, time history of the motion, as well as the trailing edge pressure coefficient of the airfoil are conveyed into one diagram, named alphadiagrams; such a figure is shown in Fig. 12 for various cases.The color ranges for the buffet phenomenon cases are set in such a way that the dominant frequencies above 50 Hz, which are products of energy dissipation, could be presented. The magnitude intervals are much more than the uncertainty of C, as mentioned in the uncertainty section. Nevertheless,in this paper,the spectral properties and qualitative trends are more noticeable. The Morlet function which has a good resolution in the magnitude of the wavelet components is applied. For this analysis, 512 time-scales of the wavelet are used. Fig. 10 Shadowgraph images for pitching airfoil. Fig. 11 Power spectrum density of normal force signal for different test cases. Fig. 12 Wavelet analysis of normal force upper signal for different Mach number. A forced oscillating SC(2)-0410 supercritical airfoil has been tested under pitching motion in transonic speeds to study the buffet phenomenon via both the pressure distribution over the airfoil and the total drag.The study was carried out by discussing methods of detecting the buffet by means of airfoil hysteresis loops of the total drag and trailing edge pressure coefficient, the behavior of the shock wave location, the pressure distribution over the upper surface, and by implementing the wavelet analysis of the normal force integrated from the upper surface pressure distribution of the airfoil. It was observed that: (1) When the airfoil is in its downstroke portion of the cosine motion, the buffet phenomenon occurs, leading to the divergence of the trailing edge pressure. And the normal lift coefficient shows fluctuations dur-ing a significant portion of the oscillation cycle. The shadowgraph images also confirmed these observations at the beginning of the downstroke portion of the motion in which the structure of the SBLI bursts and the moving shock-wave begins to fluctuate intensively. (2) Once the buffet occurred,the hysteresis loops re-lated to the trailing edge pressure coefficient as well as the total drag coefficient changed their directions to clock-wise and counter-clock-wise, respectively. (3) The shock-wave foot location over a pitching air-foil was affected by a change in the effective angles of attack in each phase of the motion. A phase shift be-tween the shock-wave location and the cosine motion of the airfoil was also experimentally measured,which was due to the effects of changes in the circulation and the apparent mass. (4) The power spectral of the normal force showed that the dominant frequencies were assigned to the forcedoscillation frequency and its consequent harmonies. (5) The wavelet analysis of the normal force signal showed that when the buffet phenomenon occurs, at least three different scenarios in the diagram could be clearly detected,namely the existence of the strong magnitudes,followed by a drastic reduction and dissi-pation in the magnitude of the dominant frequencies, and lastly an increment in all magnitudes culminating with damping the shock-wave oscillations. Compared with the common criteria for detecting the buffet onset, such as the trailing edge pressure divergence, the wavelet analysis of the normal force is more feasible than constructing an orifice just at the trailing edge of the airfoil, which is difficult and for many thin airfoils is almost impossible. The authors declare that they have no known competing financial interests or personal relationships that could have appeared to influence the work reported in this paper.

3. Uncertainty



4. Results and discussion
4.1. Static airfoil results
4.2. Hysteresis loops criterion
4.3. Pressure distribution

4.4. Flow visualization
4.5. Spectral analysis

5. Conclusions
 Chinese Journal of Aeronautics2022年7期
- Chinese Journal of Aeronautics的其它文章
- An online data driven actor-critic-disturbance guidance law for missile-target interception with input constraints
- Study on excitation force characteristics in a coupled shaker-structure system considering structure modes coupling
- Smooth free-cycle dynamic soaring in unspecified shear wind via quadratic programming
- Active and passive compliant force control of ultrasonic surface rolling process on a curved surface
- High dynamic output feedback robust control of hydraulic flight motion simulator using a novel cascaded extended state observer
- Composite impact vector control based on Apollo descent guidance
