Influence and optimization of parameters of prepreg viscosity during placement
Lei ZU, Xinzho XIA, Qin ZHANG,*, Xiolong JIA, Hubi WANG,Guiming ZHANG, Jinhu LU
a Anhui Province Key Laboratory of Aerospace Structural Parts Forming Technology and Equipment, Hefei University of Technology, Hefei 230009, China
b Key Laboratory of Carbon Fiber and Functional Polymers, Ministry of Education, Beijing University of Chemical Technology,Beijing 100029, China
c State Key Laboratory of Organic-Inorganic Composites, College of Materials Science and Engineering, Beijing University of Chemical Technology, Beijing 100029, China
KEYWORDS Automatic placement;Cohesion model;Optimization;Peel test;Probe test;Significance of influence;Viscosity
Abstract This paper tested the viscosity of prepreg in the automatic placement process, and conducted the probe and placement-90°peel tests through the test systems.The law of variation of prepreg viscosity during the laying process was studied through these tests under different conditions by taking the peel force to intuitively and quantitatively characterise the viscosity of the prepreg.The results show that this viscosity is inversely proportional to the laying rate, proportional to the laying pressure,and quadratic to the laying temperature.Then,peel tests were simulated to validate both the correctness of the peel test and that of the probe test data fitting the two-line cohesion model. On this basis, a response surface test for laying and peeling was designed. Taking viscous peel force as the response target,the laying process parameters were optimised and the significance of their influence was further studied.The error between the test value and the predicted value of the maximum viscous peel force is 3.03%.
1. Introduction
High-performance composite materials have become one of the most important manufacturing materials in the aviation field due to their excellent performance.They are often used for the main structural parts of commercial airliners. In some large aircraft fuselages, composite materials account for more than 50% of the total mass. To promote wide application of composite materials,it is necessary to develop better and faster manufacturing technologies.With the increasing demand for composite materials in various fields, the Automated Fiber Placement (AFP) technology has gradually replaced traditional manual placement due to its advantages, such as faster moulding efficiency, higher moulding reliability and lower material waste rate. AFP means laying raw materials layer by layer on the surface of a mould under different laying conditions, as shown in Fig. 1. For the raw material of the placement process, the prepreg, viscosity is an important indicator determining the final performance of the parts formed.On the one hand, lack of viscosity easily causes defects such as slippage and bridging. On the other hand, too large viscosity is not conducive to manual removal of defects, resulting in the waste of materials and manhours.Therefore,it is necessary to conduct a quantitative study on the influence mechanism,characterization and control of the viscosity of the prepreg during the placement process, so as to obtain an appropriate process window during placement.
Some methods for quantitatively measuring the viscosity of prepregs have been developed domestically and abroad, viz.the probe, peel and tension/compression tests.The probe and tension/compression tests have the same principle: they both apply a stable pressure to the surface of the prepreg through a smooth contact surface under certain conditions,maintain it for a period of time,and then separate at a certain rate. The load-displacement curve of separation process is used to characterise the viscosity of prepreg. The peel test has three advantages over the other two methods.It intuitively conducts test through the laid prepreg and avoids errors caused by the conversion of the contact-separation method,measures the bending stiffness of prepreg, and provides intuitive observation of the adhesion between the prepreg layers.Thus, it is more widely used in studying the viscosity of prepreg.
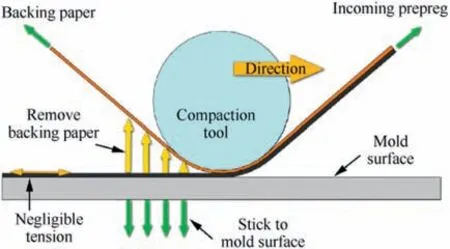
Fig. 1 Schematic diagram of automatic placement.
Huang et al.and Banks et al.used both T-type peeling method and suspension roller peeling method to study the influence of laying rate, pressure, and temperature on the viscosity of prepreg,and changed the curing degree of the prepreg to study the quantitative size and change law of its peeling fracture energy.Nakamura et al.used the probe test to study the variation of the viscosity of prepreg with holding pressure time,holding pressure size,holding pressure temperature,separation rate and other factors, but did not convert the probe test conditions into actual placement conditions.Shu et al.fully supplemented the above research work. They provided a comparison method, established the connection between the contact-separation method and the peel test, and conversed the conditions of the probe test. However, this conversion did not have universal applicability because different materials and sizes of the pressure roller have different sensitivities to pressure and the corresponding conversion relationship between the holding pressure time and the laying rate differs.In fact, the intuitive load obtained by the traditional peel test could not be directly regarded as the viscosity of prepreg. The load measured using the testing machine generally includes the bending force of the prepreg bypassing the peeling hub. In addition, it generally contains the magnitude of the viscosity between the wheel and the hub if the operation is not fine enough. To solve this problem, Crossley et al.and Banks et al.developed a set of equipment that could simultaneously carry out laying and peeling for experimental research. However, because laying and peeling are performed at the same time, the experimental laying rate is far from the actual laying rate limited by the loading of the testing machine. Budelmann et al.studied the influence of crucial process and material parameters such as temperature,compaction force,debonding rate, and ageing on prepreg tack using a rheometer as a test apparatus.To further improve the final performance of recent advanced Variable Stiffness (VS) panels, Gu¨rdal et al.conducted analyses of both variable stiffness panels for in-plane and buckling responses. Hao et al.developed an integrated framework of exact modelling, iso-geometric analysis and optimization for variable-stiffness panels for the global optimisation, enhancing both accuracy and efficiency of optimisation algorithm of variable stiffness composite panels.
However,it can be seen that there is little research on combination of the probe test and the peel test,the two-line model in the research of adhesive layer debonding, and the influence of process parameters and their coupling on viscosity of the prepreg, etc. Focusing on these three aspects, the current research built a probe test mould and a placement-peel test device, respectively. The viscosity of carbon fiber prepreg and its law of influence during placement were studied using two kinds of tests under different conditions. Given that failure in the finished product is likely to occur between the resin and the mould, only the viscous behaviour and size between the prepreg and the mould were studied hereof.In the probe test, the separation energy was defined and calculated directly as the area enclosed by the separation load-displacement curve and the horizontal axis in the separation process, and its variation law was further analysed. Then,the first layer of the prepreg was laid on the placement test platform, and the peel force was measured through a 90° peel test. Peel tests were simulated to validate both correctness of the peel test and the probe test data fitting the two-line cohesion model. Finally, the scope of the test was reduced, and the test was designed in accordance with the principle of Response Surface Method (RSM). To optimize the viscous peel force,the laying temperature,laying pressure,laying rate,and their coupling effects on the viscous force during placement were analysed.
2. Experimental
The method and theory of both probe test and peel test from Refs. 18 and 19 are adopted.
2.1. Probe test
The method of probe test has been widely used in measurement of the viscosity of pressure-sensitive adhesives, and has formed a universal standard abroad.In such a test,the probe head is firstly contacted with the surface of the object to be measured, held under a certain pressure for a period of time,and then separated at a certain rate.Sequentially,the viscosity of the surface of the object to be measured is characterised using load-displacement data. In rheology, the viscosity of a substance is defined as its ability to resist the flow of external forces. A certain rate of strain is applied to the object and the ratio of the required stress to the strain rate is used to reflect the viscosity of the substance.The probe test and rheological principles were combined herein to test the viscosity of the prepreg.
2.1.1. Probe test devices and materials
The prepreg used in the experiment was Toray’s T700-HX7901 prepreg(the areal density of the prepreg was 150 g/mand the resin content was 30wt%). The probe test was conducted on Shenzhen Wance single-column mechanical testing machine ETM503 A. The test device structure and model are shown in Fig.2.The pressure rate was 2 mm/min,and the separation rate was 30 mm/min. To simulate the placement conditions more realistically, the prepreg was first placed on the gasket having the same material (stainless steel 304) as the pressure roller, and then the temperature control box and mould heating tubes were used to heat the probe needle and mould.
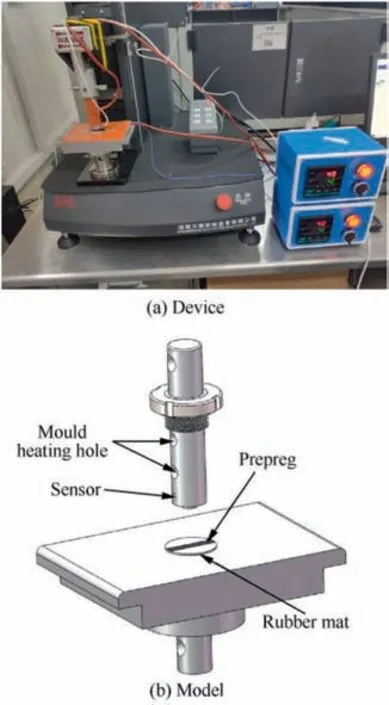
Fig. 2 Probe test device and model.
2.1.2. Probe test method
Three condition parameters of the probe test were set. In accordance with the accuracy requirement of the testing machine, the holding time (t) was set to 0.5-5.0 s, the laying pressure (P) was specified in the range between 0.03-0.30 MPa,the pressure data was converted into the probe needle load according to the diameter of the needle (9 mm) and applied on the testing machine, and the laying temperature(T) was set to 25-52 °C.
During the test,the downward pressure step was in the positive direction, whereas the upward separation process was in the negative direction. Thus, the separation force measured on the testing machine was a negative value, as shown in Fig. 3, and transforming the effective experimental data into zero-based data was necessary.The area enclosed by the separation load-displacement curve and the horizontal axis in the separation process is calculated and defined as the separation energy G,as shown in Fig. 4, where σ is stress, Nis the maximum stress of the probe test, Kis the stiffness of the tensile separation, δis the displacement of the maximum stress point, δis final damage displacement.
2.2. Peel test (90°)
A set of laying and peel test devices was built, including an automatic laying test table, and a 90° peel test device. During the test, the prepreg was laid on the bottom plate of the peel mould under certain conditions on the laying test table.Then,the prepreg peel test was conducted.
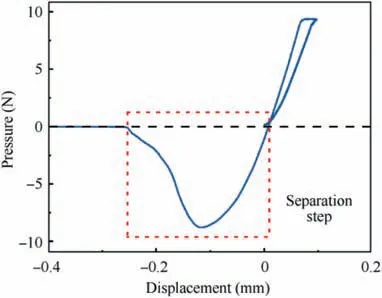
Fig. 3 Effective data during probe test.
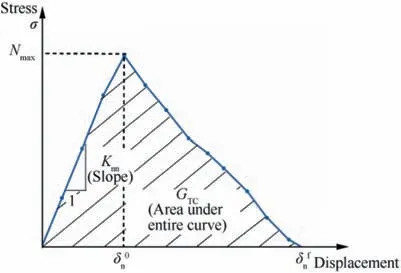
Fig. 4 Stress-displacement curve of probe test.
2.2.1. Peel test device
An automatic laying experiment platform was used to simulate the prepreg laying process.This platform is capable of controlling the laying temperature, pressure and speed. The heating module of the laying table was composed of a mould heater and a thermocouple embedded in the peeling plate, so as to allow the temperature to range from room temperature to 80 °C.
The 90° peel test device was used in conjunction with the mechanical testing machine. The prepreg used in the peel test was the same as that used in the probe test. It was cut into a width of 25 mm and a length of 40 mm, and then stored in an environmental chamber for 30 min before testing. The peeled prepreg was divided into three sections, with the test regions denoted as Ar-T1 and Ar-T2 and the traction area as Ar-H to eliminate the influence of the bending force of the prepreg itself. In all these sections, the film liner was retained to exclude the influence of the viscous effect between the peel roller and the upper layer prepreg. The length of both test regions was 100 mm. Section Ar-T1 was pre-laid with a prepreg film on the mould to isolate the prepreg from the mould,whereas Section Ar-T2 did not contain any pre-laid film. In this way, the force measured in Section Ar-T1 was regarded as the prepreg bending force, whilst that measured in Section Ar-T2 was regarded as the sum of the prepreg bending force and the viscous peel force. The difference of the two could be regarded as the viscous force of the prepreg,as shown in Fig. 5.
2.2.2. Peel test method
The peel test adopted a single factor method. The test was divided into three groups,and each group was subdivided into 10 tests. The experimental conditions are shown in Table 1.The temperature of the peeling bottom plate was maintained,peeling was performed on the peel test device, and load-dis-placement data were recorded. The laying process is shown in Fig. 6.

Table 1 Automatic placement test conditions.
3. Test results and analyses
3.1. Results and analyses of probe test
The effects of holding time,probe pressure and probe temperature on the viscosity of the prepreg were studied, and the results are shown in Fig. 7. The tests of pressure holding time group were carried out under the conditions of a temperature of 40°C and a pressure of 0.15 MPa(corresponding to a probe pressure of 9.54 N). The tests of probe pressure group were conducted at a probe head temperature of 40 °C and with a pressure holding time of 2.5 s. The tests of probe temperature group were performed under a pressure of 0.15 MPa and with a holding time of 2.5 s(corresponding to a holding pressure of 9.54 N). The results were shown as follows:
(1) In the test of holding time group, it was found that the separation energy was approximately linearly related to the holding time and increased by 3.304 J/mmfor every 0.5 s increase in the holding time. As the holding time increased within a certain range, the heating time of the resin on the prepreg and its viscosity increased.
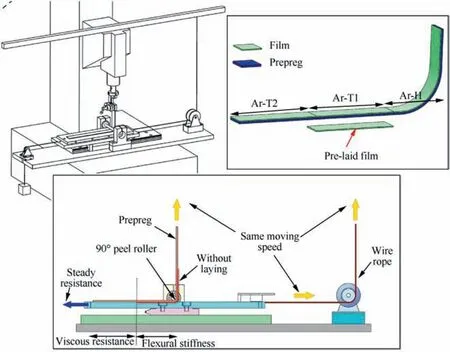
Fig. 5 Principle of 90° peel test.
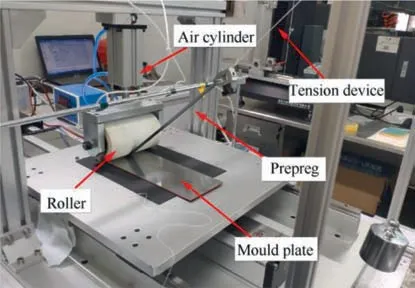
Fig. 6 Test device for automatic placement.
(2) In the test of probe pressure group, the separation energy was found to be approximately linearly related to pressure. The separation energy increased by 4.546 J/mmwhen the probe head pressure increased by 0.03 MPa.The reason is that an increase of the pressure to a certain extent facilitates the flow of the resin and increases its viscosity.
(3) The separation energy increased first and then decreased with the increase in temperature,showing approximately a quadratic relationship with a temperature peak of around 37 °C.
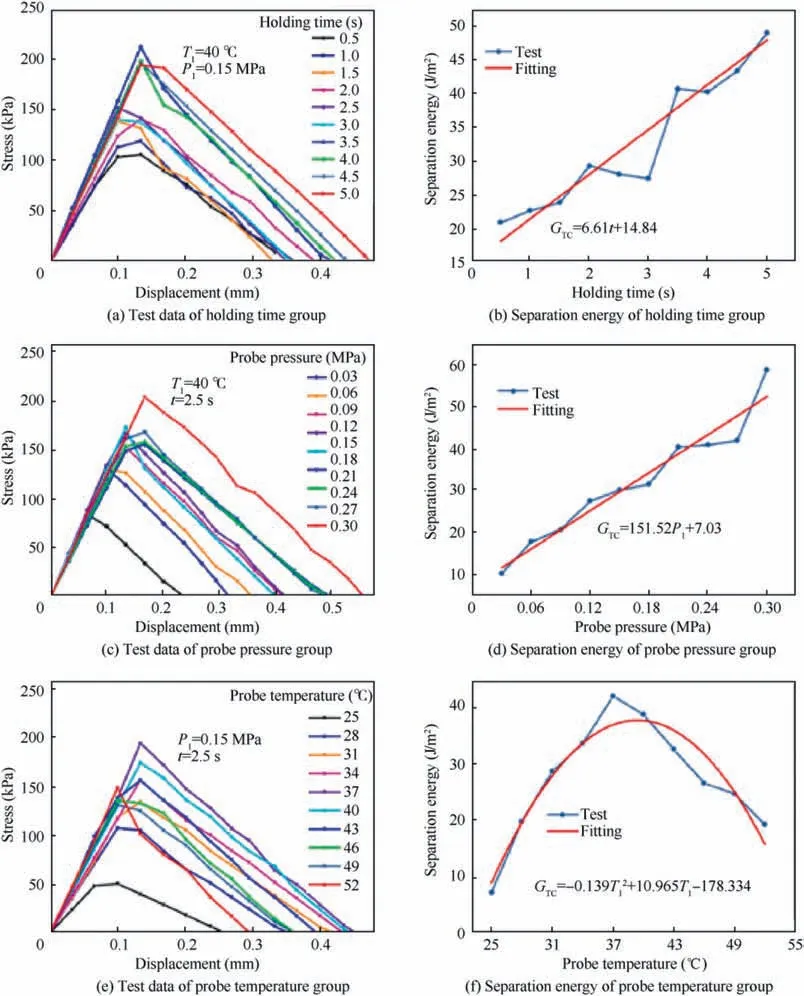
Fig. 7 Results of probe tests of material T700-HX7901.
Ref.19 shows that in the probe tests,the interface failure of the prepreg occurred at the low temperature stage, whereas cohesive failure occurred at the high temperature stage.Failure mainly occurs between the resin and the mould due to low interface strength under low temperature condition. An increase in temperature increases the viscosity of the prepreg,resulting in an increase of strength in the resin interface. As the temperature further increases, the fluidity of the resin increases and the cohesive strength gradually weakens,thereby decreasing the viscosity of the prepreg.
3.2. Results and analyses of peel test (90°)
The results of the peel test are presented in Fig.8,where Vis laying rate,Tis laying temperature,Pis laying pressure.The viscous peel force decreased by 1.52 N when the laying rate increased from 10 mm/s to 90 mm/s,while increased by 1.87 N when the laying pressure increased from 0.03 MPa to 0.30 MPa. As the laying temperature rosed from 25 °C to 52°C,the viscosity force first increased and then decreased,with the peak temperature arriving at 37°C.Comparison of the two tests suggests that the peel test results were similar to the probe test results in regards to the holding time and laying rate.
Laying rate needs to be strictly controlled in the automatic placement process.On the one hand,it is necessary to increase the laying rate as much as possible, so as to ensure the laying quality and production efficiency. On the other hand, too fast speed may lead to insufficiency of both pressure and heating time of the needle on the resin, which easily leads to low resin viscosity,slippage and other laying defects and ultimately deteriorates the laying quality. Laying pressure is also very important in the laying process because pressure determines viscosity to some extent. Moderate pressure is conducive to resin flow and uniform heating, whereas too much pressure presses out the resin and deforms the prepreg, resulting in poor glue and degrading the quality of the finished product. The mechanical properties of the resin are highly sensitive to temperature.Too low temperature and insufficient viscosity result in insufficient bonding between materials and moulds.Too high temperature may cause aging or partial curing of the resin. Thus, it is critical to identify the suitable laying temperature in determining the laying quality.
4. Finite element establishment and verification
4.1. Prepreg material properties
The material properties of the prepreg are needed to be input into the peeling simulation.Here,meso-mechanics was used as an equivalence to the modulus of prepreg, which is generally not easy to measure directly. The elastic constants of the prepregs in all directions were calculated using the Chamis model as
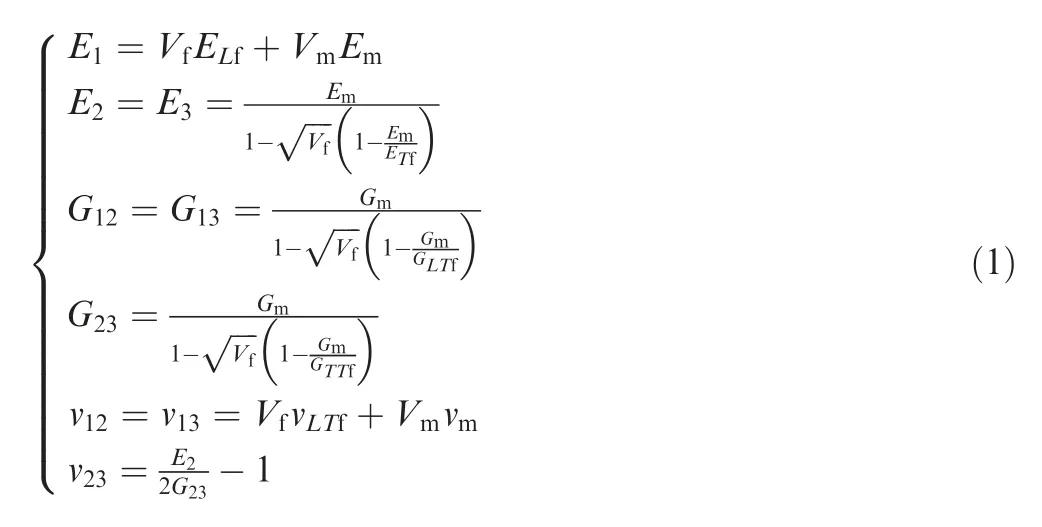
where E,Eand Eare elasticity modulus of prepreg;G,Gand Gare shear modulus of prepreg;v,vand vare Poisson’s ratio of prepreg; Vand Vare volume fraction of fiber and resin of prepreg;E,Gand vare properties of resin;Eand Eare modulus of fiber L direction and T direction;Gand Gare shear modulus of fiber LT surface and TT surface; vis poisson’s ratio of fiber LT direction.
The resin is in a viscous flow state when the prepreg is initially laid, while the modulus is generally one thousandth of the cured resin modulus when the prepreg is in the uncured state.The material parameters of carbon fiber and resin are listed in Table 2. The prepreg material parameters of the input model are calculated using the Chamis model, as shown in Table 3.

Fig. 8 Peel test results of T700-HX7901 under different laying conditions.
4.2. Modelling and simulation
This simulation used explicit dynamics for analysis,and established a 3D stripped finite element model in ABAQUS simulation software. The entire model consisted of four parts with three material properties: isotropic steel (element type is C3D8R) for the peeling bottom plate and the peeling roller,orthotropic (element type is C3D8R) for the prepreg material type, and the exponential cohesion model unit of the prepreg viscosity (element type is COH3D8) for the resin layer represented. The four parts of the model had the same width,namely 1/10 of the width of the prepreg, to reduce the cost of calculation (Fig. 9). The peeling guide roller was restrained and fixed using a fixed hinge, and the displacement boundary condition was applied to the upper half of the prepreg to output the required pulling force. In the simulation, the energybased B-K criterion was used as the evolution criterion for failure of the viscous layer.
4.3. Parameters setting and cohesion model
The Cohesive Zone Model(CZM)was proposed in the 1960 s,and has been widely used in the analysis of interface debonding, damage and fracture.With one of the widelyapplied criteria (bilinear, trapezoidal, pol-ynomial and exponential type), a CZM is often used to simulate the bonding interface, viz. the area between two materials, and such an interface can be considered as a layer of excess resin or adhesive..Existing studieshave shown that when characterizing and calculating either interface cracking or filmcoating cracking of the composite material, the tensiondisplacement relationship of the exponential rule suggests nonlinearity and continuity, which is more in line with the actual status of interface cracking comparing with bilinear and trapezoidal rules. Based on the research of Shu et al.,this simulation adopted a two-line constitutive model, and the elastic stiffness E of the cohesive layer material in the simulation was calculated through
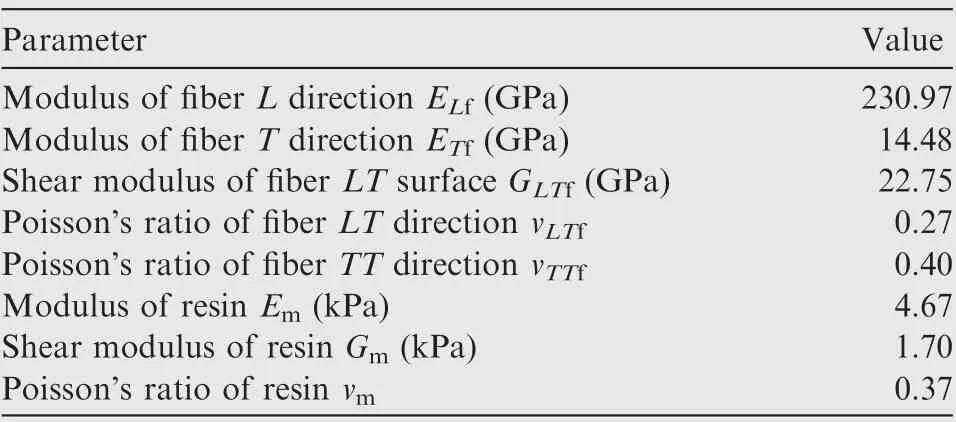
Table 2 Material parameters of carbon fiber and resin.
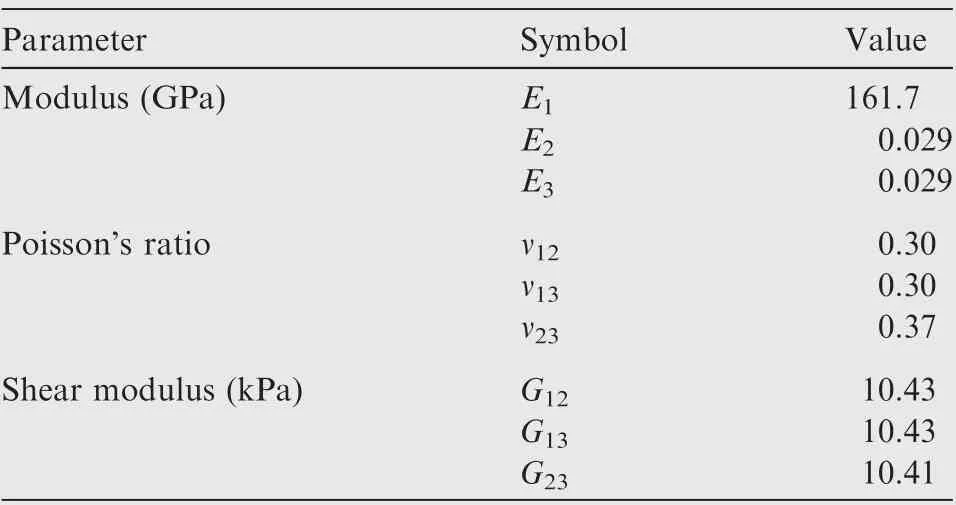
Table 3 Material parameters of prepreg.
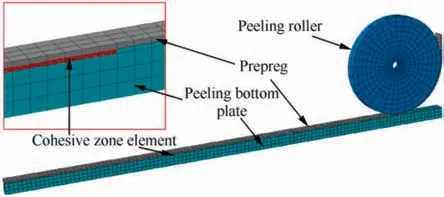
Fig. 9 Modelling of peeling simulation.

where E, Eand Eare elastic stiffness; Tis the absolute thickness of the adhesive layer, T= 0.1 mm.
The fracture energy input by the cohesive layer was the separation energy Gcalculated by the probe experiment, and the separation stiffness Kadopted the slope between the starting point of the peel test and the point of the maximum peel force to ensure the authenticity of the data, as shown in Fig. 4.
The key of the peeling model is the input of viscosity parameters. In accordance with the research of Zhang et al.,the holding time of the probe test and the laying rate of the laying process were correspondingly transformed. As tested, the radial deformation of the pressure roller was approximately 25 mm under different pressures, suggesting that the laying rate is inversely proportional to the holding time. Only nine sets of experiments were simulated due to the limitation of the holding time of the test machine. The simulation conditions are shown in Table 4.
The stiffness and viscosity could be systematically characterised through the transversely isotropic element of material and the CZM element. The material properties of the prepreg calculated using meso-mechanics were inputted into the prepreg layer, whilst the viscosity data obtained by each probe experiment were inputted into the resin floor. The research of Diehlshowed that normal parameters dominated in the 90° peel test, and tangential parameters had negligible influ-ence on the peeling simulation results. Therefore, the tangential parameters were set the same as the normal parameters in the exponential model to simplify the model,thereby ignoring the influence of tangential parameters.
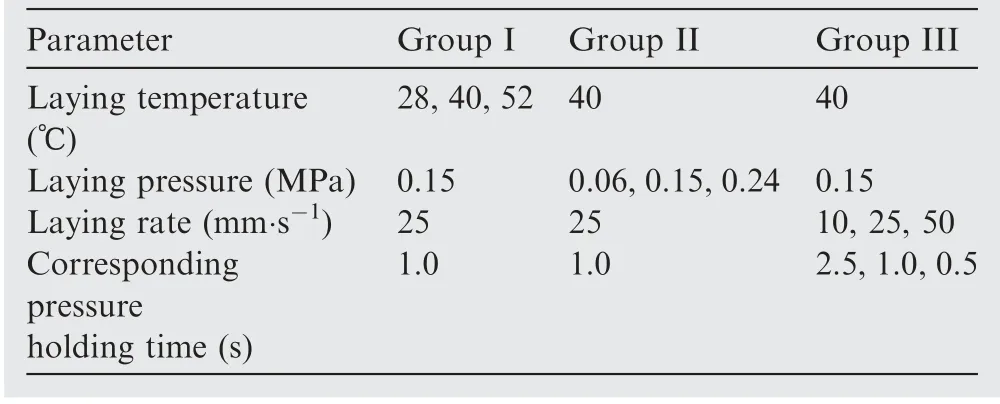
Table 4 Conditions corresponding to simulation input parameters.
4.4. Results and analyses of peel simulation
The results of peel simulation are presented.Fig.10 illustrates the stiffness degradation and stress distribution of the adhesive layer during the peeling simulation process, showing the process of the cohesive layer from intact to failure.
Fig.11 shows a comparison of a simulation process and the corresponding three experimental processes.For all the curves,the first 100 mm measurement value was the experimental value of the prepreg’s own bending resistance, whilst the last 100 mm measurement value was the sum of the prepreg’s viscous peel force and its own bending resistance. The difference of the experimental data was regarded as the viscosity of the prepreg, as denoted by the double arrow line in Fig. 11. The results of nine sets of different peeling simulations were magnified by 10 times,and were compared with related experimental results,as shown in Table 5.The errors were all less than 10%,which validated the correctness of the peel simulation model and that of the probe test data used to simulate the two-line model.
5. Methodologies for parameter optimization
5.1. Response surface method
RSM is an experimental design method that combines statistics, mathematics and computational science.It is capable of obtaining enhanced regression equations, determining the rules between experimental indicators and various factors,constructing optimised area models and optimization intervals,and exploring the optimal combination of design variables through modelling,experiments and data analysis.Meanwhile,this method considers the coupling effect of different parameters on responses,and analyses the significance of the effect of each factor (design variable).
In a system or process, the response variable y(x) is determined by input factors(design variables)x,x,...,x.If a linear function relationship exists between y(x) and x, the second-order response surface model is usually used considering the coupling and quadratic effects of input factors. A second-order regression can be conducted through

where βis the constant term; βis the linear effect of x; βis the coupling effect between xand x;βis the quadratic effect of x; ε is the error term; p is the number of arguments x.
5.2. Condition setting of RSM
The response surface analysis method of Box-Behnken Design(BBD) in Design-Expert software was used to carry out the experimental design on the basis of the single-factor experiment. The second-order response model was used to fit the data, the influence of the laying process parameters and their coupling effects on the viscous peel force of the prepreg during the moulding process was analysed, and the coupling of process parameters was optimised.
Analysis of the results of the single-factor experiment shows that the range of the response surface experiment was reduced,as shown in Table 6. Seventeen groups of experiments were designed using Design-Expert software. Experimental factors and level design are shown in Table 7.The laying temperature T, laying pressure Pand laying speed Vwere transformed through Eq. (4) with the median value of each single-factor as its standardization centre:
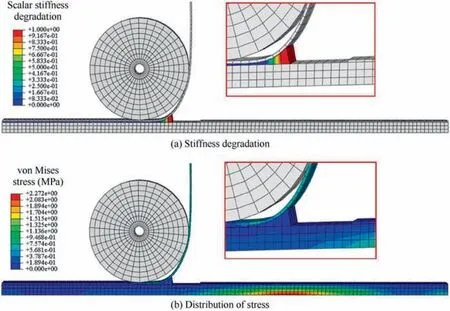
Fig. 10 Stiffness degradation and stress distribution of cohesive element.

Table 5 Comparison of peeling simulation results and peel test results.
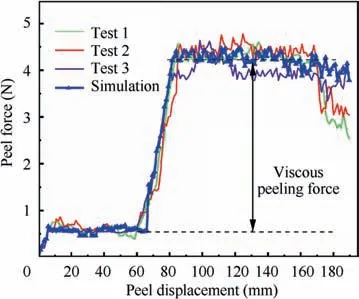
Fig. 11 Comparison of one simulation process and corresponding three experimental processes.

6. Results and analyses of response surface experiment
The synergistic effect of multiple processing parameters has an interactive effect on the viscosity between the resins in the actual laying process.Thus,the best combination and optimal range of laying process parameters must be identified. Based on the results and analyses of peel test in Section 3.2,the range of each parameter was narrowed. BBD response surface analysis was used to optimise process parameters, and the secondorder response model was adopted to analyse the influence of process parameters and their coupling effects on interlayer adhesion of prepreg, as shown in Table 8. The results of the analysis of variance of the quadratic model are shown in Table 9.
The decision factor P value was used to determine the significance of the response condition.P values falling into different ranges represent different significance levels: extremely significant when P < 0.0001, significant when 0.0001 ≤P<0.05,and not significant when P ≥0.05,respectively.The significance of design parameters is shown inFig.12.Here,the influence significance Q is calculated through the equation Q = lg P, hence, Q >4.0, 1.3 ≤Q ≤4.0, and Q < 1.3 represent extremely significant, significant and not significant, respectively. Both Table 9 and Fig. 12 show that the laying temperature had an extremely significant effect on the viscosity between the prepreg and the mould, whilst the laying rate had a significant effect on the interlayer viscosity of the prepreg.In addition,the interaction term of laying temperature and laying rate exhibited a relatively significant effect on the viscosity of the prepreg.

Table 6 Range of process parameters of prepreg placement using response surface method.

Table 7 Design factors and horizontal design of prepreg placement based on second-order response surface method.
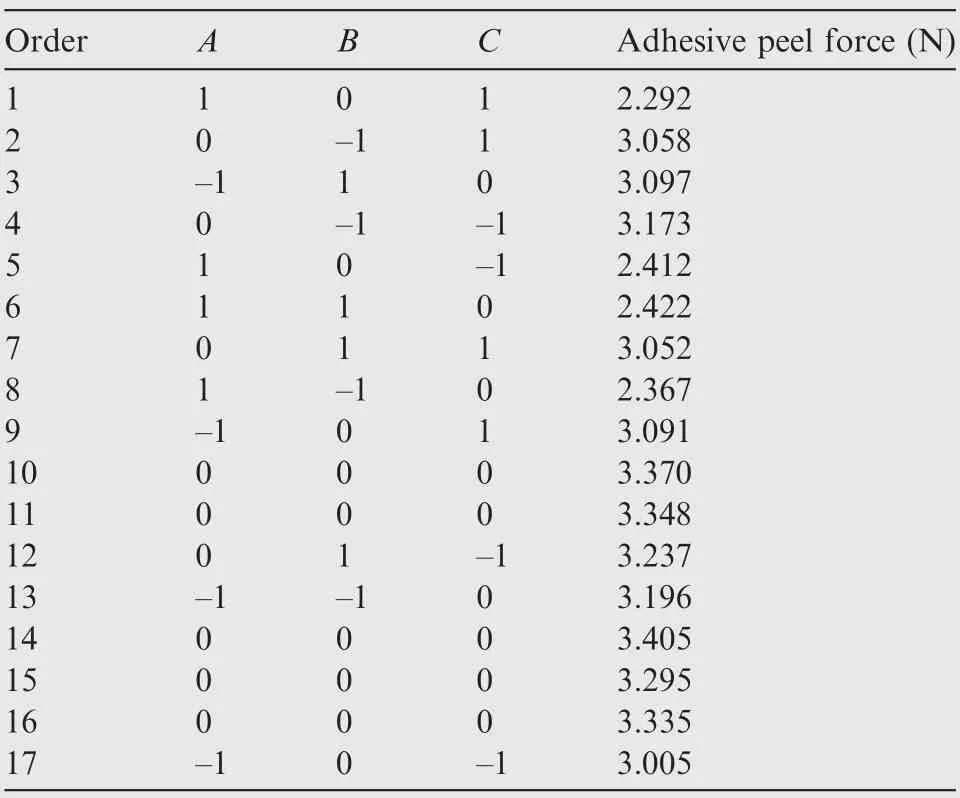
Table 8 Results obtained based on response surface method.
The regression model can be obtained through regression analysis of the experimental data as

where X is the peel force predicted by the model.
The factors of the quadratic regression model formula and their coupling influence coefficients are shown in Fig. 13. The negative value of the influence coefficient represents negative correlation.It can be seen from Fig.13 that the laying temperature A was greater than the laying rate C, which was greater than the laying pressure B. In the coupling of two factors, the model coefficients of AB and AC as temperature coupling were larger than non-temperature coupling BC. Fig. 14 shows the three-dimensional response diagram under the interactive influence of two factors. It can be seen from Fig. 14 that the radius of curvature of the three-dimensional curved surface coupled with temperature was smaller.
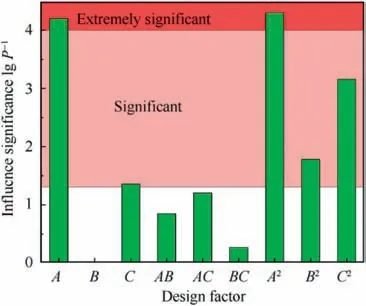
Fig. 12 Significance of design factors.
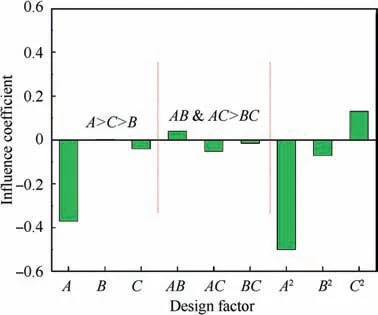
Fig. 13 Influence coefficients of impact factors.

Table 9 Variance analysis results of quadratic model.

Fig. 14 Interactive influence of various factors on peel force.

Table 10 Theoretical and experimental results by optimizing process parameters.
Through optimization analysis using Design-Expert software, the optimal combination of process parameters was obtained as follows: laying temperature of 36.18 °C, laying pressure of 0.24 MPa,and laying rate of 68.29 mm/s.The predicted value of the viscous peel force was 3.395 N under this optimal combination of parameters. Five repeated tests are performed under this process combination for model verification.Table 10 shows the average value of the five tests results.The deviation rate of the results was small, indicating the reliability of the analysis model.
7. Discussion and conclusion
The influence of placement process parameters on the viscosity of prepreg was studied through experiments,and an optimization method of these parameters was established. The results are discussed and conclusions drawn as follows:
(1) A probe-placement-peel test system was built to study the viscosity of prepreg. The variation rule of prepreg viscosity with process parameters was studied by comparing the results of probe test and peel test. Then, the relationship between the two tests was established through a peel simulation, and the correctness of the two-line cohesion model for simulating the debonding of the adhesive layer with the probe test data was validated. This two-line cohesion model does not require data fitting in simulation and thus ensures the authenticity of the data, which is different from the exponential model used in previous studies. The results show that within a certain range, the viscosity of the prepreg increases as either the laying speed or the laying pressure decreases;the viscosity of the prepreg increases first and then decreases as the temperature increases.
(2) The viscous peel force was used to characterize the prepreg viscosity, on which the influence of the process parameters was studied by a response surface analysis.A prediction model of the relationship between the viscosity of the prepreg and the process parameters was established, and an optimization method of the laying process parameters was also developed. Some future investigations could be conducted to study the relationship between the component performance and the viscosity of prepreg during the placement, thereby providing a theoretical reference for the design of composite structures such as VS laminates.
The authors declare that they have no known competing financial interests or personal relationships that could have appeared to influence the work reported in this paper.
s
This research was supported by the National Natural Science Foundation of China (No. 51875159), the Foshan Xianhu Laboratory of the Advanced Energy Science and Technology Guangdong Laboratory, China (No. XHT 2020-002), Fok Ying Tung Education Foundation, China (No. 171046), the Key Research and Development Program of Anhui Province,China (No. 201904d07020013), the Fundamental Research Funds for the Central Universities, China (Nos.PA2020GDJQ0029 and PA2020GDSK0075), the National Key Research and Development Project, China (No.2019YFB1504800), the Beijing Natural Science Foundation,China (No. 2192044), 2020 and 2021 Open Project of State Key Laboratory of Organic-Inorganic Composites, China(Nos. Oic-202001008 and Oic-202101008).
 Chinese Journal of Aeronautics2022年4期
- Chinese Journal of Aeronautics的其它文章
- An automatic isotropic/anisotropic hybrid grid generation technique for viscous flow simulations based on an artificial neural network
- Optimization design of airfoils under atmospheric icing conditions for UAV
- Pressure distribution feature-oriented sampling for statistical analysis of supercritical airfoil aerodynamics
- Recent progress of machine learning in flow modeling and active flow control
- Design method of optimal control schedule for the adaptive cycle engine steady-state performance
- Using tandem blades to break loading limit of highly loaded axial compressors
