Optimization design of airfoils under atmospheric icing conditions for UAV
Haoran LI, Yufei ZHANG, Haixin CHEN
School of Aerospace Engineering, Tsinghua University, Beijing 100084, China
KEYWORDS Aircraft icing;Ice-accretion;Ice-tolerant airfoil;Optimization design;Separated flow;UAV
Abstract Natural ice accretion on the lifting surface of an aircraft is detrimental to its aerodynamic performance, as it changes the effective streamlined body.The main focus of this work considers the optimization design of airfoils under atmospheric icing conditions for the Unmanned Aerial Vehicle (UAV). The ice formation process is simulated by the Eulerian approach and the three-dimensional Myers model. A three-equation turbulence model is implemented to accurately predict the stall performance of the iced airfoil. In recognition of the real atmospheric variability in the icing parameters, the medium volume diameter of supercooled water droplets is treated as an uncertainty with an assumed probability density function. A technique of polynomial chaos expansion is used to propagate the input uncertainty through the deterministic system.The numerical results show that the multipoint/multiobjective optimization strategy can efficiently improve both the ice tolerance and the cruise performance of an airfoil. The reason for the focus on robust optimization is that the ice angle of the optimized airfoil becomes less critical to the incoming flow.The optimized airfoils are applied to a UAV platform,in which the performance improvement and the relevant key flow feature are both preserved.
1. Introduction
Ice accretion on the lifting surfaces of an aircraft can be hazardous because the ice shape on the leading edge may adversely change the streamlined body into a nonstreamlined body and cause stalling. The control and stability characteristic of aircraft will also be affected by icing. The National Transportation Safety Board noted that the natural icing problem is one of the ‘‘Most Wanted Aviation Transportation Safety Improvements”.The ice accretion shape has been documented, as well as changes in the lift, drag, and pitching moment. Icing conditions have been varied to study the effect of droplet size, liquid water content, air temperature, icing time, and angle of attack. The flight altitude where icing is most common is usually lower than 7000 m because liquid water is abundant below this altitude. Both commercial aircraft and Unmanned Aerial Vehicles (UAVs) have been required to satisfy strict icing condition safety requirements.Although the cruising altitude of a transport aircraft is higher than the icing envelope, ice accretion may occur during takeoff and landing.In addition,UAVs are particularly vulnerable to natural icing as a result of their lower cruising altitude and the resulting exposure to a higher moisture content. Surveillance or reconnaissance UAVs require long exposure times in adverse weather conditions, which increases the risk of ice accretion. Besides, due to the weight and power limitations,UAVs often have no anti-icing facilities. Once encountering the ice-accretion, the wing has to flight with accumulated ice.Consequently, promoting the ice tolerance of an airfoil can improve flight safety under an icing environment and allow the vehicle to easily pass an airworthiness certification.
Aircraft ice shapes on a leading edge can be roughly divided into rime, glaze, and mixed ice depending on different atmospheric icing conditions. Rime ice often occurs at cold temperatures (i.e., below -10 °C) and has a shape roughly streamlined to the incoming flow. Glaze ice is usually related to warmer temperatures (i.e., above -10 °C) than rime ice and has a horn shape similar to a protrusion. Mixed ice forms under icing conditions between the rime and glaze ice. In addition to the temperature, the cloud liquid water content and droplet size also play important roles in determining the ice type. To date, a clear boundary between ideal formation conditions for different ice types has not been established. Numerous aircraft icing experiments have been performed to reveal the mechanism of aircraft icing. The ice shapes from icing wind tunnels have provided validation cases for the numerical simulation of the icing process. The development of icing models for aeronautical usage can be traced back to 1953, when Messingerfirst proposed a model based on the Stefan problem of phase change. Yi et al.introduced a simulation method of water film on iced surface based on the Messinger model and extended the model to three-dimensional usage. Wang and Zhuextended the Messinger model by using a shear stress force and a centrifugal force to distribute the water film on a three-dimensional rotor surface. In 2001, Myersdeveloped an extension to Messinger’s model by considering a more accurate description of the thin water film and transition from rime to glaze ice regime. Myers’ model takes heat diffusion through the ice and water layers into account, while the Messinger model assumes that the substrate is adiabatic. In addition, the Myers model is a three-dimensional icing model that can be used to predict ice accretion on a wing. Cao and Houused Myers model for calculation of three-dimensional glaze ice.They proposed an efficient implicit-explicit numerical method to solve the governing equations.
The ice accretion effects on an airfoil have been the main focus of aircraft icing research.Jacobsfound that an ice protuberance on the upper surface with a height of only 0.5% of the chord can cause a severe decrease in lift. Pouryoussefi et al.used an experimental method to study the effects of horn-shaped ice and demonstrated that certain horn-shaped ice led to a 21% reduction in the maximum lift coefficient.Broeren and Braggevaluated the performances of intercycled ice accretions on airfoils with different geometries.The intercycle ice accretions were simulated using combinations of various grit roughness sizes. They observed that the simulated ice effects concerning the maximum lift were most severe for the NACA23012 airfoil. The maximum lift coefficients were in the range of 0.65-0.8 for the iced configuration compared to a value of 1.47 for a clean airfoil at the same Reynolds number.DeGennaro et al.studied the uncertainty quantification for airfoil icing using polynomial chaos expansions. Their results showed that even a small amount of uncertainty in the ice shape can result in a large amount of uncertainty in aerodynamic performance metrics. In general, different shapes of accumulated ice have different effects on the aerodynamic characteristics,and some typical airfoils can maintain excellent performance with respect to ice accretion.
The ice accretion effects of an airfoil can be treated as an active part of the design process. Ghisu et al.introduced an ice condition into the optimization process of the airfoil of a general-purpose aircraft. In their work, a CFD analysis of an airfoil in the presence of a quarter-round ice shape was integrated within an optimization system featuring a metaheuristic multiobjective optimizer. The NACA23012 airfoil was selected as the baseline airfoil. Researchers considered the uncertainty of the ice accretion position and implemented an adaptive polynomial chaos approach for Uncertainty Quantification(UQ).The UQ problem calculated the variability in airfoil performance in the face of the given variation in ice-accretion position. The results showed that the improved iced performance of the best lift coefficient Cconfiguration(with a mean ΔCbetween the clean and iced states of 0.2)is obtained at the price of a 10% increase in clean drag coefficient Cand a large negative pitching moment. However, the ice shape in the optimization was a fixed shape but not from the natural icing process. Li et al.optimized a supercritical airfoil considering the ice accretion effects. Their results showed that the optimization can improve the maximum lift coefficient of an iced airfoil by 16.5% with a penalty of 3.7 drag counts for the cruise state.However,the optimization still used a fixed ice shape, which ignored the variance of the ice shape relevant to the airfoil shape and icing conditions. Thus,a design method for ice-tolerable airfoils considering realistic atmospheric icing conditions is needed.
An optimization design of UAV airfoils with respect to ice accretion effects is proposed in this study.The ice shape is simulated under several atmospheric icing conditions selected from airworthiness regulations.A separated Shear Layer Fixed(SPF) k-v-ω turbulence model is used to predict the stall performance of iced airfoils.A multipoint/multiobjective optimization strategy is used to promote both the cruising and icing performance. A generalized polynomial chaos expansion method is utilized to evaluate the uncertainty in the meteorological condition parameters. An airfoil with the best cruising performance and an airfoil with robust ice-tolerant performance are obtained and analyzed. A tradeoff between the potentially conflicting objectives of the iced and clean conditions is then identified.
2. Computation approach
2.1. Ice accretion simulation
Under glaze icing conditions, a thin fluid film flow occurs at the substrate. The Myers model introduces Navier-Stokes(N-S)equations to govern the flow.The scalar partial differential equation for the height of the water film can be derived from N-S equations and continuity equations using lubrication theory.
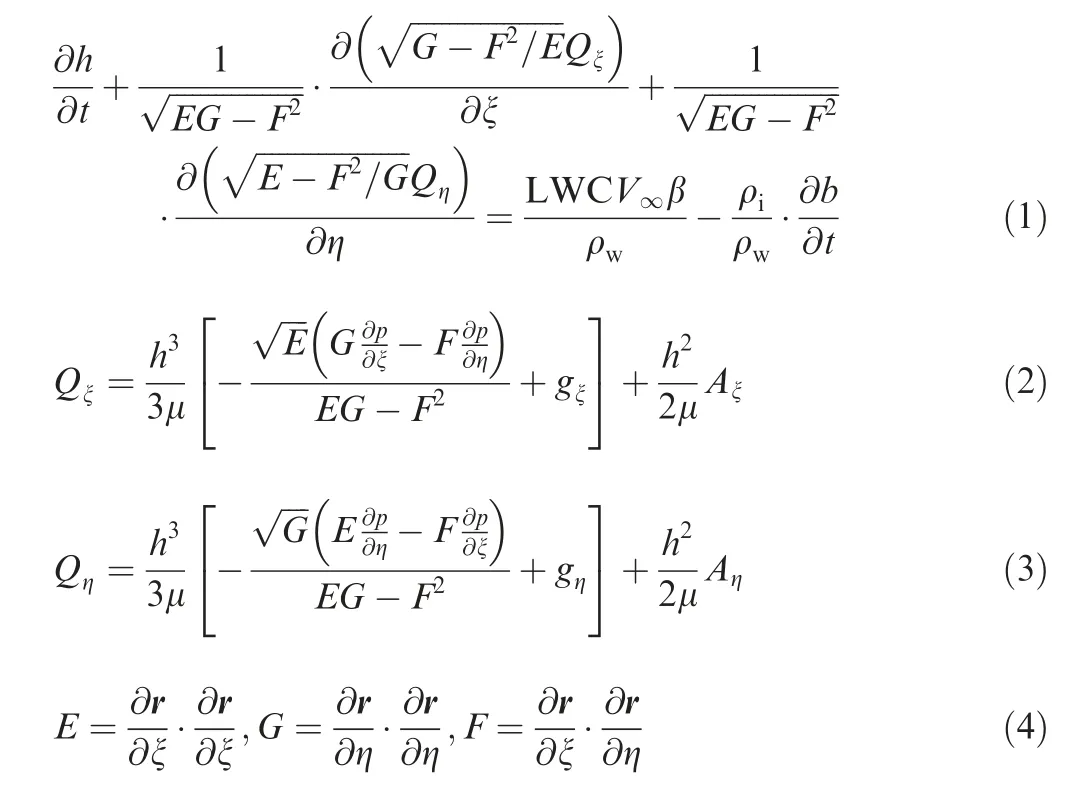
In Eq. (1), the variable h refers to the height of the water film, and Qand Qin Eqs. (2)-(3) are the flow flux components in the ξ and η directions of the curvilinear coordinate system, respectively. (E,G,F) is the standard terminology in differential geometry for the first fundamental forms with respect to the parametric equation r(ξ,η ) of the solid surface(Eq. (4)). The right-hand side of this equation shows the incoming and freezing terms. b(ξ,η ) represents the thickness of the ice layer; ρand ρare the density of water and ice,respectively; β is the collection coefficient of droplets; p is the pressure at the substrate; and Aand Aare the contravariant shear-stress components obtained from the Computational Fluid Dynamics (CFD) results of the flow field.
The thermal analysis in terms of the Stefan problem is applied in the glaze icing simulation. The Stefan modeldescribes the mass and energy transformation through the phase change at the solid-liquid interface. It is a set of four partial differential equations on a single component. Fig. 1 depicts an elementary cell of the Myers model. The bottom part is the substrate, where the ice layer and the liquid water film cover the ice surface. Under aircraft icing conditions,the typical height of the liquid film is on the order of 1/10 mm. Therefore, the temperature of the water layer can be set as a constant and equal to the freezing temperature of water (T= 273.15 K). A linear temperature distribution is assumed in the ice layer from Tat the ice bottom to Tat the interface of the ice and water film. The substrate temperature Tis assumed from the Messinger model’s result.The governing equation of thermal dynamics is obtained based on the Stefan condition as given in Eq. (5),
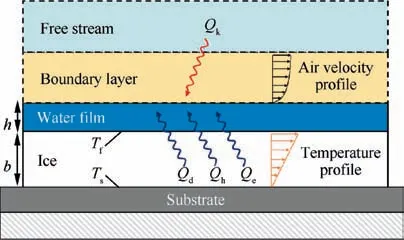
Fig. 1 Schematic of thin water film and energy transformation on an elementary cell.

where Lis the latent heat of fusion (3.344×10J/kg); k(0.571W.m.K)and k(2.18 W.m.K)represent the thermal conductivity of water and ice;and Eand Fare heat coefficients derived from the heat exchange on the air-water interface. Heat exchange on the interface includes the input energy Q(collection kinetic energy from water droplets),output energy Q(latent of solidification), Q(heat convection),and Q(evaporation heat). A detailed expression of the thermal equation can be found in Ref. 21.
A thermal analysis of rime ice is unnecessary because a water film is not formed.The thickness of the rime ice is determined by the collection efficiency of droplets; therefore, the governing equation of the ice layer is Eq. (6). In a timemarching process, the ice type is first assumed to be glaze ice, and then Eqs. (1) and (5) are solved. If the updated water film thickness is greater than the precursor thickness h, then the glaze ice model remains. Otherwise, the water film thickness is replaced by the value of h, and the new ice thickness is calculated using the rime ice model.

The ice shape on a curved surface can be established using the parametric equation that describes the ice-water interface as Eq. (7),

where the vector r is the substrate geometry and n represents the normal vector to the substrate.
The above Myers model is implemented in an in-house software AERO-ICE.The software has a highly modular structure in terms of the ice accretion simulation processes. Fig. 2 depicts the flow chart of the software. The main four modules are highlighted by yellow color.The first module of automatic mesh generation will be explained in the next chapter.Flexible interfaces among the CFD analysis and icing models are developed. The CFD calculation of the flow field can be implemented by the commercial software CFD++ version 18.1 or the open-source solver CFL3D version 6.7. After this process, the convective heat transfer coefficient and shear stress on the surface can be obtained.The water droplet distribution is simulated by solving the Euler dispersed phase equations,and the local water collection coefficient can be determined.In addition, the present study uses CFD++ to calculate the airflow and water droplet in the ice-accretion stage. The next step is to do thermodynamic analysis on the surface using the Messinger or Myers model. The present study combines the Messinger and Myers model. Firstly, the Messginer model is imposed to analyze the temperature distribution on the surface.Then,the temperature of the surface is set as a boundary condition for the Myers model. This avoids the empirical setting of wall temperature in the Myers model.The implicit time approaching method for solving equations of the Myers model is used in the AERO-ICE code.Practical experience shows that the implicit time marching is much faster than the explicit method.
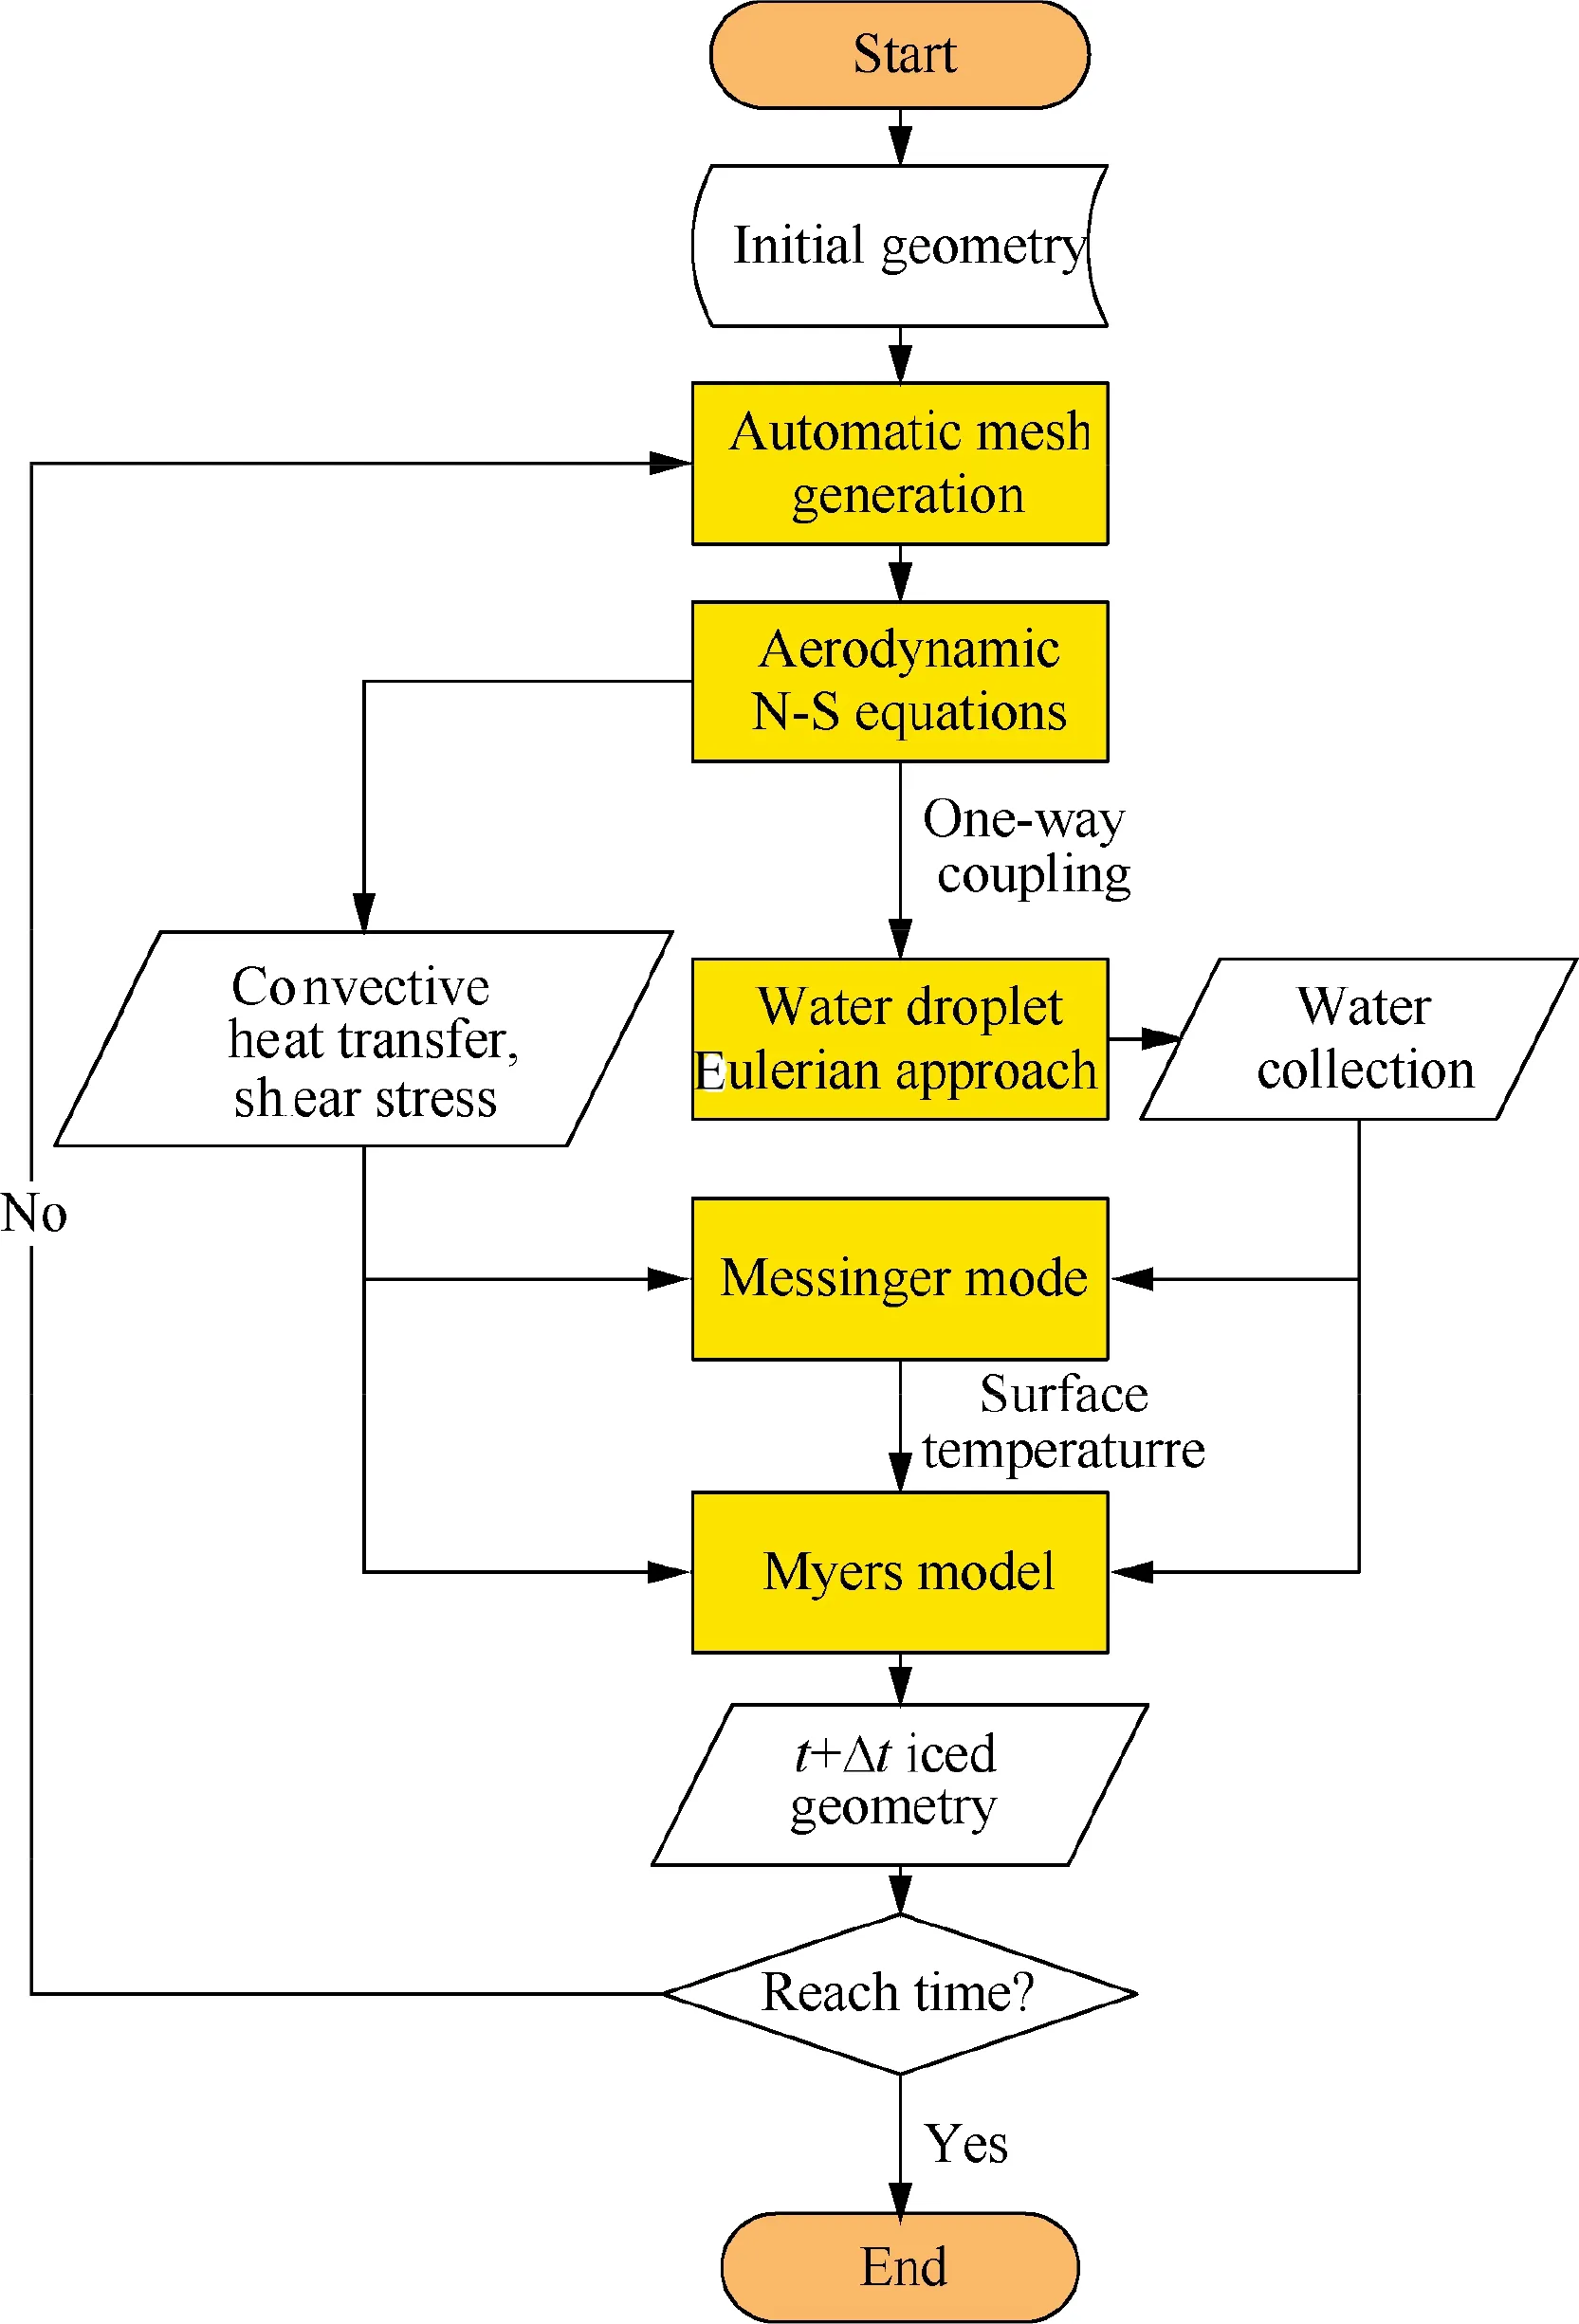
Fig. 2 Flow chart of AERO-ICE software.
Fig. 3 shows a comparison of the geometries of two simulated iced airfoils. The experimental data are from the Icing Research Tunnel (IRT) at NASA’s Glenn Research Center.The clean GLC305 airfoil is a section of a business jet wing,and its icing conditions were selected from the Federal Aviation Administration’s Federal Aviation Regulations 25 Appendix C atmospheric icing conditions. The legend in the figure shows the static environment temperature, the LWC and MVD. These two cases have the same flight velocity of 90m/s, flow angle of attack of α = 6°, and icing spray time of 6 min. However, the icing condition of Fig. 3(a) is a glaze ice condition where the LWC and atmospheric temperature of -5 °C are much higher than those of the mixed ice case of -10 °C (Fig. 3(b)). The results show that the present simulation can capture the ice shapes well, and the ice heights and angles compare well with the experimental data. The present simulated ice shape under glaze ice conditions is better than the well-known code LEWICE.
2.2. Aerodynamic prediction methods
Automatic grid generation is necessary for both icing simulation and airfoil optimization. When evaluating the icing process, the flow field and water droplet collection characteristics are refreshed in intervals. Therefore, the grid should also be regenerated. In this paper, a structured grid is generated by an in-house code. Local grid refinement is applied near the ice accretion area, which helps in predicting the separating shear layer. Fig. 4 illustrates the computational grid around an airfoil with glaze ice. The far-field boundary is set at a distance 80 times the chord length away from the airfoil.The grid demonstrates good orthogonality near the airfoil surface. The first layer spacing in the wall-normal direction is less than 6.0×10to ensure that the value of Δyis no more than 1.0.
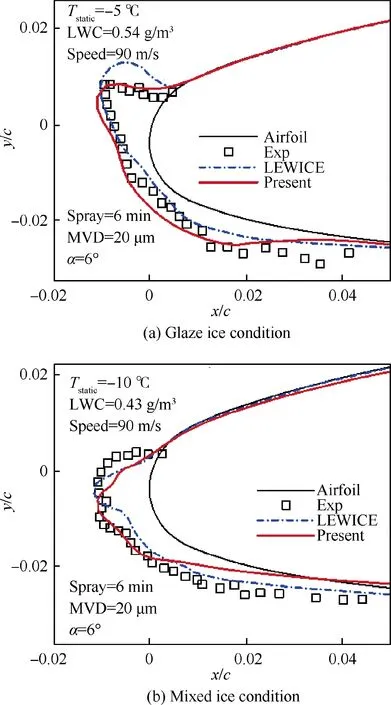
Fig. 3 Comparison of ice shapes under atmospheric icing conditions.
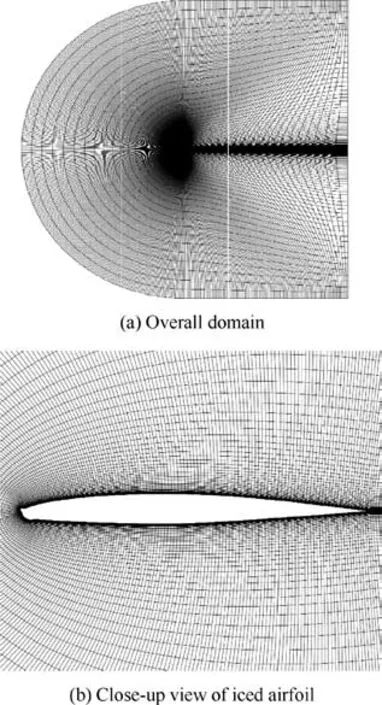
Fig. 4 Computational grid around an iced airfoil.
3. Defining atmospheric icing condition
3.1. Meteorological conditions for aircraft icing
The probability of aircraft icing depends on many factors.Atmospheric icing conditions are the most important factor because they determine the type of ice and icing intensity.There are three dominant environmental parameters:Medium Volume Diameter(MVD),Liquid Water Content(LWC),and free stream temperature.Supercooled water droplets in clouds tend to be of different sizes.The MVD range is usually at 2-50 μm. Larger water droplets may exist but require particular conditions. Water droplets with large MVDs sometimes present a much larger threat to aircraft icing because they have more inertia and are more likely to bump on the wing surface.
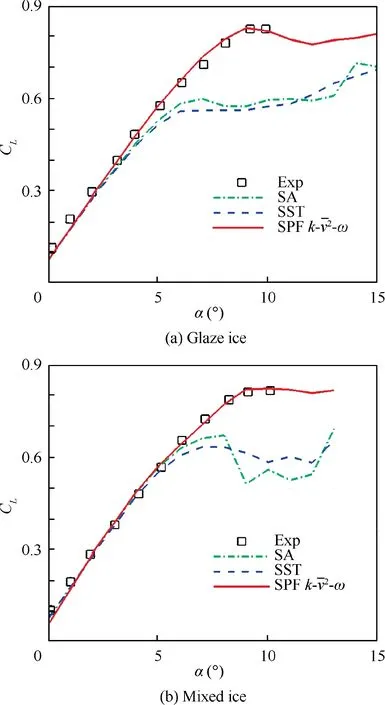
Fig. 5 Comparison of different turbulence models in predicting lift curves for the two icing conditions.
Water droplets with MVDs smaller than 15 μm can be neglected because they tend to flow around the wing surface with air and cannot be collected.
The atmospheric temperature (T) greatly influences the energy transformation of the icing process. Aircraft icing occurs at temperatures below 0 °C. If the water droplet temperature is much lower(i.e.,below-10°C)than the wing surface, the convective heat transfer is severe, and the collected water droplets tend to immediately change phase to an ice substrate. This is the basic formation mechanism of rime ice.The occurrence of horn-shaped glaze ice is associated with higher temperatures. The collected water droplets may not freeze at the impingement point. Then, the water film moves along the substrate and freezes at the tip region, which finally leads to horn-shaped ice on the upper and lower surfaces. In general, a higher temperature can cause glaze ice, which is much more dangerous than rime ice at a lower temperature.
The amount of liquid water that can be contained in a certain amount of air depends on the temperature. At very low temperatures,the water vapor in the clouds will condense into ice crystals and cause a low LWC state. Meanwhile, the value of LWC decreases with increasing MVD.When the LWC level is high, much more liquid water will be collected on the wing surface.The unfrozen water film will overflow towards the rear of the impact limit and form a large horn height. Consequently, an atmosphere with a high liquid water content is dangerous for flight safety.
The regulation of FAR Appendix C defines a set of environmental icing conditions that an aircraft must be able to safely operate under for flight. It distinguishes two types of icing conditions:continuous maximum(i.e.,stratiform clouds)conditions, which are lower at max LWC but longer in a horizontal extent, and intermittent maximum (i.e., cumuliform clouds) conditions, which are higher at max LWC but shorter in a horizontal extent. The optimization design of ice-tolerant airfoils in this paper considers continuous maximum conditions because these are a set of meteorological conditions suitable for exposure parts, such as wings and tails. By contrast,intermittent maximum conditions are usually applied to the engine inlet and vane blade.The five curves in Fig.6 represent the five specific icing temperatures at continuous maximum conditions. The LWC decreases with an increasing MVD along the curve. When deciding upon an icing condition for aircraft design, first one should select the air temperature and MVD and then look up the LWC value accordingly.For example, when air temperature=-5°C and MVD = 25 μm, the continuous maximum chart tells us that the assumed LWC is 0.41 g/m.
3.2. Aerodynamic degradation under icing conditions
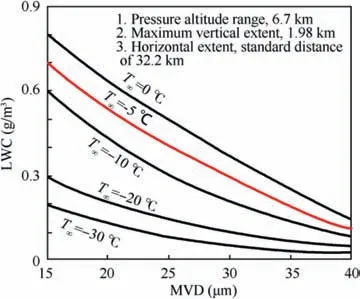
Fig. 6 LWC vs droplet size and temperature envelopes for the continuous maximum.
The aerodynamic degradation under different icing environments is further explored for the UAV airfoil type.The NREL S826 airfoil is selected as a baseline in this study. The airfoil was designed by Somers at the National Renewable Energy Laboratoryand is used at the blade tip of 20-40 m diameter horizontal axis wind turbines. The main characteristics of the airfoil are a high lift-to-drag ratio, docile stall characteristics,and insensitivity to transition.This makes the airfoil appropriate for UAV purposes (e.g., for long-endurance design). The aerodynamic problems of this paper are generally defined by the following parameters:airfoil chord length of 0.45 m;duration of icing of 7 min;flight velocity of 67 m/s;angle of attack of 2.75°;and static pressure of 89874 Pa.The ambient temperature Tis set as - 5 °C because previous experience has shown that this temperature usually corresponds to a critical glaze ice shape and can be treated as a very dangerous condition. The ice accretion simulation and CFD methods have been validated in Section 2. Table 1 lists five groups of MVDs to cover the continuous maximum icing envelope of FAR Appendix C. The value of the LWC is determined from Fig. 6 according to the specific Tand MVD.
The shape of ice varies greatly under the different atmospheric icing conditions listed in Table 1. Fig. 7(a) shows the clean airfoil and simulated ice shapes obtained from the environmental parameters.Obvious horn-shaped ice with a critical ice angle occurs at MVD≤25 μm. Ice at MVD = 30 μm still has a horned shape, but the ice height is greatly reduced. At MVD = 36 μm, the ice has a streamlined shape without protrusion and looks more like rime ice. Fig. 7(b)-(d) show the related aerodynamic coefficients. We use XFoil to evaluate the performance of the clean airfoil and the CFD method for iced airfoils. XFoil is a code developed by Drelafor the design and analysis of subsonic airfoils. It has been proven to be sufficiently efficient in predicting the lift-drag ratio and stall performance under these flight conditions.From the lift,polar, and moment curves, we find that ice with a horned shape can cause considerable degradation of the aerodynamic performance.Even under the condition of MVD=30 μm,ice with a relatively small height brings a magnitude of loss consistent with MVD = 14, 20, 25 μm. Moreover, the loss of the maximum lift coefficient caused by horn-shaped ice is 24.3%;the stall angle of attack is 6 degrees earlier than that of the clean airfoil, and the drag also increases dramatically. The streamlined ice shape under MVD=36 μm may have a favorable influence on the force coefficients at angles of attack larger than 9°, as the maximum Cis improved from 1.8 to 1.9 because the efficient chord length is increased by the ice.However, its lift curve shows a sharp inflection at α = 9°, which is caused by the development of the trailing edge separation bubble. In conclusion, natural ice accumulation with a certain MVD range has a notable impact on the aerodynamic characteristics. A successful ice-tolerable airfoil should have robust performance when facing different icing conditions.

Table 1 Different icing conditions of continuous maximum icing envelope of FAR Appendix C.
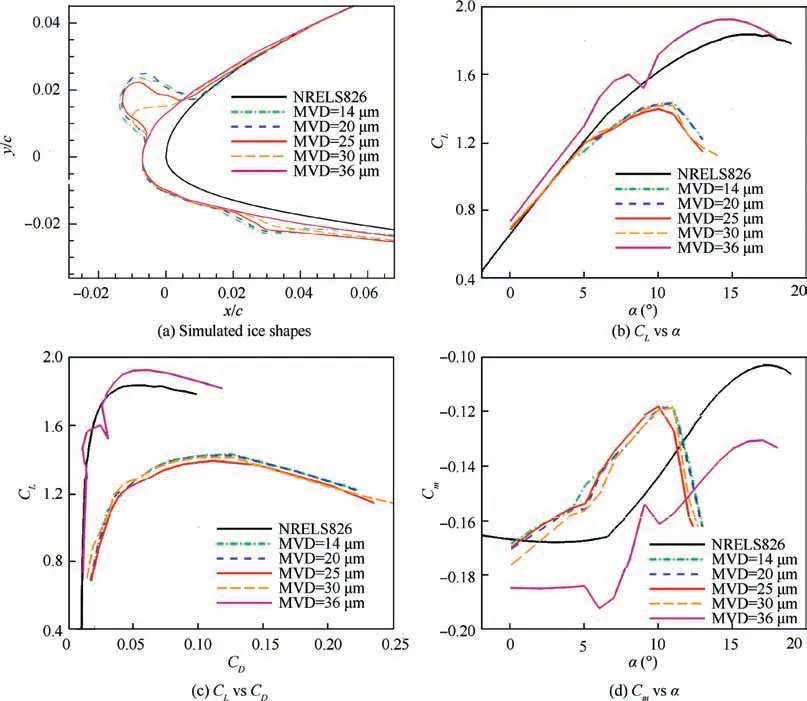
Fig. 7 Ice shapes and aerodynamic coefficients under different icing conditions.
4. Robust optimization methods
4.1. RBF-assisted DE optimizer
The present optimizer adopts a Radial Basis Function(RBF)-Enhanced Differential Evolutionary (RADE) algorithm. The RBF function is implemented in this evolutionary optimization algorithm as a response surface,which increases the optimizer’s ability to reach a globally optimized solution. The optimization of ice-tolerant airfoils is an expensive optimization problem because of the computational cost of CFD analysis and multiobjective strategies. In such a scenario, a large amount of temporary data is produced before the evolution converges.The RBF model can use the data of historical individuals to construct and update a response surface, thereby accelerating the optimization process. A detailed explanation of the optimizer can be found in Ref. 31.
4.2. Generalized polynomial chaos
Ice accretion on an airfoil is often characterized by a number of uncertain environmental parameters, such as MVD,LWC, and ambient temperature. Neglecting these uncertainties during the optimization design of ice-tolerant airfoils can lead to a significant difference between the anticipated and actual performance. The numerical quantification of uncertainty can be achieved with various methods. Monte Carlo Simulations (MCSs), sensitivity derivatives, and Polynomial Chaos Expansions(PCEs)are the most common approaches.PCE represents a collection of methods that can be considered a subset of polynomial approximation methods but is particularly designed for Uncertainty Quantification(UQ).In essence,PCE is a surrogate model for the stochastic variable, but the model also has a character of randomness. Compared with a MCS,PCE greatly reduces the cost of simulation and is better suited to complex problems. The original PCE model developed by Wieneremployed Hermite polynomials in terms of the Gaussian-distributed input uncertainty. An extension of the PCE proposed by Xiu and Karniadakiscan deal with more general random inputs. There are two major types of PCE: Intrusive Polynomial Chaos Expansion (IPCE) and Nonintrusive Polynomial Chaos Expansion (NIPCE). IPCE needs to incorporate information about the dependent forward model and must be specific to each problem.However,NIPCE takes the forward model as a black box and can be easily used in different UQ problems. A random process Y(θ ) can be expressed as follows:
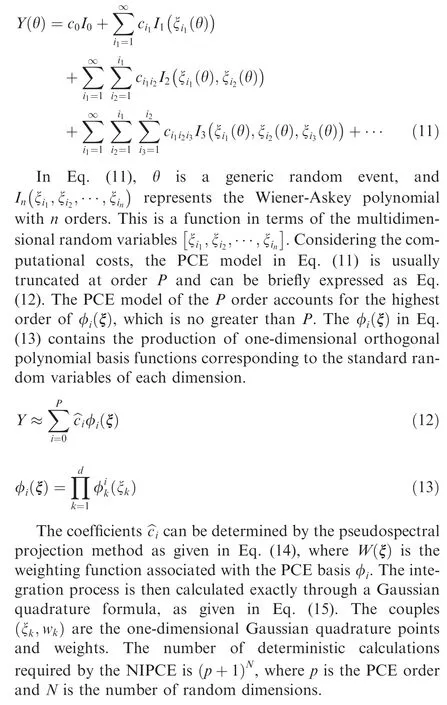
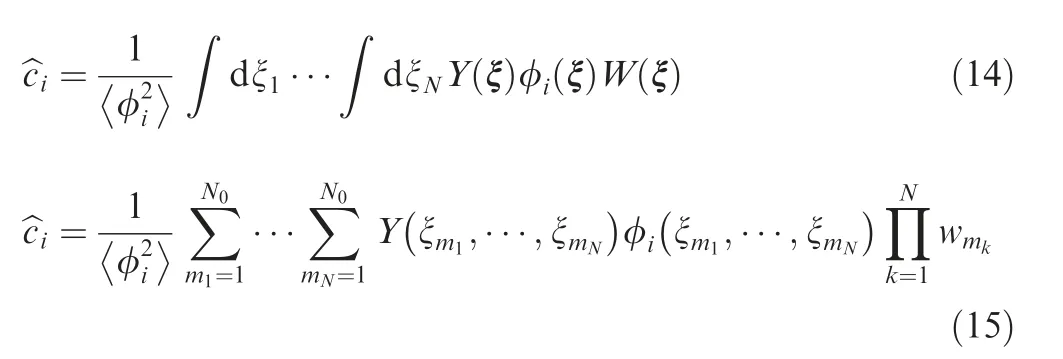
In this study,the open-source tool Chaospyis used for the design method of UQ. Chaospy is a Python toolbox for evaluating NIPCE, which can be implemented in a user-friendly way. Within only a few lines of high-level Python code, one can apply custom distributions, polynomials, integration schemes, sampling schemes, and statistical analysis of the UQ results.
5. Results and discussion
5.1. First optimization: clean + single icing condition
The design optimization of an ice-tolerant UAV airfoil must be achieved at the small expense of the clean airfoil’s performance. Ideally, the optimization can not only promote iced airfoil performance but also promote clean performance.Thus, the design objectives are established utilizing a multiobjective approach. The initial optimization considers the liftdrag ratio of a clean airfoil and the maximum lift coefficient under one atmospheric icing condition. The selected icing parameter is Condition 3 in Table 1 with an MVD = 25 μm, an LWC = 0.41 g·mand a temperature of - 5 °C.The flight velocity is 67 m/s, which is a typical cruise speed for a UAV, and the angle of attack is 2.75°. The duration of icing time is 7 min, which is treated as a long duration for a UAV model. An NREL S826 airfoil is set as the baseline airfoil.The strategy of this dual-objective optimization is given in Eq. (16),
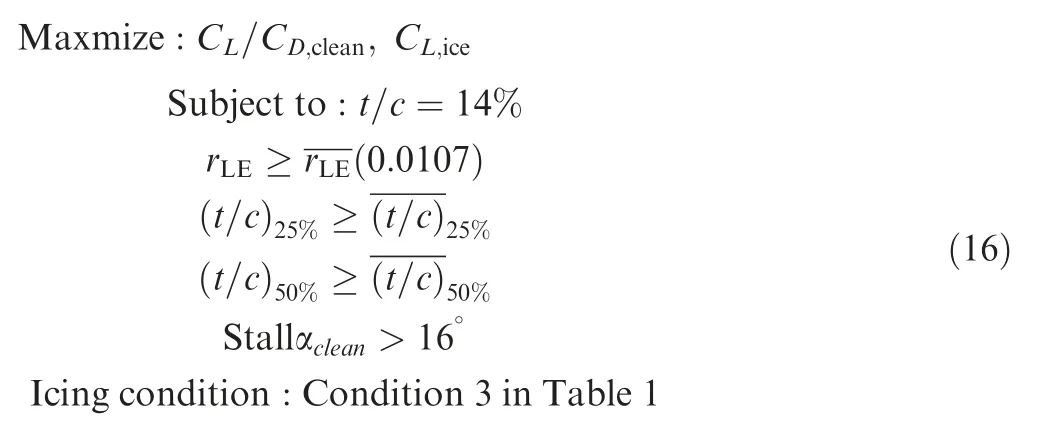

Fig. 8 Framework of the first optimization.
in which the relative thickness of the airfoil is fixed at 14%,and the thickness at the 25%and 50%positions is constrained to be no smaller than the original airfoil. The leading-edge radius is restricted to be no less than the value of the original airfoil (0.0107). The stall angle of attack of the clean airfoil is constrained to be larger than 16°, which ensures the clean airfoil’s stall performance.To balance the cruise and iced performance,two objectives are selected.The objective of C/Cis the averaged lift-drag ratio of 0.9 <C<1.1 of the clean airfoil, which is obtained from the entire lift curve predicted by XFOIL. The second objective Cis the maximum lift coefficient of the iced airfoil computed by CFD. The framework of the first optimization is illustrated as Fig. 8.
Before the convergence of this optimization process, 100 optimization generations are completed. Each generation has 32 individuals. A total of 3200 designs are thus generated and evaluated. The converged Pareto front in Fig. 9 is combined with the nondominated individuals of this optimization.Two typical designs from Pareto optimal individuals are labeled‘‘Cruise best”and‘‘Ice best”.The‘‘Cruise best”design,which is highlighted in blue, exhibits the largest lift-drag ratio(105.1) of the clean airfoil, which can be regarded as the optimal design of the traditional optimization regardless of icing.The ‘‘Ice best” design, highlighted in red exhibits a compromised aerodynamic performance under icing and clean conditions. The lift-drag ratio of the ‘‘Ice best” design is 100.7,which is larger than that of the original design (99.7). The ice-tolerant performance under the given atmospheric icing condition is greatly improved by this round.The maximum lift coefficients of‘‘Origin”,‘‘Cruise best”and‘‘Ice best”are 1.37,1.28, and 1.51, respectively. Particularly, the maximum Cof the ‘‘Ice best” design has an 18% improvement over the‘‘Cruise best” design. The results also illustrate that if the designer only optimizes the cruise performance of a UAV airfoil, its iced performance may be notably degraded. This optimization considering the ice accretion effects achieves the promotion of both clean and iced aerodynamic performance.
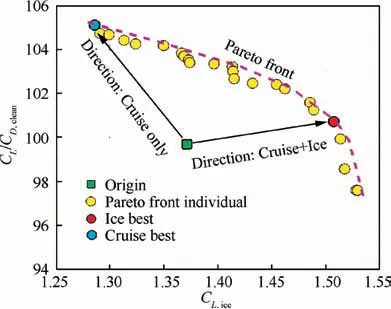
Fig. 9 Pareto front of the first optimization.
Fig.10(a)shows the geometries of the three typical airfoils.Compared with the original airfoil, the ‘‘Cruise best” enlarges its leading-edge radius and reduces the thickness along the tail to obtain more aft loading.The‘‘Ice best”retains the leadingedge radius but greatly raises its camber line (Fig. 10(b)) and aft loading. Compared with the ice shapes in Fig. 10(c), the ice heights are nearly the same for the three airfoils, but the ice angles are different. The optimized ‘‘Ice best” airfoil has an ice angle much more critical than the ‘‘Origin” airfoil.The ‘‘Cruise best” has an ice angle between the others.Fig. 11 presents a comparison of the force coefficients and pressure coefficient Cdistributions at the stall angle of the iced airfoils.The curves in Fig.11(a)show the lift performance under both clean and iced conditions.Both clean‘‘Cruise best”and ‘‘Ice best” airfoils without ice accretion obtain improvements in lift performance via optimization. The clean ‘‘Cruise best”design has the highest maximum lift coefficient,while the‘‘Ice best”design shows a larger lift line intercept.Under specific atmospheric icing conditions, the lift coefficient of the ‘‘Ice best”airfoil is larger than that of the other two airfoils over all angles of attack.Moreover,the iced‘‘Iced best”airfoil has the largest stall angle,while the‘‘Cruise best”airfoil has the smallest stall angle. Ice accretion on an airfoil greatly increases the drag.From Fig.11(b),the‘‘Ice best”airfoil has a smaller Cat the same Cvalue,which can alleviate the power requirement.The moment coefficient in Fig. 11(c) indicates that the iced‘‘Ice best” airfoil has a larger pitching moment and that the change in Cover the angles of attack is relatively small.Fig. 11(d) compares the clean and iced pressure coefficients of the three airfoils at α = 11°. For the pressure distribution under clean conditions, the ‘‘Cruise best” airfoil reduces the peak value compared with the other two designs because the leading-edge radius is enlarged. After ice accretion, the three airfoils have nearly the same peak pressure at the leading edge,as the front geometry is reshaped to be nonstreamlined. The iced ‘‘Ice best” airfoil has the highest pressure platform at 0 <x/c <0.2. However, a fluctuation of Cexists for the‘‘Cruise best” design because a simulated unsteady separation bubble appears on the upper surface.

Fig. 10 Airfoil geometries and ice shapes of three typical designs.
The flow field of the three typical iced airfoils are illustrated in Fig.12.The contour of the figure shows the nondimensionalized velocity U in the x direction. Separation bubbles occur at both the leading edge and the trailing edge on the upper surface. The iced ‘‘Cruise best” airfoil has unsteady leading-edge separation bubbles and a large trailing edge bubble, which causes fluctuations in the lift coefficient and induces stalling.The final result of the lift coefficient is obtained by the average over time.The‘‘Ice best”design has a smaller separation bubble that has less of an effect on the equivalent shape. In general, the optimization demonstrates that only optimizing the cruise performance can lead to a detrimental iced performance.The present dual-objective optimization can improve both the clean performance and the iced performance under certain atmospheric icing conditions.
5.2. Robust optimization: clean + several icing conditions
In the previous subsection, the performance of an airfoil is subject to a specific icing condition. However, in a real-world problem, the atmospheric icing condition is composed of several uncertain parameters, such as the MVD, LWC, and temperature. In addition, the FAR regulation gives the relationship between the three parameters, as given in Fig. 6.If we consider the most extreme conditions with a relatively high temperature, e.g., -5°C, the uncertainty parameters can be reduced to one(only the MVD).In the initial optimization,the MVD is kept fixed as a nominal value because of the maximum probability. Other groups of icing conditions based on different MVDs can also lead to detrimental aerodynamic performance, as mentioned in Section 3.2.
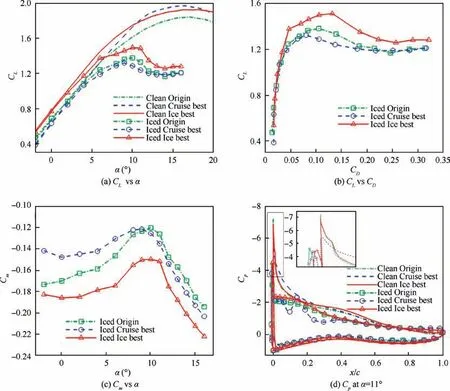
Fig. 11 Comparisons of the force coefficients and pressure distributions of typical airfoils.

Fig.12 Flow fields of the three airfoils at α = 11°.
To design an airfoil shape less sensitive to atmospheric conditions with different MVDs,a further optimization problem is performed in which the MVD is considered an uncertain parameter with an assumed Probability Density Function(PDF). The PDF illustrated in Fig. 13 is chosen to cover the icing atmospheric envelope. The normal distribution of MVD has a mean value of 25 μm and a standard deviation of 4. One should realize that such a probability density does not reflect the probability of a real flight.This function is used here to show the generality of the method and can be replaced by any PDF that more closely represents the actual atmospheric data with limited modifications.
The NIPCE method is then used to evaluate the variability in the maximum lift coefficient in terms of the given variation in MVD. The quadrature nodes of a fifth-order NIPCE method correspond to MVD=14,20,25,30,36μm.The corresponding weights are 0.0113, 0.2221, 0.5333, 0.2221 and 0.0113. The atmospheric icing condition parameters related to the MVDs are listed in Table 1.The fourth-order orthonormal polynomials are shown in Table 2.With the determination of the basis of orthogonal polynomials and of the quadrature nodes and weights,the coefficients of the NIPCE can be calculated by Eq. (15). Finally, the mean and variance of the maximum lift coefficient can readily be retrieved by Eqs. (17) and(18) and used as objectives in an optimization problem.In the robust optimization strategy, the deterministic value of Cin Eq. (16) is substituted by two objectives: the mean and standard deviation of C.The three objective optimization problem is then defined as in Eq. (19). The flow chart of the second optimization is illustrated in Fig. 14. Compared with the first optimization flow chart in Fig.8,more icing conditions and a NIPCE analysis are added to obtain robust performance of the ice-tolerant airfoils.
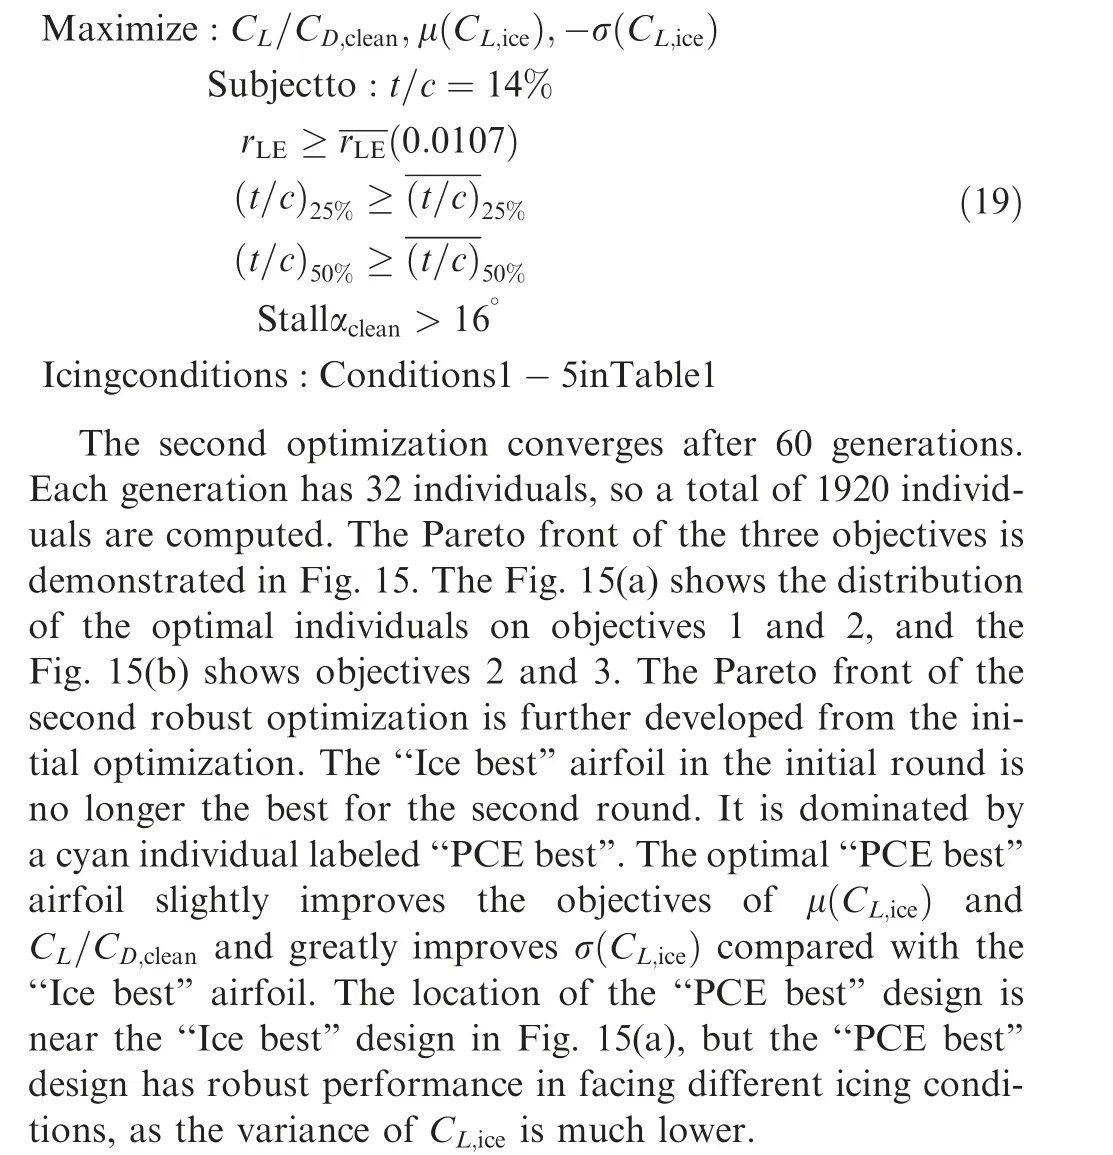

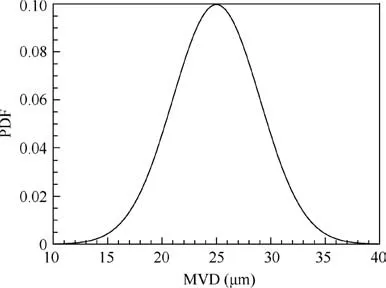
Fig.13 PDF for the assumed MVD.
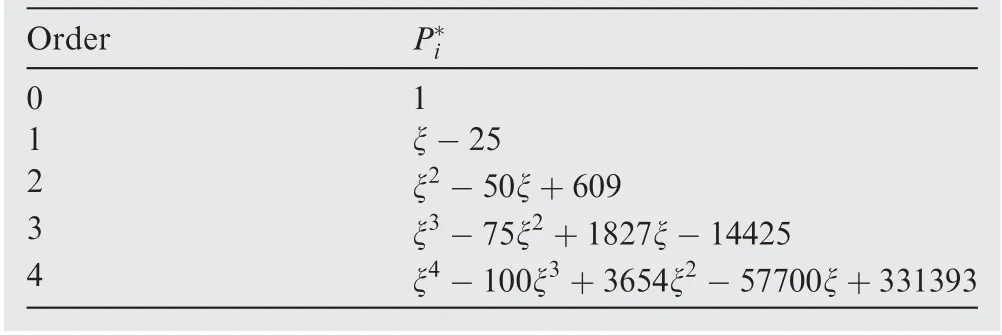
Table 2 System of orthonormal polynomials.
Table 3 lists the maximum lift coefficients of the three airfoils under five icing conditions with the quadrature nodes of MVDs.Compared with the‘‘Origin”airfoil,the‘‘Ice best”airfoil from the initial optimization has a larger maximum Cunder Conditions 1-3, but under Conditions 4-5, the lift performance shows no improvement. The ‘‘PCE best” airfoil gains promotion over the range of MVDs. Under Condition 4 (MVD = 30 μm), which is close to the designed point of Condition 3(MVD=25 μm),the‘‘PCE best”airfoil increases the maximum Cby approximately 6.5%. Under Condition 5(MVD = 36 μm), the ‘‘PCE best” airfoil increases the maximum Cby approximately 21.5%.
Fig.16 demonstrates the geometry comparison between the clean ‘‘Origin”, ‘‘Ice best” and ‘‘PCE best” airfoils. The camber of the‘‘PCE best”airfoil is reduced from the‘‘Ice best”airfoil, especially at the position of the maximum thickness. This means that a very large camber is good for the icing condition of MVD = 25 μm but may not adapt to a wide range of MVDs.Fig.17(a)shows the lift performance of clean and iced airfoils. The promotion of the iced performance of the ‘‘PCE best” under this icing condition is obvious. Fig. 17(b) further illustrates that the modification of the ice shape improves the iced performance because the accreted ice angle of the ‘‘PCE best” airfoil is not as critical as that of the ‘‘Ice best” airfoil.

Fig. 14 Framework of the second optimization.
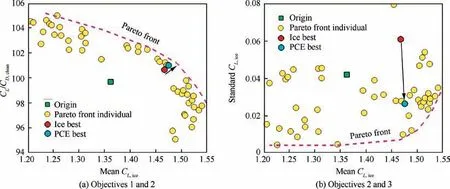
Fig. 15 Pareto fronts of robust optimization.

Table 3 Comparison of the maximum lift coefficient of three airfoils under NIPCE conditions.

Fig. 16 Airfoil geometries and camber lines of three typical designs in robust optimization.
Fig. 18 shows the flow field of the ‘‘Ice best” and ‘‘PCE best” airfoils under Condition 4. The ‘‘Ice best” airfoil has an unsteady separation bubble at the leading-edge region because of the glaze ice shape. A clear separation also exists at the trailing edge because of the strong adverse pressure gradient. By contrast, the ‘‘PCE best” airfoil has a stable separation bubble at the front and a smaller separation region at the trailing edge. Consequently, the ‘‘PCE best” airfoil shows a better performance under the icing condition of MVD = 30 μm.
The detailed relationship between the distribution of the ice height and airfoil shape is shown in Fig. 19. The abscissa s/c shows the dimensionless distance to the leading-edge point.The ordinate is the dimensionless distance from the local ice tip to the airfoil surface. The ice accretions on the ‘‘Ice best”and ‘‘PCE best” airfoils differ greatly in terms of the location of the maximum ice tip.The‘‘PCE best”airfoil has a relatively smaller ice angle than the ‘‘Ice best” airfoil and leads to an equivalent leading edge containing a more streamlined ice shape.
5.3. Validation of ice-tolerant airfoil in a fixed wing of UAV
The ice tolerance of the optimal airfoils is validated in a UAV configuration platform, as shown in Fig. 20. The aspect ratio of the UAV wing is 8.5, and the taper of the wing is 1.45.The ice accretion region in blue covers the leading edge of the entire span. The freestream flow velocity is 67 m/s. The simulation of the ice accretion process and the CFD analysis of obtaining the aerodynamic performance use the same set of meshes. The computation grid involves 6 million points,and the Δyof the first layer inside the boundary layer is ensured to be less than 1.0. The tested airfoils are ‘‘Origin”,‘‘Cruise best”and‘‘PCE best”.The‘‘Origin”airfoil represents the design before the optimization. The ‘‘Cruise best” airfoil represents the design that only considers the cruise performance. The ‘‘PCE best” airfoil represents the design that balances the cruise and ice-tolerant performance. The largest differences between these airfoils are the leading edge and camber. The comparison of the leading-edge region is shown in Fig. 20(b). The ‘‘Cruise best” airfoil has the largest leadingedge radius, while the ‘‘PCE best” has the smallest radius.
The three-dimensional ice accretion process is simulated by AERO-ICE software using the Myers thermodynamic model.The icing condition is associated with MVD = 25 μm,LWC = 0.41 g·m, T=-5°C and a static pressure of 89,874 Pa.The flight angle of attack is 2.75°,and the ice accretion time is up to 6 min. From the ice shape in the spanwise sections shown in Fig. 21, the relative size of the glaze ice increases from the root to the tip sections. The ice also grows from a single horn at the inner wing panel to double horns at the outer wing. The simulated ice shapes are considerably different between the three airfoils. The ‘‘Cruise best” airfoil accumulates a relatively large ice height and dangerous ice angle, while the ‘‘PCE best” airfoil contains a small height and an angle that is not so critical. The results indicate that the three-dimensional ice accretion on a wing has a strong consistency with the two-dimensional ice accretion on an airfoil.Because the UAV wing is a straight rather than swept wing,some sophisticated phenomena, such as a ‘‘scallop” or ‘‘lobster” ice shapes, do not exist.
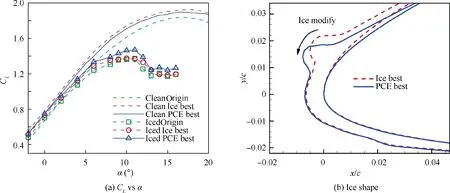
Fig. 17 Comparison of lift performance and ice shape of three typical designs under Condition 4.

Fig. 18 Flow fields of two airfoils under Condition 4 at α = 11°.
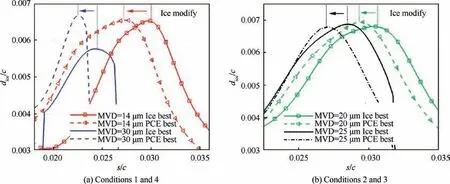
Fig. 19 Comparison of ice shapes under four atmospheric icing conditions.
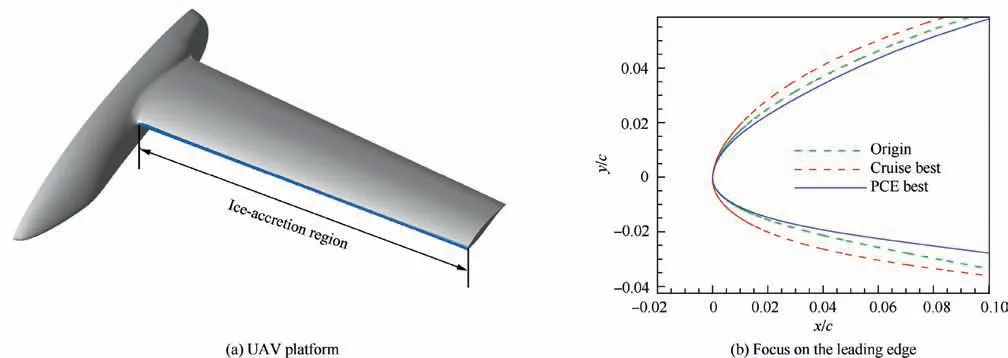
Fig. 20 UAV platform and installed three airfoils.

Fig. 21 Simulated three-dimensional ice accretion on three wings.
The clean and iced aerodynamic performances of the three designed wings are shown in Fig. 22. The wing installed with the optimal‘‘Cruise best”airfoil has the best stall performance under clean conditions. The maximum lift coefficients for the clean ‘‘Origin”, ‘‘Cruise best” and ‘‘PCE best” wings are 1.92, 2.03, and 1.98, respectively. The aerodynamic performance with respect to ice accretion effects is also shown in Fig.22(a).The maximum lift coefficients of the iced‘‘Origin”,‘‘Cruise best” and ‘‘PCE best” wings are 1.20, 1.20, and 1.28,respectively. The ‘‘PCE best” wing shows better ice tolerance,as the max Chas a 6.7%improvement.The moment curve in Fig. 22(b) shows that ice accretion changes the trend of Cwith an increasing angle of attack, which indicates that the UAV designer needs to reconsider the control rate in extreme atmospheric icing conditions. Consequently, robust airfoil optimization considering ice accretion effects is satisfactory for wing design,but the promotion of the 3D wing is not as obvious as that of the 2D airfoil. A better optimization of the icetolerant wing should be conducted under a fully 3D UAV platform.
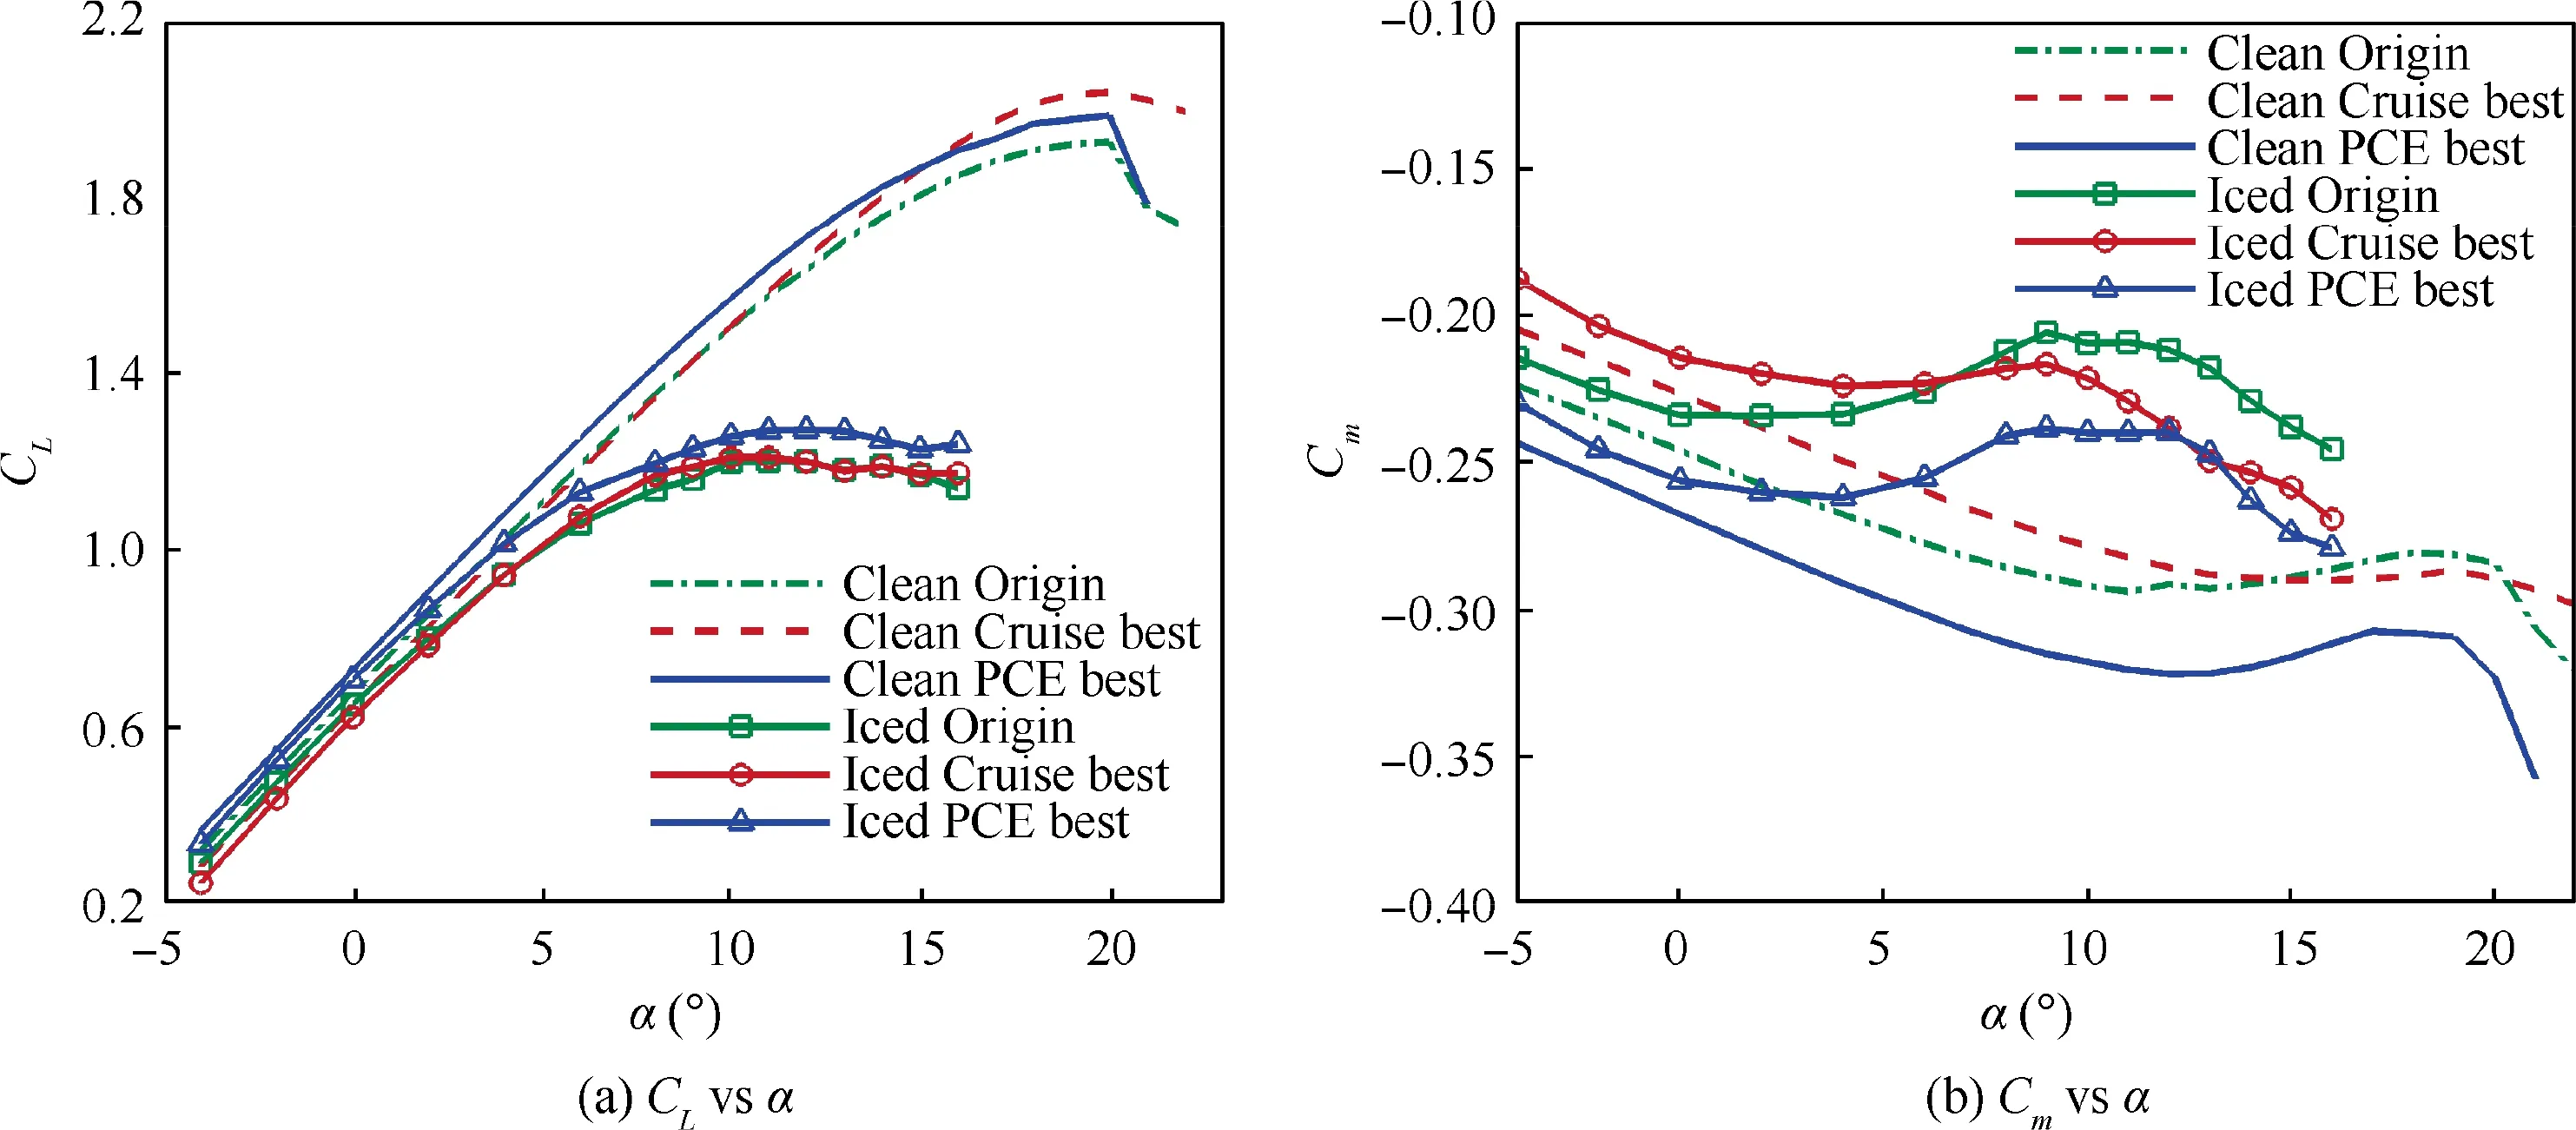
Fig. 22 Aerodynamic performance of three designed airfoils installed in UAV platform.
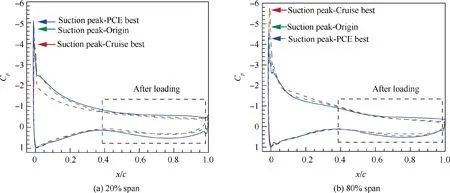
Fig. 23 Pressure distributions of two locations for ice accretion condition at α = 12°.
Fig. 23 demonstrates the sectional pressure distributions at α=12°under icing conditions.At the 20%half-span position,the suction peak of the ‘‘Cruise best” design is relatively low,and the slope of the pressure recovery is large, which leads to a small lift attribution.The‘‘PCE best”wing has the highest suction peak value and a larger surrounding area of Cin the after-loading region. At the 80% half span position, the‘‘Cruise best”wing has the highest suction pressure peak,while the ‘‘PCE best” wing has the lowest suction pressure peak.
6. Conclusions
The dangers of flying into icing conditions have been well recognized. This study introduced robust optimization design methods for airfoils concerning ice accretion effects. The ice accretion process under atmospheric icing conditions is simulated using the Myers model. A turbulence model SPF k-v-ω considering the nonequilibrium effects in the separating shear layer is used to predict the stall performance of iced airfoils and wings.
Two rounds of optimizations were conducted based on a RADE algorithm.The initial dual-objective optimization considers the clean lift-drag ratio and the iced stall performance.The results show that the optimal ‘‘Ice best” design has an 18% improvement in the iced maximum Cover the ‘‘Cruise best” design of the traditional optimization. In addition, the ice-tolerant airfoil greatly raises its camber line and aft loading.
In recognition of the real-world variability of the atmospheric icing conditions and their strong effects on aerodynamic performance, the environment parameter MVD is treated as an uncertainty, with an assumed PDF, into the second optimization.The NIPCE formulation is used to evaluate the variability in the maximum lift coefficient in terms of the given variation in MVD. Then, the acquired mean and variance of the maximum lift coefficient are used as objectives.This robust optimization further improves the adaption of the ice-tolerant airfoil under the whole atmospheric icing envelope. The earnings of the lift coefficient in the second robust optimization comes from the modification of the ice shape,as the optimal airfoil has an ice angle that is not critical to the incoming flow.
The optimal design of the ice-tolerant airfoil is applied to a three-dimensional UAV platform, in which the performance improvements and the relevant key flow features can be preserved.
The authors declare that they have no known competing financial interests or personal relationships that could have appeared to influence the work reported in this paper.
s
The research of this work is supported by the National Key Project of China(No.GJXM92579)and the National Natural Science Foundation of China (Nos. 92052203 and 11872230 and 91852108). The authors would like to thank Dr. Zhenchang LIU, School of Aerospace Engineering, Tsinghua University, for his kindness in providing the geometry model of the UAV platform.
 Chinese Journal of Aeronautics2022年4期
- Chinese Journal of Aeronautics的其它文章
- An automatic isotropic/anisotropic hybrid grid generation technique for viscous flow simulations based on an artificial neural network
- Pressure distribution feature-oriented sampling for statistical analysis of supercritical airfoil aerodynamics
- Recent progress of machine learning in flow modeling and active flow control
- Design method of optimal control schedule for the adaptive cycle engine steady-state performance
- Using tandem blades to break loading limit of highly loaded axial compressors
- Oblique detonation wave triggered by a double wedge in hypersonic flow
