A multi-fidelity simulation method research on front variable area bypass injector of an adaptive cycle engine
Zhewen XU, Ming LI, Hilong TANG,c, Min CHEN,*
a School of Energy and Power Engineering, Beihang University, Beijing 100083, China
b Aero Engine Academy of China, Beijing 101300, China
c Research Institute of Aero-Engine, Beihang University, Beijing 102206, China
KEYWORDS Adaptive cycle engine;Computational fluid dynamics;Front variable area bypass injector;Multi-fidelity simulation;Performance model
Abstract Front Variable Area Bypass Injector (Front-VABI) is a component of the Adaptive Cycle Engine (ACE) with important variable-cycle features. The performance of Front-VABI has a direct impact on the performance and stability of ACE,but the current ACE performance model uses approximate models for Front-VABI performance calculation. In this work, a multi-fidelity simulation based on a de-coupled method is developed which delivers a more accurate calculation of the Front-VABI performance based on Computational Fluid Dynamics(CFD)simulation.This simulation method proposes a form of Front-VABI characteristic and its matching calculation method between it and the ACE performance model, constructs a coupling method between the(2-D) Front-VABI model and the (0-D) ACE performance model. The result shows, when ACE works in triple bypass mode, the approximate model cannot account for the effect of Front-VABI pressure loss on Core Driven Fan Stage (CDFS) design pressure ratio, and the calculated error of high-pressure turbine inlet total temperature is more than 40 K in mode transition condition (the transition operating condition between triple bypass mode and double bypass mode). In double bypass mode, the approximate model can better simulate the performance of Front-VABI by considering the local loss of area expansion. This method can be applied to the performance-optimized design of Front-VABI and the ACE control law design during mode transition.
1. Introduction
As an ideal power plant for the future generation of aircraft,the Adaptive Cycle Engine(ACE)could significantly modulate its bypass ratio and total pressure ratio through the adjustment of the variable geometries, which enables it to have good performance under the conditions of subsonic cruise,transonic climb and supersonic cruise.These qualities of ACE have made it a hot topic of recent researches. In this paper, the ACE with variable low-pressure compression systemwas chosen as the subject of study, and its configuration is shown in Fig. 1.
The adjustment ability of ACE is due to it could work at two operating modes through the combined adjustment of the variable geometries. When the Mode Selective Valve(MSV) opens, all of the three bypass ducts are open, ACE operates at triple bypass mode.When the MSV closes,the second bypass duct is closed and other bypass ducts are open,ACE operates at double bypass mode.The flow paths of ACE at different operating modes are shown in Fig. 2. More details about the structure and operating modes of the ACE can be obtained in Ref. 4.
Of all variable geometries of ACE,the Front Variable Area Bypass Injector (Front-VABI) is the only one who has two operating modes. When ACE works at triple bypass mode,Front-VABI works as an ejector, which is called ejector mode in this article,the airflow in the first bypass eject the airflow in the second bypass, the two streams of airflow mixed and flow into Rear Variable Area Bypass Injector (Rear-VABI). In this mode, by adjusting the outlet area of the first and second bypass, Front-VABI could change the ejection relation of airflow in the two bypasses,regulate the mass flow of the first and second bypass, and finally realize the regulation of engine bypass ratio and the surge margin of Core Driven Fan Stage(CDFS). When ACE works at double bypass mode, MSV is closed,Front-VABI works as a duct,which is called duct mode in this article, and there is no airflow passing through the second bypass.
The use of Front-VABI provides performance advantages for ACE, but also affects the selection of design parameters of ACE components and the matching work between ACE components, which in turn presents many new challenges for the design of ACE. In triple bypass mode, the regulation of Front-VABI will affect the working status of the ACE components, and the mixing of the two streams in Front-VABI will cause additional losses and in some cases may even cause problems such as reverse flow,which significantly affects the stable operation of ACE.The complex shape of Front-VABI channel will also cause additional losses in double bypass mode.Improper parameter design and matching work may amplify the defects mentioned above, making the performance of ACE even weaker than the conventional mixed turbofan engines. If Front-VABI and the corresponding control laws are well designed, the performance of other components can be maximized. Conversely, it may lose the performance advantage of other well designed components, making the engine design less effective than it should be. Therefore, the study of Front-VABI performance and its matching relation with other components is critical.
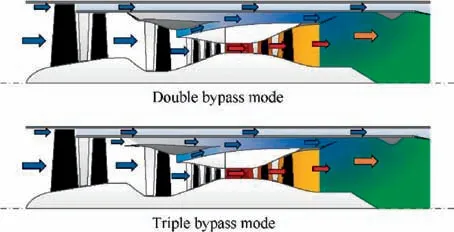
Fig. 2 Flow path of ACE at different operating modes.
Due to the high cost of experiments on Front-VABI under various operating conditions, numerical simulation is a better choice to study operating characteristics of Front-VABI and its matching operating rules with other components. At present, there are two main approaches to simulate the performance of Front-VABI: thermodynamic method and Computational Fluid Dynamics (CFD) method.
Thermodynamic method is usually applied to the calculation and analysis of engine overall performance. When Front-VABI operates at ejector mode,thermodynamic method treats Front-VABI as a mixer with variable area, the static pressure equilibrium condition at the mixing section is used to determine the ejection relation between the airflows in the two bypasses. The airflow parameters at the Front-VABI outlet are calculated by using one-dimensional gas dynamics functions, among them, Refs. 6,7 uses the momentum theorem to calculate the mixing loss in the ejection process, while Ref. 4 uses a set of lobe mixer characteristic to approximately simulate the mixing loss. When Front-VABI operating at duct mode, thermodynamic method treats Front-VABI as a duct component, among them, Ref. 4 considers the friction loss of Front-VABI, Ref. 6 also considers the local loss caused by the sudden expansion of area.
CFD method focuses on the internal flow details of Front-VABI and mainly researches the influence of design parameters and boundary conditions on the performance of Front-VABI, this method could consider the complex geometric structure impact on Front-VABI performance. Leng and Zhoustudied the variation trends of Front-VABI’s entrainment coefficient, total pressure loss and thermal mixing efficiency with boundary conditions. Chen et al.analyzed the ejection state of Front-VABI. Huang et al.also calculated the performance of Front-VABI’s duct mode and compared it with the experiment.
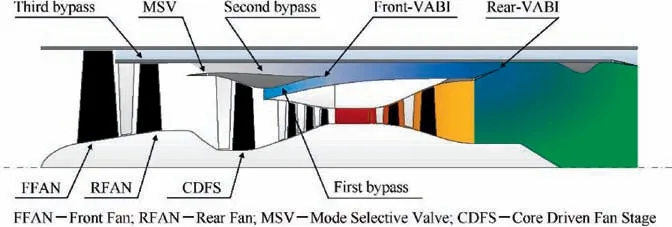
Fig. 1 Configuration of ACE with variable low-pressure compression system.
For Front-VABI, the calculation speed of traditional thermodynamic method is fast and the working relation between the ACE components can be analyzed, but the calculation results are not accurate enough, which makes it difficult to achieve the desired design performance of ACE.CFD method has high calculation accuracy,but usually its simulation is limited to the typical working state of individual component,and it is difficult to analyze the matching relation between the components in ACE,which is not conducive to guiding the parameter design of ACE.Therefore,for the Front-VABI of ACE,a simulation method that can guarantee both the computational accuracy under various operating conditions and the analysis ability of the matching relations between the engine components is needed.
As a solution, multi-fidelity simulation(also known as numerical zooming technology)allows researchers to couple both simulation environments at different fidelity levels effectively,thus allowing for a‘‘Variable Complexity Analysis”to be achieved satisfactorily at component and engine system level.
In recent years, many studies have been conducted using multi-fidelity simulation.Templalexis et al.directly embedded the high-fidelity fan model into the (0-D) engine performance model without affecting the calculation logic of the model.Tang et al.used an iteration simulation method to obtain the characteristics of the rotating components under low Reynolds number, predicted the performance changes of the mixed turbofan engine under low Reynolds number at high altitude. Melloni et al.carried out CFD modeling for the 3-stage fan and studied the influence of fan inlet stratified pressure distortion on the overall performance of turbofan engines. Reitenbach et al.embedded CFD simulation process into the optimization process of(0-D)engine performance model and optimized the variable geometry settings of a high-pressure compressor with the goal of engine overall optimal performance.
For the current level of computational resources,the multifidelity simulation could improve the accuracy of the simulation model on demand, increase the efficiency of performance analysis and optimization of design parameters during the preliminary design phase of the engine with significant cost and time savings.
This paper aims to propose a multi-fidelity simulation method for the Front-VABI of ACE. The method constructs a coupled calculation model of the high-fidelity Front-VABI model and the ACE overall performance model,realizes accurate simulation of Front-VABI performance under full operating conditions, which allows fast and accurate analysis of the matching relation of Front-VABI and other components of ACE. This method could provide more realistic requirements for component design during the design phase of ACE as well as the basis for performance optimization of Front-VABI.The advantages of this method are: (A) Does not require an iterative calculation between the two fidelity models,the distributed computing can be applied to the analysis and optimization calculation.(B)There is no need to change the program structure of the original ACE performance model.
In this article, ‘‘introduction” gives a brief introduction to ACE and Front-VABI, describes the motivation and method of this research. The following section explains the multifidelity simulation method and its calculation process in detail,introduces the research approach of the subsequent parts.Section 3 builds the computational model and gets the performance of Front-VABI. Section 4 discusses the coupling method of the ACE performance model and the Front-VABI characteristic. In Section 5, the performance of the multifidelity model and thermodynamic model is compared. The final section draws the conclusions.
2. Simulation strategy
The main research objective of this article is to obtain an accurate Front-VABI performance model for the ACE performance model based on the multi-fidelity simulation method.And the key to achieving multi-fidelity simulation is to complete the data transfer between simulation models with different fidelity levels.
In this article, a de-coupled simulation method was employed to implement the data transfer between the ACE performance model and the Front-VABI CFD model. The de-coupled method is to calculate the characteristic maps of components based on CFD simulation model, which is used to replace the general characteristic maps or empirical formulas of zero-dimensional simulation model for engine performance simulation.Fig. 3 shows the simulation strategy of the de-coupled method applied in this article.
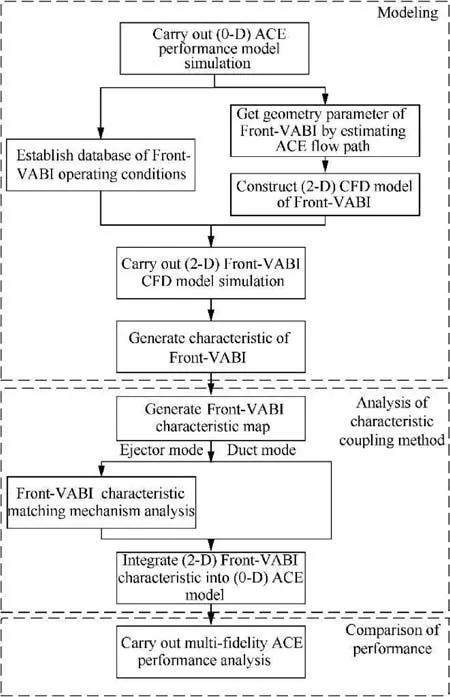
Fig. 3 Simulation strategy of de-coupled method.
From Fig.3,it can be seen that the de-coupled method is a direct method. Initially, the (0-D) ACE performance model which uses the traditional thermodynamic method is simulated to obtain the operating conditions of Front-VABI and the size estimation of ACE flow path. According to the ACE flow path, the geometry parameters of Front-VABI can be obtained,and the(2-D)CFD analysis can be carried out.Each(2-D) simulation produces a single averaged component performance point for a given operating condition. Then repeating the simulation to get the complete high-fidelity component performance parameters corresponding to each operating condition.The detailed calculation process and analysis related to the above will be described in Section 3‘‘Modeling”.
Once the Front-VABI performance is obtained, a set of more physics-based Front-VABI characteristic maps needs to be generated based on the performance parameters, which can be applied to ACE performance model under various operating conditions. Since the multi-fidelity simulation method introduces a new expression of Front-VABI performance in the form of the Front-VABI characteristic map, it is necessary to re-analyze the matching mechanism of Front-VABI characteristic so that it can participate in the iteration process of ACE performance calculation. After the above work, the (2-D) Front-VABI characteristic can be integrated into the(0-D)ACE performance model,replacing the original calculation module of thermodynamic method. This part of content will be described in detail in Section 4 ‘‘Analysis of characteristic coupling method”.
Finally, after the calculation process of multi-fidelity simulation is completed,a comparison of Front-VABI performance between the multi-fidelity method and thermodynamic method in two working modes will be performed in Section 5 ‘‘Comparison of performance”.
Through the method described above,a more accurate performance simulation of Front-VABI can be achieved by directly replacing the relevant component modules with the Front-VABI characteristic without changing the algorithms of other parts in ACE performance model. Also, this method does not require a parallel or iterative run between the (2-D)CFD simulation and the (0-D) engine performance model to obtain the Front-VABI characteristic, the data transfer between the models of different fidelity level is simpler, results in better stability and convergence of the computation.Due to the models of two fidelity levels do not constrain each other when performing the calculations, this method can be performed using the distributed computing architecture to speed up the calculation, and the whole process can be easily controlled remotely.
3. Modeling
3.1. (0-D) ACE performance model
The ACE performance model used in this research is a (0-D)model,which is composed of a series of component calculation modules. The calculation method of each component module adopts the component characteristics or the empirical formula to calculate. By giving the engine’s operating conditions and control law, The ACE performance model could obtain the engine’s overall performance parameters, such as thrust, SFC(Specific Fuel Consumption), etc.
The ACE engine performance model mainly has two functions, design point calculation and off-design point calculation. The design point calculation selects the most reasonable engine working process parameter as the engine design parameter under the given working conditions according to the aircraft mission requirements and the existing component design level. Based on the result of design point calculation,the performance parameters of each engine component and the key geometry parameters can be obtained.Some important design parameters of ACE at design point are shown in Table 1.
The off-design point calculation is to obtain the performance of each engine component as well as the overall performance under off-design conditions. Simulating the performance of each component of ACE for off-design point conditions depends on the equilibrium equations between the components, including mass flow equilibrium equation between adjacent components, energy equilibrium equation for each rotor, and the static pressure equilibrium at the mixing section.An iterative calculation is performed with the goal of all equilibrium equations being met to determine the performance of each component. The detailed process of simulating ACE off-design point performance will be described in detail in Section 4.1.2.
3.2. ACE flow path estimation
To calculate the performance of Front-VABI using CFD, the detailed geometry model of Front-VABI is required. Since the geometry structure of Front-VABI is mainly limited by the geometry parameters of other main components of ACE,this paper estimates the geometry sizes of each main component of ACE according to engine performance parameters first,and then the geometry parameters of Front-VABI can be obtained.
Due to the ACE studied in this paper has two operating modes and several compression components have variable stator vanes, it is necessary to comprehensively consider the working state of each component at the maximum corrected spool speed and the maximum stator vane opening under the two ACE operating modes as the reference state of flow path estimation.
According to ACE performance model,the maximum state performance parameters of the main components are calculated, and the radial and axial sizes of them are estimated.Among them, Front Fan (FFAN), Rear Fan (RFAN) and High-Pressure Compressor (HPC) are designed based on constant outer radius, and CDFS, High-Pressure Turbine (HPT)and Low-Pressure Turbine (LPT) are designed based on constant medium radius. The size estimation principle of the above components mainly referred to Refs. 21,22. The obtained flow path of ACE is shown in Fig. 4.
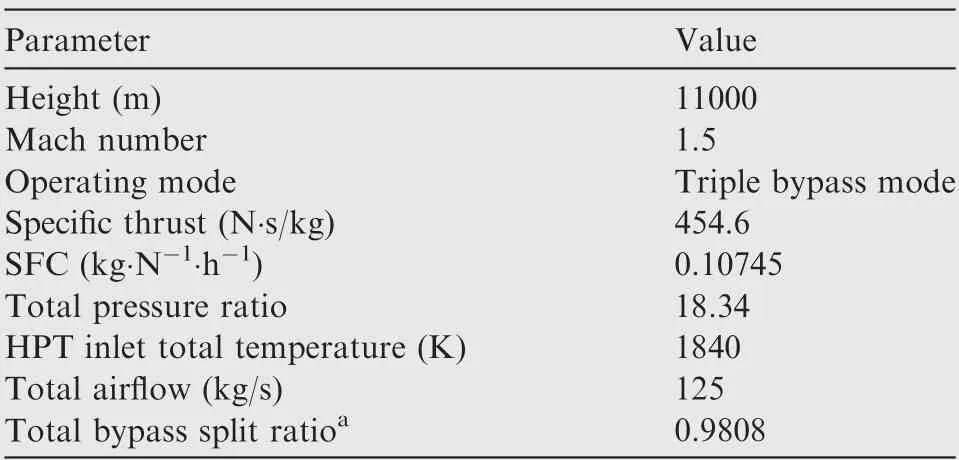
Table 1 Design parameters of ACE.
3.3. (2-D) Front-VABI model
3.3.1. Geometry modeling
According to the results of ACE design point performance calculation, the flow area (the area perpendicular to the flow direction) at the outlet of the first and second bypass duct can be obtained as Aand Arespectively. The structure of Front-VABI adjustable area mechanism selected in this paper is the axial regulating type.This type of regulating mechanism uses a hydraulic actuator (not shown in the picture) to drive an axially movable cylinder shell so that could change the starting point of the two airflows mixing, according to the change of Front-VABI shroud geometry, the outlet flow area of the first and second bypass duct can be adjusted.
By means of setting the shroud shape and the position of adjustable mechanism reasonably, the outlet flow area of the first and second bypass duct in Front-VABI geometry model is designed the same as that calculated by ACE performance model on the premise that it has sufficient regulating ability.Fig. 5 shows the Front-VABI geometry model in the design state.
3.3.2. CFD modeling
In this study, ICEM CFD 19.2, FLUENT 19.2 and ANSYS Workbench 19.2 are respectively used as the grid generator,CFD solver and the batch calculation platform.
Since Front-VABI can be seen as a rotating body in structure, a (2-D) axisymmetric domain was used for modeling the Front-VABI,which could greatly reduce the computation time under the premise of reflecting the 3D effects.
The non-linear governing equations are solved using the‘‘pressure-based” solver with the ideal gas model. A secondorder upwind scheme is adopted to discretize convective terms.Coupled algorithm method is applied to obtain the pressure field. The standard k-ε model is selected as the turbulence model.The near wall treatment is treated as the ‘‘standard wall function” which has reasonably accurate results for the wall bounded with high Reynolds number flow. Boundary conditions of the first bypass duct and second bypass duct inlets are set as ‘‘pressure inlet” condition, the ‘‘pressure outlet” condition is adopted on the outlet of the Front-VABI,and no-slip boundary conditions are employed on all solid surfaces.
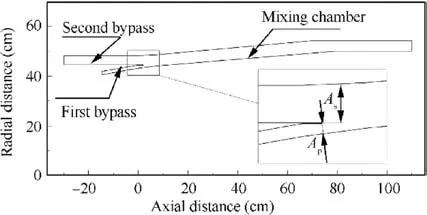
Fig. 5 Front-VABI geometry model.
To get the optimum grids number that could offer a preferable compromise between the computation time and accuracy,the independence of the results from the grid has been analyzed as shown in Table 2. Based on the test results, the number of structured grids for Front-VABI CFD model is determined to be about 56000.The entrainment ratio is defined as below:

where the Wis the first bypass air mass flow,Wis the second bypass air mass flow.
An experiment studyof ejector nozzles with the same working principle and similar working conditions as Front-VABI is selected as the benchmark for the CFD model validation in this paper. Under the same experimental conditions as given in the literature, the comparison of the CFD results and the experiment results are presented in Fig.6.The CFD model in this paper resulted in a good performance prediction with the considered operating conditions.
3.4. Front-VABI operating performance analysis
3.4.1. Ejector mode
For the performance of ACE,the regulating ability of flow and mixing loss are the main performances considered by Front-VABI at ejector mode. The regulating capacity of flow can be expressed by the entrainment ratio (which has defined as Eq.(1)),and the mixing loss can be expressed by the total pressure recovery coefficient, which is defined as below:where Pis the inlet total pressure of first bypass, Pis the inlet total pressure of second bypass, Pis the outlet total pressure of Front-VABI.


Fig. 4 Main part of ACE flow path.

Table 2 Grid independency test results.
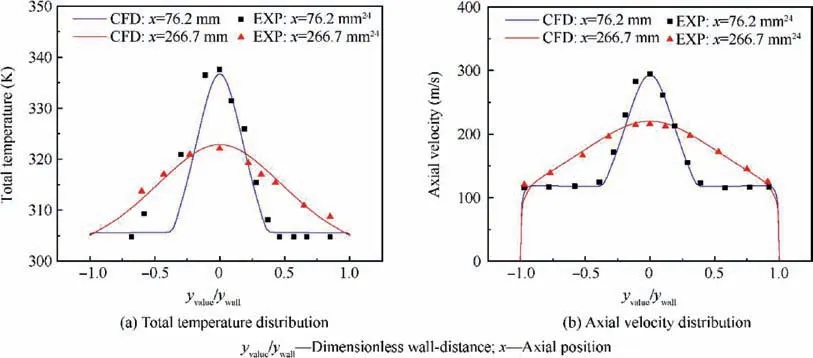
Fig. 6 Comparison of CFD results and experimental data.
Fig. 7 shows the Front-VABI back pressure characteristic represented by P/P, where Pis the outlet static pressure of Front-VABI.With the decrease of P/P,Wand Wgradually increase,among which Wincreases faster,so that φ rises gradually until it reaches the choked flow state. Choked flow state means that the flow velocity of the second bypass reaches the sonic speed at the outlet,and the Wreaches the maximum.Therefore, when Front-VABI reaches a choked flow state,even if P/Pcontinues to decrease, φ will not continue to increase. With the decrease of P/P, σshows a variation trend of first increasing, then decreasing and then tending to be stable. There is an operating point with the minimum mixing losses for Front-VABI.
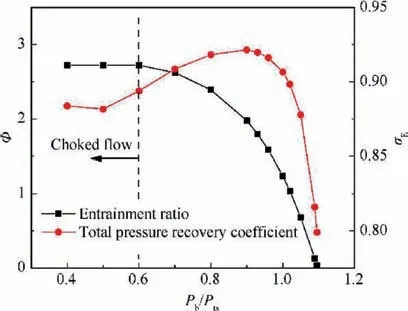
Fig. 7 Front-VABI back pressure characteristic while Ptp/Pts = 1.4, As/Ap = 3.926.
3.4.2. Duct mode
Compared with the ejector mode,in the duct mode,there is no airflow passing through the second bypass duct.Thus,the performance of Front-VABI under this working state is mainly shown as the pressure loss due to the irregular flow path structure of the component under various working conditions. In this paper, the variation trends of the total pressure loss with the mass flow of Front-VABI is calculated when the adjustable mechanism is located at different positions. The CFD setting basically follows the parameter setting in Section 3.3.2,because there is no airflow passing through the second bypass,the boundary condition at the second bypass duct inlet changed from ‘‘pressure inlet” to ‘‘wall”. In order to meet the calculation demand of ACE performance model, the characteristic is represented in corrected mass flow Wand total pressure recovery coefficient of duct mode σ, which defined as below:

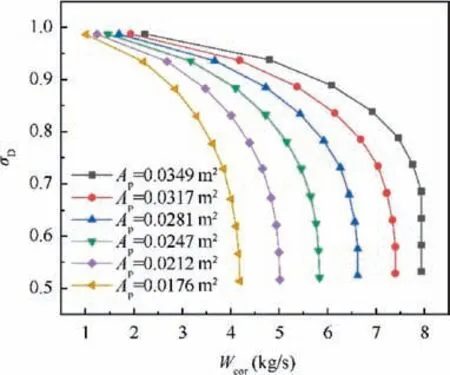
Fig. 8 Total pressure loss characteristic of Front-VABI in duct mode.

where Tis the inlet total temperature of first bypass, T, Pare the temperature and pressure of the International Standard Atmosphere (ISA) respectively.
Fig. 8 shows the Front-VABI characteristic in duct mode.According to the characteristic, under any conditions, the larger the area of Ais, the smaller the total pressure loss of the airflow through Front-VABI will always be.The reason for the above conclusion is that when Front-VABI works in duct mode, the airflow flowing through the junction of two bypass ducts of Front-VABI is equivalent to flowing through a duct with a sudden expansion of area,therefore,the larger the area of Ais, the lower the degree of sudden expansion of the duct will be,and the higher the σwill be.At the same time, it can also be found that, no matter what the Aarea is, with the increase of W,the rate of decline of σis constantly increasing, and finally Front-VABI will reach the congestion state,that is, the mass flow through Front-VABI cannot continue to increase. The reason for this phenomenon is that the first bypass duct is a duct with a gradually decreasing area, when Front-VABI works in the duct mode, the airflow at the outlet section of the first bypass duct can only reach the speed of sound at the highest, so the maximum mass flow that can be passed through the Front-VABI is limited. According to the above analysis,Ashould always be adjusted to the maximum to keep σto the maximum and the mass flow of Front-VABI unconstrained when Front-VABI works in the duct mode.
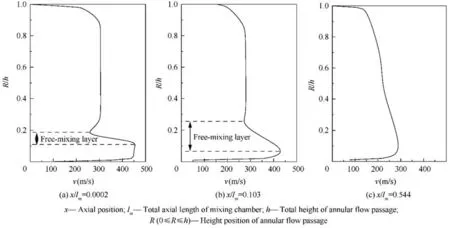
Fig. 9 Airflow velocity distribution at different axial positions in mixing chamber of Front-VABI.
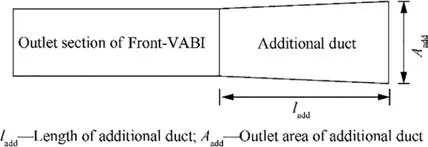
Fig.10 Schematic diagram of additional duct after Front-VABI.
3.5. Front-VABI ejection state analysis
The fundamental mechanism of the ejector is the entrainment of airflow due to the development of the free-mixing layer.Whether the free-mixing layer attaches to the shroud before the ejector outlet determines the ejection state of the airflow in the ejector. If the free-mixing layer attaches to the shroud,the airflow inside the ejector is in a fully ejected state, which means that continuing to increase the length of the mixing chamber does not increase the entrainment ratio. If the freemixing layer does not attach to the shroud, the airflow in the ejector is in a partly ejected state. At this point, if the length of the mixing chamber continues to increase,the entire ejection process will continue to develop, and the entrainment ratio of the ejector will continue to increase until the airflow is in a fully ejected state. For a more detailed description of the free-mixing layer theory, please refer to Ref. 25.

Table 3 Comparison of effects of different additional duct geometry on Front-VABI performance.
Unlike the normal form of ejector, the export environment of Front-VABI is not the ambient atmosphere,but a duct with the variable area(the outer bypass duct of Rear-VABI),which means if the airflow in the Front-VABI is still not fully ejected until reaching the outlet,then the airflow will continue to complete the ejector process in the duct following the Front-VABI outlet section,which will result in the actual entrainment ratio of Front-VABI when working as a component in ACE is larger than the entrainment ratio obtained by Front-VABI CFD simulation alone. Therefore, it is necessary to study the ejection state of the airflow in the Front-VABI model to ensure the consistency of the calculated results with the actual application.
In the working condition with the longest mainstream jet flow length (φ is at maximum, P/Pis as high as 1.6, A/Ais as low as 6.503)within the range of characteristic studied in this paper, the airflow velocity v distribution at different axial positions in mixing chamber is shown in Fig. 9. It is found that the free-mixing layer grows gradually with the ejection process.At x/l=0.544,the free-mixing layer is basically attached to the outer shroud of Front-VABI, and the velocity distribution of airflow tends to be uniform,that is,the ejection process has been basically completed.
In order to further verify the ejection state of Front-VABI outlet airflow, as shown in Fig. 10, this paper adds a variable geometry duct (to simulate the variable area bypass of Rear-VABI) to the outlet of the existing Front-VABI geometry model. The influence of different additional duct length and outlet area on the performance of Front-VABI is calculated under the condition that the total pressure of outlet of the additional section is identical, and the calculation results are shown in Table 3. It is found that increasing the additional duct length or changing the outlet area will not affect the entrainment ratio of Front-VABI (the reduction of φ and σare due to the wall friction loss of the additional duct). The above calculation results also prove from another aspect that the airflow at the outlet of Front-VABI is fully ejected under various working conditions, and the geometric changes in Rear-VABI will not affect the characteristic of Front-VABI,so it is feasible to use the Front-VABI characteristic to calculate the performance of Front-VABI.
4. Analysis of characteristic coupling method
4.1. Ejector mode
4.1.1. Analysis of characteristic map form
Due to the complex operating conditions of ACE,a large number of boundary conditions are required to calculate the Front-VABI performance in all operating conditions within the ACE flight envelope, which requires significant computational time and is not conducive to the expression of Front-VABI characteristic in ACE performance model. Therefore, it is necessary to analyze the similarity law of Front-VABI in order to find a set of dimensionless performance parameters that can express the performance of Front-VABI, which could realize the calculation of Front-VABI performance under various conditions with only a small amount of CFD simulation.
Two similar flows should satisfy three conditions:geometric similarity, kinematic similarity and dynamic similarity. And there are many similarity parameters to ensure the flow similarity,including Euler number(Eu),Mach number(Ma),Reynolds number(Re),Froude number(Fr)and so on.Obviously,it is not possible to satisfy all these similarity parameters at the same time, so the most important factor needs to be selected according to the flow problem under study. For Front-VABI, the main factors affecting its internal airflow are the elastic force and friction force, obviously Ma and Re should be the main similarity parameters.If Ma and Re are not guaranteed to be equal at the same time, Ma should be the main similarity parameter.
In this paper, a simplified Front-VABI one-dimensional approximate model is used to derive its similarity law, as shown in Fig.11.The airflow direction of each inlet and outlet of this model is axial.
For this one-dimensional approximate model,its operating state can be described by the following basic equations:
Continuity equation:

Energy equation:


Fig. 11 Front-VABI one-dimensional approximate model.
Momentum conservation equation:
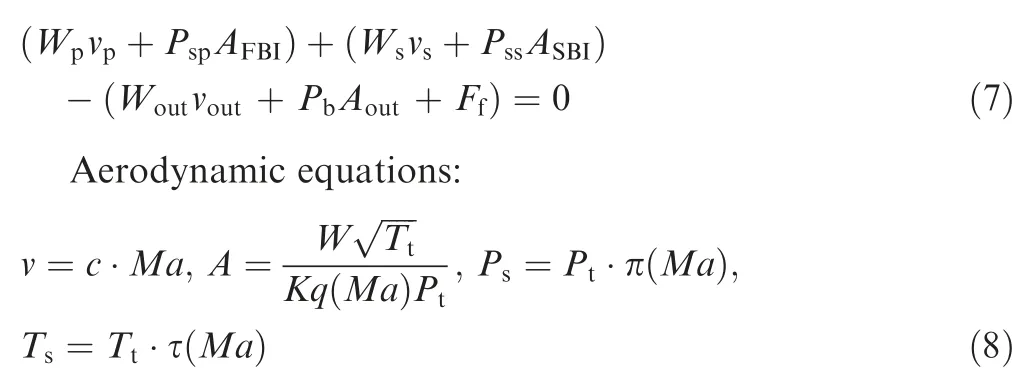
where Cis the specific heat at constant pressure,Tis the inlet total temperature of second bypass, P, A, v, P, A, vare the static pressure,area and airflow velocity of first bypass inlet and second bypass inlet respectively,Fis the wall friction force,c is the local sound speed,K is the airflow function constant,q(Ma),π(Ma),τ(Ma)are the flow functions,Tis the total temperature of the Front-VABI outlet airflow,Ais the Front-VABI outlet area, Wis the air mass flow of Front-VABI outlet,Pand vare the static pressure and velocity of the Front-VABI outlet airflow.
Performance parameters of Front-VABI can be made dimensionless by the following equation:

If wall friction is neglected and the outlet airflow is assumed to be fully mixed, the following Front-VABI state equation can be obtained by combining the above equations:
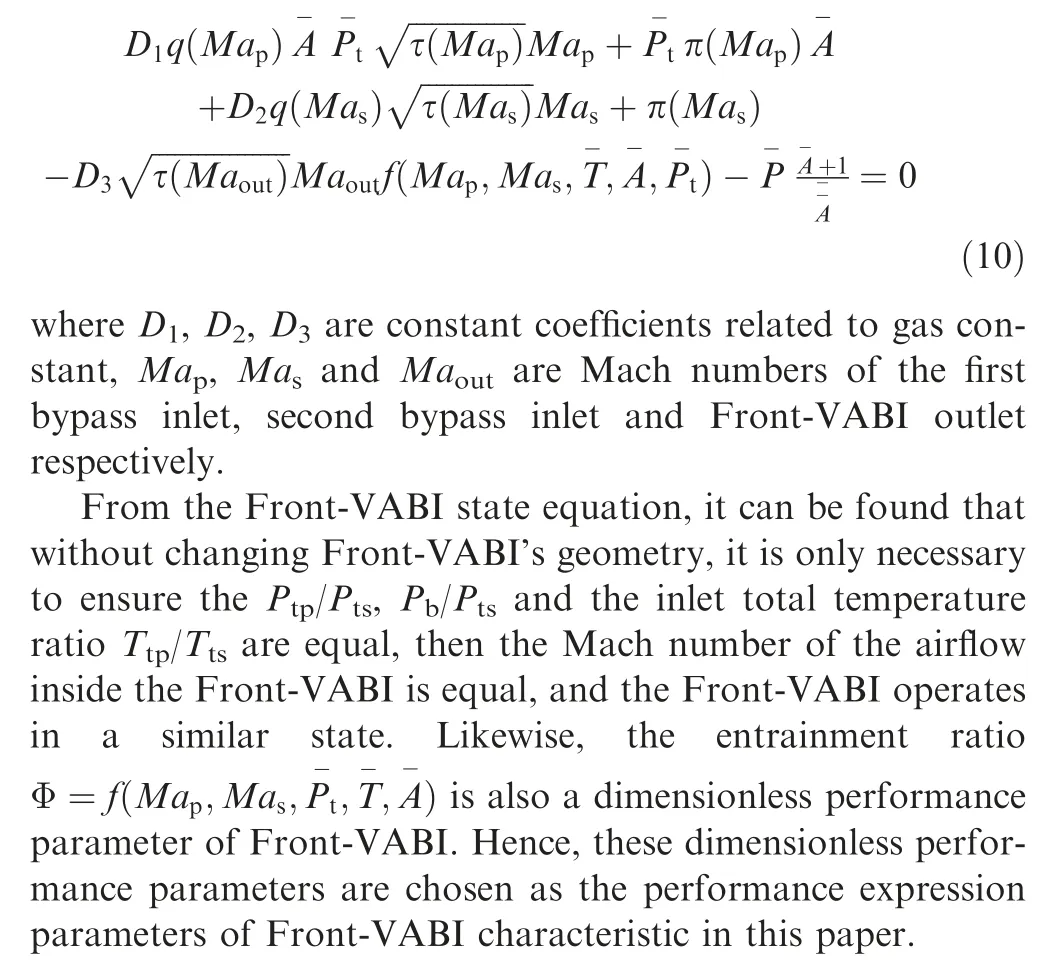
Since the effect of T/Ton the Front-VABI performance is far less than that of other dimensionless performance parameters,P/Pand P/Pare chosen as the main characteristic expression parameters in this paper,and the effect of different T/Ton the Front-VABI performance is not considered when generating the characteristic. The dimensionless corrected entrainment ratio φis applied to represent the characteristic of the Front-VABIin order to eliminate the performance error caused by the inconsistency of T/Tbetween the characteristics and the actual operating conditions. The corrected entrainment ratio φis defined as below:

According to the calculation in this paper, the calculation error of the characteristic maps obtained by the above method is less than 1.2% within the ACE main operating conditions. Although this method partly reduces the precision of component characteristic, it significantly reduces the computation time, so it is still a cost-effective and feasible solution.
The goal of this research is to obtain a Front-VABI performance model that can be applied to ACE performance model.Therefore, the characteristic of Front-VABI needs to be able to participate in the iterative solving process of ACE performance calculation. The simulating process of ACE off-design point performance is described in detail below.
4.1.2. ACE off-design point performance simulating process
Simulating the ACE off-design point performance is a process of determining the performance of a set of components that can satisfy the equilibrium operating relation under a given engine operating condition. The component performance is calculated by guess value when the operating state cannot be determined. Multiple equilibrium equations are set up to iteratively correct the guess values.
When Front-VABI operates in ejector mode,ACE is in the triple bypass mode, there are eight guess values used to determine the performance of the components, which are listed in Table 4. The guess value of the rotation speed of rotor is controlled by ACE control law, when the ACE control law is to control the low-pressure rotor speed, the guess value is the high-pressure rotor speed, and it’s the same the other way round. The guess values for the rotating components are the auxiliary coordinate β of the respective characteristic maps,the performance parameters can be interpolated from the characteristic map by determining the corrected speed and β of each component.
Corresponding to the 8 guess values,there are 8 equilibrium equations,so determining component performance can be considered as a process of solving multivariable nonlinear equations. When using the thermodynamic method to calculate the performance of Front-VABI, the 8 equilibrium equations are shown as follows:

Table 4 Guess values for ACE with variable low-pressure system.

(1) HPT flow compatibility:
(2) LPT flow compatibility:

(3) High-pressure rotor energy equilibrium:

After taking into account the high-pressure rotor mechanical efficiency η, the HPT output power Lshall be equal to the sum of HPC power consumption Land CDFS power consumption L.
(4) Low-pressure rotor energy equilibrium:

After taking into account the low-pressure rotor mechanical efficiency η, the LPT output power Lshall be equal to the sum of FFAN power consumption Land RFAN power consumption L.
(5) Front-VABI static pressure equilibrium:

The static pressure at the first bypass outlet Pshall be equal to the static pressure at the second bypass outlet P.
(6) Rear-VABI static pressure equilibrium:

The static pressure at the bypass outlet Pshall be equal to the static pressure at the LPT outlet P.
(7) Main nozzle throat area compatibility:


(8) Bypass nozzle throat area compatibility:

Since the initial guess values basically cannot satisfy the above 8 equilibrium equations at the same time,it is necessary to introduce residuals for numerical calculations of equilibrium equations, such as z,z,...,zin the above equations.These residuals can be considered as a residual vector Z = [ z,z,...,z], and the same can be done with the guess vector Y = [y,y,...,y]for 8 guess values, so the residual vector of equilibrium equations can be regarded as a function of the guess vector as shown in Eq. (20):

Calculating the ACE off-design point performance can be viewed as a process of obtaining a guess vector that makes the residual vector equal to zero vector, which is equivalent to solving the following equation:

The above equation involves non-linear calculations and interpolation, so there is no explicit expression for this equation, a Newton-Raphson algorithm is used to iteratively solving the above equation. The detailed solving process can be referenced in Ref. 27,28. The flow chart for simulating ACE off-design point performance can be seen in Fig. 12.
4.1.3. Equilibrium matching method analysis
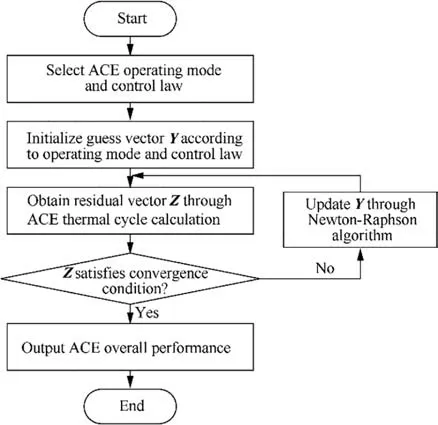
Fig. 12 ACE off-design point calculation flow chart.
According to the previous section, when ACE performance model uses thermodynamic method to calculate Front-VABI performance, the Front-VABI involves the equilibrium equation as shown in Eq.(16).When the Front-VABI characteristic obtained by multi-fidelity method is used for ACE performance calculation, the original thermodynamic based component modules such as the first and second bypass duct, front mixer,and the mixing chamber of Front-VABI have been integrated into Front-VABI characteristic, and the cross-sectional parameters between the original component modules are no longer available. Thus, the equilibrium equation involving Front-VABI needs to be redesigned if the Front-VABI characteristic is applied for ACE performance calculation. In this paper, a new equilibrium equation is constructed using the equivalence between the Front-VABI inlet mass flow calculated from upstream component performance and the Front-VABI outlet mass flow obtained by characteristic interpolation.
By calculating the performance of the upstream components, W, W, T, T, P, Pcan be obtained, then according to the above parameters, interpolating the Front-VABI characteristic will give P,at this time there exist the following relations:
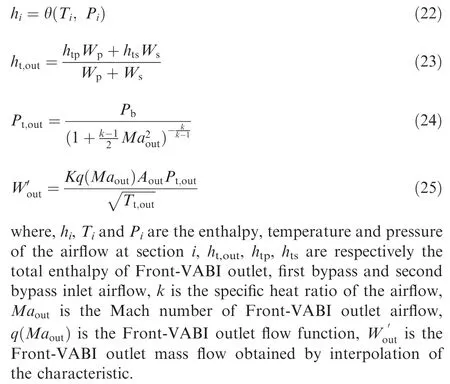
Therefore, if the Front-VABI characteristic contains information about Mafor each corresponding condition, based on Eq. (22) and Eq. (23), the varying specific heat capacity method can be applied to calculate Taccording to the conservation of energy, and then based on Eq. (24) and Eq. (25),the Front-VABI outlet mass flow can be calculated by characteristic interpolation. An equilibrium equation for the inlets and outlet mass flow of Front-VABI can be constructed as shown in the following equation:

This equilibrium equation constructs a functional relation between several guess values such as N, β, βand β, which is the same with the Front-VABI static pressure equilibrium equation shown in Eq. (16). Thus for the set of nonlinear equations of simulating the ACE off-design point performance,the set remains closed after changing the equilibrium equation, which means the new equilibrium equation is reasonable.
Based on the above analysis,in order to be able to calculate the ACE off-design point performance, the characteristic map of Front-VABI in ejector mode involved in the ACE performance calculation should contain the Madata for each corresponding characteristic point. Ultimately, the Front-VABI characteristic map in ejector mode constructs the correspondence between the P/P, P/P, A/A, φand Ma. The Front-VABI characteristic map in ejector mode at a certain A/Ais shown in Fig. 13.
Similar to the multi-angle compressor characteristic, the Front-VABI characteristic is a multi-area ratio dimensionless characteristic that gives the correspondence between the Front-VABI inlet and outlet dimensionless airflow parameters for several area ratios. The operating state of the Front-VABI can be quickly determined through the characteristic. In the following two sections, the interpolation method of the Front-VABI characteristic and the calculation process of the characteristic in the ACE performance model are described in detail.
4.1.4. Characteristic interpolation method
It can be seen from the characteristic map that the values of the characteristic points are not uniformly distributed, so the characteristic map needs to be interpolated using the auxiliary coordinate β. βdenotes the location of the Front-VABI’s operating points at the given P/P. Take the line which P/Pequal to 1.6 in Fig. 13 as an example. There are 11 operating points on this line, with βvarying from 1 to 11. The points with the same P/Pand βdenote the same operating point in the two characteristic maps of Front-VABI in ejector mode. By using the auxiliary coordinates βto represent the characteristic, the Front-VABI performance parameters φ, P/Pand Macan be represented as Eq. (27), and the performance parameters can be obtained by inputting P/P, A/Aand βand interpolating the characteristic using the conventional interpolation algorithm.

Generally speaking, the logic for calculating the Front-VABI performance is to input the Front-VABI inlet parameters such as φ, P/P, T/Tand the area ratio A/A, and then to obtain the outlet parameters such as P/Pand Mafrom Front-VABI characteristic. However, for Front-VABI characteristic, the interpolation method can only be used to obtain φ, P/Pand Mabased on the input P/P,A/Aand β,and the opposite is not true.So that the Front-VABI performance cannot be determined directly by interpolation.
Since in Front-VABI characteristic,φcan be considered as a monotone function of βwhen other parameters are constant, this paper applies a bisection method to determine the Front-VABI performance. By guessing the value of β,the convergence condition is that the entrainment ratio obtained from the guessed value of βis equal to the input entrainment ratio, a bisection method is used to calculate the βcorresponding to the input entrainment ratio,and then The Front-VABI operating state can be determined by interpolating the characteristic according to the inputting P/P,A/Aand βas shown in Eq.(27).Fig.14 shows the flow chart of interpolation calculation for the Front-VABI characteristic in ejector mode.
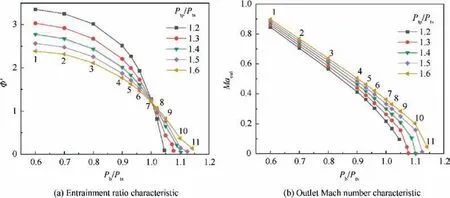
Fig. 13 Front-VABI characteristic map in ejector mode (As/Ap = 4.2).
It is important to note that βis only an auxiliary coordinate used in the performance calculation process of Front-VABI when performing the characteristic interpolation, and it does not participate in the process of solving the nonlinear equations for the ACE off-design point performance.Compared with the traditional thermodynamic methods, the Front-VABI characteristic method developed in this paper only changes the equilibrium equation at Front-VABI, but not the guess values for the iterative solution of the ACE off-design point performance.
4.1.5. Performance calculation process
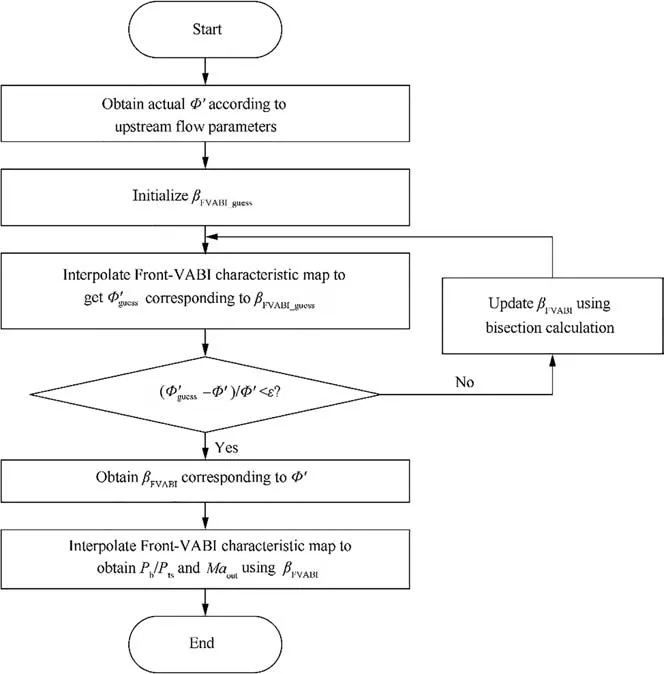
Fig. 14 Flow chart of interpolation calculation for Front-VABI characteristic in ejector mode.

4.2. Duct mode
For Front-VABI characteristic in duct mode, since it is only a total pressure loss characteristic related to the corrected mass flow,it can be used simply by replacing the corresponding duct component modules in the original method. Because its calculation process remains essentially the same, it will not be described here.
5. Comparison of performance
5.1. Ejector mode
5.1.1. Description of thermodynamic method
Currently,the most commonly used method for calculating the performance of Front-VABI in ACE performance model is the thermodynamic method, which is also widely used in the performance calculation of mixer for mixed flow turbofan engine.This method considers the ejection process as a constant-area mixing process that can be completed at the start of the mixing cross-section,through the thermodynamic calculation and static pressure equilibrium to calculate the airflow parameters after mixing.There are two main approaches of thermodynamic method to consider the mixing loss:the momentum theorem method and the mixer characteristic method. The momentum theorem method applies the Eq. (28) to calculate the airflow pressure after mixing:

where v,v, v, P, P,Pare the airflow velocity and static pressure of first bypass outlet, second bypass outlet and mixing cross-section, respectively.
The mixer characteristic method uses mass averaging and a group of pressure loss characteristic of a mixer to calculate the airflow pressure after mixing, as shown in Eq. (29):

where P, P, Pare the total pressure of the first bypass outlet, second bypass outlet and mixing cross-section,respectively, σis the mixer characteristic.
5.1.2. Comparison of design point performance
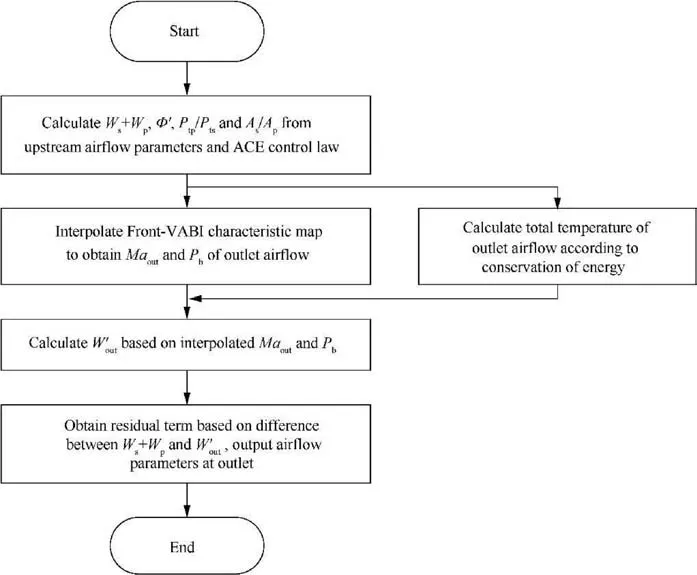
Fig. 15 Front-VABI off-design performance calculation logic flow chart in ejector mode.
For the ACE design point performance calculation,the Aand Aof Front-VABI not only affects its pressure loss, but also affects the selection of the CDFS design pressure ratio(π).Since Wand Ware limited by the designed bypass ratio, and the πaffects the P/Pof Front-VABI,which in turn affects the φ of Front-VABI (i.e., the bypass ratio of the first and second bypass), the matching relation between the designed bypass ratio of ACE and the πis influenced by the Aand Aof the Front-VABI. For the thermodynamic method, this matching relation is achieved based on the static pressure equilibrium at the Front-VABI mixing cross-section; for the Front-VABI characteristic method developed in this paper, the matching relation is achieved by balancing the total inlet mass flow (W+ W)with the outlet mass flow Wobtained through interpolation characteristic.
When using the Front-VABI characteristic to calculate π,πcannot be obtained directly from the matching relation due to the existence of the characteristic interpolation in the calculation process. Thus,πneeds to be guessed and then solved iteratively with the equilibrium of(W+ W) and Was a convergence condition, the entire calculation process is shown in Fig. 16.
Table 5 gives a comparison of the ACE design points performance obtained by the Front-VABI characteristic method and thermodynamic methods. It is important to note that the CDFS pressure ratio (π) is one of the key parameters that determine the performance of ACE, so it is always necessary to adjust the Aand Aof Front-VABI to meet the requirements for the πwhen performing the parameter design. Since the focus of this paper is not on the selection of the π, the above comparative calculations are given the same Aand Afor each method to analyze the effect on the ACE performance due to the difference of the models.
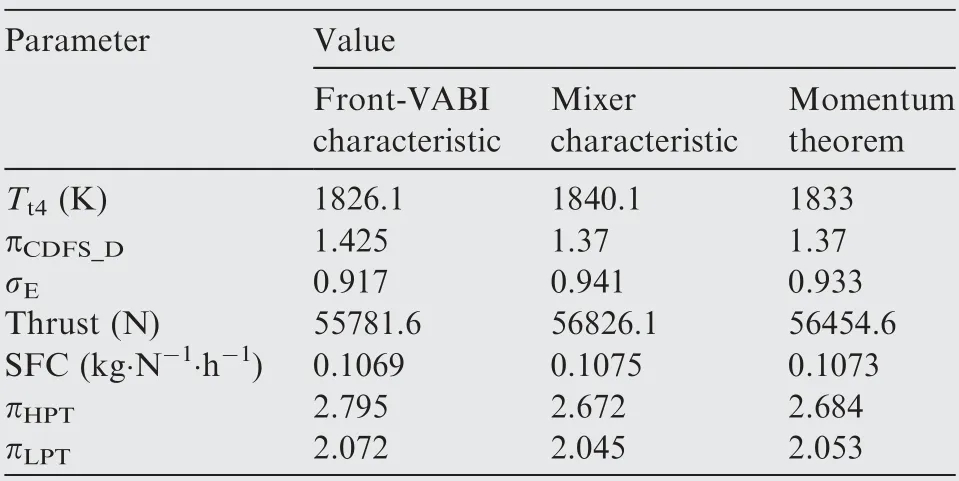
Table 5 Comparison of ACE design point performance obtained by different Front-VABI calculation methods.
It is found that with the same Front-VABI design geometry state, the ACE design point performance calculated using Front-VABI characteristic has a lower T, higher π,and lower σcompared to the thermodynamic methods.
The reason for the above results is due to the change in the Front-VABI performance calculation method,which results in a higher πfrom the matching calculation, as well as an increase in the Lrequired due to the unchanged π(HPC design pressure ratio).At the same time,lower σmakes the Front-VABI outlet total pressure lower, i.e. the total pressure of Rear-VABI outer inlet airflow is lower. To keep the mixing loss of Rear-VABI at a low level, it should be ensured that the total pressure of the inner and outer inlet airflow is approximately equal, so that the total pressure of Rear-VABI inner inlet airflow shall decrease, which leads to an increase of πand π. Since Land Lremain unchanged, Tneeds to be lowered to reduce T(LPT inlet total temperature) and thus ensure the power equilibrium of the low-pressure rotor.
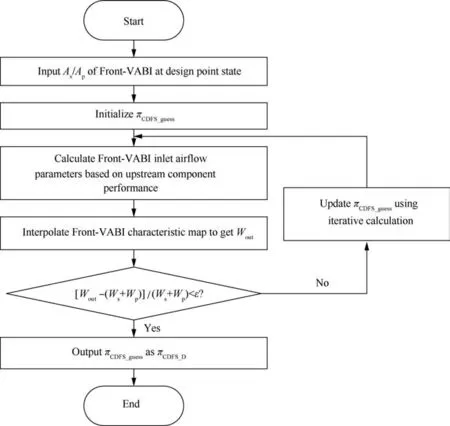
Fig. 16 Flow chart for determining πCDFS_D using Front-VABI characteristic.
The result also shows that the difference in σdoes not affect the value of πwhen the thermodynamic method is used. The reason for this is that in thermodynamic method,the calculation of the static pressure equilibrium at mixing cross-section (which determines the π) and the mixing pressure loss calculation are two completely independent calculation processes. In other words, regardless of the given Front-VABI mixing loss,the thermodynamic method can only match one π,which means the thermodynamic method cannot simulate the influence of the different designs of Front-VABI on π. While in the Front-VABI characteristic method,the solution process is carried out to calculate the performance of the entire Front-VABI component, and if the design of the Front-VABI changes, then the corresponding characteristic map will also change,thus affecting the πobtained from the matching calculation.
5.1.3. Comparison of off-design point performance
Based on the ACE design point performance obtained in the previous section, this section will calculate the performance comparison of ACE under the main operating conditions and Front-VABI geometry adjustment conditions in triple bypass mode.
The selected ACE operating conditions are ground test(0 km, Ma = 0), subsonic cruise (11 km, Ma = 0.8), supersonic cruise (11 km, Ma = 1.5), and steady-state condition of mode transition.The steady-state condition of mode transition refers to an ideal steady-state condition of the ACE before or after the transition between triple bypass mode and double bypass mode, which requires all variable geometries to be the same except MSV,while the total air mass flow of ACE is basically the same before and after the mode transition.The obtained performance comparison is shown in Table 6.
It can be found that the operating state of Front-VABI is basically unchanged under several common operating conditions of triple bypass mode, and the relative deviations of several calculation methods are basically the same as the relative deviations of the ACE design point performance.However,for the steady-state condition of mode transition, the Terror obtained by the two approaches of the thermodynamic method is more than 40 K.The σerror obtained by the mixer characteristic method reaches 16.1%.In this state,to avoid large fluctuation of CDFS mass flow at the moment of mode transition,the variable geometries of ACE need to be adjusted so that the mass flow of the second bypass is as low as possible under the premise of stable work, thermodynamic method cannot simulate such condition accurately.
Fig.17 gives the variation trends of ACE performance with Front-VABI geometry adjustment obtained by different methods at ACE design point condition. It can be found that the variation trends of ACE performance obtained by different methods are almost the same.Also,the performance deviation at different A/Ais almost the same as the design point performance deviation.
In summary of the above calculation results, it can be considered that under the common working conditions of triple bypass mode, the thermodynamic methods could basically simulate the effects of changes in the inlet and outlet airflow parameters and adjustment of the adjustable mechanism on Front-VABI performance, among them, the momentum theorem method is more accurate. However, for the mode transition condition, thermodynamic method cannot accurately describe the performance of Front-VABI and ACE.
5.2. Duct mode
Currently,there are two main thermodynamic methods for calculating the pressure loss of Front-VABI in duct mode.
One method is to ignore the Front-VABI’s complex shroud shapes at the intersection of two bypass ducts, and calculatethe total pressure loss due to the friction loss of each duct using Eq. (30), which is referred to in this paper as thermodynamic method 1.
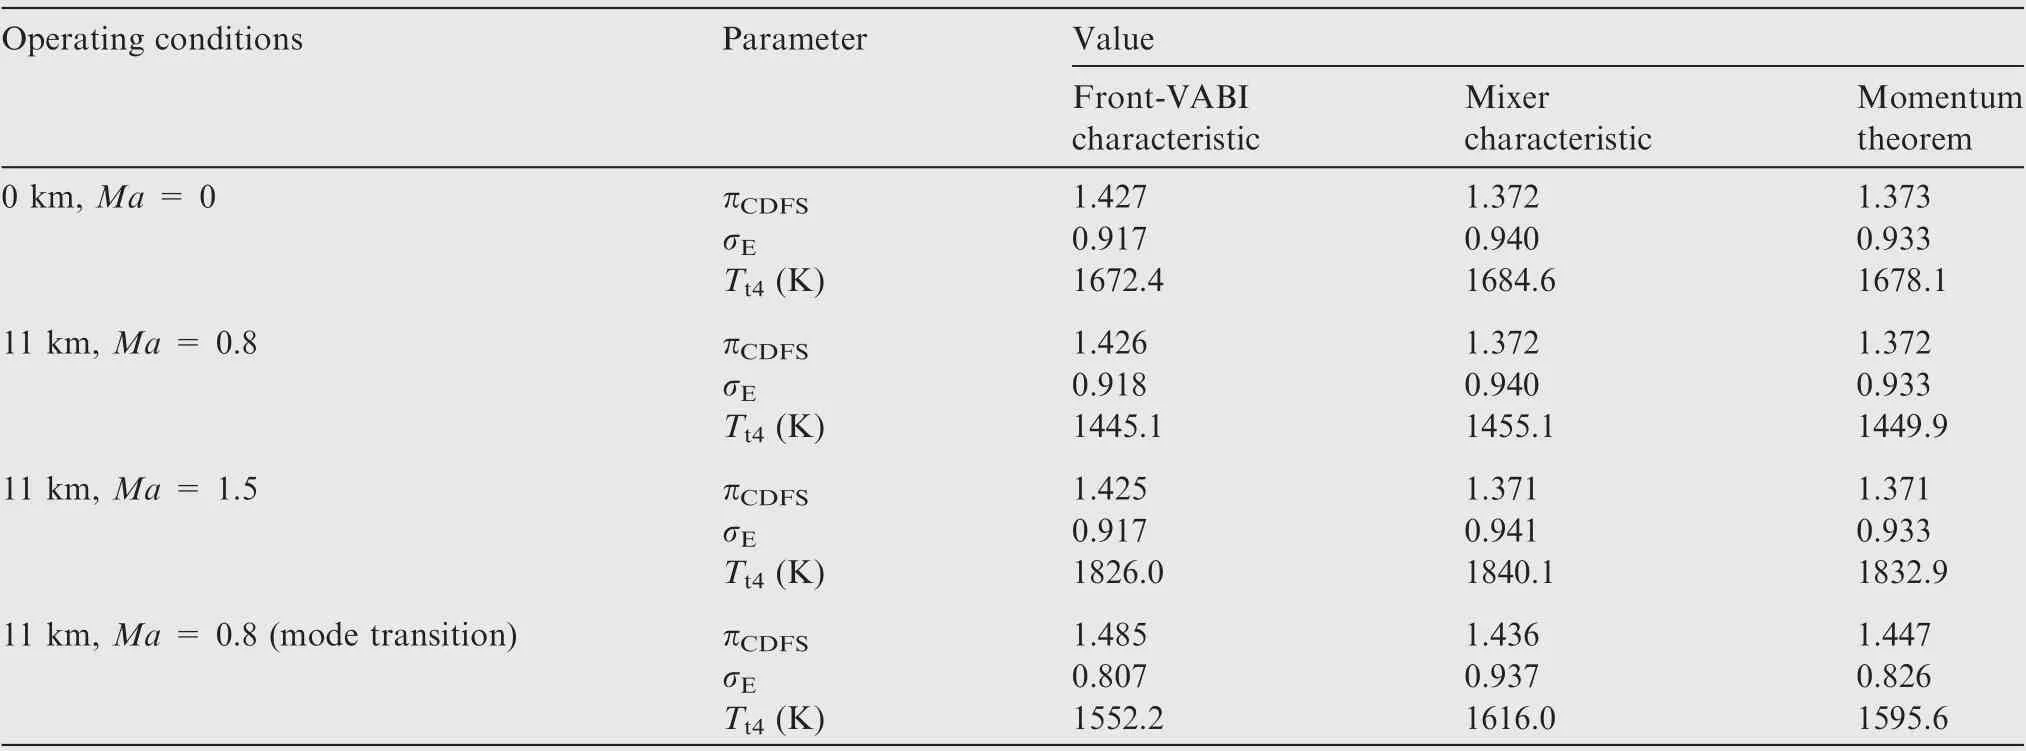
Table 6 Comparison of ACE off-design point performance at triple bypass mode.
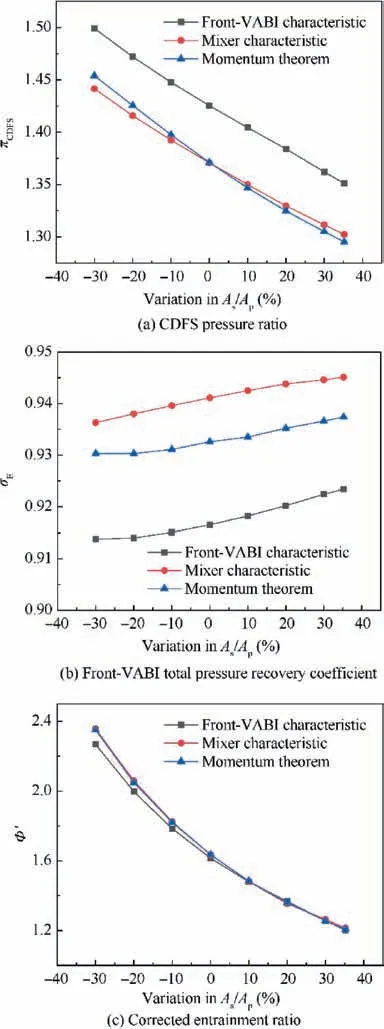
Fig.17 Variation trends of ACE performance with Front-VABI geometry adjustment obtained by different methods at ACE design point condition.
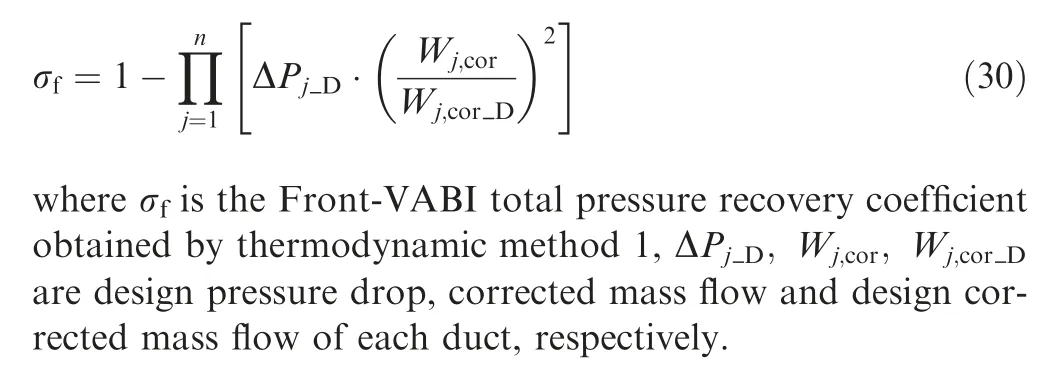
Another method is based on the thermodynamic method 1,using Eq. (31) to calculate the local loss caused by the sudden expansion of area at the intersection of two bypass ducts and the friction loss of each duct,which is referred to in this paper as thermodynamic method 2.

where σis the Front-VABI total pressure recovery coefficient obtained by thermodynamic method 2, ρis the density of the airflow at the first bypass outlet.
Fig. 18 gives a comparison of the Front-VABI total pressure recovery coefficients in duct mode obtained by several methods.According to the calculation in Section 3.4.2,adjusting the first bypass outlet area to the maximum will always have a smaller total pressure loss, so only the total pressure loss in this condition is compared here.
For the performance comparison of ACE at double bypass mode, three operating conditions were selected in this paper,which are supersonic cruise (11 km, Ma = 1.5), high Mach number condition (11 km, Ma = 2.0) and steady-state condition of mode transition. The obtained performance comparison is shown in Table 7.
It can be found that the σobtained by thermodynamic method 1 in both high Mach number condition and mode transition conditions are severely high, which hardly reflects the real component performance. To maintain the static pressure equilibrium at the Rear-VABI mixing section, π,πand πobtained by matching calculation is low, and Tobtained by matching calculation is high to maintain the power equilibrium of rotors. The calculation results obtained by thermodynamic method 2 are less different from those of the Front-VABI characteristic, except for σis slightly high in mode transition condition, resulting in lower πobtained by matching calculation.
Based on the above results, it can be concluded that the thermodynamic method that takes into account the local losses of the area sudden expansion can better simulate the Front-VABI performance in duct mode.
6. Conclusions
A de-coupled method based multi-fidelity simulation was presented to construct the coupling calculation model between the (2-D) Front-VABI CFD model and the (0-D) ACE overall performance model. The form of Front-VABI characteristic and its matching calculation method have been determined. Through the research, some useful conclusions are obtained:
(1) In ejector mode, the Front-VABI is in a fully ejected state at all ACE operating conditions and can be considered as an individual component in the ACE performance model.
(2) By correcting the inlet total temperature ratio of Front-VABI, a set of approximate characteristics that can calculate the performance of Front-VABI in various states can be obtained through few CFD calculations, the error of the characteristic within the ACE common operating conditions is less than 1.2%.

Table 7 Comparison of ACE off-design point performance at double bypass mode.
(3) In ACE design point performance calculations,the thermodynamic method cannot take into account the effect of Front-VABI pressure losses on CDFS design pressure.
(4) When ACE operates in the common conditions of the triple bypass mode,thermodynamic methods have small performance deviations and can reflect the effect of changes in operating conditions and adjustment of Front-VABI on its performance. However, the performance deviations of the thermodynamic methods are relatively large in mode transition condition.
(5) Thermodynamic method that takes into account the local losses of the area sudden expansion can better simulate the Front-VABI performance in duct mode.
As an iteration-free,fast multi-fidelity method,this method requires only a small number of high fidelity calculations to provide an accurate Front-VABI performance model for ACE parameter design and performance analysis.
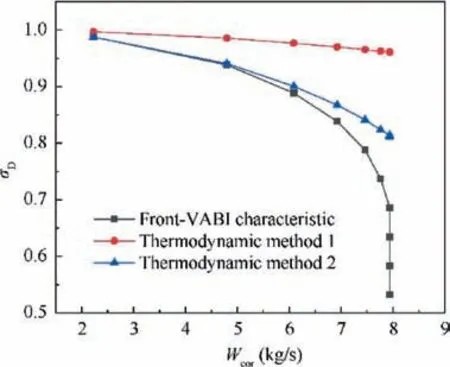
Fig. 18 Comparison of Front-VABI total pressure recovery coefficient in duct mode obtained by several methods.
In future work, this method can be further developed for the other variable geometry components of the ACE such as MSV, Rear-VABI and nozzle. Multi-fidelity simulations can be used to obtain matching performance features of the variable geometry components in various structure forms, which,in combination with the ACE overall performance analysis,can be used to explore the most appropriate structure form of variable geometry components for different ACE design requirements. At the same time, since high-fidelity model allows more accurate consideration of the influence of geometry design parameters on the component aerodynamic performance, one possible research direction is to develop a distributed platform based multi-fidelity optimization of ACE’s overall performance and control law that takes into account the detailed design of components. Furthermore, the structural strength limitation of the components and the robust design for uncertainty in component performance can also be introduced into consideration.
The authors declare that they have no known competing financial interests or personal relationships that could have appeared to influence the work reported in this paper.
s
This research was funded by National Natural Science Foundation of China (Nos. 51776010 and 91860205), National Science and Technology Major Project, China (No. 2017-I-0001-0001).
 Chinese Journal of Aeronautics2022年4期
- Chinese Journal of Aeronautics的其它文章
- An automatic isotropic/anisotropic hybrid grid generation technique for viscous flow simulations based on an artificial neural network
- Optimization design of airfoils under atmospheric icing conditions for UAV
- Pressure distribution feature-oriented sampling for statistical analysis of supercritical airfoil aerodynamics
- Recent progress of machine learning in flow modeling and active flow control
- Design method of optimal control schedule for the adaptive cycle engine steady-state performance
- Using tandem blades to break loading limit of highly loaded axial compressors
