Investigation of pressure wave behaviors in the rotational speed effects on a pressure-exchange wave rotor
Shining CHAN, Huoxing LIU, Hang SONG, Fngchao LI,Chongwn JIANG, Zhnxun GAO
a Aircraft & Propulsion Laboratory, Ningbo Institute of Technology, Beihang University, Ningbo 315800, China
b National Laboratory for Computational Fluid Dynamics,School of Aeronautic Science and Engineering,Beihang University,Beijing 100083, China
c Research Institute of Aero-Engine, Beihang University, Beijing 100083, China
d AVIC CAPDI Integration Equipment Co., Ltd., Beijing 102206, China
e Aero Engine Academy of China, Beijing 101300, China
KEYWORDS Experimental test;Pressure exchange;Pressure measurement;Rotational speed;Unsteady pressure wave;Wave rotor
Abstract A wave rotor is suitable for compact and efficient pressure-exchange between gas flows.This work measured the circumferential pressure distribution of the rotor/stator interfaces and utilized a CFD method to simulate the unsteady pressure waves. The experimental and CFD results showed some slopes in the circumferential pressure distributions,and the slopes indicated the traces of specific unsteady pressure waves.Such traces varied regularly if the rotational speed varied within a range from -11% to +11% off the baseline value, but they were seriously disturbed if the rotational speed varied by -45% from the baseline value. It verified that a pressure wave in a wave rotor tended to keep its pressure ratio and propagation velocity unchanged if the rotational speed varied by a small extent, and that the pressure wave could not keep its propagation patterns if the rotational speed varied by a large extent. Because of the pressure wave behaviors, the wave rotor demonstrated specific regulations of the rotational speed effects on its operational states.
1. Introduction
A pressure-exchange wave rotor undertakes compression and expansion processes of a thermal cycle.It increases the pressure ratio of a gas turbine and thus enhances the performance.Various research has verified the feasibility and potential benefit of a pressure-exchange wave rotor to a gas turbine engine, especially to a small turboshaft engine.Besides, a pressure-exchange wave rotor is also beneficial to a diesel engineor a refrigerator.A typical pressure-exchange wave rotor is shown in Fig. 1(a). It consists of a rotor and two stators. There are four ports in the stators. Two of them are the inlets, and the other two ports are the outlets. The ports are in a Through-Flow (TF) configuration. They absorb and export two gas-flows. One gas-flow at high pressure expands in the rotor as it touches and compresses the other gas-flow at low pressure in the rotor. The mechanisms of the compression and expansion in a pressure-exchange wave rotor are about the unsteady pressure waves (Fig. 1(b)), as various research has studied.The compression work or expansion work in a pressure-exchange wave rotor is done by the unsteady pressure waves instead of the rotor or any machine.This is essentially different from conventional turbomachinery.As a result,the contribution of rotation to a pressure-exchange wave rotor is essentially different from that to turbomachinery,too. The rotational speed effects on a pressure-exchange wave rotor is special and important.
There were a lot of research and discussion on potential advantages about the rotational speed of wave rotors. Kentfield summarized several advantages of pressure-exchange wave rotors over turbomachinery such as none-surging characteristics in his report.A Reverse-Flow (RF) pressureexchange wave rotor named the Comprex® was applied to the diesel engine supercharger commercially in 1980s. Berchtold and Mayer’s report on the Comprex® summarized the characteristics that the Comprex® helped the engine to keep its torque approximately constant over a wide engine speed range, and that the pressure of the compressed gas raised as fast as the increase of the temperature of the high-pressure inlet of the Comprex®.Such characteristics meant a rapid response to operational transients of the rotational speed or the inlet temperature, which was also a typical advantage.These advantages were relevant to the rotational speed effects at off-design operations. Published research studied performance and internal flow patterns of pressure-exchange wave rotors.The research on pressure-exchange wave rotors developed experimental methods and CFD methods for wave rotors, and the results included typical effects of rotational speed on the performance of different kinds of wave rotors in different conditions.
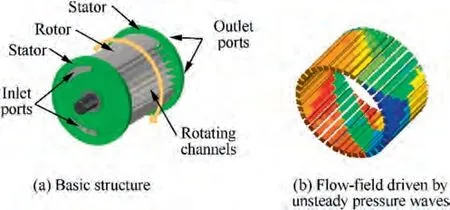
Fig. 1 Schematics of a typical four-port wave rotor pressure exchanger.
After 2010, some publications on pressure-exchange wave rotors payed more attention to the rotational speed effects,and CFD simulations provided more and more details of the flow-fields in different types of wave rotors for investigation on the flow mechanisms.Recent research of Smith et al.and Mataczynskiincluded results of some typical regulations of the rotational speed effects on the compression and the expansion ratios of RF pressure-exchange wave rotors. Among the experimental results of a full-scale Comprex®and the CFD results of a scaled pressureexchange wave rotor,a variation of the rotational speed from 9420 r/min to 12960 r/minor a variation from 6000 r/min to 8000 r/mincaused rather small variations of the pressure ratios, but the variations of the massflow rates were significant. Tu¨chler and Copelandrecently published experimental research on a wave rotor turbine. A wave rotor turbine was based on a TF four-port pressure-exchange wave rotor, but its rotating channel walls were curved for shaftpower extraction. Jagannathand Tu¨chleret al. developed design methods of wave rotor turbines.The experimental work concluded that the shaft power showed little sensitivity to the rotational speed variation.In all,different regulations of the extents of rotational speed effects have been found, and they correspond to different wave rotors in different operational conditions.After all, the fundamental mechanisms in the pressure-exchange wave rotors are known as common unsteady pressure wave behaviors,so dedicated investigations of the pressure wave behaviors in a pressureexchange wave rotor would help to look into some fundamental mechanisms in the rotational-speed effects. Experimental results would contribute to the dedicated investigation on the rotational-speed effects. This work aims at such investigation.
In this work, we refined an experimental method of a TF four-port pressure-exchange wave rotor that we would refer to as a wave rotor for clarity hereinafter. The axial distances between the static pressure taps and the rotor/stator interface were within 5 mm.To the authors’knowledge,this is the shortest distance in published wave rotor experiments, which minimizes possible distortion of the flow-field from the rotor/stator interfaces. It helped to detect the traces of unsteady pressure waves on the rotor/stator interfaces. The CFD simulations provided more details of the unsteady pressure wave behaviors. Combination of the experimental and CFD results concluded regulations of the rotational-speed effects on the operational states, and explained possible mechanisms based on the unsteady pressure wave behaviors.
2. Experimental method
2.1. Experimental rig
In the experimental research, the wave rotor must be controlled and tested independently to demonstrate the effects of the rotational speed. Moreover,the measurement on the wave rotor must illustrate vivid traces of the unsteady pressure waves.For that purpose,we refine the wave rotor experimental rig as shown in Fig.2 and Fig.3.The core of the experimental rig is a four-port TF wave rotor.The rotor segment and bearings of a Comprex®are used in this experimental rig.The stators of the wave rotor are designed so that the port-timings match the corresponded motions of the unsteady pressure waves. The wave rotor is designed for a compression ratio of about 2.1.The design of the wave rotor went through analytic modelling, one-dimensional transient CFD simulation and experimental validation on the design-point operation, which was elucidated in a previous publication.The basic parameters of this wave rotor are compared with those in some typical published experimental research in Table 1.
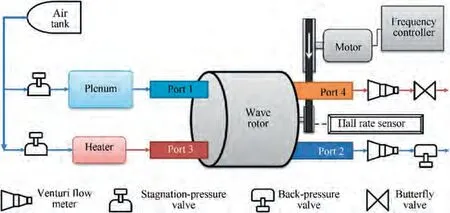
Fig. 2 Schematic diagram of wave rotor experimental rig system.
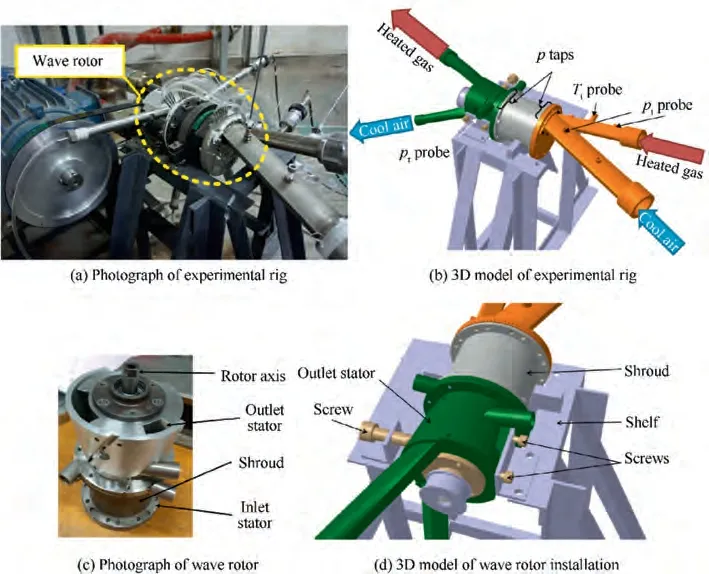
Fig. 3 Wave rotor experimental rig.
The definition of the non-dimensional channel opening time τis as follows:
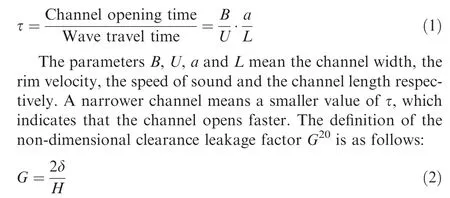
The parameter δ means the clearance gap between the rotor and a stator, and H means the channel height. A smaller G value indicates a smaller clearance gap and thus less leakage through the gap. A smaller τ or G value makes the channel approach a one-dimensional case.
The rotor is driven by an electric motor via a belt,as shown in Fig. 2 and Fig. 3. The motor is controlled by a frequency controller, and it can keep the rotation speed stable in each experimental operation. The four ports of the wave rotors are numbered in Fig. 2. In the experimental rig, low-pressure air enters the wave rotor through Port 1 at atmospheric temperature, goes through the wave-rotor-internal compression,and then leaves it through Port 2. Another independent air flow goes through an electric heater and gains high tempera-ture to serve as the combusted gas in an engine. It enters the wave rotor through Port 3,expands and leaves it through Port 4.The two gas-flows are supplied by the same air tank but the pipelines are individual,as shown in Fig.2.There is a valve in the pipeline of each port of the wave rotor.The valves control the stagnation pressure of each inlet and the ambient pressure of each outlet of the wave rotor independently. The absolute pressure at Port 1 or Port 4 is a little higher than atmosphere,and the absolute pressure at Port 3 or Port 2 is about 2 atm(1 atm=101325 Pa). The heater heats the air flow through Port 3 at about 425 K and stabilizes the temperature with feedback control. The temperature value or the specific heat ratio of the air flow through Port 3 is not similar to that of combusted gas, yet the aerodynamic mechanisms in such air flow are similar to those in the combusted gas. In all, this experimental rig is capable of fully controlling all the essential aerodynamic conditions at the four ports except that the temperature at Port 1 is always atmospheric. This capability satisfies the need of the experiments on this rig.
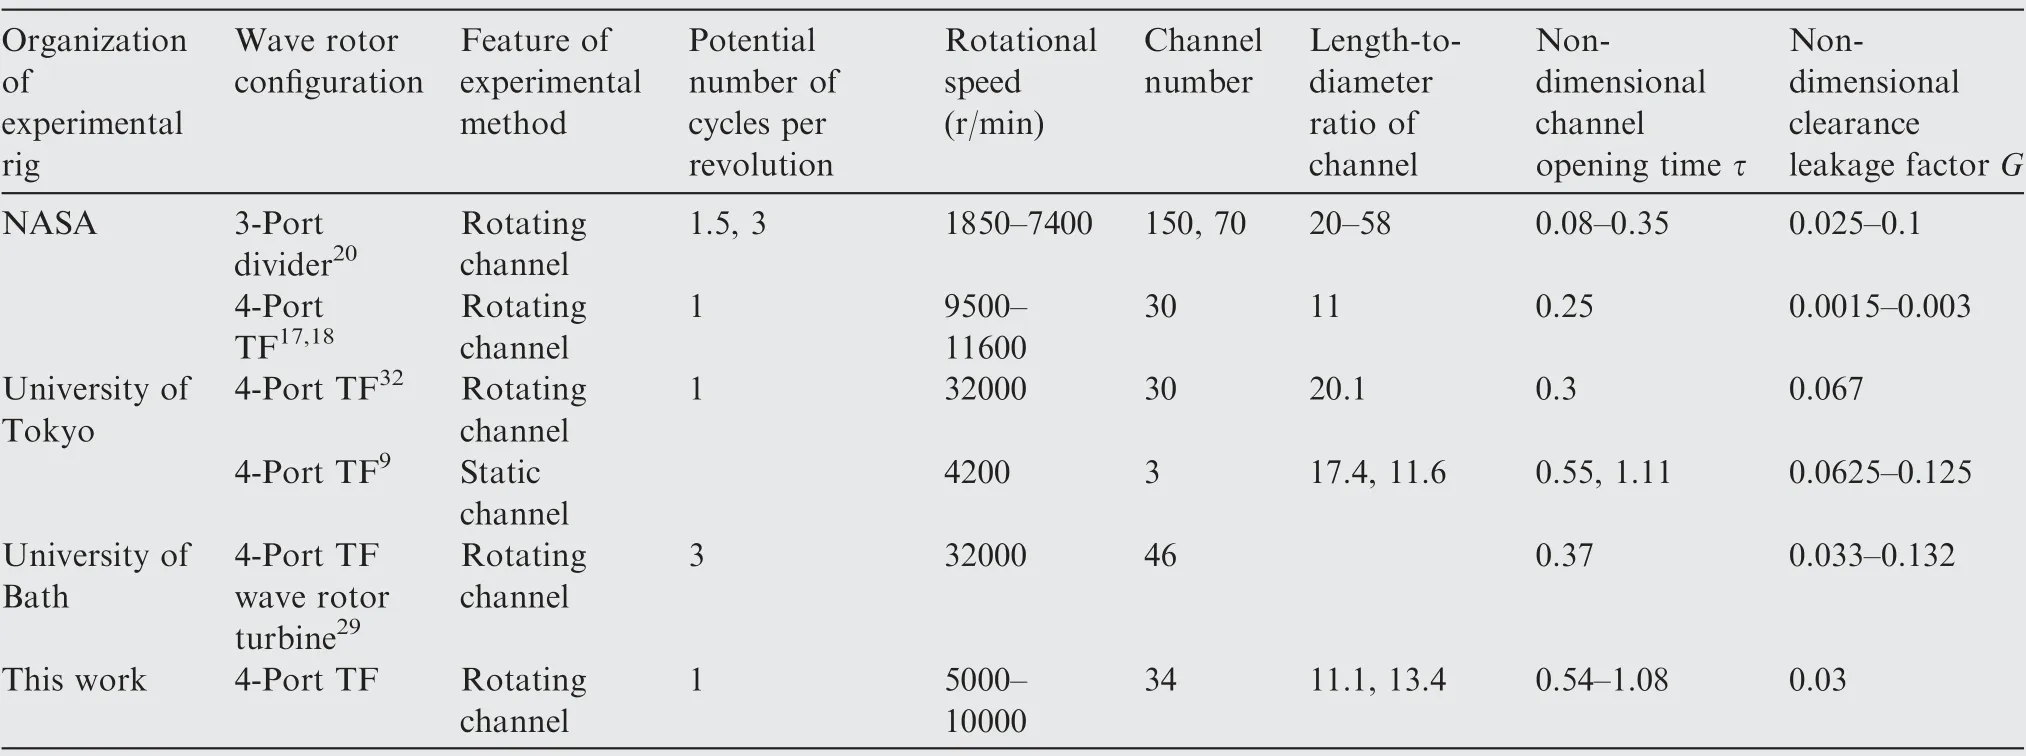
Table 1 Comparison of wave rotor pressure exchangers in some typical experimental rigs.
2.2. Measurement for rotor/stator interfaces and operational conditions
The unsteady pressure wave behaviors in the rotating channels determine the basic phenomena of wave rotors including the special effects of rotational speed. It is difficult to install any kind of instrumentation to a rotating channel, but a staticchannel experimental rig makes such instrumentation feasible.A static-channel experimental rig of wave rotorsfixes the channels for measurement but rotates the ports in the opposite direction so that the relative motion between the rotating channels and the stators resembles the case in a real wave rotor. However, the static-channel experimental rigs make it difficult to test the flow-field in the ports or the basic operational-state parameters of the wave rotor, so this work utilizes the conventional way of the rotating-channel experimental rig.In this way,the rotor/stator interfaces at both ends of the rotor are critical. Firstly, a rotor/stator interface is feasible to measure through the static ports. Secondly, the unsteady pressure waves reach the ends of a channel and reflect there, so the circumferential pressure distribution at a rotor/stator interface indicates the traces of the incoming unsteady pressure waves. Therefore, the measurement instrumentation is set to approach the rotor/stator interfaces in this experiment.
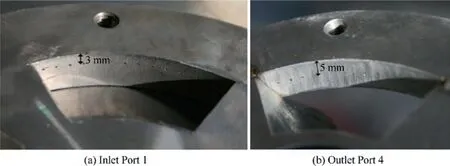
Fig. 4 Photgraph of axial location of pressure taps in an inlet or outlet port.
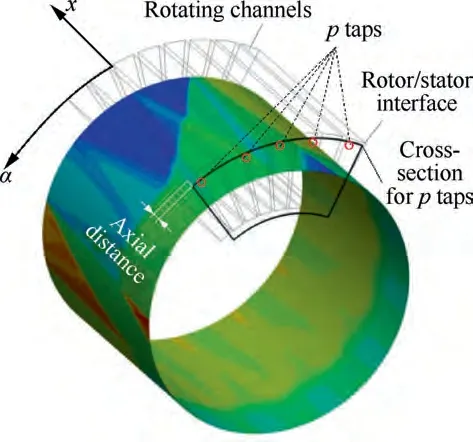
Fig. 5 Schematics of port and test points (only one port, a few channels and a few pressure taps are illustrated in the schematics,but others are omitted for clarity).
Surface pressure taps measure the circumferential staticpressure distribution. The pressure taps align in a row on the top of the port, as shown in Fig. 4 and Fig. 5. The axial distance between the pressure taps and the rotor/stator interface is 3 mm for the inlet ports and 5 mm for the outlet ports, as shown Fig.4 and Fig.5.The axial distance is even smaller than the width of a rotating channel at the top of the channel. It minimized the possible distortion of the flow-field in such a short distance.There were a number of pressure taps in a port to make a satisfactory spatial resolution of measurement.Therefore, the practically measured pressure distribution would revivify the flow-field at the rotor/stator interface and demonstrate the traces of the unsteady pressure waves. The diameter of every pressure tap on the flow passage surface is 0.5 mm. As shown in Fig. 3, there is a manifold adjacent to an inlet/outlet port. The length of each manifold is approximately equal to the length of the rotor, and the centroid of the manifold is designed tangential to the flow velocity vector through the port, in order to minimize possible influences of the upstream or downstream flows on the flow field from the rotor/stator interface.
A summary of the temperature and pressure instruments for the inlet and outlet ports is illustrated in Table 2.The stagnation pressure(p),the static pressure(p),the stagnation temperature (T) and the rotational speed (n) are measured to record the operational conditions of the wave rotor, and the instrumentations are illustrated in Fig.3(b).A stagnation pressure probe is installed at the centroid of the manifold of each port and aims against the incoming flow direction. A thermometer is installed at the centroid of the manifold of each inlet port. Aerodynamic calibration has calibrated the stagnation pressure probe and has proved that the thermometers are insensitive to the yaw angle and the pitch angle of the incoming flow. According to Fig. 3(b), the distance between the rotor/stator interface and a stagnation pressure probe or a thermometer is long, yet such distances are sufficient for measurement of the operational conditions. Downstream each outlet port, a Venturi flow meter is installed for the massflow rate( ˙m) measurement. The data reduction of a Venturi flow meter obtains the average value and the uncertainty of a massflow rate datum. A Hall rate sensor is installed for the rotational speed measurement, and the uncertainty of its normal results was 30 r/min.
2.3. Data acquisition and reduction
The monitoring and data acquisition are conducted with our in-house NI LabVIEWprograms. The sampling frequency is 1 kHz. The signals sent to the computer are voltage data.A mean value of every 500 samples is recorded. This is basically steady measurement. Steady measurement is ordinary in the research on turbomachinery rotors,and it have been utilized in the research on wave rotor experimentsincluding our previous work with this experimental rig.The relevant workshave validated that such steady measurement is feasible for the measurement of the pressure distribution or temperature distribution in the wave rotor ports, which is in the same way with this work. The data of the experimental results in this paper contain uncertainties that take the errors of the instruments and the standard deviations into account.A test is started after the start-up and the thermal equilibrium of the rig. The test time for an experimental operation is 60 s. Preliminary experimental operations have validated that this test time ensures stable and repeatable operations of the wave rotor.
3. CFD method
A CFD method is utilized in this work for investigation on the flows in the wave rotor channels. This work focuses on the flow-field driven by the unsteady pressure waves, and a onedimensional transient CFD method is suitable for this work.This CFD method was based on the commercially available FLUENT® 15 software. In this CFD method, combustedgas is represented by heated air, which simulates the experiments. All the fluid is treated as perfect gas with a constant specific heat. The leakage, heat conduction or the finite opening or closing time of a rotating channel is not considered.The solver is a coupled,transient,double precision solver.The simulated domain is a channel of the experimental rig,and it goes through the entire cycle of the wave rotor in the transient numerical simulation. The boundary condition of the simulated domain switches from a wall to an inlet or an outlet boundary at certain port-timings,which simulates the opening and closure of the channel in the experiment. The boundary conditions of inlet ports are the stagnation pressure and stagnation temperature parameters. The boundary conditions of outlet ports are static pressure parameters.The boundary condition values match the experimental conditions of the inlet or outlet ports. Since there is a single static-pressure value of the outlet-port boundary condition, the average value of the experimental results of static pressure distribution is used as the boundary condition value. The time step of the transient simulation is 1×10s. The grid resolution is 2000 per domain. The authors’ previous publicationelucidated the details of this CFD method including the validation of the grid-independence and a comparison between the CFD results and the design-point experimental results.

Table 2 Summary of temperature and pressure instruments.
4. Results and discussion
The purpose of this work is to study the rotational speed effects on the wave rotor operational states and to analyze the role that the unsteady pressure waves play in such effects.The experimental operations were varied via manipulations on the rotational speeds with the valves fixed. The investigated rotational speeds are 5000, 8000, 9000 and 10000 r/min. The operation at 9000 r/min was approximately the design point of the wave rotor as the baseline rotational speed. This value of the rotational speed was lower than common rotational speed of conventional turbomachinery in the same size with this wave rotor. The operational points at 8000 r/min and 10000 r/min would demonstrate a small variation by -11%or +11% from the baseline rotational speed. The operational point at 5000 r/min would demonstrate a large variation by-45% from the baseline rotational speed. The conditions of different experimental operations are in Table 3.
4.1. Effects of rotational speed on operational states
4.1.1. Variation of operational states
The operational state of a wave rotor is indexed with the compression and the expansion pressure ratios with reference to massflow rates.The pressure ratios are the ratios of stagnation pressures. The pressure ratios and the massflow rates of the wave rotor in the experiments are illustrated in Fig.6.According to the trends of the curves, the compression ratio and the massflow rate of the compressed air decrease with the increase of the rotational speed. The monotonicity of the compression ratio (π=p/p) fits the recent publication where the investigated wave rotor turbines performed a higher pressure ratio at a lower rotational speed.Such monotonicity is just opposite from a conventional turbomachinery compressor.As common knowledge of turbomachinery, the compression ratio of a conventional turbomachinery compressor tends to increase with the increase of the rotational speed because the work of the blade increases.The working principles are different in a wave rotor since the unsteady pressure waves do the work. In expansion, the massflow rate of the expanded gas increases with the increase of the rotational speed, which is in the same trend with a conventional turbine. The expansion ratio (π=p/p) decreases with the increase of the rotational speed, which is opposite from a conventional turbine.In all,the rotational speed has very special effects on the operational states of the wave rotor.
In spite of the different trends of the different parameters with the variation of the rotational speed, a common issue is that the variation ranges of all the parameters in Fig. 6 are rather small as the rotational speed varied by 50%.The variation ranges are calculated and shown in Table 4, where the rotational speed varies by 5000 r/min throughout the experiments. According to Table 4, the pressure ratio or massflow rate data deviate from the baseline data by 15.4% at most for the lowest rotational speed, 5000 r/min. However, a small variation by -11% or +11% from the baseline rotational speed changes the pressure ratio or the massflow rate of the wave rotor by -3.3% at most. The effects of the variation trends in Fig. 6 would be even less significant since the variation ranges are so small. In all, the rotational speed effects on the pressure ratios and the massflow rates are apparent if the rotational speed varies by -45% from the baseline operation, but the rotational speed effects are rather small if the rotational speed varies within±11% off the baseline value.The regulations about the extents of effects fits the recent research for different variation ranges of rotational speed.Such rotational speed effects are very different from conventional turbomachinery because turbomachinery are usually very sensitive to the rotational speed near the design-point.In addition, such rotational speed effects indicate that the change of the pressure ratio or the massflow rate does not follow the acceleration or deceleration of the rotor.It fits the discussions on the Comprex®about the fast response to variation of the rotational speed,and the reason of the fast response is possibly that the change of the pressure ratios is faster than the acceleration or deceleration of the rotor.

Table 3 Conditions of experimental operations.
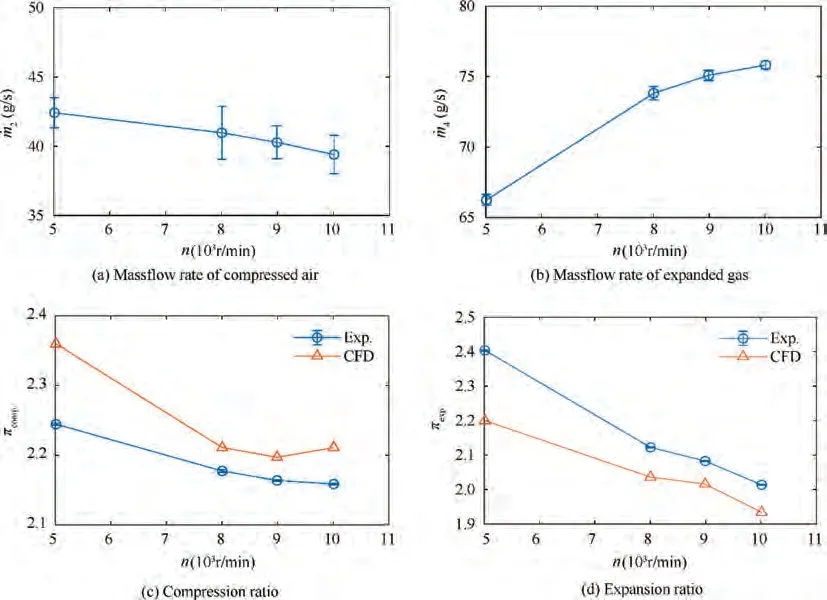
Fig. 6 Pressure ratios and massflow rates as functions of rotational speed.

Table 4 Variation ranges of pressure ratios and massflow rates.
4.1.2.CFD results of periodic flow fields at different operational states
While the experiments obtain the fundamental operational states and the critical regulations, the CFD simulation calculate the entire cycle of the unsteady flow in the rotating channel.A comparison between the periodic flow fields at different operations would show the fundamental difference in the unsteady pressure waves. After enough number of cycles in the numerical simulation,the unsteady flow converges in good periodicity. The flow field of the baseline operation at 9000 r/min is shown in Fig.7.The abscissa of Fig.7 is time(t)or the circumferential coordinate (α). The vertical coordinate of Fig. 7 is the axial coordinate of the wave rotor (x). The arrow-lines in Fig.7 are traces of fluid particles in an x-α plane.According to the unsteady flow-field, the fluid is static at the beginning of each cycle, and it is pushed through an inlet or outlet port by the unsteady pressure waves. The operational state of the wave rotor depends on the flow fields between the inlet and the outlet ports.They are the flow fields between the low-pressure ports (Port 1 and Port 4) and the flow between the high-pressure ports (Port 3 and Port 2).
The flow fields of the operations at 5000,8000 and 10000 r/min are shown in Fig.8.The pressure distribution and the particle traces are full of fluctuations at 5000 r/min, as shown in Fig. 8(a), and it is obviously different from the other operations in Fig. 8(b), Fig. 8(c) or Fig. 7. As the previous paragraph elucidates, the 9000 r/min operation in Fig. 7 is the baseline operation where the port-timings matches the propagation of an unsteady pressure wave the best.The operation at 5000 r/min diverges from the baseline rotational speed too much, so the port-timings mismatch the propagation of the pressure waves too seriously.A mismatched opening or closure of a port causes an additional pressure wave, and the various additional pressure waves cause the additional fluctuations in pressure distribution or particle traces, as shown in Fig. 8(a).Moreover, there are regional backward flows near the Port 3 and the Port 4 in Fig. 8(a). The numerical errors in the backward-flow regions at the ports would be much larger than the acceptable numerical errors in the regular forward-flow regions,so the details of the 5000 r/min operation are not analyzed in this work. In spite of that, comparison between the CFD results in Fig. 7 and Fig. 8(a) preliminarily demonstrate that the pressure wave behaviors at 5000 r/min are seriously distorted. It is a possible reason of the large variation of the pressure ratios and the massflow rates from the baseline operation.
Comparison among Fig.8(b),Fig.8(c)and Fig.7 indicates some differences in the flow-fields of the operational states at 8000, 9000 and 10000 r/min. However, such differences are rather small. It fits the small variations of the operational states in such range of rotational speed, as Table 4 illustrates.It indicates a range from 8000 r/min to 10000 r/min where the wave rotor keeps its pressure contours and its unsteady pressure wave patterns approximately unchanged. In other words, the range from 8000 r/min to 10000 r/min is an insensitive range where the operational state or the flow field of the wave rotor is insensitive to the rotational speed. Nevertheless,variation in the unsteady pressure wave patterns accumulates as the rotational speed keeps changing, and the operation at 5000 r/min performs a rather large variation. Therefore, the 5000 r/min operation is considered out of the insensitive range.For the CFD cases at 8000, 9000 and 10000 r/min, the details of such differences are too small in the global view on the periodical flow field, and thus, we investigate them in the partial view on either Part I or Part II (highlighted in Fig. 7 and Fig. 8) in the following discussions.
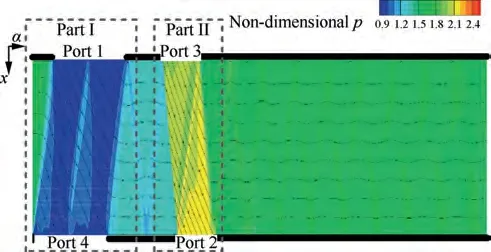
Fig. 7 Numerical results of periodic flow in wave rotor of baseline operation at 9000 r/min.
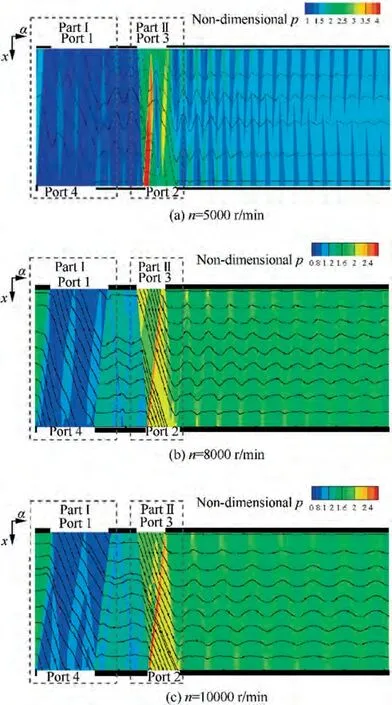
Fig. 8 Numerical results of periodic flow in wave rotor at different operational states.
4.2. Unsteady-pressure-wave behaviors in rotational-speed effects
4.2.1. Unsteady-pressure-wave behaviors in Part I between lowpressure ports
(1) Baseline pressure distributions at ports and traces of unsteady pressure waves
The circumferential pressure distribution in a port of a wave rotor is not uniform but contains increasing and decreasing slopes. The slopes would indicate the traces of unsteady pressure waves as they reflect at the rotor/stator interface. The flow-field between the lowpressure ports at the baseline operation is illustrated in Fig.9.Among the sub-figures,Fig.9(c)is the static pressure contours of the unsteady flow between the lowpressure ports, which represents the Part I in Fig. 7.The inlet port is on the top and the outlet port is at the bottom of Fig. 9(c). The other sub-figures in Fig. 9 are plots of the static pressure distributions in the ports.The CFD result of the circumferential pressure distribution in Port 4 is constant,and it is illustrated in Fig.9(d)for clarity.The abscissa of the sub-figures in Fig.9 is the circumferential coordinate in a port scaled by the span of the port.
Considering that the range of the pressure coordinates in Fig. 9(a) is smaller than that in Fig. 9(b), the range of pressure change in the experimental results is smaller than that in the CFD results. In other words, this CFD method has over-estimated the pressure range of an inlet port. The over-estimation of the CFD simulation is probably because of the transverse flows in a rotating channel or the gradual-opening effects as a rotating channel passes the edge of a port. The gradual-opening effects are widely studied.It generally exists in a wave rotor as long as the width of a channel is finite(Fig.5),and it results in some transvers flow in the channel. Centrifugal forces and Coriolis forces also induce transvers pressure gradients in a rotating channel, and drive some transverse flows in a channel.The gross effects of various transverse flows dampen the pressure gradients.The one-dimensional CFD simulation neglects such transverse flows because it has neglected the width of the rotating channels. That is a possible reason why the CFD results over-estimated the pressure ranges than the experiments.
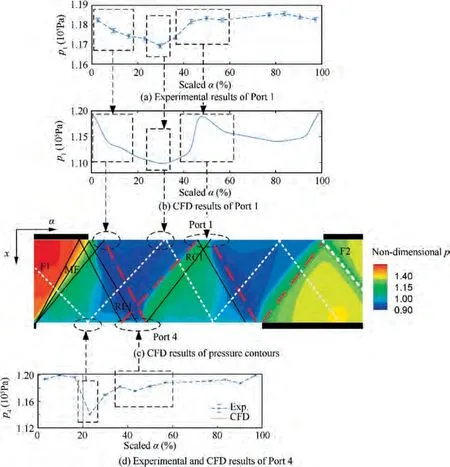
Fig. 9 Spatial flow-field of Part I.
Nevertheless, the CFD and the experimental results show some similar slopes of pressure distributions at Port 1, as the boxes in Fig. 9 highlight. The flow field between the low-pressure ports starts with the expansion fan ME.The flows are halted at both ends in the channel before the expansion fan ME drives the fluid toward Port 4. According to experimental results of Port 1(Fig.9(a)),there is a lasting decreasing slope of pressure in the range from about 0% to 20% of the scaled α, as the first box in Fig. 9(a) highlights. This box in Fig. 9(a) is aligned with the first box in Fig. 9(b) and a trace of the expansion fan ME at the rotor/stator interface in Fig. 9(c). The highlighted and aligned phenomena in Fig. 9(a) and in Fig. 9(b) validate that the combination of the experiment and the CFD simulation has detected the trace of the expansion fan ME in the wave rotor.The expansion fan ME originates from the opening of Port 4,diverges as it propagates upward,and reaches the top of the flow-field in Fig.9(c)before Port 1 opens.The opening of Port 1 splits the expansion fan ME into two parts when the ME reflects at the top of the flow-field in Fig.9(c).The left part of the expansion fan ME reflects at the wall before Port 1 opens, and the reflected wave is another expansion wave.The right part of the expansion fan ME reflects at the opened Port 1, and the reflected wave is a compression wave. Such reflections obey the principles in aerodynamics. The expansion wave and the compression wave form the combination wave RE1 towards the outlet port. It decreases the pressure at Port 4 temporarily and then increases it,as the second box in Fig. 9(d) highlights. After that, the combination wave RE1 reflects at the opened Port 4 where the incoming expansion wave turns to another compression wave and the incoming compression wave turns to another expansion wave, as shown by Fig. 9(c) and Fig. 9(d).The reflected waves form another combination wave RC1 whose left part compresses and right part expands.The wave RC1 propagates toward Port 1,and causes an abrupt increasing slope followed by a slight decreasing slope in the range from about 35%to 55%of the scaled α in either Fig. 9(a) and Fig. 9(b), as the third box in Fig. 9(a) or Fig. 9(b) highlights. In all, the pressure slopes at the rotor/stator interfaces are traces of unsteady pressure waves in the rotating channels, and the combination of the experimental and the CFD results outlines such traces.
Among the various slopes in pressure distribution,there is a fluctuation in Port 4.It is highlighted by the first box in Fig. 9(d). It indicates some interesting features of the unsteady pressure waves, too. The fluctuations are due to the reflections of a special pressure wave F1 which is outlined with white dashed lines in Fig.9(c).The pressure wave F1 originates from the closure of the former port in the previous loop of periodical flows (Fig. 7).The closure of the port does not perfectly match the arrival of an incoming pressure wave. As a result, an extra pressure wave F1 is triggered.It exists as a combination of a compression wave and an expansion wave, which forms a fluctuation. The global view in Fig. 7 shows how this pressure wave F1 forms and reflects backand-forth for several times in the wave rotor channel at the end of the periodical flow field. After the wave F1 reflects at the Port 4 (Fig. 9(d)), it goes on reflecting back-and-forth.The second box in Fig.9(a)is a possible trace of the wave F1.Besides,the mismatched closure of Port 2 triggers another extra pressure wave F2 in a similar way with the wave F1, as Fig. 9(c) shows.
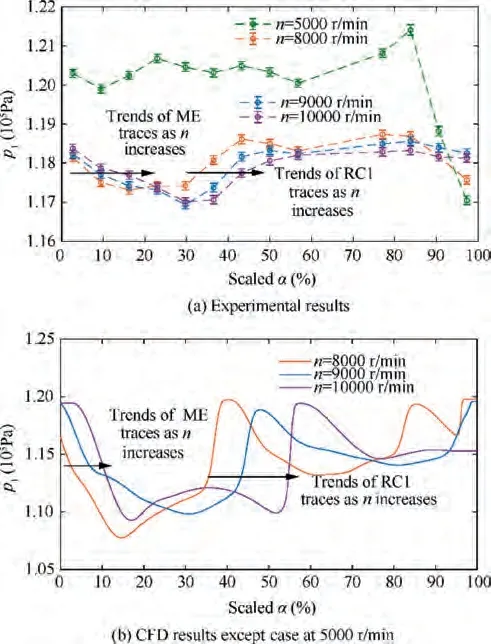
Fig. 10 Pressure distributions in Port 1 at different operations.
(2) Comparison on behaviors of unsteady pressure waves According to the experimental and the CFD results,the circumferential pressure distributions at the ports indicate the traces of the unsteady pressure waves in the rotating channels of the wave rotor.The pressure distribution in a port varies with the variation of the rotation speed in the experiments. The first pressure wave in either Part I or Part II (highlighted in Fig. 7 and Fig. 8) demonstrates the most typical behaviors in its trace at the rotor/stator interface, because the incoming flow of the first pressure wave is mainly static.The opening of Port 1 follows the first pressure wave ME as an expansion fan, so Port 1 is investigated for mechanisms in the rotational-speed effects, as shown in Fig. 10.As the experimental results in Fig. 10(a) illustrate, the pressure distribution in the 5000 r/min operation is distinct from the other operations.Besides,the CFD simulation of the 5000 r/min case is not comparable, as the discussions on Fig. 8 in the above paragraphs mention,so we only compare the cases at 8000, 9000 and 10000 r/min in the following discussions. In the curve of 8000, 9000 or 10000 r/min of either experimental and CFD results, there is a decreasing slope in the range from about 0% to 20% of the scaled α. It is the trace of the first pressure wave, the expansion fan ME,according to the discussions in the above paragraphs on Fig. 9. There is a clear abrupt increasing slope from about 30% to 50% of the scaled α in the curve of 8000,9000 or 10000 r/min.It is the trace of the pressure wave RC1. As Fig. 10(a) or Fig. 10(b) shows, the decreasing slope of the ME trace and the abrupt increasing slope of the RC1 trace switch to the right regularly as the rotational speed increases from 8000 r/min to 10000 r/min.The switching regulation is because of the pressure wave mechanisms.As the rotational speed increases,the rotating channel carries the pressure waves ME and RC1 further to the right until the wave reaches the rotor/stator interface, while the shapes of the pressure wave traces generally keep unchanged. Moreover, the distance between adjacent curves is larger in the RC1 traces than in the ME traces, as Fig.10(a) or Fig.10(b)shows.It is because the switching effect accumulates as the scaled α coordinate increases.
The switching regulation raises a hypothesis that the unsteady pressure wave may keep its propagation velocity approximately unchanged at the different rotational speeds. For verification of the hypothesis, the cases at 8000, 9000 and 10000 r/min are compared, as shown in Fig.11.The flow field in Fig.11 is in the partial view on Part I as highlighted in Fig.7.Note that the horizontal coordinate in Fig. 11 is time t instead of scaled α. A port covers a narrower range of time at a higher rotational speed, but different phenomena at the same time can be aligned with a vertical line in Fig. 11.
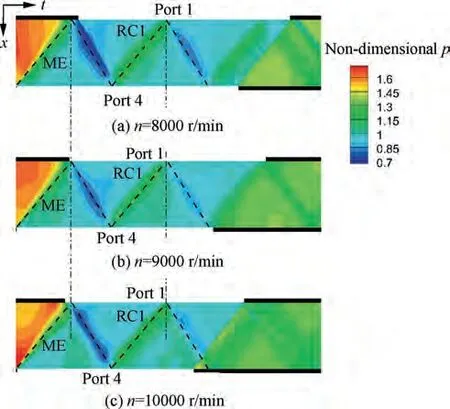
Fig.11 Comparison of unsteady pressure wave patterns between Port 1 and Port 4 at different rotational speeds.
The traces of the unsteady pressure wave ME are aligned with a vertical line in Fig. 11. It means that the first expansion wave ME arrives at the same time at different rotational speeds, although the port timing mismatches the arrival of the corresponded incoming pressure wave.The discussion on the pressure wave RC1 is similar. It approves the hypothesis on the unchanged pressure wave velocity for the unsteady pressure waves ME and RC1.
4.2.2. Unsteady-pressure-wave behaviors in Part II between high-pressure ports
(1) Baseline pressure distributions at ports and traces of unsteady pressure waves The pressure distributions at the high-pressure ports are shown in Fig. 12. The sub-figures are organized in the same way with Fig. 9. The slopes in pressure distributions of the experimental and the numerical results are similar, which validates the numerical simulations.Comparison between Fig. 9 and Fig. 12 shows a typical characteristic. That is, there are less slopes in pressure distributions in the high-pressure ports than those in the low-pressure ports. It means that the unsteady pressure waves between the high-pressure ports make fewer traces. It is mainly because there is not any reflection of the dominant pressure waves in the middle of Port 2 or Port 3 like the reflection of the wave RE1 or RC1. Another reason is that the high-pressure ports are much narrower than the low-pressure ports. The CFD results over-estimates the range of pressure distribution in Port 3, according to comparison between Fig. 12(a)and Fig. 12(b). Such over-estimation is possibly because of the transverse flows or the gradualopening effects, which is similar to the discussion on Fig. 9(a) and Fig. 9(b).
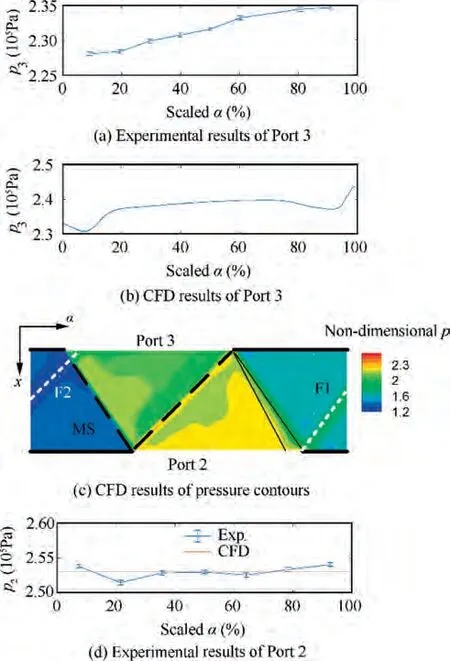
Fig. 12 Spatial flow-field of Part II.
(2) Comparison on behaviors of unsteady pressure waves The pressure distribution of Port 2 is investigated as rotational-speed effects, since the opening of Port 2 follows the arrival of the first shock wave MS between the high-pressure ports.The experimental results of pressure distribution in Port 2 is illustrated in Fig. 13. The CFD result of the static pressure distribution is constant for an outlet port and it cannot indicate any possible traces of unsteady pressure waves, so the CFD result is not investigated here. As the experimental results in Fig. 13 illustrate, the pressure level in the 5000 r/min operation is much higher than the other operations,and thus we only compare the cases at 8000, 9000 and 10000 r/min in the following discussions.The flow fields of the cases at 8000,9000 and 10000 r/min are shown in Fig. 14 with time as the abscissa.
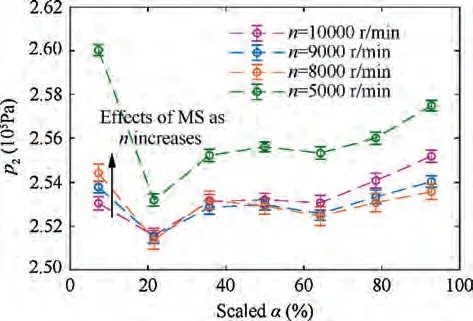
Fig. 13 Pressure distributions in Port 2 at different operations.
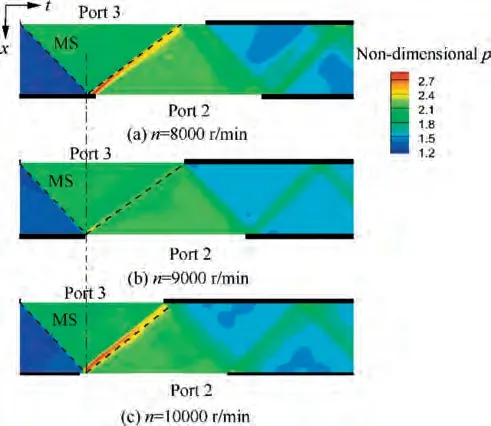
Fig.14 Comparison of unsteady pressure wave patterns between Port 3 and Port 2 at different rotational speeds.
The first unsteady pressure wave between the highpressure ports is the shock wave MS, according to Fig. 12 or Fig. 14. The arrivals of the shock wave MS at the rotor/stator interface in different cases are aligned with a vertical line in Fig.14.For the case at 9000 r/min,the opening of Port 2 matches the arrival the shock wave MS. At a lower rotational speed of 8000 r/min, the shock wave MS arrives at the rotor/stator interface earlier than the opening of Port 2, so it reflects at the wall,becomes another shock wave and compresses the fluid further until Port 2 opens. When Port 2 opens, the fluid in the channel is at a higher pressure than the outlet port, so an expansion fan originates and follows the reflected shock wave. Those sequenced phenomena cause the highest pressure, as the red contours show in Fig. 14(a). On the contrary, Port 2 opens too early at a higher rotational speed of 10000 r/min. The shock wave MS has not compressed the fluid in the channel when Port 2 opens, and the pressure in the channel is much lower than the pressure at outlet port. Therefore,a strong additional shock wave originates from the opening of Port 2 and propagates upstream. The additional shock wave drives a little fluid backward, and meets the incoming shock wave MS soon after it originates. After the two shock waves intersect, the additional shock wave compresses the fluid after the shock wave MS and makes the highest-pressure region in red(Fig. 14(c)), while the shock wave MS reaches the opened Port 2 soon, reflects as an expansion fan and makes the backward-flow forward. The description on the behaviors of the shock wave MS matches the trends of certain experimental data as the arrow in Fig. 13 shows. That is, the pressure in the left edge of Port 2 decreases with the increase of the rotational speed. At the low rotational speed (8000 r/min), the reflected shock wave of the shock wave MS makes the highest pressure in the left edge of Port 2.Note that the rotating channel with finite width may cover the space besides the left edge of Port 2 when it passes the edge.In this case,it enables the fluid within the width to interchange pressure levels by some extent, so the high pressure before Port 2 opens may raise the pressure after Port 2 opens in the experiments. At a higher rotational speed of the baseline operation (9000 r/min), the reflected shock wave is undistinguishable,so the pressure in the left edge of Port 2 is lower. At an even higher rotational speed(10000 r/min), it consumes the high pressure at Port 2 when it opens in advance,so the pressure in the left edge of Port 2 is even lower. The arrivals of the shock wave MS at the rotor/stator interface in different cases are aligned with a vertical line in Fig. 14, and it indicates that the propagation velocity of the shock wave MS is approximately unchanged at different rotational speed.Note that the propagation velocity of a shock wave is a function of different factors like its pressure ratio and the flow-dynamic properties of the incoming fluid.Those factors depend on the operational state of the wave rotor,which is a combined effect of the rotational speed and pressure ratios of the wave rotor. In the present results, the approximately unchanged propagation velocity of the shock wave indicates that the pressure ratios of the shock waves should remain almost unchanged at different rotational speed.The unchanged pressure ratio is critical to the rotational effects on the performance, because the gross compression ratio of the wave rotor is generated by pressure ratios of the shock waves. Unchanged pressure ratios of the shock waves contribute to keeping the compression ratio of the wave rotor unchanged. The situation of an expansion wave is similar. Although the propagation velocity of the leading front of an expansion fan is independent of its pressure ratio in theory, the propagations velocities of the following fronts depends on the local temperature and thus depend on the relevant pressure ratios.The situation of the following fronts represents common situations in a wave rotor, such as the situation of the expansion fan ME (Fig. 9). Therefore, the unchanged propagation velocities keep the expansion ratios of the expansion fans and the gross expansion ratio of the wave rotor unchanged. In all, the discussions on shock waves and expansion waves support the regulation that the rotational speed effects on the pressure ratios of the wave rotor are rather small in the range from 8000 r/min to 10000 r/min, as Fig. 6 and Table 4 illustrate.
5. Conclusions
(1) The experimental rig controlled and recorded the operational states of the wave rotor.In the experiments where the rotational speed varied from-45%to+11%off the baseline rotational speed value, the pressure ratios and the outlet massflow rates of the wave rotor varied in different regulations.(A)When the rotational speed varied within a small range from-11%to+11%off the baseline value, the rotational speed effects were restricted in an even smaller extent.(B)As the rotational speed varies by -45% from the baseline value, the rotational speed effect accumulated and showed a large effect.
(2) The experimental and the CFD results showed similar slopes in circumferential pressure distributions at the ports.As we traced back such slopes to the internal flow field in the wave rotor channels with the CFD results,we outlined such slopes as traces of the unsteady pressure waves. Different rotational speeds corresponded to different circumferential pressure distributions, and they indicated the behaviors of the unsteady pressure waves in the rotational speed effects. (A) A variation of rotational speed within a range from -11% to +11% off the baseline value made a shock wave or an expansion wave tend to keep its propagation velocity unchanged at different rotational speeds. Such behavior of the unsteady pressure waves was supported by the trends in the traces of the expansion wave ME,the compression wave RC1 and the shock wave MS, according to the experimental and the CFD results. It helped to understand the mechanisms why the rotational speed effect was small on the operational states in this range. (B)A variation of rotational speed by-45%from the baseline value made the port-timings of the wave rotor mismatch the propagation of the pressure waves too seriously. Consequently, the flow patterns were very different from the baseline and the operational state varied by a large scale.
The authors declare that they have no known competing financial interests or personal relationships that could have appeared to influence the work reported in this paper.
This study was co-supported by the National Natural Science Foundation of China (No. 51906007) and the National Key Laboratory Foundation of China (No. 6142702190204).
 Chinese Journal of Aeronautics2022年5期
- Chinese Journal of Aeronautics的其它文章
- Multiframe weak target track-before-detect based on pseudo-spectrum in mixed coordinates
- Mahalanobis distance-based fading cubature Kalman filter with augmented mechanism for hypersonic vehicle INS/CNS autonomous integration
- A new target tracking filter based on deep learning
- Structure-aware fusion network for 3D scene understanding
- A novel combination belief rule base model for mechanical equipment fault diagnosis
- De-combination of belief function based on optimization
