Investigation of flow unsteadiness in a highly-loaded compressor cascade using a dynamic mode decomposition method
Gungyo AN, Ynhui WU,b,*, Jinhu LANG, Zhiyng CHEN,Xiobing ZHOU
a School of Power and Energy, Northwestern Polytechnical University, Xi’an 710129, China
b Shaanxi Key Laboratory of Internal Aerodynamics in Aero-Engine, Xi’an 710129, China
KEYWORDS Cascade;Compressor;Dynamic Mode Decomposition (DMD);Endwall;Unsteady flow;Vortex breakdown
Abstract Unsteady flow in the hub endwall region has long been a hot topic in the turbomachinery community.However important it is to the performance of the whole engine,the coherent unsteady flow phenomena are still not well understood. In this paper,the complex flow field in the hub endwall of a cantilevered compressor cascade has been investigated through numerical approach. The predicted results were validated by experimental data. To highlight the dominant flow structures among irregular and chaotic motions of various vortices, a Dynamic Mode Decomposition(DMD) method was utilized. The results show that there exist three dominant periodic flow structures: the oscillation of the leakage vortex, a circumferential migration of a Breakdown Induced Vortex(BIV)and the fluctuation of the passage vortex.These three coherent structures all together form a self-sustained closed loop which accounts for the flow unsteadiness of the studied cascade.During this process, the BIV plays a key role in inducing the flow unsteadiness. Only if the BIV is strong enough to affect the passage vortex,the flow unsteadiness occurs.This study expands current knowledge base of flow unsteadiness in a compressor environment, and shows the efficacy of the DMD method for revealing the origin of flow unsteadiness.
1. Introduction
In recent decades, the requirement for higher pressure ratio and fewer number of stages pushes the design of modern compressors towards highly-loaded blade configuration.While an increase in stage loading introduces not only fatigue problems,but a more complex flow field.The complexity lies in the inherently unsteady phenomena which induce strong flow oscillations. As such, the continued improvement on compressor performance under design and off-design operating conditions requires detailed understanding of the unsteady flow field.
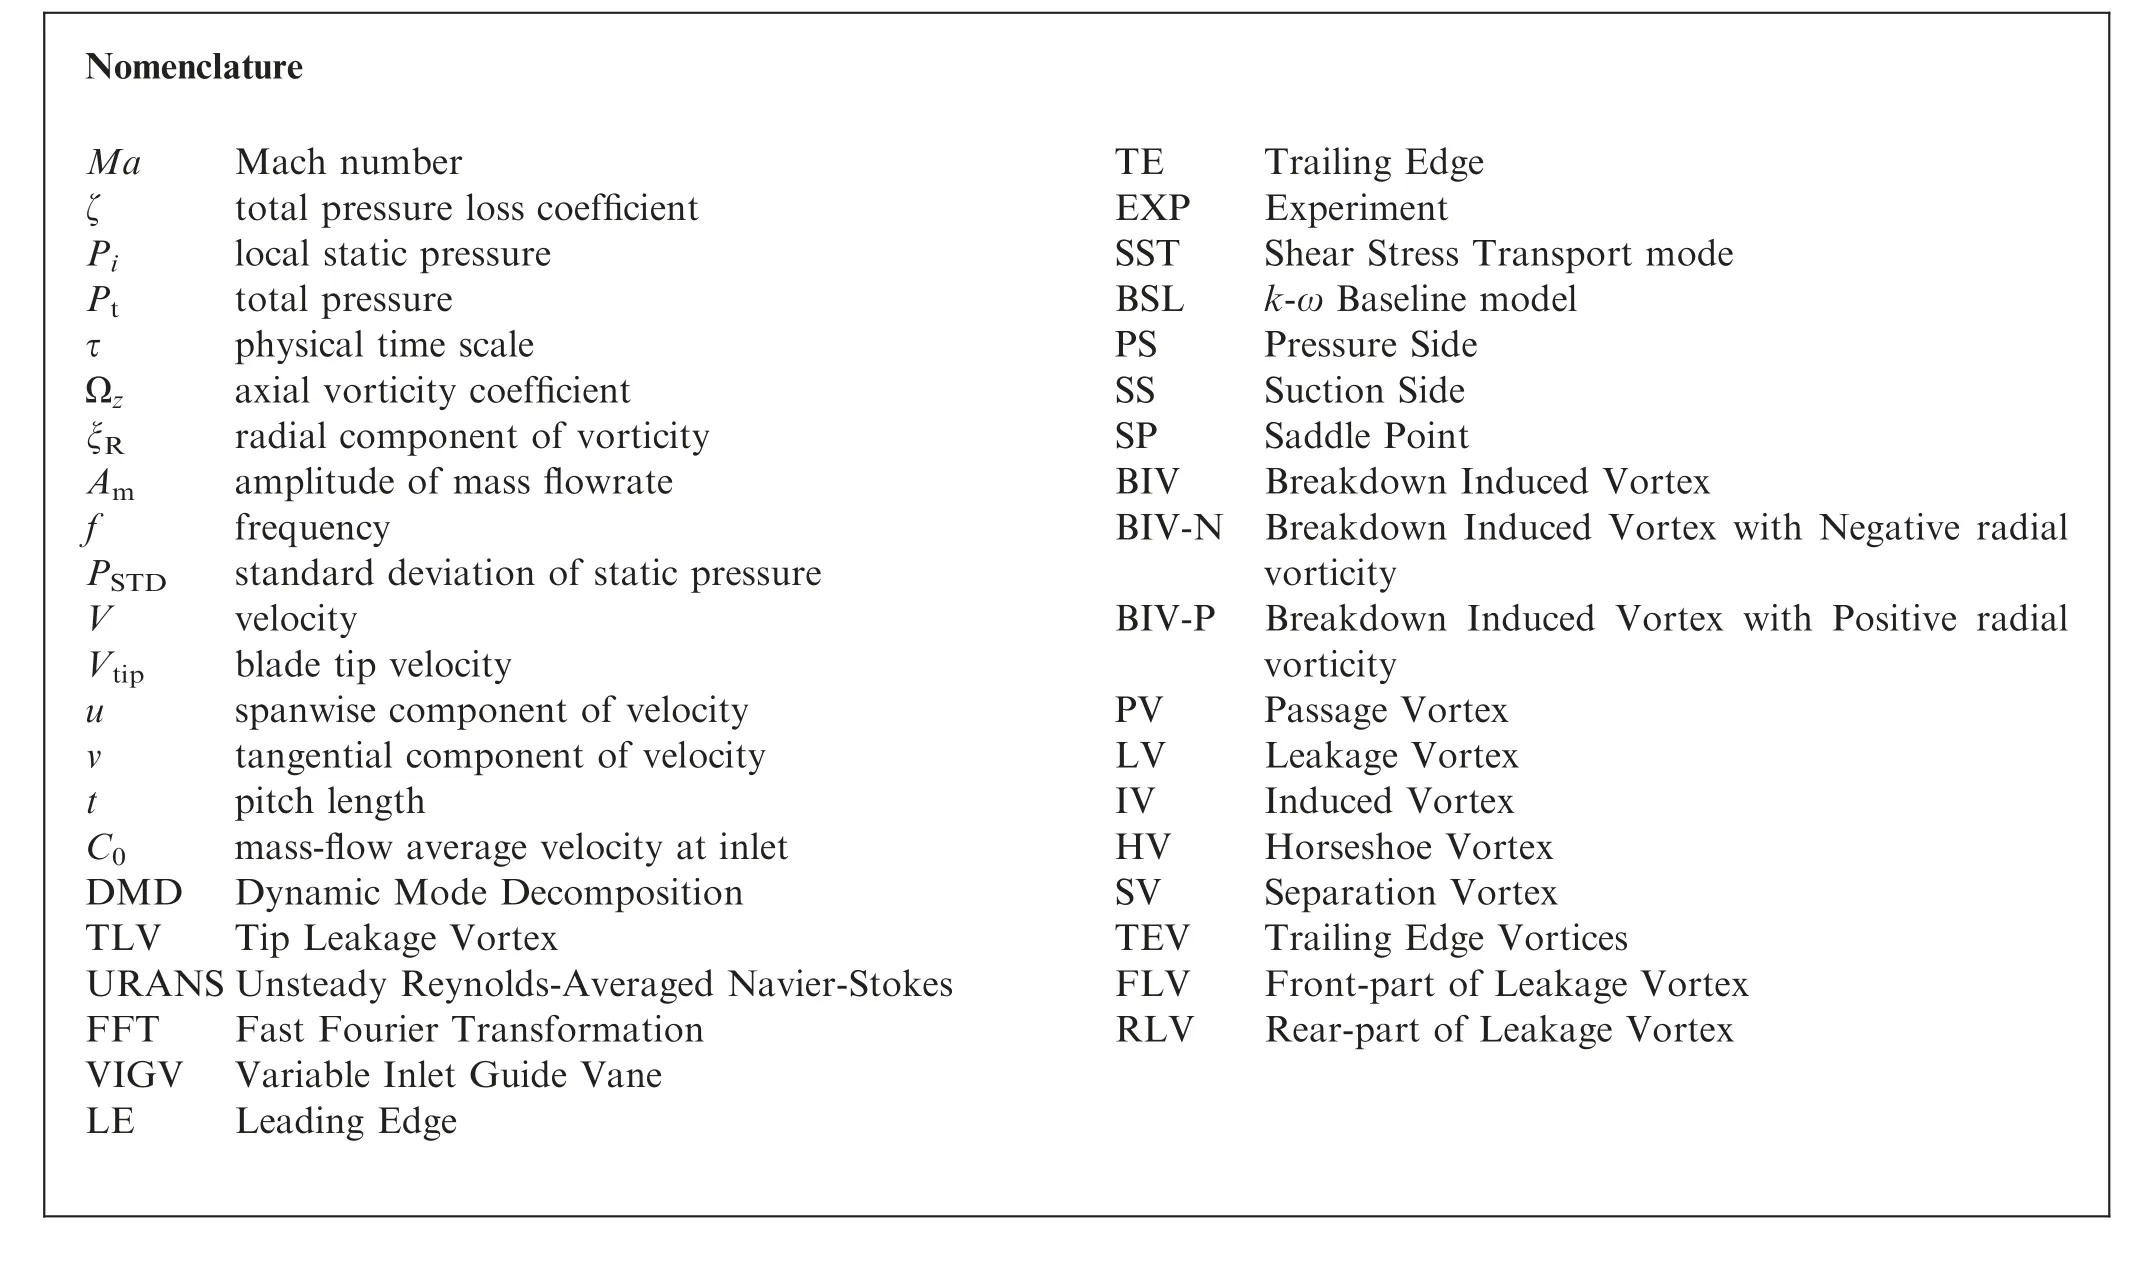
Nomenclature MaMach number ζtotal pressure loss coefficient Pilocal static pressure Pttotal pressure τphysical time scale Ωzaxial vorticity coefficient ξRradial component of vorticity Amamplitude of mass flowrate ffrequency PSTDstandard deviation of static pressure Vvelocity Vtipblade tip velocity uspanwise component of velocity vtangential component of velocity tpitch length C0mass-flow average velocity at inlet DMD Dynamic Mode Decomposition TLVTip Leakage Vortex URANS Unsteady Reynolds-Averaged Navier-Stokes FFTFast Fourier Transformation VIGV Variable Inlet Guide Vane LELeading Edge TETrailing Edge EXPExperiment SSTShear Stress Transport mode BSLk-ω Baseline model PSPressure Side SSSuction Side SPSaddle Point BIVBreakdown Induced Vortex BIV-N Breakdown Induced Vortex with Negative radial vorticity BIV-P Breakdown Induced Vortex with Positive radial vorticity PVPassage Vortex LVLeakage Vortex IVInduced Vortex HVHorseshoe Vortex SVSeparation Vortex TEVTrailing Edge Vortices FLVFront-part of Leakage Vortex RLVRear-part of Leakage Vortex
Amongst the whole passage, the endwall regions are the most important and the least well understood parts of compressors.Approximately one third of the losses are caused by flow in the endwall regions.The endwall regions consist of two parts, namely the casing endwall region and the hub endwall region.
In the casing endwall region, it has been widely accepted that the flow field is dominated by the Tip Leakage Vortex(TLV). Previous investigations showed that a series of flow phenomena with the presence of the TLV,such as TLV breakdown,the TLV oscillation,the interaction between TLV and incoming main flow,and the TLV/ shock interaction,induced strong flow oscillation in the tip region.
While the flow field in the hub region is somewhat more complex, it is well recognised that the complexity is directly related to the generation and revolution of various vortices.Throughout the literature,there have been plenty of proposed vortical flow models, and some examples include those proposed by Kang and Hirsch,Mu¨ller et al.,and Hergt et al.These investigations showed that the hub region was mainly affected by the existence of horseshoe vortices, the passage vortex,the separation vortex,the hairpin vortex,etc.Additionally, in cases with hub clearances, the influence of the leakage vortex was non-negligible.Based on a considerable progress that has been made in understanding of the distribution of vortical flow structures, a number of investigations were then devoted to revealing the mechanism and origin of flow unsteadiness in hub region. The bimodal behaviour of the horseshoe vortex,the oscillation of the passage vortex and the hairpin vortex,and the periodic shedding of the separation vortexwere found to be accounted for the flow unsteadiness. Although there are extensive studies, no final conclusion can be drawn on this topic. For one thing, the underlying mechanism varies because the unsteady flow phenomena are strongly dependent on the compressor geometry.For another,in traditional ways,the flow field analysis was divided into spatial analysis and temporal analysis.There lacked a way to link the frequency spectrum with coherent structures. Moreover,the flow pattern in the hub region is so complicated that it is difficult for researchers to determine most dominant flow structures from numerous vortices in both space and time through traditional approaches.
In order to efficiently extract coherent structures instead of considering every subtle detail in a flow field, a novel mode decomposition method, Dynamic Mode Decomposition(DMD), was proposed by Schmid.The DMD originated in the turbomachinery community as a method to provide accurate mode decomposition of a high-dimensional, nonlinear dynamic system into spatial-temporal coherent structures that can be used for flow field analyses.After launching,DMD has quickly gained popularity in subsequent studies in the community. It has been applied to a variety of flow models, such as cavity flow,near-field and far-field aero acoustics,and flow over airfoils.In recent years, DMD has been introduced to compressor inflow area, and has been demonstrated to be an effective tool.However,most efforts were made in analysing the unsteady flow in centrifugal compressors,and rare attentions were paid to axial compressors.This is the motivation of the current study.
The view of the authors is that an understanding of mechanisms by which they induce flow unsteadiness in compressors,is necessary to lay the foundation for future control methods and practical designs. However, typical approaches to this problem are challenging and time assuming.Under the circumstances,the authors adopt the DMD method for the identification of dominant periodic flow structures with a specific temporal behaviour in order to separate them from the rest of the irregular motions of the flow field.
This paper addresses the research need for a reinforcement of the understanding of unsteady flow by addressing the following questions: Q1. What is the underlying mechanism of flow unsteadiness in the hub region? Q2. How the flow unsteadiness is stimulated in the flow field?
2. Scope of this paper
In this paper, a campaign of computations of Unsteady Reynolds-Averaged Navier-Stokes (URANS) simulations and a data-based mode decomposition method are performed to address the abovementioned questions. The remainder of the paper is structured as follows.In Section 3,the compressor stator cascade adopted in current study is described. In Section 4,numerical methodologies as well as a brief introduction of the DMD method are then described. The simulations are carefully compared with experimental measurements in order to ensure that the predicted results match experimental data.In Section 5, an overall view of vortical flow structures of the flow field is first presented. Next, detailed flow field analyses are performed to reveal the origin and underlying mechanisms of flow unsteadiness. Specifically, in the first step,overall characteristics of flow oscillations at different incidences are obtained through the Fast Fourier Transformation(FFT) of probe signals. Then, dominant flow structures are extracted using DMD method. Finally, transient analyses are utilized, along with a combination of vortex identification method and mode reconstruction, to clarify the mechanism and origin of flow unsteadiness.
3. Compressor stator cascade
The study was performed on a highly-loaded annular compressor stator cascade designed by the Technical University of Berlin. Fig. 1 presents a sketch of the whole test rig. The whole system consists of three parts: Variable Inlet Guide Vane(VIGV), compressor stator cascade and throttle. The test rig was designed and built to investigate the unsteady flow phenomena in a non-rotating frame reference.
The cascade blade row is prismatically shaped without any 3D contour in radial direction. It is characterized by a hub clearance of 3% chord length. Main geometrical parameters are given in Table 1. More design details about the geometry can be found in Refs. 25-27.
Unsteady data were collected from radially and circumferentially (±30°) arranged probes at inlet and outlet stations.Measurement time for each probe were 30 s to obtain a meanvalue of the flow field.For experimental details,please refer to Ref. 25.
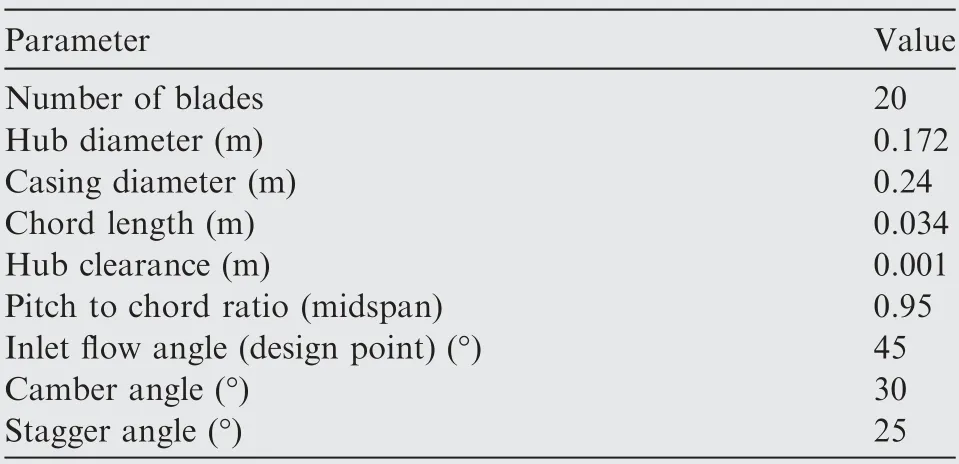
Table 1 Cascade blade row design parameters.
4. Numerical methodology
4.1. Solver
The present simulations were carried out using a commercial flow solver Ansys CFX. Three-dimensional Reynoldsaveraged Navier-Stokes equations were discretized in space using a cell-centred finite volume formulation. A highresolution advection scheme was adopted to discretize conservation equations. Heat generation due to viscosity was evaluated using total energy equation with viscous work term. In unsteady simulations, a physical time step was set as 2 × 10s which corresponds to twice of the experimental sampling rate. Unsteady simulations were considered converged when the following criteria were met. Firstly, the root mean square of residuals reaches 1×10.Secondly,the static pressure of the monitor point goes flat or periodically oscillates with time.
4.2. Computational domain
Fig. 2 gives the topology of the computational domain. The inlet is located 150%chord length upstream of the blade Leading Edge(LE),exactly at the experimental measurement plane.The outlet is located 250% chord length downstream of the blade Trailing Edge (TE) to avoid wave reflection from the outlet boundary.

Fig. 1 Sketch of test rig.
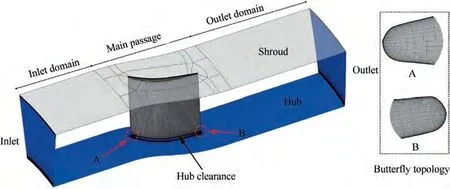
Fig. 2 Topology of computational domain.
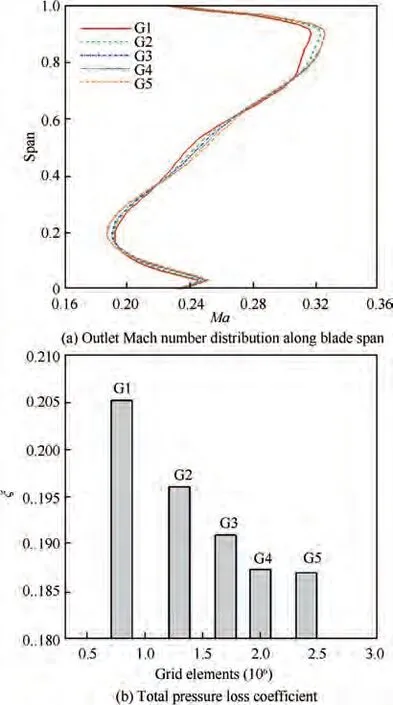
Fig.3 Predicted Mach number and total pressure loss coefficient of different grids at 10° incidence.
The computational mesh was generated using ANSYS Turbogrid. A grid convergence analysis was performed to ensure that the solution was independent of the grid density. Five grids with different element amounts, 8 × 10(G1), 1.3 × 10(G2),1.7×10(G3),2.0×10(G4)and 2.4×10(G5),were tested in terms of predicted outlet Mach number and total pressure loss coefficient. The total pressure loss coefficient is defined as where P represents the static pressure, Pis the total pressure,subscript 1 refers to domain inlet,and subscript 2 refers to outlet. The results are shown in Fig. 3. It is found that when the grid number reaches 2.0 × 10(G4), a further increase in grid elements will not introduce any change in the predicted results.Thus, G4 was chosen for the present study.
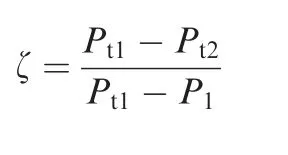
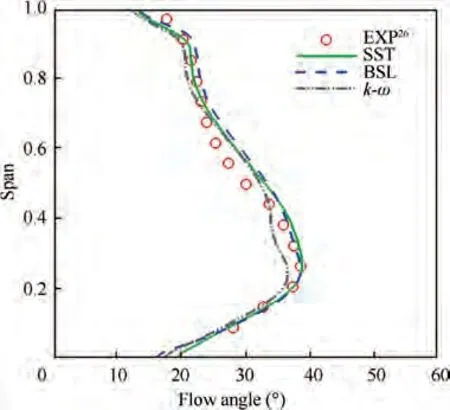
Fig.4 Comparison of predicted and experimental26 flow angle at outlet measurement plane (10° incidence).
The computational grid consists of three parts:the inlet and outlet domain were built with H-type grids; the main passage was generated with H-O-H topology; the hub clearance was modelled with butterfly topology,namely H-type grids in inner zone and O-type grids in outer zone. The near-wall cells were refined and gave yvalue less than 1. Specifically, the hub clearance mesh is also refined with 41 cells in radial direction to achieve an accurate numerical simulation of the clearance flow.
4.3. Boundary conditions
The domain inlet was specified with velocity profiles and a total temperature of 323 K which are obtained from experimental measurements.The outlet condition was given with an averaged static pressure. No-slip and adiabatic conditions were imposed at all solid walls. The operating point of the compressor was changed by varying the inlet velocity profile.
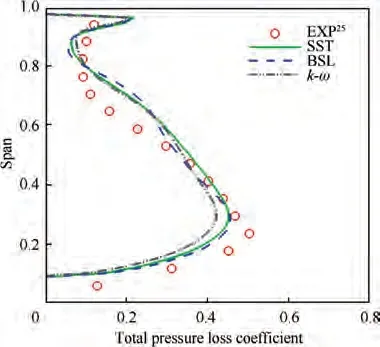
Fig. 5 Comparison of predicted and experimental25 total pressure loss coefficient (10° incidence).
4.4. Validation
Turbulence model study had been carefully considered before conducting further simulations. Three turbulence models(Shear Stress Transport(SST)model,k-ω model,k-ω Baseline(BSL)model)have been assessed and compared to experimental data. The results are presented in Figs. 4-6. It was found that the results obtained from the SST and BSL models showed better agreement with experimental data of both outlet flow angle and total pressure loss coefficient. In Fig. 6, most prominent flow features, such as the separation and attachment lines, the Saddle Point (SP) and the Passage Vortex(PV)initial location were best predicted with SST model.Thus the SST model was selected for further simulations.
4.5. Data-driven dimension reduction algorithm
In this study, a novel and powerful technique, the Dynamic Mode Decomposition, was utilized for the discovery of dynamic systems from high-dimensional data. The DMD method is an effective tool used to decompose complex compressor flow fields into a simple representation based on both spatial and temporal coherent structures.Given a time series of data, DMD computes a set of modes each of which is associated with a fixed oscillation frequency and growth rate.A brief introduction of the DMD algorithm is given below. For more details, please refer to Refs..
Consider a snapshot matrix X of flow fields at time t and another snapshot matrix Xat time t + dt.
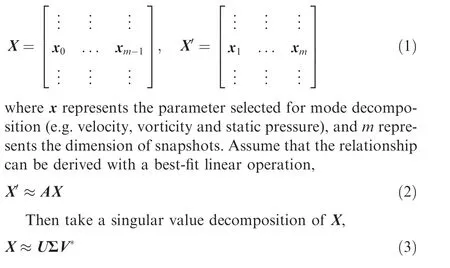
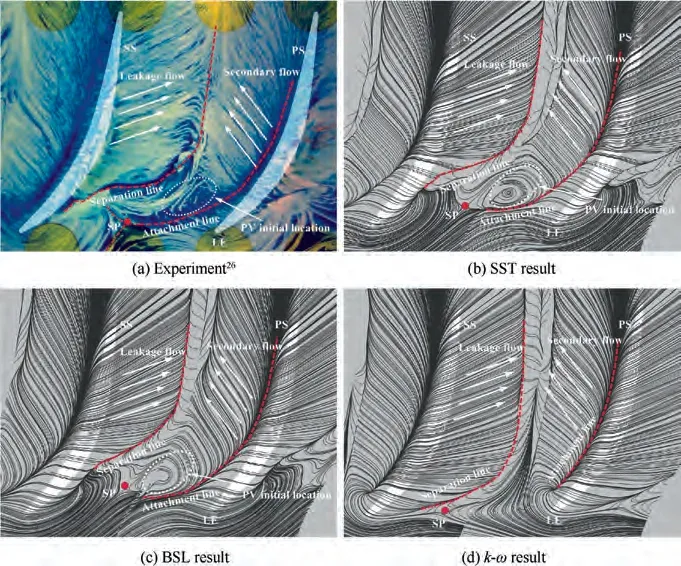
Fig. 6 Comparison of endwall streamlines for different turbulence models and experimental data26 (10° incidence).
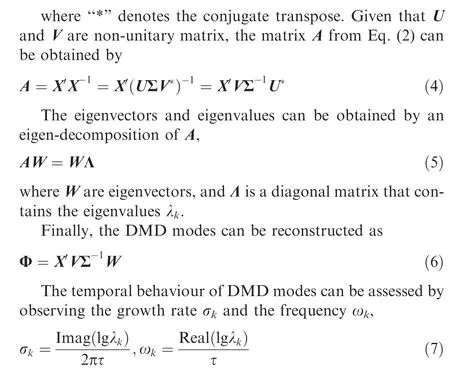
where the‘‘Imag”refers to the imaginary part,‘‘Real”refers to the real part,λis the eigenvalue of Λ and τ is the physical time scale.
5. Presentation of results
5.1. Vortical flow structure analysis (0° incidence)
The flow field in the near-hub region is quite complicated.Research into this field of turbomachinery aerodynamics has been in progress for decades.These studies clearly showed that the flow patterns in this region were closely associated with the endwall vortices and their locations within the passages.Thus, having a clear understanding of vortical flow structures of the flow field is crucial before we conduct a further investigation.
Given that main vortex structures are roughly the same at different incidences, the design point (0° incidence) was selected for examining vortical flow structures, as shown in Fig. 7. The vortex structures were identified with λcriterion.The iso-surface was coloured with axial vorticity coefficient.Axial vorticity coefficient is defined as

where u refers to spanwise component of velocity, v refers to tangential component of velocity, t is pitch length, and Cis mass-flow average velocity at the inlet.
It can be seen that the passage flow field is characterised with 6 main vortices. At a lower span, the Leakage Vortex(LV) and the Passage Vortex (PV) can be easily recognised,both of which were formed near the Leading Edge (LE) of the endwall but at different blade side. An Induced Vortex(IV) was observed alongside the leakage vortex. Ahead of the blade leading edge, a Horseshoe Vortex (HV) was formed as a result of the boundary layer separation of the incoming flow.Specifically,only a pressure side leg of the horseshoe vortex was observed,and the suction side of the horseshoe vortex was constrained due to the presence of the leakage flow. At a higher span,a Separation Vortex(SV)was observed in the rear passage. The separation vortex originated from the endwall and developed to about 50% span of the trailing edge. Inside the blade wake, there are two discrete vortices which are regarded as the classical Trailing Edge Vortices (TEV). At the blade suction side, a wall vortex was generated due to the flow separation on the suction surface.
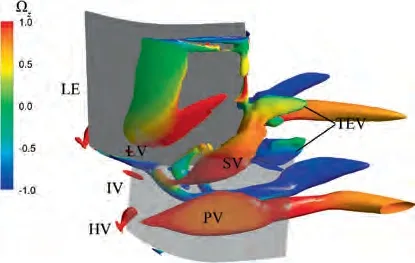
Fig.7 Vorticalflowstructuresatdesignpoint(λ2 = -2.4 × 10⁷).
In particular, a vortex breakdown phenomenon was also observed. According to the investigation by An et al.,the leakage vortex breakdown is characterised by a vorticity transformation from streamwise component to radial and circumferential component in the breakdown region. A similar phenomenon is observed in Fig. 8. The leakage vortex broke down at Point A, which gave rise to a formation of two vortices of radial component vorticity. These two vortices were also confirmed and analysed in detail in hydrodynamic area through experimental approaches.In this study,the one with positive radial vorticity is named BIV-P, while the other with negative radial vorticity is named BIV-N. It is also observed that the leakage vortex was divided into two parts due to the vortex breakdown, a front part (FLV) and a rear part (RLV).
5.2. Analysis of flow oscillation
5.2.1. An overall view of flow oscillation
In order to give an overall view of the flow field unsteady features,Fig.9 presents a Fast Fourier Transformation (FFT)of outlet mass flowrate at different incidences.Note that the FFT size(number of sample points)is 7168 and the sampling rate is 5×10Hz,which gives a frequency resolution of 6.98 Hz.The unsteady data were collected after the unsteady simulation was well converged.With an increase in incidence,flow oscillations were first observed at 9.5° incidence. Outlet mass flowrate oscillations at different incidences were characterised by two frequencies, a fundamental frequency of 1039 Hz and its second harmonic of 2078 Hz.
To locate the region where the most prominent flow oscillation occurs,the flow filed of 9.5°and 9.0°incidences were carefully compared. Former investigations indicated that this stator cascade is hub-loaded and that main flow structures are located near the hub. Therefore, the near-hub region is considered as the region of interest in current study.
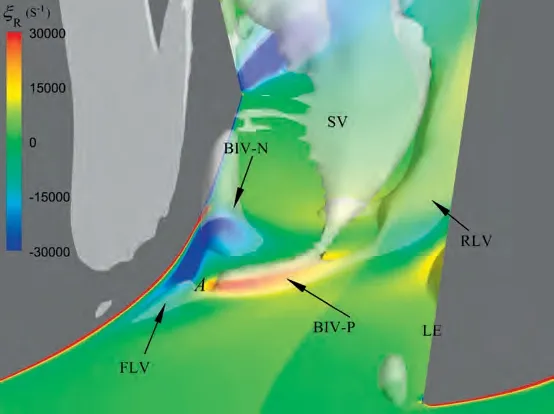
Fig. 8 Vortex structures along with a radial component of vorticity distribution at 4% span.
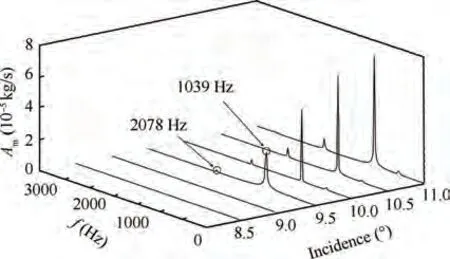
Fig. 9 FFT spectrum of fluctuations in outlet mass flowrate at different incidences.

Fig. 10 shows Standard Deviation (STD) of static pressure on hub at two incidences. The STD of static pressure was calculated as where Prepresents local static pressure, Pdenotes time averaged static pressure,N refers to the number of time instants,ρ is density,and Vis blade tip speed.The pressure field exhibited a uniform distribution in both spatial and temporal dimensions at 9.0°incidence. While at 9.5°incidence, pressure oscillations were clearly presented. In Fig. 10(b), strong pressure oscillations mainly distributed at the starting position of the passage vortex (marked with 1) and the front-part of the leakage vortex (marked with 2). Besides, the induced vortex(marked with 3), the vortex breakdown region (marked with 4)and the rear-part of the leakage vortex(marked with 5)also introduced pressure oscillations at hub.
A comparison between STD of static pressure distributions on PS and SS at two incidences is shown in Fig. 11. It is also found that pressure oscillations only occurred at 9.5° incidence. At the suction side, strong pressure oscillations were caused by the front-part of the leakage vortex (marked with 1) and the vortex B (marked with 2). At the pressure side,the high-pressure oscillation region was located near the leading edge of blade endwall, exactly where the passage vortex was initiated.
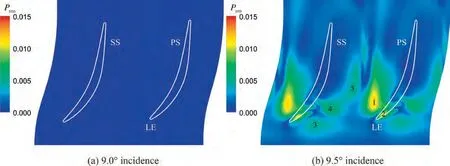
Fig. 10 Distribution of standard deviation of static pressure on hub at two incidences.
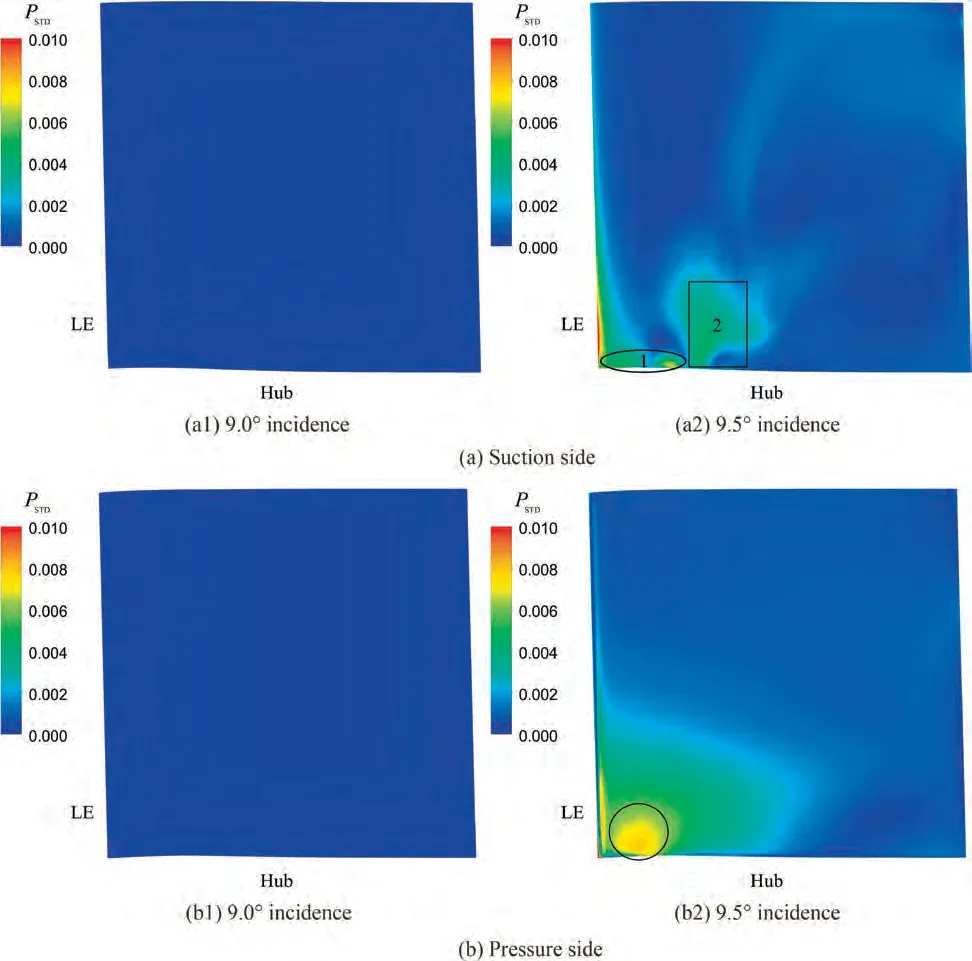
Fig. 11 Distribution of root mean square of static pressure on PS and SS at two incidences.
To sum up, the most prominent unsteady region is located near the leading edge of blade endwall. Moreover, the flow oscillation is highly related to vortex breakdown and the unsteady behaviour of leakage vortex and passage vortex.However,it is still unclear how these flow structures contribute to the flow oscillations. In order to address this problem, the DMD method is then introduced in the next section.
5.2.2. DMD analysis (9.5° incidence)
In this section, an effective data mining method, DMD method, was used to link the characteristic frequency of flow unsteadiness at 9.5° incidence with its corresponding flow features.Cascade hub was chosen as the plane of interest.In total,500 snapshots of the hub were used for data mining.The time interval between snapshots is 1 × 10s, which gives a frequency resolution of 20 Hz.
The analysis was initiated with presenting several parameters that are pertaining to the spatial-temporal behaviour of DMD modes, e.g. mode energy, eigenvalues and growth rate.Results shown in Fig. 12 indicate that the flow field was dominated by three modes since they contained the most amount of modal energy(82%of total energy).The frequency of 1036 Hz(Mode 1) was the fundamental frequency, while the frequency of 2072 Hz and 3106 Hz were its second and third harmonics.It is found that the frequencies of dominant DMD modes were slightly different to those of the FFT results. The differences came from the error accumulation during the decomposition processand a relative low frequency resolution of DMD.
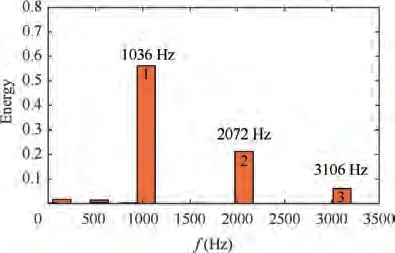
Fig. 12 DMD on vorticity: Energy content of DMD modes vs frequency.
Fig.13 shows dynamic eigenvalue characteristics.One thing needs to be noted before interpreting this figure: eigenvalues lying exactly on the unit cycle represent neutrally stable and periodic dynamic modes; eigenvalues lying inside and outside the circle represent damped and undamped modes, respectively. With a sufficiently long data sequence, both damped and undamped modes will vanish;only neutrally stable modes remain. It can be observed in Fig. 13(b) that Mode 1,Mode 2 and Mode 3 are all neutrally stable modes.
Growth rate is another parameter that describes the growth or decay of modes. As shown in Table 2, the growth rate of these 3 dominant DMD modes are all of small amounts,which means that they are all neutrally stable and periodic dynamic modes.
5.2.3. Physical mechanisms of flow field unsteadiness (9.5°incidence)
In this section, the physical mechanism of flow field unsteadiness will be clarified by virtue of a combination of DMD and dynamic vortex visualization techniques.
Fig. 14 shows dominant DMD modes reconstructed from static pressure and velocity fields. According to the DMD algorithm, high absolute values represent strong oscillations.Static pressure and velocity contours of Mode 1 described most dominant flow structures at hub region. They were the front-part of the leakage vortex (marked with 1), the leakage vortex breakdown region (marked with 2), the rear-part ofthe leakage vortex (marked with 3) and the passage vortex(marked with 4). And contours of Mode 2 and Mode 3 revealed the motion of flow structures, as shown in Fig. 14(b), e.g. the oscillation of the front-part leakage vortex(marked with I), the circumferential movement of the vortex breakdown region(marked with II)and the streamwise motion of the passage vortex (marked with III).

Table 2 Growth rates of dominant DMD modes.
From the discussions above, we now have a general understanding of the mechanism of flow unsteadiness, i.e. it originates from a joint action of the oscillations of the leakage vortex, the vortex breakdown region and the passage vortex.The next goal is to clarify the dynamic process concerning how the flow unsteadiness is developed in the passage.In other words, to reveal the flow structures which are responsible for the dominant frequency, it is necessary to utilize a transient flow field analysis.
The transient analysis was initiated with a pressure field reconstruction of Mode 1 during one period, as shown in Fig. 15. Note that one period refers to 48 physical time steps,which is converted from the frequency of Mode 1(1036 Hz).In Fig.15, the blue region refers to a low-pressure region, specifically,and it indicates that this region is under the influence of a vortex;on the contrary,a red colour means that this region is away from the influence of a vortex;a transition of the colour indicates a motion of a vortex.It can be observed that the leakage vortex (both front and rear parts), the vortex breakdown region as well as the passage vortex oscillated periodically with time. The development of the rear-part of the leakage vortex and the passage vortex was synchronous, namely, when the rear-part of the leakage vortex growed or decayed,the passage vortex varied in the same way. However, the situation for the front-part of the leakage vortex and the passage vortex was totally different. A growth of the passage vortex prevented flow from entering the hub clearance,leading to a decay of the front-part of the leakage vortex.
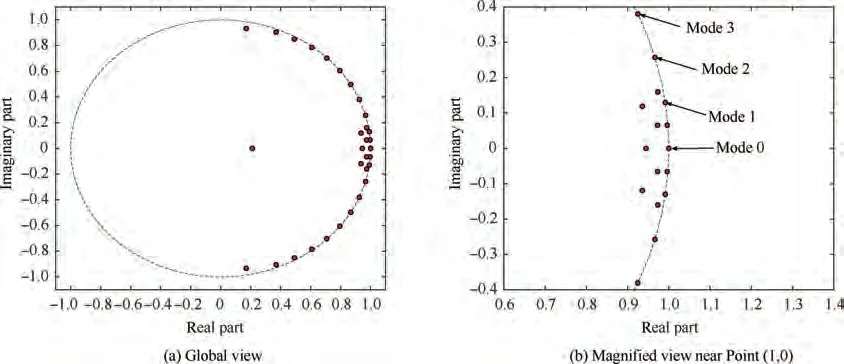
Fig. 13 DMD on vorticity: Eigenvalues distribution.
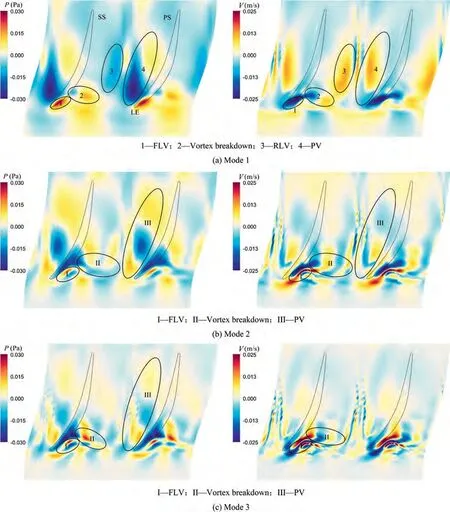
Fig. 14 Dominant dynamic modes visualized by static pressure and velocity component.
At t = T, the static pressure near the leading edge of PS reached a peak, corresponding to a maximum of the frontpart of leakage flowrate (see Fig. 16) and a strongest frontpart of leakage vortex as well.At t=T,a low-pressure region was observed near the leading edge of PS(marked with a black circle in Fig. 15), indicating that the passage vortex began to affect the pressure distribution of this region. From t = Tto t = T, the passage vortex gradually increased in strength and moved upstream, which was identified by an enlargement of the low-pressure region. As a result, the front-part leakage flow was badly blocked by the passage vortex. Accordingly,the front-part of leakage vortex was weakened. At t = T,the passage vortex moved to the most upstream location of its trajectory,resulting in the lowest value of the static pressure near the leading edge of blade pressure side and the weakest leakage vortex as well.After that,the passage vortex departed from the leading edge and moved downstream.It followed that the blockage effect was weakened and that the front-part of leakage vortex gradually enhanced. The pressure distribution at t=Twas nearly the same as that at t=T,which demonstrated that the flow field oscillated periodically with a period of 48 physical time steps.
On the basis of the above discussions, it can be concluded that there exists a fluctuation of the passage vortex along streamwise direction,which will then affect the pressure distribution near the leading edge of PS and lead to an oscillation of the front-part of leakage vortex. A new question, Q3, then arises: what is the mechanism behind the fluctuation of the passage vortex?
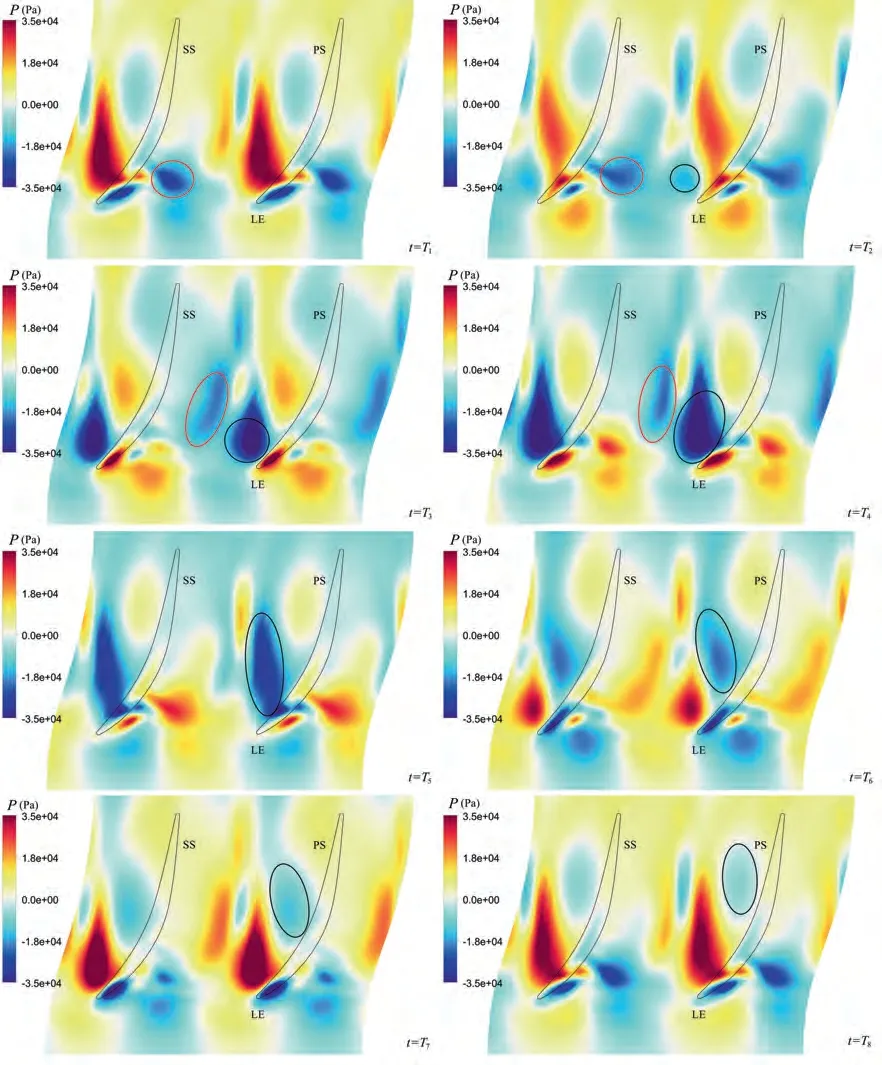
Fig. 15 Pressure field reconstruction of Mode 1 during one period.
In Fig. 15, another low-pressure region was recognised originating in the vortex breakdown region at t=T(marked with a red circle). This low-pressure region gradually periodically moved from the suction side to the pressure side over time, during which process it induced the passage vortex near the leading edge. To better show the motion of the lowpressure region along circumferential direction, Fig. 17 gives radial component of vorticity distributions at 4% span during one period. Comparing Fig. 15 and Fig. 17, we can find that the low-pressure region marked with red circles in Fig.15 corresponds to the region of positive radial vorticity(marked with A in Fig. 17) which originates from the vortex breakdown.During t=Tto t=T,Region A migrated along circumferential direction from the suction side to the pressure side. At t=T,Region A reached to the middle of the passage.Then,Region A gradually decayed, and finally disappeared. At t= T, a new Region A was generated near the blade suction side, and again propagated along circumferential direction afterwards. Thus, a self-sustained oscillation system was established.
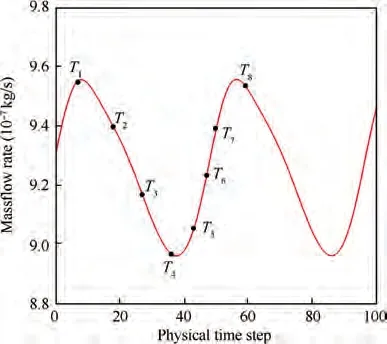
Fig.16 Oscillation of front-part leakage flowrate(0-15%chord length) vs time.
In order to reveal the flow structure that this region of positive radial vorticity represents, vortex structures distributions near hub during one period are shown in Fig.18.Vortex structures identified by λcriterion were coloured with the radial component of vorticity to ensure that the vortex of high radial vorticity could be easily recognised.It is found that a BIV-P is responsible for the region of positive radial vorticity. The trajectory of the BIV-P agreed well with that of Region A. The BIV-P originates from the breakdown of the front-part of leakage vortex, as discussed in detail in Section 5.1.
By now, Q3 can be answered as follows: cycles of BIV-P’s formation, migration and decay lead to the fluctuation of the passage vortex. Specifically, the breakdown of the front-part of leakage vortex gives rise to a new vortex of positive radial vorticity. We name it BIV-P in current study. The BIV-P then propagates from blade SS to PS. When approaching the middle part of the passage, it will induce a rolling up of the secondary flow near the leading edge of blade PS, in other words, an upstream migration of the passage vortex. After then, BIV-P decays in strength. Accordingly, the passage vortex decays and migrates downstream, implying an end of the old period. The new period initiates with the formation of a new BIV-P. As such, the periodic formation, migration and decay of BIV-P account for the fluctuation of the passage vortex.
The next question that needs to be addressed is,Q4:what is the reason for the periodic formation of the BIV-P?It has been mentioned in the discussion of Fig. 15 that the strength of the front-part of leakage vortex varies due to the oscillation of the passage vortex. This means that the vortex breakdown does not occur all the time at 9.5°incidence since the vortex breakdown is directly related to the strength of the vortex. According to the research by Bru¨cker,the vortex breakdown is characterised by two regions of concentrated radial vorticity in the breakdown region. Back to Fig. 18, it is observed that when the front-part of the leakage vortex is of high strength,for example at t = T, T, T, T, vortex breakdown occurs.However, at some time instants, for example t = T, T, the BIV-P was not observed, implying that the front-part of leakage vortex did not break down at these time instants. In other words, the vortex breakdown occurs intermittently in the passage.Hence,the dynamic process of periodic formation of the BIV-P can be interpreted as follows: at t = T, the BIV-P began to affect the secondary flow near the blade pressure side and induced the passage vortex; during t = Tto t = T, the passage vortex gradually moved upstream,resulting in a decay of the front-part of leakage vortex;at t=T,the front-part of the leakage vortex was so weak that no vortex breakdown occurred in the passage;during t=Tto t=T,still no vortex breakdown occurred, while at the same time, with the decay of the BIV-P,the passage vortex gradually moved downstream, leading to a recovery of the front-part of the leakage vortex; at t = T, the front-part of the leakage vortex was strong enough to induce a vortex breakdown, and a new BIV-P then originated in the breakdown region; after formation, the new BIV-P moved along circumferential direction;until t = Tof the next period, it again induced the passage vortex. In such a way, a periodic oscillation system of BIV-P is established.
To sum up, the physical mechanism of flow field unsteadiness is summarized in Fig.19.A periodic formation,migration and decay of BIV-P induce a fluctuation of the passage vortex along streamwise direction;the fluctuation of the passage vortex then causes an oscillation of the front-part of the leakage vortex due to its blockage effect; the oscillation of the frontpart of the leakage vortex will in return lead to the periodic formation,migration and decay of BIV-P.In this way,a closed loop process which accounts for a self-sustained unsteady system is built.
5.2.4. Trigger for flow field unsteadiness
The flow mechanism of flow field unsteadiness has been discussed in detail in Section 5.2.3. In this section, we will clarify the trigger of flow field unsteadiness by comparing the flow field of 9.0° and 9.5° incidences. Note that 9.0° incidence is the largest incidence where no flow oscillation is detected,while 9.5° incidence is the incidence where flow oscillation is first observed.
Fig. 20 presents vortex structures near hub at two incidences.Note that the time instant for Fig.20(b)is t=Twhen the BIV-P is the strongest. It is observed that the most difference between the vortex structures at two incidences is that the BIV-P connected with the passage vortex at 9.5° incidence,while at 9.0° incidence, the BIV-P is a distance away from the passage vortex. This indicates that the BIV-P at 9.5° incidence is large enough to induce the passage vortex, while it is not the case at 9.0° incidence. The reason for the difference in vortex size is that with the increase in incidence, the reverse flow near blade suction surface gets stronger. This will cause an upstream migration of the vortex breakdown point, and lead to an expansion of the BIV-P as well.
So far it can be concluded that the trigger for flow field unsteadiness is that the BIV-P is strong enough to induce the passage vortex. If this condition is met, a closed loop process that leads to a self-sustained flow field unsteadiness will be stimulated.
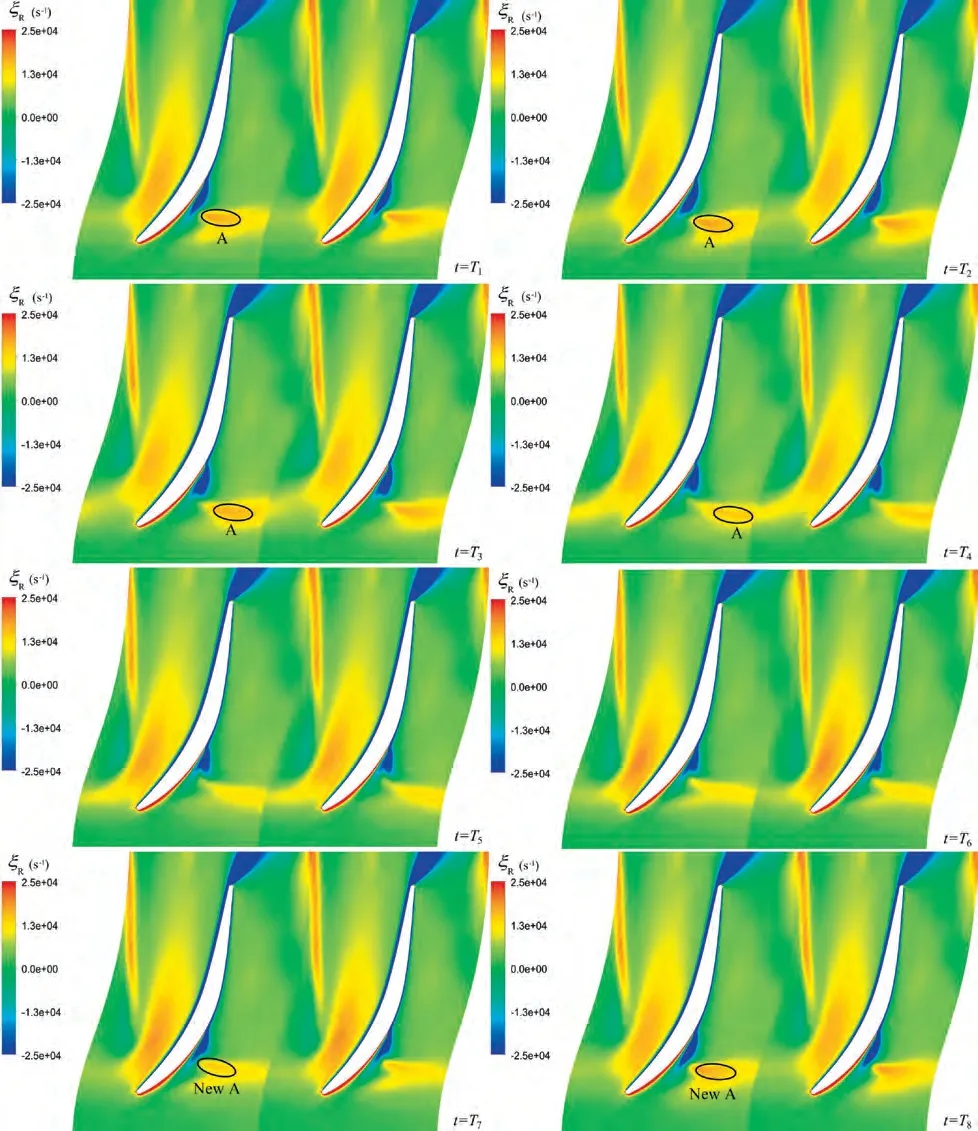
Fig. 17 Radial component of vorticity distributions at 4% span during one period.
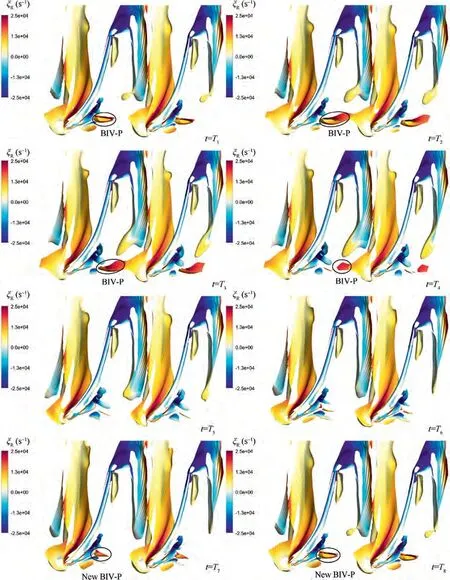
Fig. 18 Vortex structures distributions near hub (0-9% span) during one period.

Fig. 19 An illustration of mechanism of flow unsteadiness.
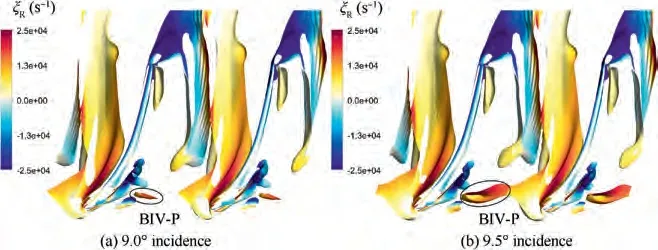
Fig. 20 Comparison of vortex structures at two incidences.
6. Conclusions
(1) A breakdown of the front-part of the leakage vortex is observed in the studied cascade, which gives rise to the formation of a BIV-P with positive radial vorticity and a vortex B with negative radial vorticity. After formation, the BIV-P moves along circumferential direction under the influence of the main flow. The vortex breakdown occurs intermittently, resulting in cycles of BIVP’s formation, migration and decay.
(2) The periodic migration along circumferential direction of the BIV-P causes a fluctuation of the passage vortex along streamwise direction. To be specific, when it moves to the middle part of the passage, it will induce the origination of the passage vortex near the leading edge of blade pressure side; when it decays, the passage vortex moves downstream.
(3) The fluctuation of the passage vortex along streamwise direction leads to an oscillation of the front-part of the leakage vortex due to the blockage effect that the passage vortex introduced.
(4) The oscillation of the leakage vortex, a circumferential migration of the BIV-P and the fluctuation of the passage vortex all together form a self-sustained closed loop which accounts for the flow unsteadiness of the studied cascade.
(5) The BIV-P plays a key role in inducing the flow unsteadiness. Only if the BIV-P is strong enough to affect the passage vortex, the flow unsteadiness occurs.Otherwise, for incidence less than 9.5°, no flow oscillations are detected in the flow field.
(6) The Dynamic Mode Decomposition has been demonstrated as an efficient tool in unsteady flow analysis,through which flow structures behind dominant modes can be accurately captured.
The authors declare that they have no known competing financial interests or personal relationships that could have appeared to influence the work reported in this paper.
The authors would like to acknowledge the supports of National Natural Science Foundation of China (Nos.51790512,52176045),the National Major Science and technology Project of China (No. J2017-II-0010-0024) and the Innovation Foundation for Doctor Dissertation of Northwestern Polytechnical University, China (No. CX201911).
Particular thanks to Prof. Dieter Peitsch and Dr. Mario Eck at the chair of aero engines in Technische Universita¨t Berlin, who offered the geometry of the compressor cascade and presented detailed experiment results in researches.
 Chinese Journal of Aeronautics2022年5期
- Chinese Journal of Aeronautics的其它文章
- Multiframe weak target track-before-detect based on pseudo-spectrum in mixed coordinates
- Mahalanobis distance-based fading cubature Kalman filter with augmented mechanism for hypersonic vehicle INS/CNS autonomous integration
- A new target tracking filter based on deep learning
- Structure-aware fusion network for 3D scene understanding
- A novel combination belief rule base model for mechanical equipment fault diagnosis
- De-combination of belief function based on optimization
