Entropy based inverse design of aircraft mission success space in system-of-systems confrontation
Yun GAO, Yongling TIAN,*, Hu LIU, Jinwen HU
a School of Aeronautic Science and Engineering, Beihang University, Beijing 100083, China
b Chinese Academy of Military Science, Beijing 100091, China
KEYWORDS Effectiveness evaluation;Entropy;Inverse design;Military missions;Mission success space;System of systems (SoS)
Abstract This paper presents a practical and efficient design method for aircraft Mission Success Space(MSS)based on the entropy measurement(EM).First,fundamentals regarding MSS,Inverse Design(ID)and entropy are discussed.Then,two EM schemes of entropy-based ID and the whole MSS ID procedure are given to demonstrate alternative ways of entropy quantification and MSS design. After that, Genetic Algorithm (GA) is utilized as a search algorithm to find the optimal MSS design with the minimum objective,entropy,in each EM scheme.A simulation case of aircraft penetration mission is given for the method validation where the best aircraft MSS design is obtained by GA according to the minimum entropy. Results from two schemes are compared at the end.
1. Introduction
In order to explore the requirements of modern confrontations, System-of-Systems (SoS) oriented design and evaluation1-10has been a persistent, hot and critical research direction for a few decades2-4which focuses on the SoS holistic effectiveness rather than subsystem/component performance.Therefore, design and evaluation of military aircrafts should pay high attention to the impact of SoS especially at the conceptual design stage since this stage starts and determines the whole design process.3,5
Liu et al.3systematically reviewed the perspectives and progresses of SoS-oriented flight vehicle conceptual design including advanced concepts, design methodologies, SoS-oriented effectiveness evaluation4-6,11etc. To further quantify mission effectiveness evaluation of complex SoS and explore heterogeneous success criteria, Mission Success Space (MSS) concept was proposed in Ref.4and the Inverse Design (ID) of MSS was preliminarily investigated according to the Contribution to System-of-Systems (CSS) results. Furthermore, Gao et al.5comprehensively summarized the ID methodology in CSS evaluation and also studied alternative MSS ID schemes in two different SoS combat cases. Based on that, Ref.6utilized a search algorithm, Genetic Algorithm (GA), to inversely find the optimal MSS design according to the Gaussian fitting analysis of CSS results.
CSS is an effectiveness index which can generally demonstrate the holistic executive level of equipment (or combat capability) in SoS combat thus has attracted much attention.Both equipment and combat capability oriented CSS studies can be found in Refs.4-10but, the final CSS quantifications usually need many calculations with various criteria,4-6,10probability distributions,7,9weighting factors7,8,10or cost index.10On the other hand,Refs.4-6discussed different feasible schemes of ID to represent MSS design candidates in the design variable space;however,MSS can only be well designed after CSS evaluation work is finished according to the characteristic analysis of CSS data. In contrast, this paper tries to propose an entropy-based MSS ID method without using the CSS evaluation but only common effectiveness indices (e.g.Number of Destroyed Target, NDT) for Entropy Measurement (EM), which should be easier to implement.
Entropy studied here refers to the information entropy which is a probability-based index to measure the‘‘uncertainty”,‘‘disorder” or ‘‘surprise” in a system.12-14The entropy quantifies how ‘‘informative” or ‘‘surprising” the entire random variable is,averaged on all its possible outcome information.14None of literatures has considered it in the SoS oriented evaluation.Following the MSS theories,4-6entropy is here used to analyse the uncertainty features of effectiveness results in a SoS confrontation. The entropy calculation utilizes the probability value of all samples in the whole design space thus,it reflects the holistic information situation or probability distribution,specific to the collected combat results from a SoS confrontation. There are two entropy-based MSS ID schemes to be presented: Entropy Measure 1(EM1)and Entropy Measure 2(EM2).The latter is operated with NDT while Mission Success Rate(MSR)should be further derived based on NDT results in the former.
It is important to notice that though this study only utilizes NDT to illustrate the proposed ID method with entropy measurement, other common effectiveness indices (e.g. number of loss) can also be applicable to this method and the implementation procedure should be similar. Even if one effectiveness index is not discrete(e.g.damage rate),its results can be simply classified to several levels and then can be applied into the proposed methodology in the same way.
This paper is organised as follows:The next section will discuss the concepts and principles of MSS, ID and Entropy;After that, the proposed entropy-based ID methodology is illustrated in Section 3 where four main steps and two EM schemes are given; Genetic algorithm, a search method, is introduced in Section 4 for the following optimization work;In Section 5, a penetration SoS confrontation case is studied for method validation with both schemes and this paper is finally concluded in Section 6.
2. Fundamentals
2.1. Mission success space
In an M-on-N engagement scenario,there are M Design Variables (DVs) (V ⊂RM,vi∈V,i=1,2,...,M) and N effectiveness indices (U ⊂RN,uj∈U,j=1,2,...,N) considered in the studied system which initially form an M×N dimensional Effectiveness Index Space (EIS=(V,U)). MSS is a part of EIS and the other part is Mission Failure Space (MFS). The relative positions of two sub-spaces in EIS can give the MSC to judge whether design points in EIS can meet the requirement of mission success. In order to quantify Mission Success Condition(MSC),Mission Success Function(MSF)is defined in Ref.4as a function of (vi) to represent the success criterion thus it should be the boundary of MSS and MFS.Then,MSC can be summarized by the comparison of ujand the corresponding value of MSF, as:

where fE,jdenotes Mission Success Effectiveness (MSE): if fE,j=1, the mission is successful; otherwise, fE,j=0, the mission fails. fF,jrepresents MSF value. The inequation‘‘uj(v1,v2,•••,vM)≥fF,j(v1,v2,•••,vM) ” is the MSC showing the judgement of mission success. Noting that the correlation of fF,jand ujin MSC is not necessarily ‘‘larger or equal” for different effectiveness in practical cases. Here, for MSCs used in the case study(Section 5),ujis assumed to be larger than or equal fF,j. Lastly, based on above concepts, MSS should consist of all the design points in EIS that meet every MSCs of different effectiveness indices uj.Thus,MSS can be given a pointset definition mapping a relation from equipment capabilities to mission success4:
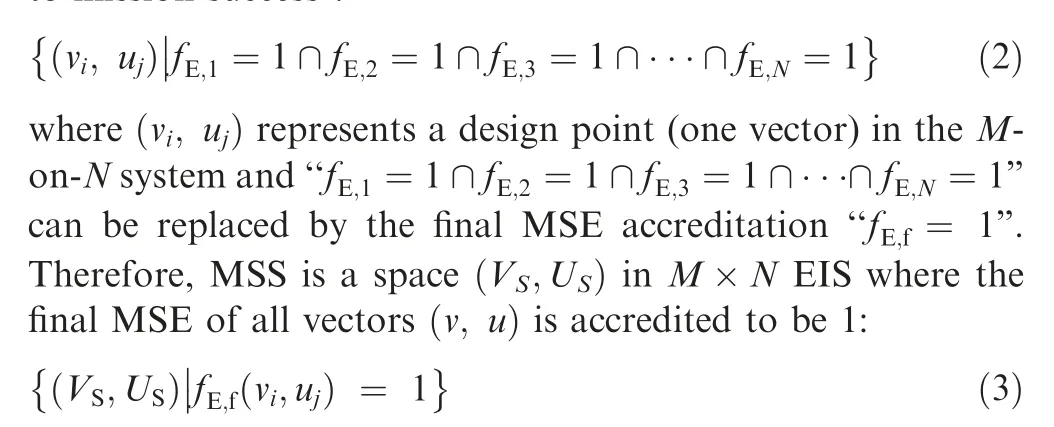
where S means mission success.
As EIS is divided into only two spaces where MSFs locate in the middle, the design of mission success usually assumes that every effectiveness ujhas monotonic relationships with all variables viwhich reflects the assumption and characteristic of the Monotonic Index Space(MIS).15MIS represents a capability index space of an equipment with monotonic relationships assumed between the capability indices and the system requirement measurements. In this paper, it is assumed that the capability design space V is an MIS thus VS, a sub-space of V , should also be an MIS.
Fig. 1 demonstrates the basic MSS inverse design process from entropy calculation (right rectangle) to the studied Mon-N system (left rectangle, represented by (V,U), the EIS,).As mentioned above, there are two different EM schemes.Both are explored in the case study (Section 5) for the MSS ID and optimization. The next two subsections will discuss the theories of MSS ID and Entropy to serve the proposed optimal MSS ID method.
2.2. Inverse design of MSS using K parts
In Ref.2, Inverse Design refers to a ‘‘Normative Forecasting”method and is equivalent to an assessment process from equipment capabilities to system architecture. Differently, the proposed entropy-based MSS Inverse Design means using the entropy measurement of SoS combat effectiveness information and success-oriented evaluation to design the MSS of equipment capabilities in a certain SoS mission.
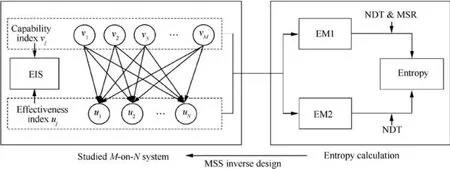
Fig. 1 Relation between entropy and studied system based on MSS concept.
In Refs.5,6, MSS ID has been explored by analysing the Gaussian fitting performance of CSS results.K parts are noted in these papers as a design point/line/surface (vi, fF,j) in MSS and expresses MSF in a simpler way which determines the change of MSCs with regards to DVs in V. Namely, when these variables reach to K parts, success criterion will become easier (or harder) for mission effectiveness (uj) to meet. This underlines the interests of exploiting algorithms/schemes to select K parts. It is noted that, in this paper, the entropybased ID schemes are totally different from the K-part schemes in Refs.5,6. K-part schemes are using different algorithms to obtain K-part candidates in V while, in this study,the EM schemes are to provide alternative approaches for candidate performance, i.e. evaluation criterion of choosing the best design candidate.
The design on K parts directly determines the MSS size in the whole (V,U). Therefore, K-part (MSF) design is a practical and efficient way of MSS design.In Ref.4,only one aircraft capability index is considered (M=1) to analyse its effect on NDT (N=1), thus it is a 1-on-1 engagement scenario. Obviously,the K part is a design point in the whole EIS of the scenario since NDT is discrete.If the considered ujis continuous,MSF can be directly designed by a formula of DVs instead of K parts (for example quadratic function and S-curve MSF in Ref.4). A 2-on-1 scenario is studied in Refs.5,6where K part becomes a line to separate the 2-dimensional V for each value of NDT but, as mentioned, all previous MSS ID studies are based on the CSS feature analysis. In this paper, following the same K-part design thinking in V, two entropy measurement schemes are proposed and finally the best design is searched in each EM scheme. Furthermore, as will be shown in Section 5,the best design results in this paper are compared with that of the former CSS-based studies.
2.3. Information entropy
The concept of information entropy was introduced by Claude Shannon as a part of his theory of communication.16As mentioned, entropy is a measure of the unpredictability/random ness/uncertainty, or equivalently, of its average information content. If an event is very probable (i.e. very small entropy),it is no surprise (and generally uninteresting) when that event happens as expected; hence transmission of such a message carries very little new information. On the other hand, if an event is unlikely to occur,it is much more informative to learn that the event happened or will happen and the corresponding entropy value is tend to be larger.14
It is well-known that entropy tends to increase physically or informatively while rules/laws are usually utilized by people to reduce the entropy (disorder/randomness) of a system. In this study,we first collect the effectiveness data from the SoS combat system (based on large numbers of samples), which comprehensively reflects the studied combat situation in the simulated SoS confrontation. Then, we use the minimum entropy measurement to find the optimal MSS which is basically a data-analysis-based approach, like the various criteria4-6,10and probability distributions7,9methods for CSS evaluation studies.A larger entropy value means less information contained in the analysed data, and a smaller entropy value means more information contained or the related probability distribution is more focused.17In Refs.4-6,only the general Gaussian probability distribution is studied; but in this study, as will be discussed, the probability (P) is processed for every sample data (using NDT data in the case) to finally compute the entropy of the MSS design candidate which quantifies the holistic information situation. Therefore, the minimum entropy would represent that the MSS design can make the holistic probability distribution the most focused according to the collect effectiveness data from a certain combat mission.
The general entropy formula is a simple sum operation with Logarithm14,16:
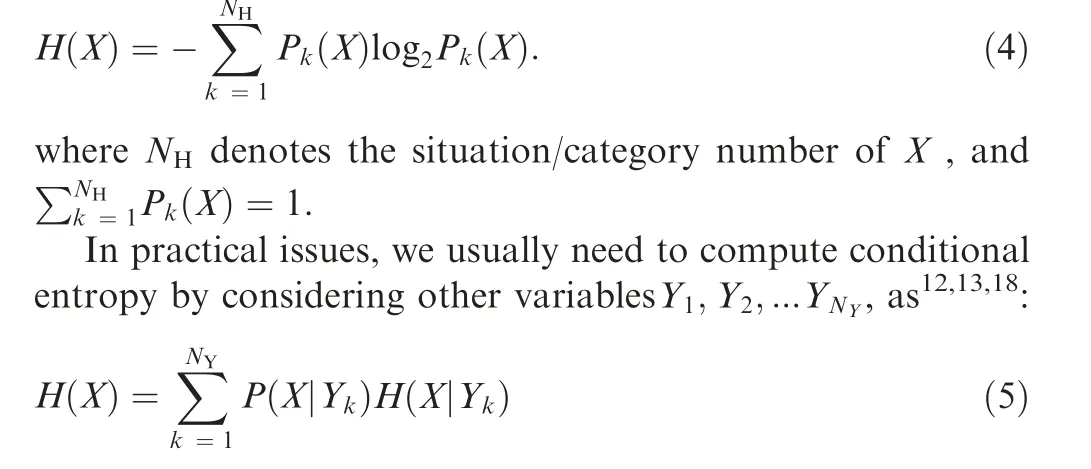
In this study only two situations are considered: MSS and MFS, i.e. the situation number NY=2. However, for H(X|Yk) calculation, there are two different schemes considered in this study.As will be discussed in Section 3,one is using MSR results based on the different MSCs in MSS/MFS while the other is directly using certain NDT results of each sample.
It is important to notice that,no matter in which scheme,if we do not consider the MSS/MFS classification condition for the final entropy measurement(i.e.using MSR or NDT results for all sample points in V), the entropy value will become larger compared with the proposed two EM schemes (which are using conditional entropy).13Therefore,this paper tries to find the MSF design to separate V into MSS and MFS according to the minimum entropy value,which means the minimum uncertainty(or minimum information transmission)in the effectiveness results obtained from the SoS combat simulation.
3. Entropy-Based MSS Inverse design methodology
Following the MSS ID theory proposed in Ref.5, this Section will illustrate the whole MSS ID procedure and two different EM schemes for the entropy calculation in the MSS ID methodology.A simple scheme of MSS ID has been discussed in Ref.4where bilateral quantiles are found to give the K parts for new MSS design. Further, the Ref.5utilized the exhaust algorithm to find the best design for MSS that needs a design loop to finish the process. Here, we use an optimization algorithm to search the optimal MSS design with entropy value as the unique objective.
3.1. Inverse design process
Fig. 2 depicts the process of entropy-based MSS ID and optimization which includes two main parts: (A) Modelling and Simulation for sample data collection (upper rectangle); (B)MSS inverse design and optimization (lower rectangle). It is noted that, in the data collection, an inner simulation loop is usually needed for each sample point to comprehensively and accurately calculate ratio indices4-6,19since uncertainty may be considered by setting probabilities in the studied system. Both EM schemes presented in this paper are based on ratio indices because entropy measures uncertainty by using probabilities.12-14,16,18
Based on EM schemes and optimization algorithm, four steps in the proposed MSS design and optimization process are sequentially introduced as follows:
(1) Definitions of mission scenario, DVs (vi) and effectiveness indices (uj)
Initially, the mission scenario should be confirmed which includes combat forces,operation equipment,combat environment etc.In addition,basic evaluation requirements,i.e.viand ujas well as their boundary values,also need to be determined before they can be modelled, simulated and sampled in a simulation platform.
(2) Modelling and Simulation (M&S) of SoS combat for data collection
The second step is to model the SoS confrontation for evaluation. Many different methods can be applied into the combat effectiveness evaluation: Analytic Hierarchy Process(AHP),20,21mixed-integer and nonlinear method,22,23Multidisciplinary Design Optimization (MDO)24; however, M&S based method is more common for SoS effectiveness evaluation since it provides a powerful alternative to the experimental science and observation when phenomena are not observable or when measurements are impractical or too expensive.5,6,25
A simulation loop should be exercised for NDT results(sample data) collection. Sample work can be uniform or non-uniformed. The former evenly samples in the DV space(V)while randomness is utilized to obtain numerical effectiveness results in the latter. Monte Carlo, a non-uniformed sampling, is utilized in the case study.
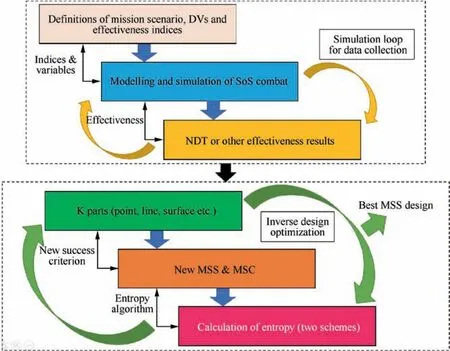
Fig. 2 Entropy-based MSS inverse design and optimization.
(3) K-part selection pool in V
Before MSS ID and optimization, K-part candidates should be defined and the ranges of variables for representing these candidates need to be determined for the following optimization work. In Ref.6, two K-part schemes, quadratic contour lines of MSR results and neural network pattern recognition, are utilized to define the K-part candidates of‘‘NDT = 5” while, in this study, only contour-based scheme is considered because the design ranges of the other way in optimization is very small.
(4) MSS optimization based on EM schemes
In the final step,an optimization algorithm(GA in the case)is used as a search algorithm to find the optimal MSS design according to two different EM schemes. One scheme is using NDT values to derive MSR while the other only considers NDT results. The Section 3.2 will discuss two EM schemes in detail.
3.2. Two entropy measurement schemes
As discussed, the entropy measures the information uncertainty of the studied system via the capability-effectiveness data collection. But, the calculation method of entropy in the SoS oriented effectiveness evaluation should not be unique because usually quite a few effectiveness indices are considered or need to be evaluated in a SoS combat mission. Moreover,some of indices can be further divided into several value ranges with specific labels (by using a fuzzy evaluation model, for example). In this paper, two feasible approaches of EM are presented and compared (shown in Fig. 3). Both are using the collected NDT results in a DV space but only EM1 considers MSR to derive the final entropy.
3.2.1. EM1
Before giving the entropy equation of EM1, we may have to define how to compute MSR since it is the base for EM1 derivation. MSR value is an effectiveness which varies with DVs in V and it can be obtained by a simple rate form in the inner simulation loop, as:
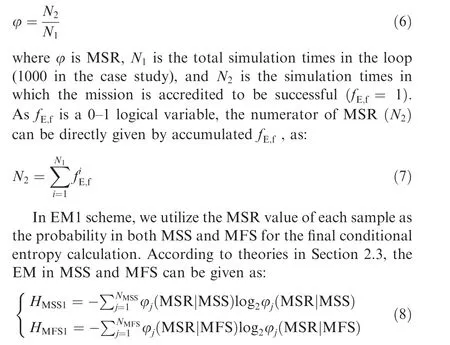
where the sum of NMSSand NMFSshould be the total number of samples (NS) in the simulation data collection (Step 2 in Section 3.1). Noting that the MSC is different between HMSS1and HMFS1as we are designing a K part to separate EIS into MSS and MFS. For example, in the case study which utilizes NDT values to calculate the entropy, and initially we are only designing the K part of ‘‘NDT = 5” (see Section 5.2). That means, in MFS the success condition is ‘‘NDT = 6” but the condition is ‘‘NDT ≥5” for the samples in MSS. Therefore,φj(MSR|MSS)and φj(MSR|MFS)in Eq. (8) are actually using different data sets due to the different success conditions.
Finally, the total entropy of EM1 scheme is given as:

3.2.2. EM2
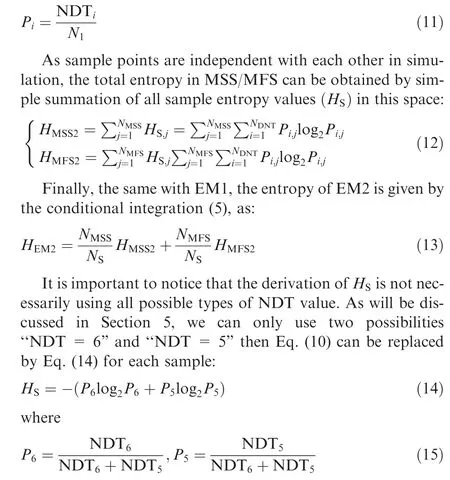
In the last scheme, entropy is obtained by MSR value of each sample in both MSS and MFS. In contrast, there is no MSR derivation in EM2 but just using NDT results for each sample(in the inner simulation loop).Assume there are NNDTtypes of NDT values in a SoS combat,then the entropy of every sample in V based on NDT results can be given as:

where Pimeans the probability of‘‘NDT=i”in the inner simulation loop (totally N1simulation times). Mark the times of‘‘NDT=i” in N1as NDTi, then

Fig. 3 Two entropy measurement schemes.
4. Search method - Genetic algorithm
Genetic Algorithm is a search/optimization tool for this study which is loosely based on natural evolution. In general, the algorithm consists of a population of individuals, All individuals represent potential solutions and are controlled by a set of bio-inspired operators which typically include mutation,crossover and selection. At any given generation, the Parent population is processed by the operators to produce a Children population. The combined Parent and Children population is evaluated by the objective function,and individuals in the population are assigned fitness values, which determine their survivability going into the next generation.26
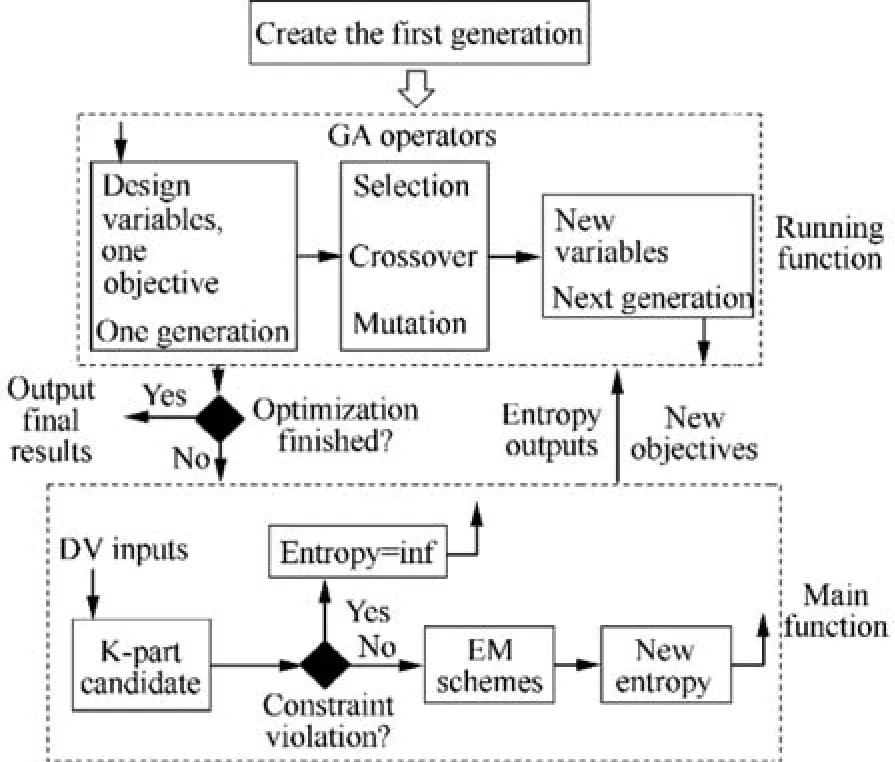
Fig. 4 GA based MSS ID and optimization procedure.
This study utilizes a GA tool,‘‘gaoptimset”,in MATLAB27which is a controlled, elitist genetic algorithm [a variant of Non-dominating Soring Genetic Algorithm (NSGA-II)28].NSGA-II applies a fast non-dominating ranking method and an extra niching operator to deal with the optimization problems.29The main advantage of this NSGA-II is the efficiency and ability to get a more diverse population in searching.28,29The niching operator employs a crowding distance measure,which can effectively sort solutions based on their crowding distances.
Different from Ref.6, the optimization problem in this study is not multi-objective but just entropy itself. Thus, there is no Pareto-front results generated by GA and fitness results of the final generation can be directly used to determine which K-part design is the best in the optimization.
4.1. Optimization constraints
There are two constraints set in the entropy-based MSS optimization:(A)the K-part functions in selection pool must have at least one intersection with the DV space (V, 2-dimentional in case study); (B) According to monotonic assumptions,15in the DV space, the studied ujshould have monotonic relations with every DV vi. Thus, the trend of partial differentiation of K-part candidate should always be the same for each DV in the V , non-positive or non-negative.
For example, in the case, there are two DVs: Radar Cross-Section(RCS)and combat velocity(vkill).As a common sense,MSR value(or kill rate)will go down with the increasing RCS;thus,the K-part candidate should have the monotone increasing relation with RCS in V (partial differentiation is nonnegative). Therefore, for seven contour K-part candidates in Section 6.3 of Ref.5, only No. 2, No. 3 and No. 7 candidates are feasible in optimization problem. Other four K parts violate the second optimization constraint in this study.
4.2. Optimization procedure
As shown in Fig.4,to start the MSS design optimization process,the first generation of chromosomes needs to be randomly created after setting the GA operator parameters including selection,crossover and mutation fractions.In the commercial GA MATLAB tool,27users can set different values to these parameters but here default values of these parameters are used for the sake of convenience, e.g. selection fraction is 0.8, migration fraction is 0.2 and crossover fraction is 0.8.
In the running function (upper rectangle in Fig. 4), a new generation of chromosomes which maps the variables can be created by the three operators after ranking the fitness of the current generation (parents). If the iteration times does not exceed the pre-set maximum generation number, individuals of parents should go to the main function until reaching the maximum number.
In the main function (lower rectangle in Fig. 4), the fitness of the new generation (children) should be obtained by the Gaussian fitting model for the next selection of chromosome population (children of children). However, before running that model, the K-part candidate which is determined by design variables should be checked by two constraints in the Section 4.1. If two constraints violate this new design, their objectives will be assigned the infinite values and this design will stay at the bottom of the fitness ranking in the new generation, i.e. hard constraints processed for both which must be satisfied by any feasible solution to the MSS ID. If not, this design can be further used to calculate its information entropy via EM scheme models and the corresponding entropy value is given as the new objective of this design in GA optimization.

Fig. 5 Transient diagram of penetration simulation scenario mission.
5. Case study
5.1. Mission Scenario, Modelling and simulation for data collection
This section illustrates the case study to validate the proposed entropy-based MSS optimization methodology with two variables. As shown in Fig. 5, the red side includes one Electronic Warfare Aircraft (EWA, Jammer) and four fighters while the blue side includes three ground radar defence systems and six Military Targets(MTs).The scenario is aircraft penetration mission(T)confronting with radar systems.Only MTs are the killing targets of fighters but they need penetrate the defence of radars equipped with the Surface-to-Air Missile (SAM).Except for the key design variable of fighters,Radar Cross Section (RCS), combat velocity (vkill) is another significant factor for the mission success of penetration thus should be involved in the aircraft capability variable for the SIS design.The aim of this case is to collect effectiveness data (e.g. NDT) of the aircraft fleet (blue side) and then use them to do the MSS ID and optimization. The transient diagram of T in simulation is shown in Fig. 5.
There are 6 agents built on the simulation platform, Any-Logic, for this case study: fighter, jammer, air-to-surface missile, radar defence system, SAM and MTs. The modelling details of them can be found in the Sections 5.1 & 6.1 of Ref.5, no more descriptions here. Differently, in order to pursue higher accuracy, the total number of design points (samples) in this two-variable case was increased from 1000 to 2000. The input values of two variables originate from Monte Carlo sampling and their data ranges are shown in Table 1.

Table 1 Input of two design variables.

Table 2 Variable ranges for GA optimization.6
The simulation experiment is exercised on the 2000 sample points one by one. Different from Refs.5,6, where two simulation cycles are exercised for CSS derivation of each sample,only one simulation loop (with jammer) is needed here for the proposed entropy-based ID and optimization because,EM schemes are using NDT/MSR results rather than CSS(which needs to simulate two different scenarios for these 2000 samples).
5.2. MSS optimization results
In this paper, all GA optimization works for different EM schemes are running for 50 generations with 100 individuals which cost around one and half hours.Moreover,for the sake of convenience, K-part candidates of ‘‘NDT = 5” are represented by specific functions in V. Since there are two design variables in V,the K part can be directly quantified by a quadratic function ‘‘vkill= f(RCS)”: a0is the quadratic coefficient,b0is the primary coefficient and c0is the constant term. After that, optimization works are exercised based on the ranges of DVs from Ref.6, see Table 2.
After the GA optimization, the optimal design of K-part for‘‘NDT=5”can be automatically obtained by the GA tool because there is only one objective in the optimization problem. Best design results from two EM schemes are presented below and two EM schemes are then compared.
5.2.1. EM1 results
As discussed,EM1 is using MSR results to calculate the corresponding entropy values of K-part candidates. A feasible Kpart candidate in optimization is actually a possible design of the separation line/curve between two success conditions:‘‘NDT=6”and‘‘NDT≥5”because we are searching the best K part for the condition‘‘NDT=5”.Therefore,‘‘NDT=5”data should be added in Eq. (6) (MSR calculation where N2=NDT6+ NDT5)for the samples at the bottom-right side of this K-part line but,not included in the other part of design space (where N2=NDT6for the samples). Namely, when the MSS design point locates in the bottom-right side of K part candidate, its MSC should be ‘‘NDT≥5” rather than‘‘NDT = 6” because the aircraft capabilities (RCS and vkill)are relatively low and we need to consider a lower success condition.

Table 3 MSS design results in two EM schemes.
After running the EM1 based GA optimization for 50 generations,the best design candidate can be found with the minimum entropy value in all feasible designs (which compute entropy value using Eqs. (6)-(9)). As shown in Table 3 and Fig. 6, the entropy value of the best design in EM1 is 371.8686.Moreover,all three contour-based design candidates and the best design using CSS in Ref.6are depicted in Fig. 6 with their entropy values (their coefficients are summarized in Table 3). The smaller entropy the better; thus, the order of these 4 MSS design candidates should be ‘‘best CSS design > No.2 line > No.3 line > No.7 line”.
It’s noted that the Nos.2&3&7 K-part designs(as well as the best CSS design) are directly got from the Ref.6, while the best EM1 & EM2 designs listed in Table 3 are searched using the proposed methodology in this study (under different EM schemes). However, for both EM schemes, the general optimization procedure would be the same, as discussed in Section 4.2. And for any feasible K-part design under the same EM scheme,there is no difference for their entropy calculation methods, as given in Section 3.2.
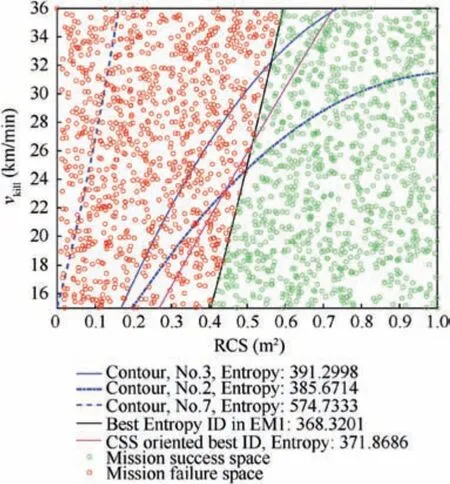
Fig. 6 Optimal MSS design of ‘‘NDT = 5” in EM1.
For example,Fig.6 shows the best EM1 design and the corresponding sample distributions in MSS/MFS. First, we can get the values of a0, b0, and c0from the GA operators during the optimization and then, MSS and MFS would be clearly separated in the whole 2D variable space.The next step would be calculating its entropy under the EM1 scheme:basically,we have 2000 samples so they are processed one by one but, as mentioned above, φj(MSR|MSS) and φj(MSR|MFS) are using different NDT data sets because the MSC is different between MSS and MFS. Furthermore, as given by Eq. (8),the entropy values of samples in the same space (MSS or MFS) are summed up to give HMSS1and HMFS1(995 samples in MFS and 1005 samples in MSS). Lastly, the final entropy of this K-part design is computed by Eq. (9), as 368.3201.
For other K part designs under EM1, the general entropy calculation method would be the same but samples in MSS/MFS would vary.
5.2.2. EM2 results
For the EM2 scheme, as given by Eqs. (12)-(15), every MSS design candidate for ‘‘NDT = 5” can be given new entropy values based on the same collected NDT data. But in this scheme, there is no MSR calculation thus no need to consider different success conditions. That means for all 2000 samples,they need to use both NDT6and NDT5data to compute the entropy, no matter in MSS or MFS. Based on that, GA optimization is running also for 50 generations and the best MSS ID in EM2 is obtained. As shown in Table 3 and Fig. 7, its entropy value in EM2 is 619.2267. Generally, for the same K-part design, the entropy value in EM2 is much larger than that in EM1 because EM2 is using more data of NDT (both NDT6and NDT5for all sample points). According to the entropy values in the final column of Table 3, the order of 4 MSS design candidates from Ref.6should be ‘‘best CSS design > No.3 line > No.2 line > No.7 line”.
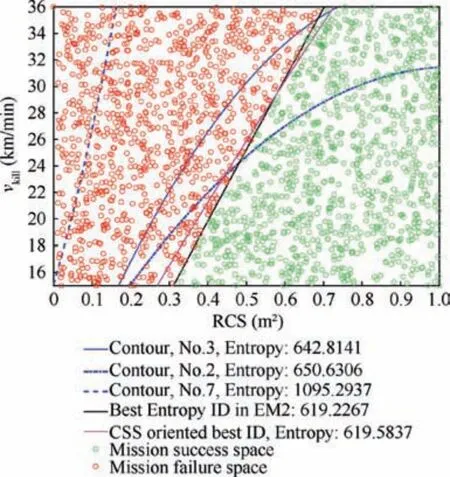
Fig. 7 Optimal MSS design of NDT = 5 in EM2.

Table 4 MSS best design results in different EM methods of EM2.
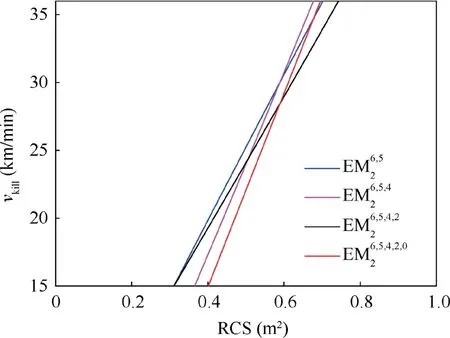
Fig. 8 Optimal MSS designs of different EM methods in EM2.
5.2.3. Comparison between EM1 and EM2
It is interesting to notice that the order of 4 design candidates from Ref.6in EM2 is the same with that in the CSS-based approach,which can be found in Tables 3&6 of Ref.6.Moreover,as shown in Fig.7,the CSS oriented best ID(pink line)is very close to the best design in EM2 (black line); therefore,they can be inter-validated in a certain degree though they are using totally different methods and effectiveness data.data since,as discussed in Section 3.2,the red design points in Fig.6 are only using NDT6data for the MSR calculation.But EM2 schemes is using all data of NDT6and NDT5for entropy quantification (see Eqs. (14)-(15)) which can include more information from the SoS combat simulation. Therefore,EM2 is preferred in this study.

5.3. Different measurements in EM2
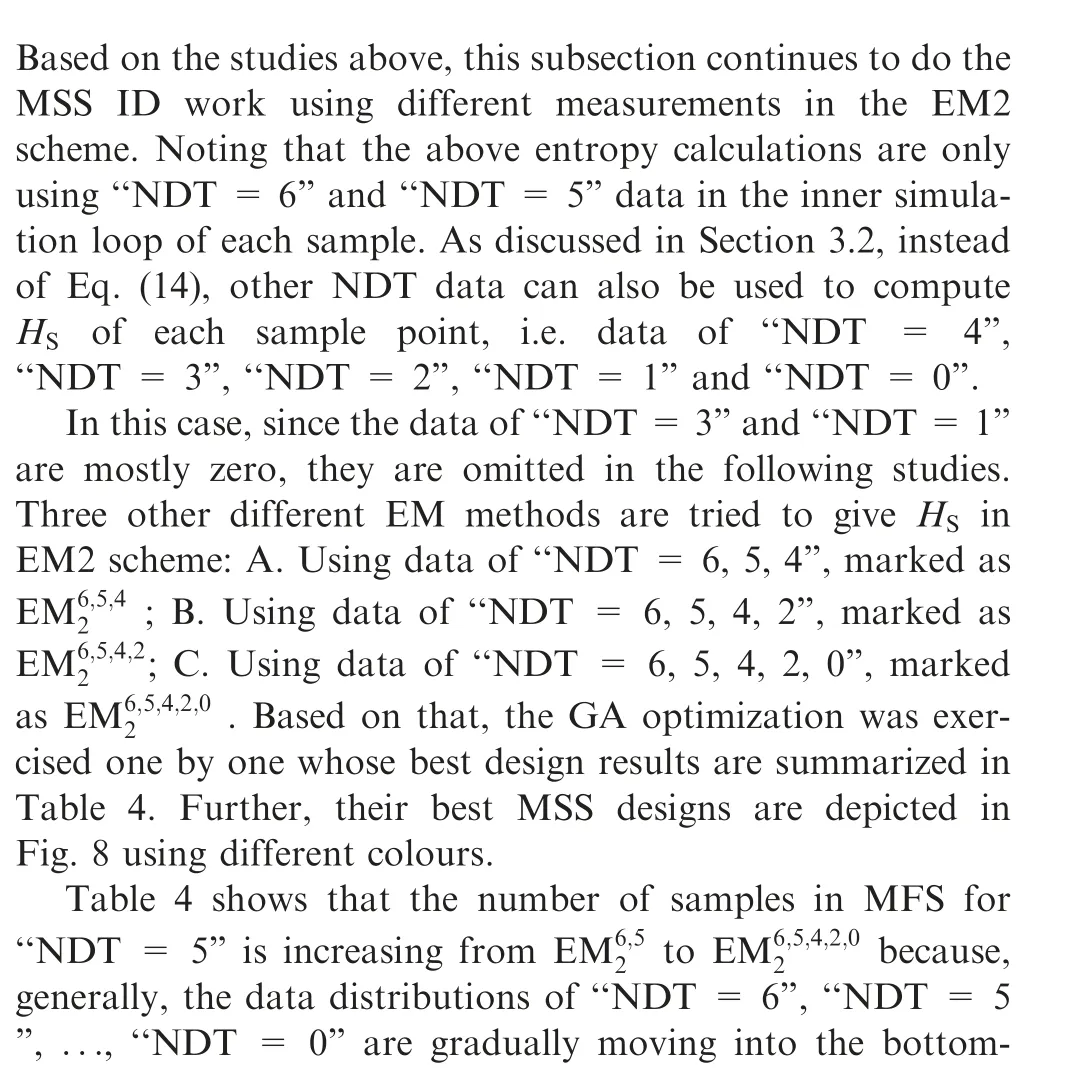

Table 5 Entropy values in CSS-based designs and different EM methods of EM2.


6. Conclusions
Based on the former MSS studies, this paper tries to propose an entropy-based MSS design and optimization method for aircraft SoS confrontation missions. The general MSS design procedure is illustrated and two feasible EM schemes are discussed and compared. Both schemes are using the collected NDT results but MSR is only calculated in the first scheme,not in the second. After that, the used search Genetic Algorithm (GA) is introduced with the constraint setting and the general optimization procedure. In the simulation case, the GA optimization work is exercised for both schemes and EM2 is suggested after the comparison. Moreover, for the sake of generalization, different EM methods in EM2 are also operated in GA optimization and their best designs demonstrate similar performance on entropy. However, the best EM method is finally given according to the minimum summation of the entropy values from all EM methods in EM2.
Declaration of Competing Interest
The authors declare that they have no known competing financial interests or personal relationships that could have appeared to influence the work reported in this paper.
Acknowledgement
Mr Yuan Gao would like to thank Dr. George Gordon(University of Nottingham) for valuable discussions that preceded the preparation of this paper.
 CHINESE JOURNAL OF AERONAUTICS2021年12期
- CHINESE JOURNAL OF AERONAUTICS的其它文章
- Nonlinear resonance characteristics of a dual-rotor system with a local defect on the inner ring of the inter-shaft bearing
- Failure mechanisms of bolted flanges in aero-engine casings subjected to impact loading
- Synchronized perturbation elimination and DOA estimation via signal selection mechanism and parallel deep capsule networks in multipath environment
- Improving seeking precision by utilizing ghost imaging in a semi-active quadrant detection seeker
- A high dynamics algorithm based on steepest ascent method for GNSS receiver
- Relevant experience learning:A deep reinforcement learning method for UAV autonomous motion planning in complex unknown environments
