Diagnostic and modelling investigation on the ion acceleration and plasma throttling effects in a dualemitter hollow cathode micro-thruster
Zhongxi NING, Chenguang LIU, Ximing ZHU, Yanfei WANG, Bingjian AN,Daren YU
Plasma Propulsion Laboratory, Harbin Institute of Technology, Harbin 150001, China
KEYWORDS Extended fluid model;Hollow cathodes;Micro-thruster;Plasma contactor;Plasma throttling effect
Abstract Hollow cathode discharges are widely used as neutralizers for the electric propulsion systems and recently developed into micro-thrusters for the small satellites. In this work, a dualemitter hollow cathode thruster is developed, which can be operated in two different modes—the neutralizer mode and the micro-thruster mode. For characterizing this kind of new device, the Langmuir probe, Faraday probe, and retarding potential analyzer are used to determine the electron temperature, electron density, ion flux, and ion energy distribution function. The operating parameters, including the thrust, and specific impulse, are also measured. A two-dimensional self-consistent extended fluid model is employed to calculate the spatial distribution of plasma parameters and the fluid field of electrons in the region around the emitters.By comparing the diagnostic and modelling results,it is found that the change in the electric field and ionization zone is the essential reason for the different performances of the device in the neutralizer and micro-thruster modes.Variation in the electric field leads to an ion acceleration effect in the micro-thruster mode;moving of the ionization zone raises the plasma pressure in the orifice region of the hollow cathode,and thus leads to enhanced plasma throttling and gas expanding effects. By analyzing the above mechanisms,the possible methods for improving this kind of hollow cathode micro-thruster are discussed.
1. Introduction
The hollow cathode discharge is a kind of widely-used electron source. For example, in the electric propulsion systems, e.g.,ion and Hall thrusters,the hollow cathode neutralizers provide electrons for potential compensation and plasma discharge sustaining.1-3In addition, hollow cathodes serve as plasma contactors on tethered satellites to generate electrical power,and on space station for control of potential.4-7Recently,hollow cathode micro-thrusters are developed for small satellites commercial purposes and science missions,8,9such as earth observation and space telescope reconfiguration.10,11And propulsion systems are vital for small satellites for atmospheric drag compensation, orbit change and raising, precise attitude control, formation flying as well as deorbiting capabilities at the end of the mission life in order to comply with orbital debris mitigation requirements.9,12
Patterson and Foster13investigate a micro-thruster that utilizes a screen grid and an accelerator grid to accelerate the ions generated by a hollow cathode. Lamprou et al.14have studied a thruster system designed for small satellites, in which a hollow cathode, a flow control unit, and a power processing unit are included.Grubisic and Gabriel15make two micro-thrusters based on T5 and T6 hollow cathodes,which can reach specific impulse of 430 s and 550 s, respectively. They also make a research on the thrust production mechanisms of hollow cathode thrusters.16,17In the above researches, it is realized that both the electrostatic acceleration and the electro-thermal gas expanding can play a role for the production of thrust.
In this device,one emitter is mounted on the outer plate of the device and another is inserted into the inner tube. In this way, the device can be operated in both neutralizer mode(N-mode)and thruster mode(T-mode)by changing the electric potential of the two emitters.The plasma parameters e.g.electron temperature and density,ion energy distribution,and ion flux are measured by using a Langmuir probe, a Faraday probe, and a Retarding Potential Analyzer (RPA), as well as calculated by using a two-dimensional self-consistent extended fluid model.18The performance parameters of the device e.g.current, thrust, and specific impulse are obtained at the same time. Compared to the Grubisic and Gabriel’s works in which ions acceleration makes an effect on thrust generation in plume mode with relatively large discharge oscillation, ion acceleration plays an important role in thrust generation in a steady discharge state in this research. An advantage of hollow cathode thruster is that it can provide a continuous thrust with a low power consumption. In addition, it can be operated as a plasma contactor for low earth orbit tethered satellite system,19,20and at the same time it also can be operated as a micro-thruster on the tethered satellite for attitude control to ensure the tension of the tether.21And a possible application is that it can be used a plasma contactor to compensate the potential difference during the docking process of two aircrafts,22and at the same time it can also be used as a microthruster for attitude control.
Sections 2 and 3 introduce the experiment and numerical model,respectively.The results are given in Section 4.Section 5 discusses the possible method for improving the present electric propulsion systems by using the new dual-emitter hollow cathode and potential application of this device. A conclusion is drawn in Section 6.
2. Experiment
2.1. Hollow cathode thruster
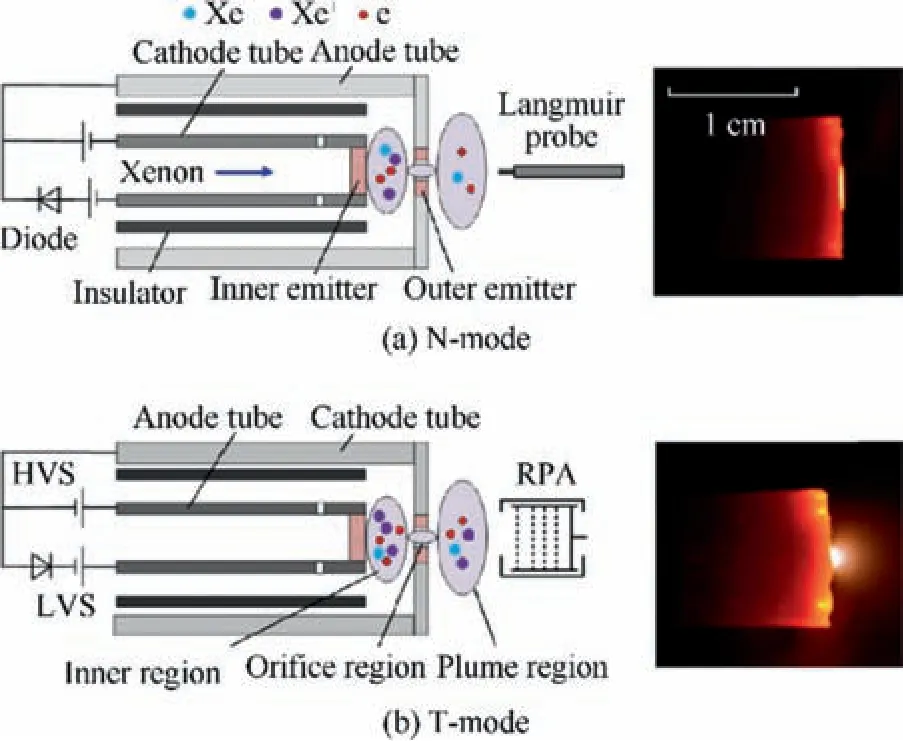
Fig. 1 Schematic diagrams of Dual-Emitter Hollow Cathode(DEHC).
The structure of this dual-emitter heatless hollow cathode is shown in Fig. 1. It consists of a ceramics insulator, an inner molybdenum tube, an outer stainless-steel tube, a tungsten plate, and inner and outer emitters.The two emitters are both made of barium tungsten oxide (BaO-W) with a low work function (1.67 eV).23The electron density is ~1014-1015cm-3in the ionization zone of xenon gas discharge (purity 99.999%). The diameter and thickness of the two emitters are 3 mm and 1.5 mm; the diameter of the orifice of the outer emitter is 0.5 mm.In the Fig.1,the right pictures show the discharges at current 1 A and gas flow rate is 5 sccm (1 sccm=1 mL/min). A Langmuir probe is located at the axial position of 5 mm from the exit; The Faraday probe, RPA,and optical fiber are faced to the orifice exit at a distance of 1 cm.
Considering the limitation in the microsatellite power, the emitters made of BaO-W are applied to enable working at a low power. These emitters can keep a relatively high electron emission density at relatively low temperatures,compared with other materials e.g. LaB6.When the emitter is installed on the outer tube as a cathode,an electric field from the inside to the outside can be established, which accelerates the ions and improves the performance of the micro-thruster. The gas is supplied through the cathode tube, and then flows through the holes in the cathode tube wall. In this way, the gas flows on the side of the gas tube and then goes through the orifice.
The micro-thruster is developed based on a heatless hollow cathode. A High-Voltage Source (HVS, 0-500 V, 0-0.3 A) is used for ignition and a Low-Voltage Source (LVS, 0-50 V,0-10 A) is used to sustain the discharge. The hollow cathode thruster needs an operation current of about 1-2 A and an operation voltage of about 30 V to sustain the discharge.
As seen in Fig. 1, the outer tube is used as anode and the inner tube is cathode in the N-mode, which are exchanged in the T-mode. There are three discharge regions: inner region,orifice region, and plume region; there is a very light plasma plume in the T-mode as seen in the picture.The pressure measurement point is at the inlet end of the gas supply,8 cm away from the orifice for a convenient installation, and pressure in hollow cathode is measured with a ZJ-1C type thin film capacitance gauge in the range of 20-20000 Pa(Chengdu Zhenghua Electronic Inc.).Back pressure is measured by J-27 wide-range ion-gauges(Chengdu Zhenghua Electronic Inc.).In this work,the back pressure is 0.01-0.1 Pa.
2.2. Langmuir probe
Langmuir probes are frequently used in the measurement of plasma parameters including the electron density, electron temperature, and plasma potential.24-27Here a home-made Langmuir probe located at 5 mm away from the orifice exit is used to measure the electron density and electron temperature in the plume region as done in Ref. 28. It is designed to measure the plasma parameters in the plume of electric thrusters and is made up of a ceramic tube and a tungsten wire with a diameter ~0.5 mm.The tungsten wire is inserted into a ceramic ferrule and the outer diameter of the ceramic tube is 1 mm.An oscilloscope is applied to record the voltage UABbetween the points A and B (as seen in Fig. 2) and the voltage UACbetween points A and C.
By analyzing the second derivative of the probe current with respect to the probe potential d2I/d2U, we determine the Electron-Energy Distribution Function (EEDF) in the plasma,29which can be considered as a two parameters function in the plume region of the device in this work, as shown by equation30:
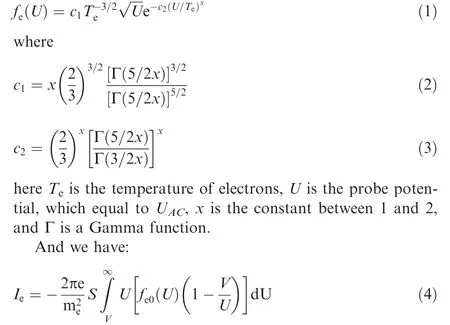
where e is the elementary charge and

here φpis the plasma potential,meis the mass of the electron,S is the area of the probe tip. According to the above equations, we can fit the theoretical I-V curve to the experimental I-V curve as shown in Fig. 2. The values of Teand electron density necan be obtained by the least square method. For the Langmuir probe measurement,the uncertainty is relatively large under conditions with low plasma densities, because of the‘‘thick sheath”(compared with the probe tip radius)problem.24,31In addition, the influence of the scanning voltage on the plasma is a source of uncertainty. The uncertainty in this measurement is estimated to be ±20% for neand ±10% for Te.29,32
2.3. Retarding potential analyzer
RPA is widely used to measure ion energy distribution of ion beam,33especially in the electric propulsion systems.34,35A home-made RPA located at 2 cm away from the orifice exit are used to measure the ion current and ion energy distribution function like in Ref.36.A circuit diagram for ion energy measurement is shown in Fig. 3. The RPA consists of four grids,including a floating grid, an electron repelling grid, an ion retarding grid, and an electron suppression grid. The floating grid minimizes plasma perturbations caused by the presence of the probe.The electron repelling grid is biased to-24 V relative to facility ground in order to prevent plasma electrons from reaching the collector. The electron suppression grid is also biased to -24 V relative to facility ground in order to repel any secondary electrons emitted by the collector and promote the recollection of these secondary electrons by the collector in order to remove the effects of secondary electron emission from the I-V characteristic. The ion retarding grid is biased positive relative to the ground in order to impede the motion of the incident ions,and thus filter the ion population based upon directed kinetic energy per unit charge.37An experimental I-V curve and a fitting I-V curve are shown in Fig. 3, and the distribution function of ion energy is obtained by deriving the I-V characteristics.
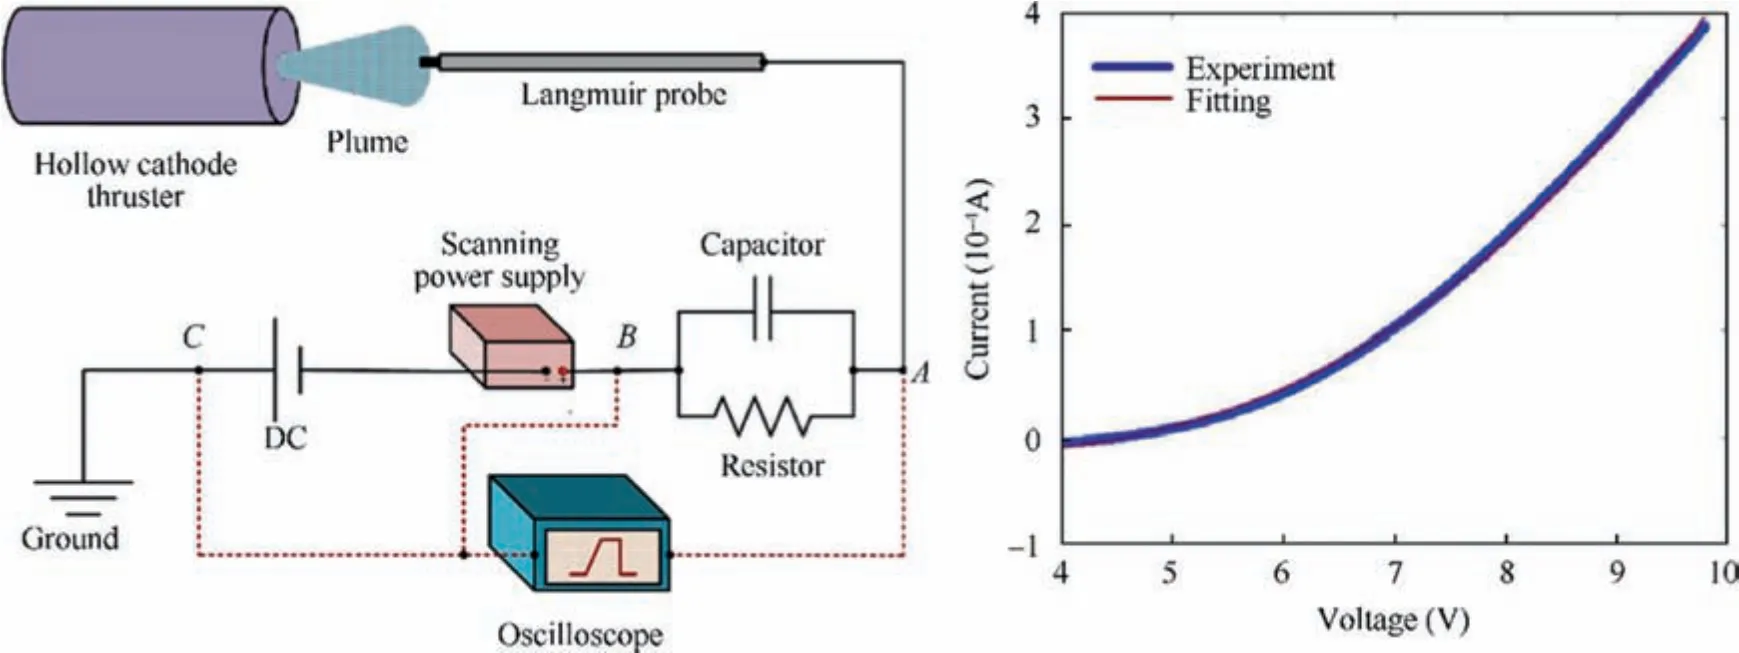
Fig.2 Experimental circuit diagram(left)of Langmuir probe for diagnosing electron density and temperature and a typical fitting result(right) between theoretical and experimental current-voltage (I-V) curves.
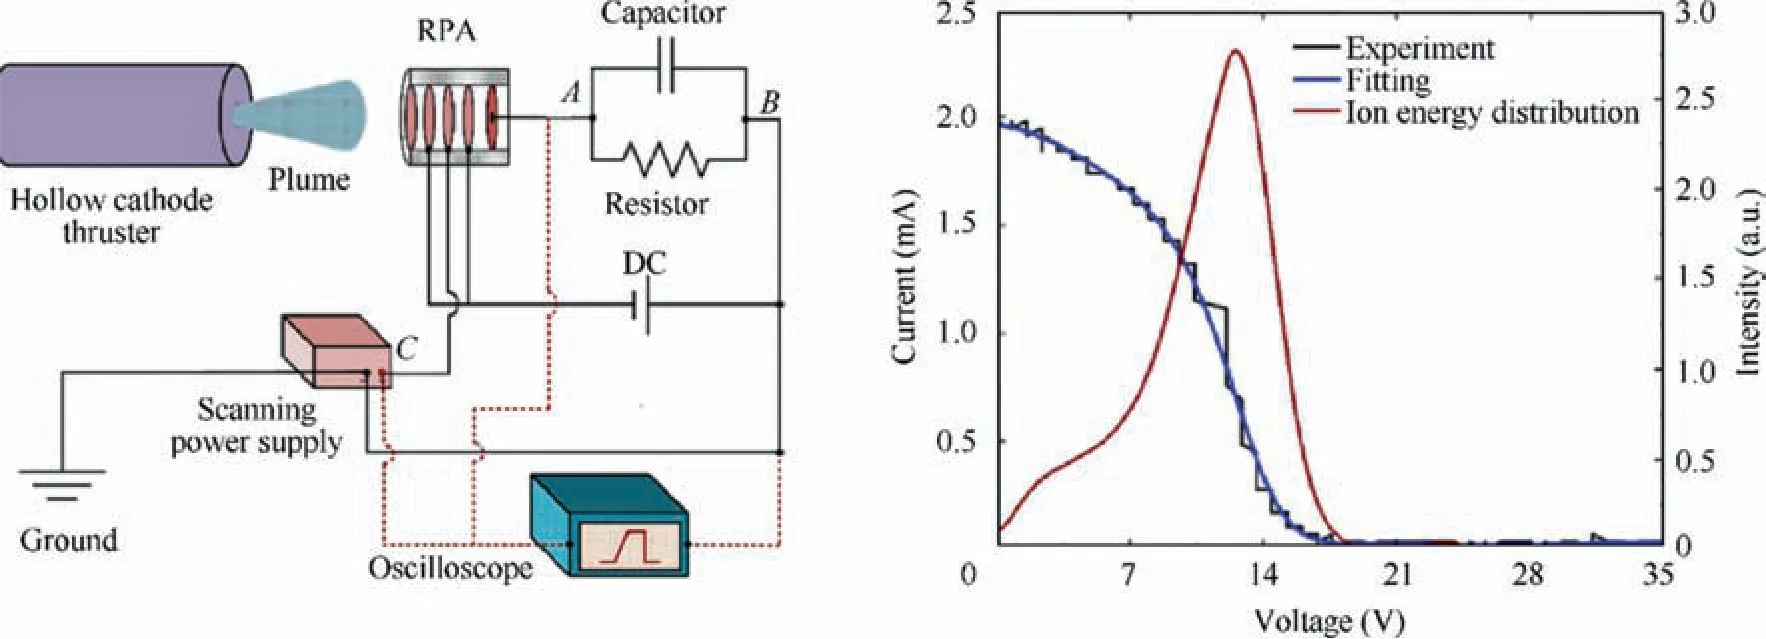
Fig. 3 Experimental circuit diagram (left) of RPA for diagnosing ion energy distribution, and a typical fitting result (right) between theoretical and experimental I-V curves, and the ion energy distribution curve measured.
2.4. Faraday probe
A Faraday probe is applied to collect ion current of plasma beam.38The Faraday probe includes a planar ion collection electrode and a shielded tube. In order to collect all the ions of plasma beam, a Faraday probe with a large diameter of 20 mm is used. At bias voltage lower than-10 V, the ion current collected by the probe keeps a constant.
2.5. Thrust stand
The ‘‘TPT-5A” millimeter-scale three-wire twist pendulum produced by our group is used for thrust measurement.39In the range of 0-5 mN,the measurement accuracy is better than±1.5%, and the resolution is 60 μN. Specific impulse can be calculated by using the thrust and mass flow,which can reflect the utilization efficiency of the propellant.
2.6. Spectrometer
A spectrometer (HORIBA Jobin Yvon. FHR1000) is used to measure the emission spectra along the axis of the dualemitter hollow cathode(optical fiber is faced to the orifice exit at a distance of 1 cm). As seen in Fig. 4, the lines from Xe(5p56p) and Xe+(5p46p) states are dominant and their lineratios are significantly changed with the mode transition.Emission lines out of the excited levels Xe+(5p46p) become much stronger in the T-mode. This phenomenon will be further discussed in Section 4 in combination with the Langmuir probe and fluid model results. The results of this optical measurement will also be quantitatively investigated by using the collisional-radiative models40-42in a future work.
3. Model
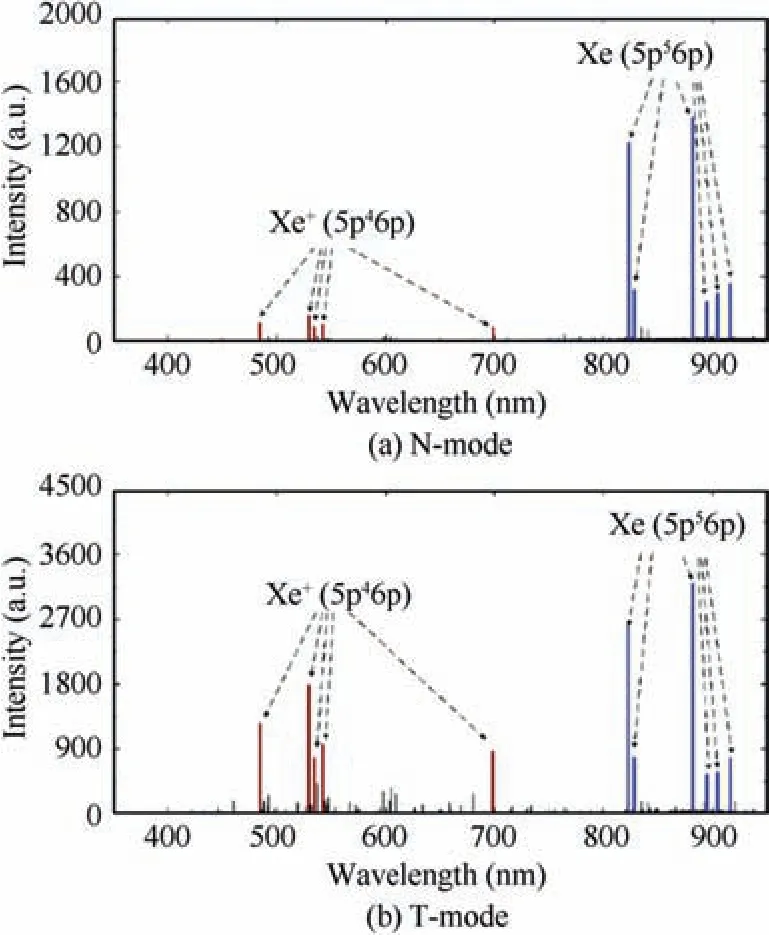
Fig.4 Comparison of optical emission spectra between N-mode and T-mode (gas flow rate is 5 sccm and current is 2 A).
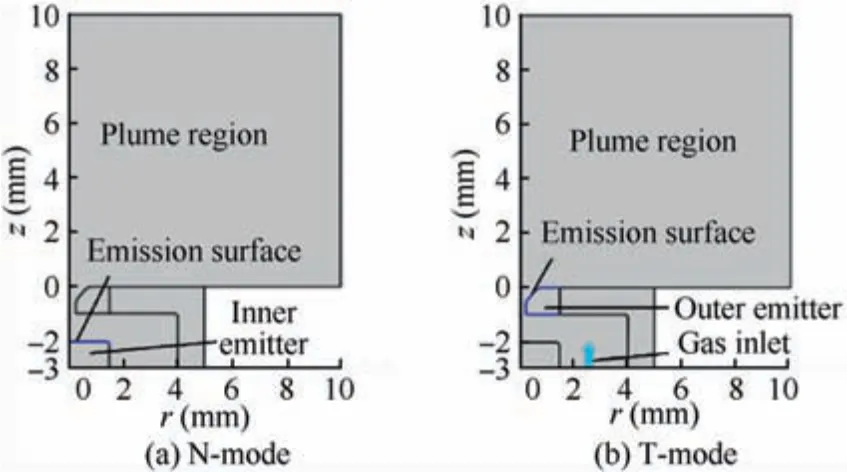
Fig. 5 Structure of hollow cathode discharge model.
A two-dimensional self-consistent extended fluid model has been built for the hollow cathode discharge in our previous paper.18Here it is modified for modelling this dual-emitter hollow cathode. The two-dimensional axisymmetric model is divided into plasma region, orifice region, and inner region as shown in Fig. 5. The electron emitting surface is set at z= -2 mm in the N-mode labeled by a blue line (Fig. 5(a)), and it is set at the surface of the orifice in the T-mode(z= -1-0 mm) (Fig. 5(b)). The total number of the meshes is 25000, and the size of the mesh is 20 μm in orifice region and 30 μm in the inner region. The initial time step is 1×10-16s and total calculation steps are 425. To ensure the convergence, the gas pressure boundary in plume region is set higher than the actual pressure, so the plasma errors come from the gas pressure errors in the plume region.
The model includes a discharge module, a plasma module,and a laminar flow module.A heat transfer module in the fluid model and a heat transfer module in the solid model are applied to calculate the temperature distribution in fluid and hollow cathode wall,respectively.Fig.6 shows the coupling calculation process of these modules.In the plasma module,initial electron density ne0and initial pressure p0are given to calculate the plasma parameter distributions. The electron pressure peand gas density ρ obtained from the plasma module are fed into the gas flow module.In the flow module,the mass flow rate mfand background pressure of the gas pbare input,and the electron pressure pein the plasma module is coupled to calculate the velocity vector field u and pressure distribution p as output to the plasma module.At the same time,the gas temperature distribution(Tg)calculated by the gas heat transfer module is output to the plasma module and the flow module, while the gas density and the plasma heating power hgcalculated by the plasma module and atoms density(n)calculated by flow module are output to the gas heating module with initial gas temperature(Tg0)to calculate the gas temperature distribution.The gas temperature distribution is output to the flow module to calculate the pressure and flow field,while the gas temperature is output as the boundary condition to the solid heat transfer module with initial solid temperature(Ts0)to calculate the solid temperature distribution(Ts).At the same time,the solid temperature distribution Tsis output to the gas heat transfer module and the plasma discharge module as the boundary condition of the gas and as the thermal emission condition in the plasma discharge module.The heating power hsof the plasma on the wall is output to the solid heating module.
The plasma module includes the excitation,ionization,and recombination processes of atoms and ions. And the distribution of the plasma potential, electron temperature, and electron density are obtained by solving the Poison, rate balance, and energy balance equations. From the continuity and momentum equations the velocity of the atomic and ionic species are given. The rate balance equations is written as:

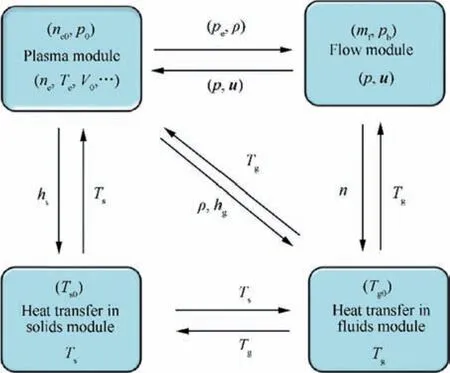
Fig. 6 Coupling calculation process of four modules.
here neis the electron density, Γeis the electron flux, and Redenotes the sources and drains. According to the driftdiffusion approximation, the particle flux Γeis written as:
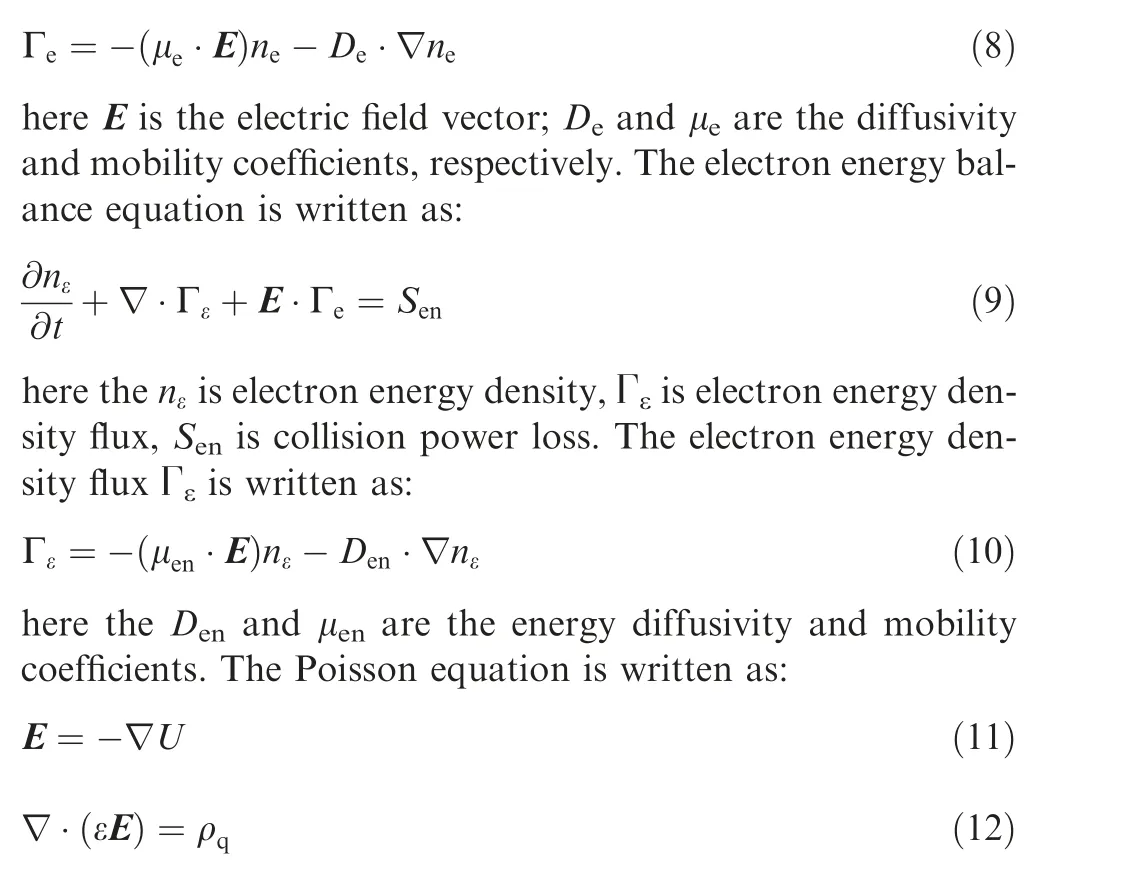
here ε is the dielectric constant, and ρqis the electric charge density. The current emission density of the emitter, which is the boundary condition of above equations, is given by:

here J is the current emission density, A is Richardson coefficient, T is the temperature of the emitter, k is the Boltzmann constant, and φ is the work function of the emitter.
In the laminar flow module,the velocity,density,and pressure of the heavy species can be obtained by solving the continuity and momentum equations:

here ρ is the gas density, u is the velocity vector field, I is the 3×3 identity matrix, μ is dynamic viscosity, F is the volume force, which is due to ion-atom collisions.43
In one heat transfer module(fluid module),the gas temperature can be obtained by solving the equations:

where Cpgis constant pressure heat capacity of the gas, kTgis coefficient of heat conductivity of the gas.

In another heat transfer module (solid module), the gas temperature can be obtained by solving the equations:where ρsis the solids density,the Cpsis constant pressure heat capacity of the solids, kTsis coefficient of heat conductivity of the solids.
The model is created in Comsol Multiphysics software,which is capable of solving above partial differential equation system with defined initial and boundary conditions.
4. Results
In this section we comparatively investigate the experimental results (Section 4.1) and modelling results (Section 4.2)obtained by the methods in Sections 2 and 3. In Section 4.1,the electron parameters (Section 4.1.1), ion parameters (Section 4.1.2),pressure(Section 4.1.3),thrust and specific impulse(Section 4.1.4) are given. In Section 4.2, the electron parameters (Section 4.2.1), ion parameters (Section 4.2.2), temperature distribution of the gas and solid (Section 4.2.3), and pressure and gas velocity (Section 4.2.4) are given. The enhanced gas expanding effect due to plasma throttling,as well as other plasma acceleration mechanisms and the improving method of the device, are discussed based on these results.
4.1. Experimental results
4.1.1. Electron parameters
Fig.7 compares the electron densities(ne)at the axial positions of 0 mm and 5 mm from the exit obtained by the Langmuir probe and the model. In Figs. 7(a)-7(b), electron densities at 0 mm obtained by the model are reduce by 100 times, and which are reduced by 500 times in Figs. 7(c)-7(d). As shown in Figs.7(a)-7(d),neat the orifice(0 mm)increases significantly with the discharge current. In the plume region (5 mm), neincreases with the current in the N-mode but keeps nearly a constant in the T-mode. It is because that electrons mainly move out of the orifice in the N-mode;however,most of them move into the orifice when the device is working in the T-mode(discussed in detail in 4.2.1).As a result,nein the plume region is more sensitive to the variation of nein the ionization region in the N-mode than in the T-mode.
It is found that nein the T-mode is much higher than that in the N-mode in Fig. 7.The reason is that the dominant ionization zone is in the inner region of the hollow cathode device for the N-mode but it is moved to the orifice region for the Tmode. This is a special phenomenon found in this kind of DEHC and will be further investigated by the model in Section 4.2.1.And electron density shows very little increase from current 1.5 to 2.0 A,which is the result of nonlinear growth of plasma ionization process at low flow rate. When the thermal emission current increases from 1.5 to 2.0 A, the temperature of emitter and orifice increases, resulting in the increase of gas velocity and the decrease of gas density in the orifice region. At the same time, the anode voltage is basically unchanged,and thus the electron temperature does not change too much.So,the ionization rate at the exit increases little,and then the electron density increases slowly.
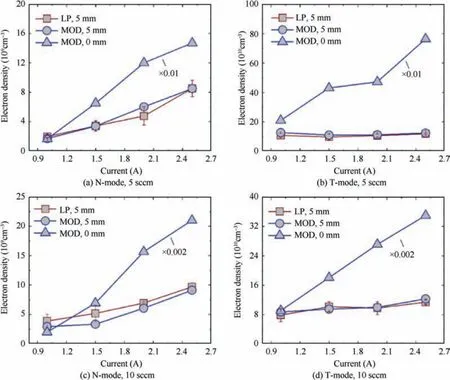
Fig. 7 Comparison of electron density given by Langmuir Probe (LP) measurement and modelling (MOD) between N-mode and Tmode in plume region,i.e.at axial position of 0 mm and 5 mm from exit of DEHC(current is in range of 1-2.5 A and gas flow rates are 5 sccm and 10 sccm; error bars show the total uncertainty in probe measurement).
Fig. 8 compares the electron temperatures (Te) at the axial positions of 0 mm and 5 mm from the exit obtained by the Langmuir probe measurement and the model. It is found that Tein the N-mode (~0.8-1.5 eV) is relatively low compared with that in the T-mode (~1.6-3.5 eV). Actually, Teis related to the electron-impact ionization rate necessary for sustaining a certain discharge. In the N-mode, the electrons are mainly from the inner region of the cathode with a rather high pressure and a low Teto sustain the discharge. In the T-mode,the electrons are mainly from the orifice region with a relatively low pressure and high Te.This explains the observations in the above figure. It is found that there is an uncertainty in the probe diagnostics due to the invasion of probe.Especially,in the N-mode(Figs.8(a)and 8(c))with relatively low electron temperatures,the probe interference leads to discharge oscillation and in this case a relatively large uncertainty is caused.This is the dominate reason for the difference in Figs. 8(a)and 8(c).
When the discharge current increases,Teis not significantly changed in the N-mode (Figs. 8(a) and 8(c)). This means that the Tein the plume region is not a function of the current in the N-mode. However, an interesting phenomenon is found that Teincreases with the current in the T-mode (as seen in Figs. 8(b) and 8(d)) and the electric field becomes stronger in the orifice and plume regions (as found by modelling). This is also related to the movement of the dominant ionization zone in the T-mode. The variation of Teand neshown in Fig. 7 and Fig. 8 explains the differences on the relative strength of ionic lines shown in Fig. 4. In fact, the population processes of ionic and atomic excited species are different.Excited ions are mainly populated by Eq. (20) and Eq. (21).And excited atoms are mainly populated by Eq. (22).
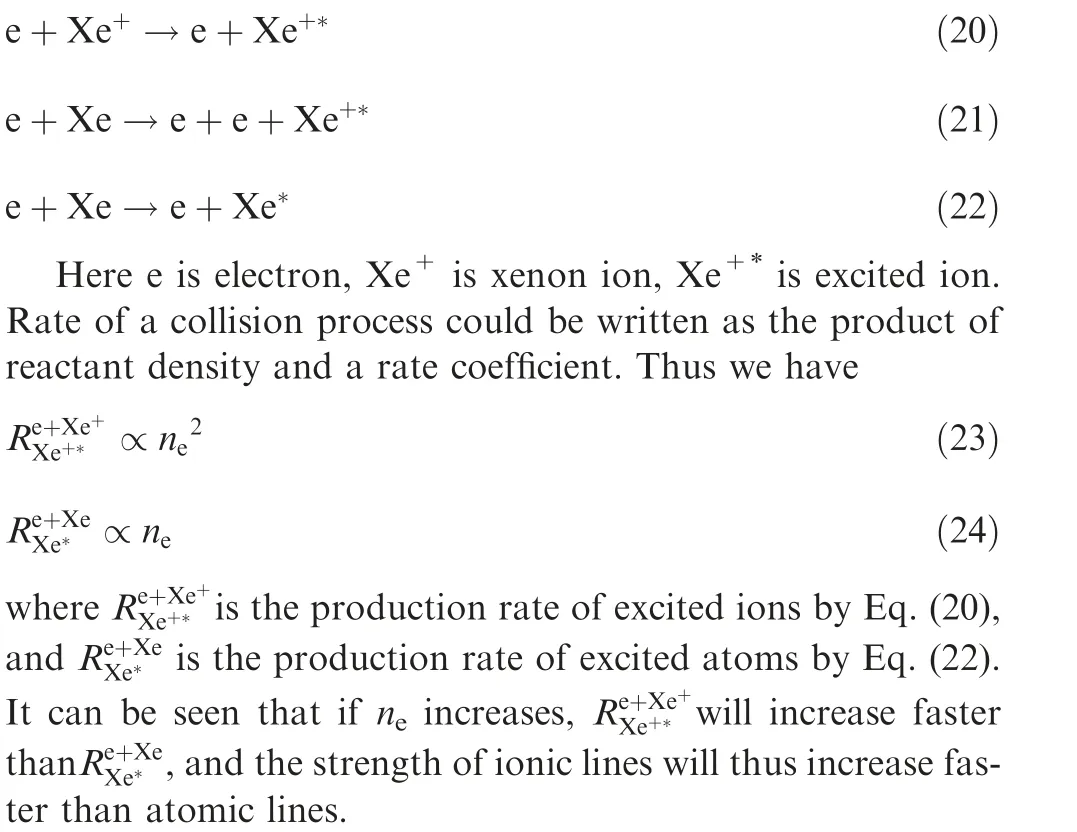

Fig.8 Comparison of electron temperature given by LP measurement and MOD between N-mode and T-mode in plume region,i.e.at axial position of 0 mm and 5 mm from exit of DEHC(current is in range of 1-2.5 A and gas flow rates are 5 sccm and 10 sccm;error bars show total uncertainty in probe measurement).
As for Eqs.(21)and(22),reactants are the same.However,the functional form between rate coefficients and Teare determined by the collision cross sections. By comparing the crosssections of Eqs. (21) and (22)40,44, we find that the crosssections of Eq.(21)increase faster than Eq.(22),which makes the variation of Tehas stronger influence on Eq. (21). Thus both the increase of Teand nemakes the intensity of ionic lines increase faster than atomic lines.
4.1.2. Ion parameters
The ion flux and ion energy distribution function are measured by the Faraday probe and RPA probe,respectively.As shown in Fig.9(a),the experimental ion flux in the T-mode is higher than that in N-mode by about two orders of magnitude,which is due to(A)the movement of dominant ionization zone to the orifice region and(B)the large plasma potential gradient at the orifice exit. The ion flux in both modes is higher at gas flow rate 10 sccm than at 5 sccm due to higher plasma densities(from the two-dimensional self-consistent extended fluid model). On the other hand, the ion energy in the T-mode is higher than that in the N-mode as shown in Fig. 9 (b). The plasma potential hill (ion energy at the peak) in the T-mode is ~10 eV and 18 eV at gas flow rate 10 sccm and 5 sccm,respectively, but it is only ~3 eV in the N-mode.
4.1.3. Pressure
The pressure in the inner and orifice regions of the hollow cathode is another key parameter.In experiment the total pressure can be measured by a capacitance gauge at the inlet end of the gas supply; in the model the 2-D pressure distribution can be calculated. As shown in Fig. 10, the maxmium total pressure in the inner region(obtained at z=0,r=0 in the model)in the T-mode is higher than that in the N-mode by ~20%-30%; a similar trend is observed from the experimental pressures. Note that the experimental pressure is lower than the modelling results by ~10%-20% because they are obtained at different positions in the device.
4.1.4. Thrust and specific impulse
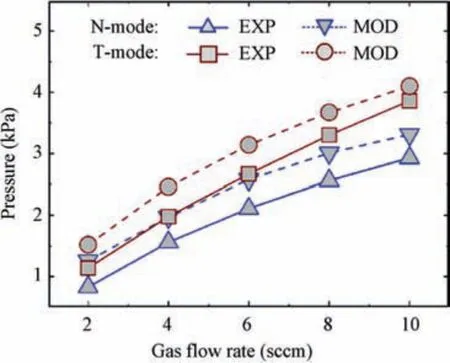
Fig. 10 Comparison of experimental (EXP) and modelling(MOD) total pressure in inner region of DEHC at gas flow rate 2-10 sccm and discharge current 1.5 A.
Due to a large ion flux,a high ion energy,and a high gas pressure, the thrust of the DEHC in the T-mode is relatively high.As seen in Fig. 11 (a), the experimentally measured thrust in the T-mode is higher than those of the N-mode and C-mode by factors of ~2 and 4, respectively, at a gas flow rate of 16 sccm. Here C-mode refers to the cold gas mode without discharges45. At a lower gas flow rate of 4 sccm, the thrust can be enhanced by factors as large as ~10-20 in the T-mode.Specific impulse (Isp) is another important parameter for the performance of the thrusters, being related to the efficiency of gas utilization (Isp=F/mg,F is thrust, m is mass flow rate,and g is gravitational acceleration constant).As seen in Fig.11(b), the specific impulse in the T-mode is much higher than those in the C-mode and N-mode, especially at a low gas flow rate e.g. 2 sccm (by a factor of 6-7).
4.2. Modelling results
To analyze the differences between the N-mode and T-mode,the modelling further investigates the differences in the ionization zone, ion flux, temperature distribution, pressure and gas speed, and electron pressure. It is found ion acceleration and plasma throttling effect play important roles in thrust generation.
4.2.1. Electron parameters
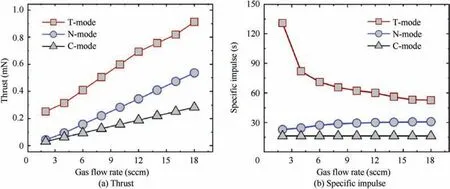
Fig.11 Comparison of thrust and specific impulse generated by DEHC in C-mode,N-mode,and T-mode at a discharge current 1.5 A.
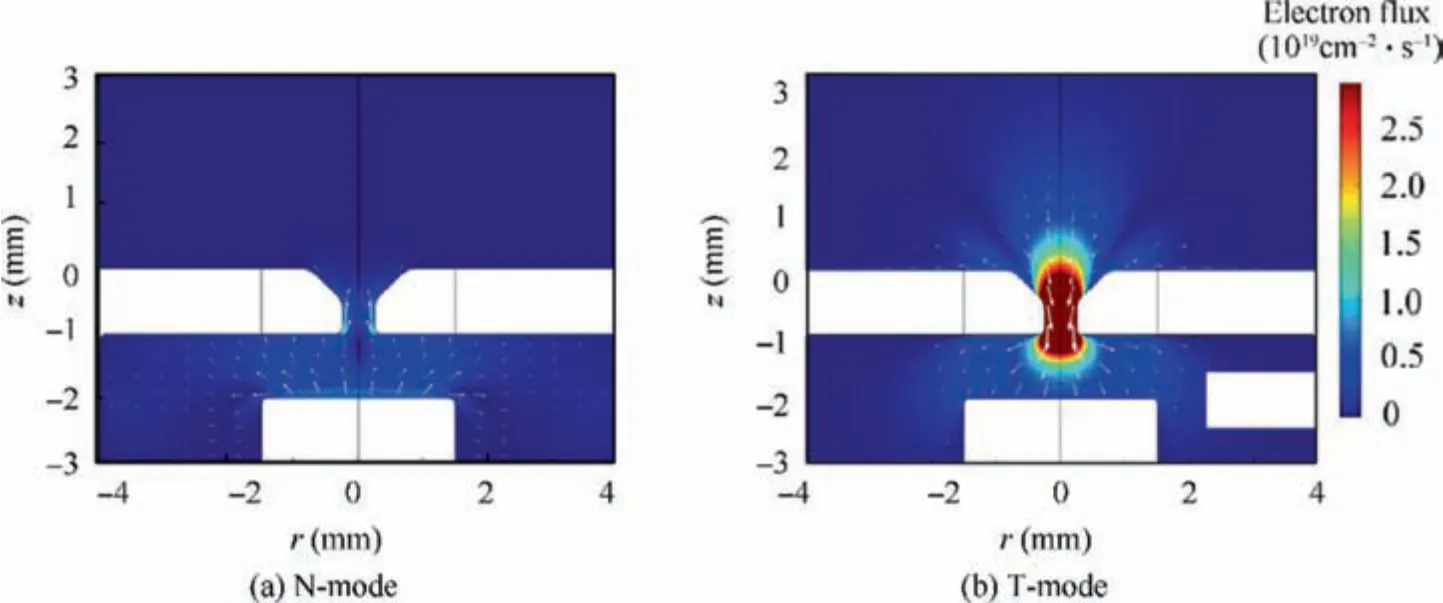
Fig. 12 Comparison of modelling electron flux distribution in DEHC between N-mode and T-mode (gas flow rate is 5 sccm and discharge current is 1.5 A).
To understand the differences between the N-mode and Tmode, the model is used for modelling of the inner, orifice,and plume region near the orifice. As shown in Fig. 12, the direction of the electron flux is generally opposite between the N-mode and T-mode. In the N-mode, the surface at the position z=0 is electron emitting surface with a relatively large electron flux of 1.8×1018cm-2•s-1. In this case, the electrons are released from the inner emitter surface and mostly absorbed in the orifice of the anode; only a small part of electrons transit through the orifice into the plume region. However, in the T-mode, electrons are released from the orifice surface with a quite large electron flux of 2.8×1019cm-2•s-1.The electrons from the outer ionization transit through the orifice region into the inner region.
The plasma potential distribution in the DEHC in the Nmode and T-mode are compared in Fig.13.There are cathode sheaths on the emitter surface in both modes. However, the plasma potential distribution is quite different between them.The plasma potential is ~11 V in the orifice region(z=0.5 mm) and ~7 V in the plume region (z=2.5 mm) in the N-mode (Fig. 13(a)). It is ~22.5 V in the inner region(z=1.0 mm) and ~12 V in the plume region (z=2.5 mm)in the T-mode(Fig.13(b)).There is a large potential gradient at the exit of orifice in the T-mode but not in the N-mode.
In Fig. 14, the electron temperature in the inner region is nearly the same for the two modes;however,a large difference is found in orifice and plume regions.In the N-mode,the electron temperature decreases to ~0.5 eV in the plume region,but it increases to ~2.4 eV in the plume region in the T-mode. In addition, the electron density distributions in Fig. 15 are also different. The plasma is concentrated in the inner region in the N-mode but moved into the orifice region in the T-mode.In the N-mode, the electron temperature and electron density are higher in the inner region, as seen in Fig. 14 and Fig. 15;in the T-mode, these parameters are higher in the orifice region. Due to this change, the reaction rate between electron and xenon atom is affected(Fig.16).As a result,the dominant ionization zone is in the inner region in N-mode but in the orifice region in T-mode as shown in the Fig.16.This movement of the dominant zone is the essential reason for the different physical characteristics between the two modes.
4.2.2. Ion parameters
Fig.17 compares the ion flux distribution from the model (assuming the ion temperature is equal to the gas temperature as done in Ref.46). In the N-mode, most of the ions hit on the electrode surface due to the sheath potential drop, and few of ions can escape from the orifice into the plume region. In the T-mode, ion flux sprays into the plume region due to the large plasma potential gradient in the orifice region; in this case,the ion flux at z=1.5 mm can be as high as ~1018cm-2-•s-1, much higher than the value of ~1016cm-2•s-1at this position in the N-mode. This difference is also experimentally observed by using the Faraday probe in the plume region as seen in Fig.9(a).According to the above results,the ion acceleration process is significantly enhanced in the T-mode.
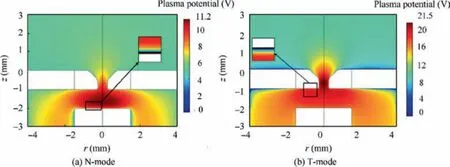
Fig.13 Comparison of plasma potential distribution between N-mode and T-mode(gas flow rate is 5 sccm and discharge current is 1.5 A).
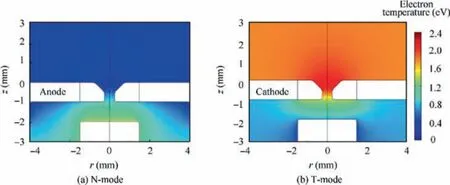
Fig.14 Comparison of electron temperature distribution in model of DEHC between N-mode and T-mode(gas flow rate is 5 sccm and current is 1.5 A).
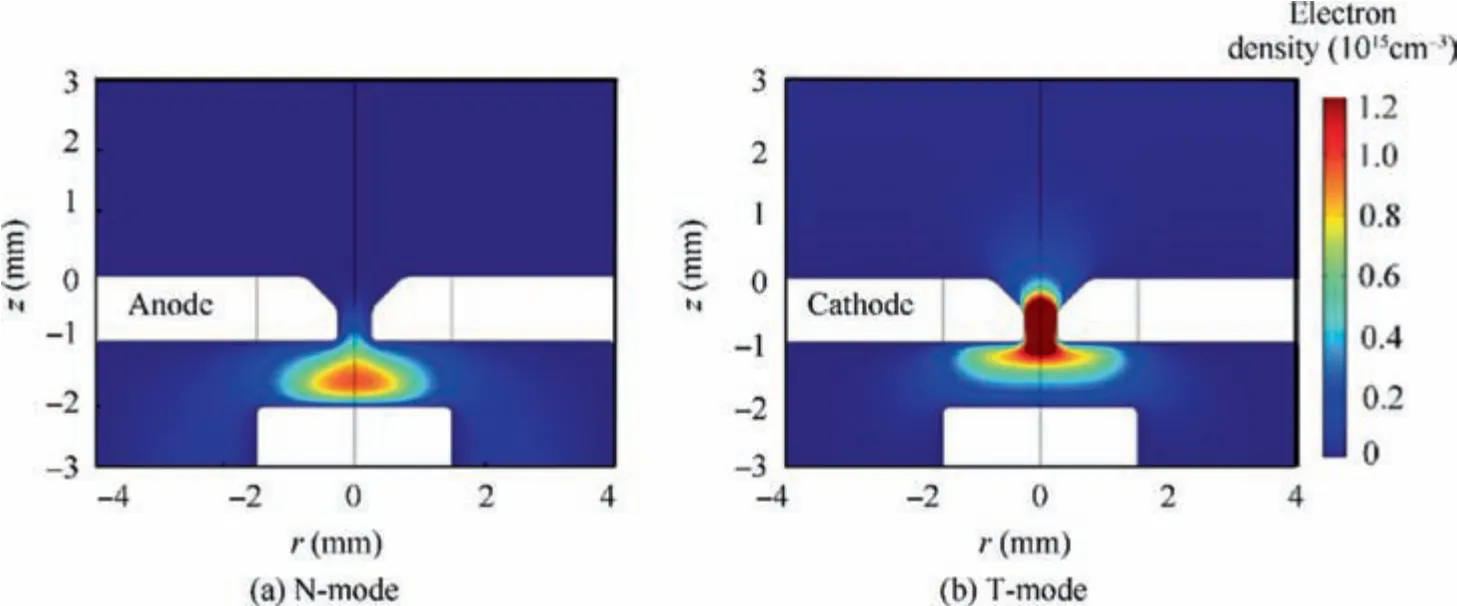
Fig. 15 Comparison of electron density distribution in DEHC between N-mode and T-mode (gas flow rate is 5 sccm and discharge current is 1.5 A).
4.2.3. Temperature distribution
Gas temperature distribution is shown in Fig. 18. In the Nmode, it shows that gas temperature is about 2700 K in the inner region and there is a large temperature gradient in orifice region, which is due to gas expanding effects. In the T-mode,the gas temperature is about 2100 K, relatively lower than N-mode,which is due to the difference in plasma distribution.In the N-mode, plasma is concentrated in the inner region,which serves as a heat source heating the gas; however, it is in the orifice region in the T-mode.As a result,the gas temperature in the inner region is higher in the N-mode, but it is higher in the orifice region in the T-mode.
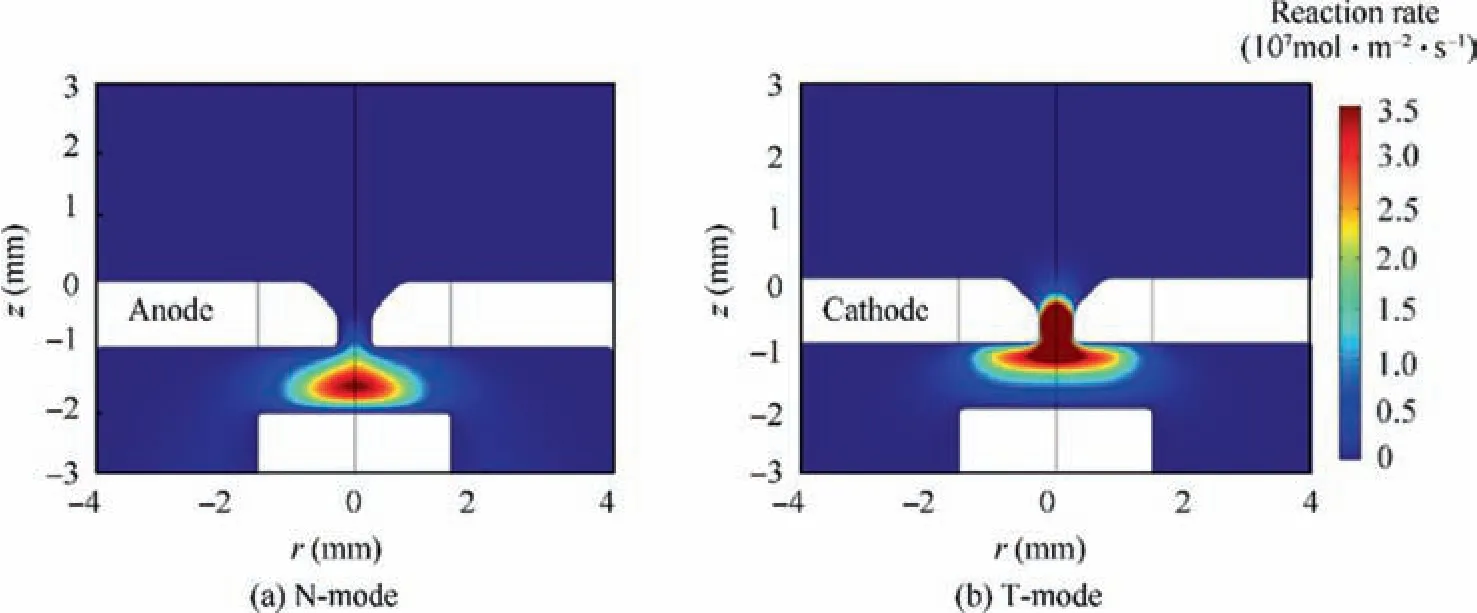
Fig. 16 Comparison of reaction rate of electron and xenon atom in hollow cathode model in N-mode and T-mode (gas flow rate is 5 sccm and discharge current is 1.5 A).
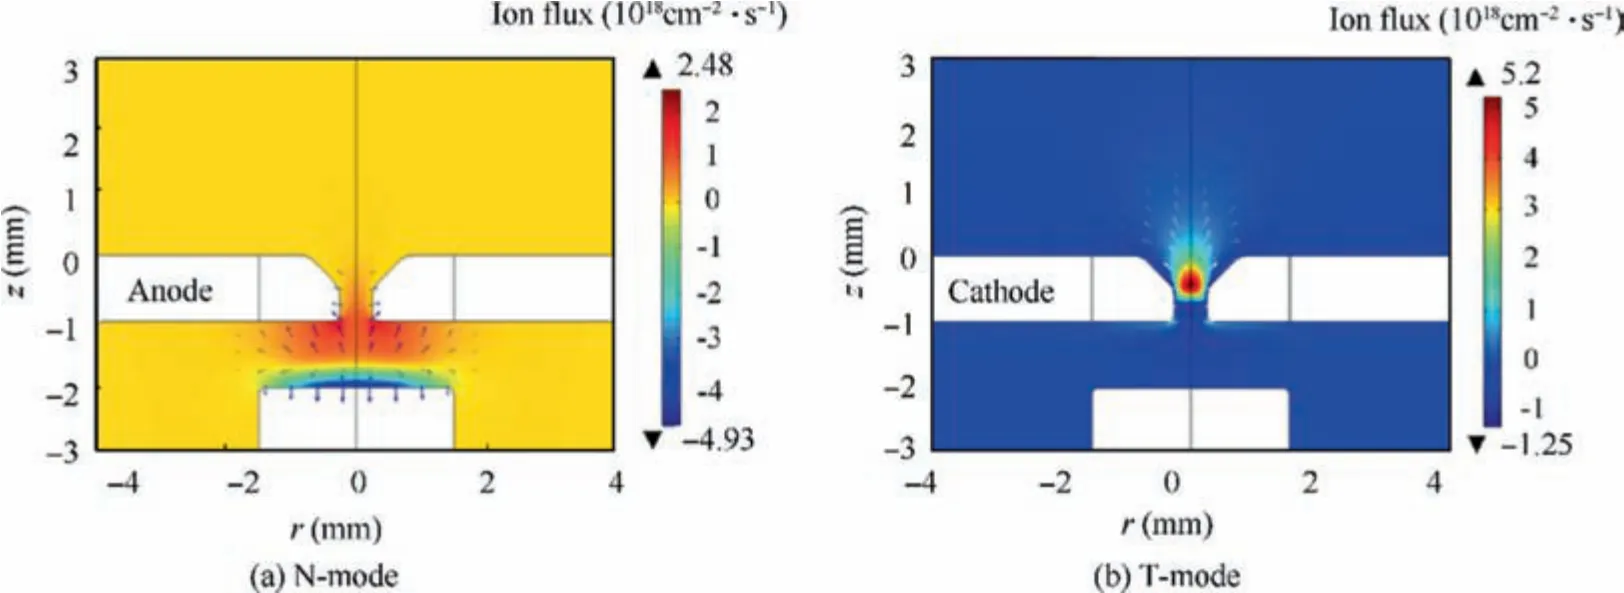
Fig. 17 Ion flux distribution calculated by model (gas flow rate is 5 sccm and current is 1.5 A).
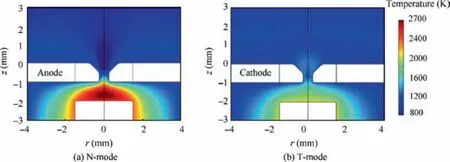
Fig. 18 Gas temperature distribution at discharge current 1.5 A and gas flow rate 5 sccm.
The solid temperature distribution is shown in Fig. 19, the cathode temperature is ~2250 K and the anode temperature is~1000 K in the N-mode, which are 1900 K and 1100 K,respectively, in the T-mode. In the hollow cathode thruster,ions hit on the wall and heat the solid. The difference in the plasma density distribution leads to the different solid temperature distributions. And the shell temperature distributions also consist with the results measured by an infrared thermometer(model SA-D30140A,range of temperature measurement 300-1400 ℃and uncertainty ±0.1 ℃), as shown in Fig. 19. Here ‘‘N” and ‘‘T” refer to the N-mode and Tmode; ‘‘model” and ‘‘experiment” refer to the results of our model and those from the thermometer.
4.2.4. Pressure and gas velocity distribution
The total pressure is a sum of the pressures of neutral gas and charged species:

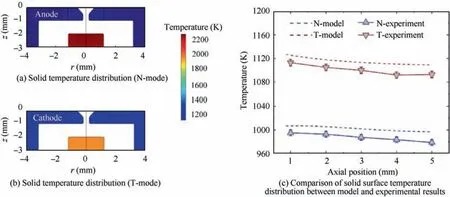
Fig. 19 Results of solid temperature distribution in model and comparison of solid surface temperature distribution (z=0 mm)between model and experimental results (discharge current is 1.5 A and gas flow rate is 5 sccm).
Here ptis the total pressure, pais the neutral gas pressure,and pnis the pressure of charged species. Considering that the ion temperature is much lower than the electron temperature,pncan be approxmiated by the electron pressure as given in Eq. (25).
Fig.20 compares the electron and total pressures along the axis (r=0) between the N-mode and T-mode. An electron pressure hill of ~500 Pa is observed at the position of z ≈0.3 mm (inner region) in the N-mode, while it is ~1000 Pa at z ≈0.3 mm (orifice region) in the T-mode. Such an increase in the electron pressure significantly enhances the plasma throttling effect in the orifice region and the total pressure is higher in the T-mode,as seen in Fig.20.Further,the pressure gradient in the orifice region is also larger in the T-mode than in the N-mode. According to the Bernoulli equation for ideal incompressible gas flow, the gas velocity is proportional to the pressure gradient.Therefore,in Fig.21 the maximum axial gas velocity reaches 700 m/s in the T-mode, higher than the value of 507 m/s in the N-mode.Due to this plasma throttling effect, the gas expanding process is also enhanced in the Tmode.
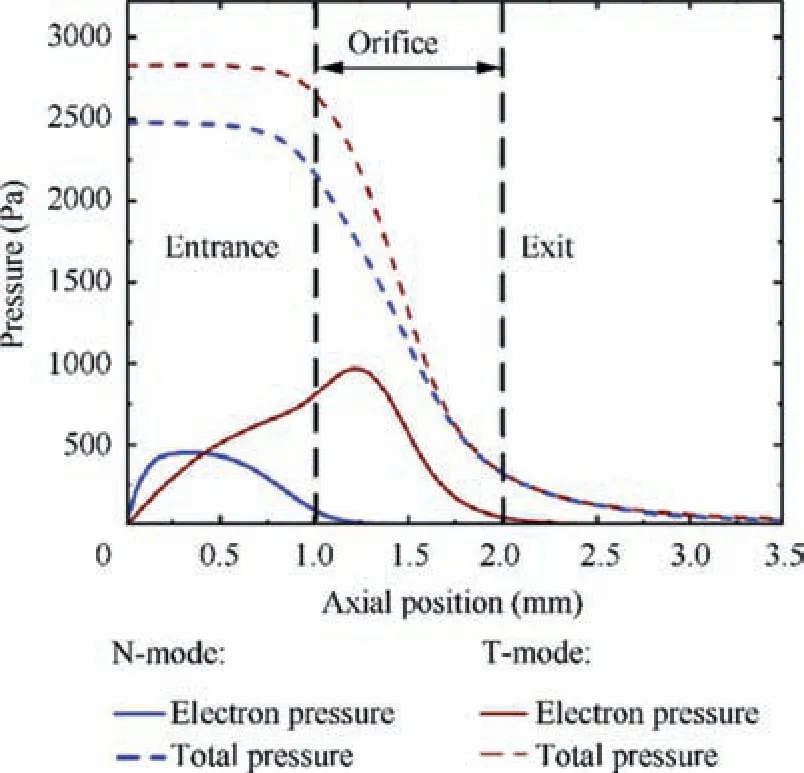
Fig. 20 Calculated total pressure and electron pressure distribution at axial direction in hollow cathode thruster model (gas flow rate is 5 sccm and discharge current is 1.5 A).
It is found that hollow cathode micro-thruster can generate a larger thrust in the T-mode due to enhanced plasma potential hill acceleration and plasma throttling effects. In order to improve the performance of this kind of micro-thruster, the plasma density in the orifice region should be increased which is a key factor related to the plasma throttling effect. For this purpose,one possible approach is reducing the diameter of the orifice to obtain a higher density as seen in Ref. 47. On the other hand, ion acceleration is also an essential factor for improving performance and by applying an axial magnetic field method the quality of the plasma beam from a cathode discharge can be improved.48
5. Discussion
In this work,a heatless BaO-W hollow cathode with two emitters is developed to work as both neutralizer (N-mode) and thruster (T-mode)—just by exchanging the potential of the electrodes. The difference in the electron flux between the two modes is the major factor that leads to the different plasma distributions. The dominant ionization zone is in the inner region in the N-mode but moved to the orifice region in the T-mode.The plasma potential distribution is thus changed and the plasma potential hill effect is significantly enhanced in the T-mode, which leads to much higher ion flux and energy.
For a hollow cathode micro-thruster, both the gas expanding effect and ion acceleration play important roles for the production of thrust. With a much higher plasma potential hill,the ion acceleration mechanism becomes dominant, especially at relatively low gas flow rate (low thrust, high specific impulse).However,at relatively high gas flow rate(high thrust,low specific impulse), the gas expanding process plays a major role. Particularly, enhanced plasma throttling effect due to high electron pressure is observed in the orifice region in the T-mode of the DEHC developed in this work,which strengthens the gas expanding process by enlarging the pressure gradient.
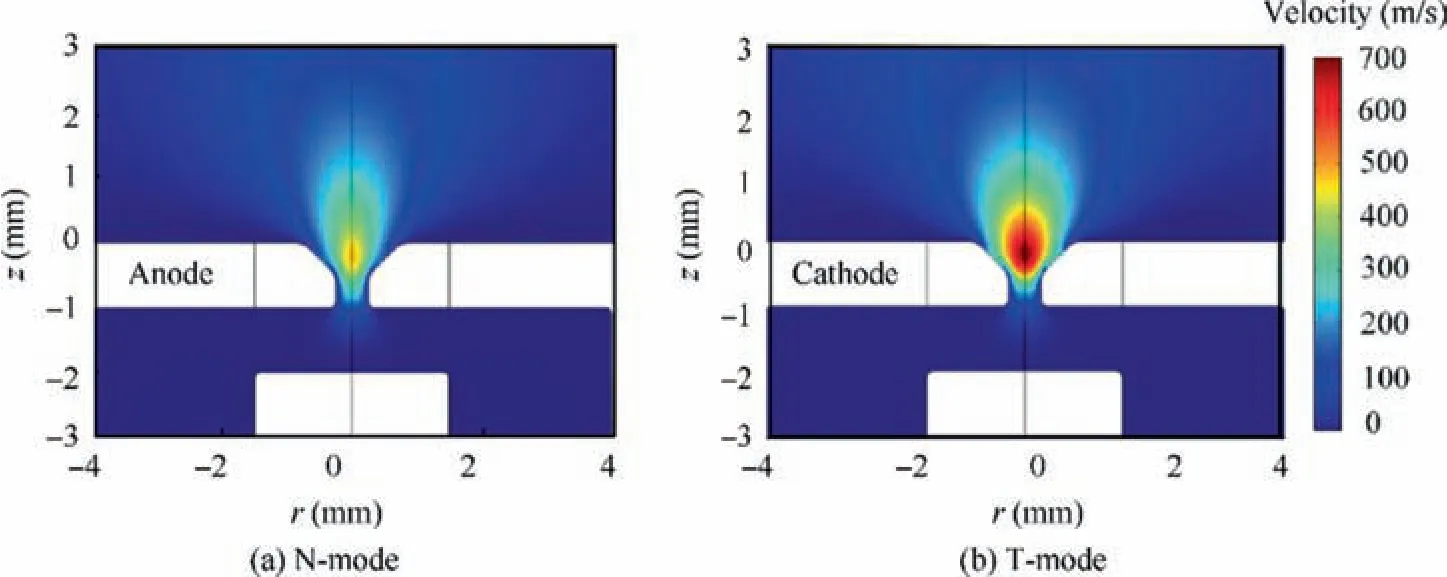
Fig. 21 Gas velocity at axial direction in hollow cathode thruster model (gas flow rate is 5 sccm and discharge current is 1.5 A).
Hollow cathode thruster can provide a thrust from tens of μN to several mN which is need in the situation that small satellites formation flying.49And another potential application of this device in T-mode is to be applied on tethered satellite as a plasma contactor. It is more easily that electrons are drawn out when the ionization zone is in the orifice,and the discharge phenomenon of bright plume in Fig. 1 can prove that. So it is beneficial for plasma contactor to exchange charge with space plasma.4,7
In the future this device can be improved to work at relatively low current and low gas flow rate and to be coupled with a low power Hall thruster.Considering it will also be used as a separate micro-thruster, the thrust and specific impulse of this device need to be increased.One possible method is developing a magnetic-enhanced hollow cathode micro-thruster.
6. Conclusions
The current DEHC can provide a performance similar as the single-emitter hollow cathode when operated as a neutralizer.On the other hand, it can produce a higher specific impulse than the widely-used cold-gas micro-thrusters. Particularly, it can be conveniently changed between the thruster and neutralizer modes in orbit with a specific power supply system.This is a new device suitable for the all-electric prolusion propulsion system, being developed for the aerospace mission. A further investigation on its operating performance and coupling characteristics with Hall thrusters will be done in the future.
Declaration of Competing Interest
The authors declare that they have no known competing financial interests or personal relationships that could have appeared to influence the work reported in this paper.
Acknowledgements
This work was supported by the National Natural Science Foundation of China(Nos.61571166,11775063 and 51736003).
 CHINESE JOURNAL OF AERONAUTICS2021年12期
- CHINESE JOURNAL OF AERONAUTICS的其它文章
- Entropy based inverse design of aircraft mission success space in system-of-systems confrontation
- Nonlinear resonance characteristics of a dual-rotor system with a local defect on the inner ring of the inter-shaft bearing
- Failure mechanisms of bolted flanges in aero-engine casings subjected to impact loading
- Synchronized perturbation elimination and DOA estimation via signal selection mechanism and parallel deep capsule networks in multipath environment
- Improving seeking precision by utilizing ghost imaging in a semi-active quadrant detection seeker
- A high dynamics algorithm based on steepest ascent method for GNSS receiver
