Statistical characteristics of spray autoignition of transient kerosene jet in cross flow
Chi ZHANG, Chunlong HE, Xin XUE,*, Yuzhen LIN, Jio LI,Chongchong LIU
a National Key Laboratory of Science and Technology on Aero-Engine Aero-thermodynamics, Research Institute of Aero-Engine, Beihang University, Beijing 100083, China
b AECC Commercial Aircraft Engine Co., Ltd., Shanghai 200241, China
KEYWORDS Crossflow;Flow reactor;Ignition delay time;Probability density;Spray autoignition;Transient injection
Abstract To study statistical characteristics of the random spray autoignition, aviation kerosene was injected transiently into non-vitiated air crossflow in a flow reactor with optical accesses.The operating conditions were relevant to gas turbine combustor: the air crossflow pressure and temperature were in the range of 1.4-1.7 MPa and 830-947 K, respectively, and the jet-tocrossflow momentum flux ratios were 20, 50 and 80. Statistical distributions of random ignition delay times with adequate convergence were estimated based on histograms. The dependences of the distributions on reactor pressure, temperature, and jet-to-crossflow momentum flux ratio were studied. The results show that the resulting distributions appear more concentrated with the increase of air temperature or jet-to-crossflow momentum flux ratio. And then the correlations for the mean and standard deviation of the ignition delay time sample data were developed based on the present results.Compared with the correlations of ignition delay time of homogeneous premixed gas-phase kerosene/air mixture reported in the literature, the results show a greater significance pressure dependence and lower temperature sensitivity of the ignition delay time of nonpremixed kerosene spray.
1. Introduction
Achieving lower NOxemissions has become an important goal with the development of modern aviation gas turbine combustors. Reducing peak combustion temperatures by fuel-lean combustion is an effective method to reduce NOxemissions,such as Lean Premixed Prevaporized combustion (LPP),1-4and Lean Direct Injection combustion (LDI).5,6LPP is the most promising combustion mode for the lowest NOxemissions7since the liquid fuel is injected transversely into a turbulent premixing duct to form a premixed prevaporized mixture before entering the combustor.However,the residence time required for liquid kerosene jet breakup,evaporation and mixing with air may result in autoignition in the premixing duct associated with growing inlet air temperatures and pressures, which can cause serious damages to the structure and performance of the combustor.8Therefore, the Ignition Delay Time (IDT) is the primary criterion for designers to assess the probability of unwanted autoignition of the liquid transversal jet in the turbulent premixing duct.
The autoignition of transversal kerosene jet in a premixing duct is represented by the flame luminescence resulting from the intense exothermic reaction of the ignition kernel.The ignition kernel forms after experiencing the simultaneous coupled processes of the unsteady liquid jet breakup,fuel evaporation,turbulent mixing, and chemical reaction.9-11Therefore, comparing to the autoignition of homogenous premixed mixtures dominated by the chemical kinetics, it is greatly challenging to make clear the formation mechanism of the ignition kernel of the non-premixed kerosene jet.
One challenge for the autoignition of the non-premixed jet is the random occurrence of the autoignition events in spatial and temporal, due to the turbulent mixing and unsteady jet evolution. Hinkeldey et al.11,12studied the autoignition of the liquid kerosene spray injected continuously into hot coflow by a pressure-swirl atomizer, it was found that the initial ignition kernels appear at the random and individual locations within the turbulent flow field. Williams et al.10also investigated the kerosene spray autoignition in turbulent coflow with the same injection method, discovering that ignition kernels appear randomly in time and with significant spatial scatter.Fast et al.13studied the autoignition of the dimethyl ether during the transient jet evolution. The results showed that the autoignition occurs over a wide spatial extension and that the spatial contours of the local ignition probability are variable with time. The random phenomenon was also explored in the spray autoignition of liquid fuel injected transversely into a crossflow. Gordon and Mastorakos14observed that the spray autoignition spots appear randomly in spatial resulted from monodisperse individual droplets carried by turbulent crossflow. Zhao et al.15have demonstrated the random spray autoignition of pulsed liquid column jet into heated crossflow as a result of turbulent jet breakup and mixing. In summary, the existing studies show that for the nonpremixed compositions, like single droplets and jet sprays,the random autoignition is a result of the turbulent mixing,as well as the unsteady jet evolution.
The statistical information and local conditions of the random autoignition events of non-premixed gas-phase fuel jets affected by the turbulent mixing are studied systematically.Markides et al.16,17early conducted a series of experiments to study the autoignition of gas-phase jets (hydrogen, vaporized n-heptane) released continuously into turbulent coflow.The results indicated that there is a ‘‘Random Spots” regime for a certain range of conditions where a statistically stable situation is reached with autoignition occurring in randomlylocated spots.The reason is that unsteady distributions in temporal and spatial of the most reactive mixture fraction and low value of the scalar dissipation rate within the flow field caused by turbulent mixing.17-19The conclusion above has been confirmed later by Arndt et al.20who studied the local conditions of the random autoignition spots of transient methane jet in coflow burner. The results show that, based on statistics,almost all of the detected ignition kernels appear at the locations with very lean mixture fractions and low values of the scalar dissipation rate(all of the above scalar dissipation rates are defined as being proportional to the square of the spatial gradients of the mixture fraction).
Compared to the autoignition of the non-premixed gaseous jets affected by turbulent mixing, the spray of transversal liquid fuel jet is much more complicated since the autoignition process consists of additional unsteady jet breakup and fuel evaporation. The unsteady liquid jet breakup caused by the surface wave and hydrodynamic stripping,21induces subsequent inhomogeneous spray content,22,23thus the unsteady mixture fraction and scalar dissipation rate of the ignitable gas-phase mixtures are formed within the flow field due to fuel evaporation. At the same time, the cooling effect of evaporation on the flow has a negligible impact on the ignition process once the temperature is over 800 K.24As a result, the ignition initials at scattering locations, where optimal conditions with respect to most reactive mixture fraction and low scalar dissipation rate arise. In the present paper, the random spray autoignition affected by unsteady liquid jet breakup was studied in a statistical-stable turbulent flow.
It is very difficult to identify experimentally the mixture fraction at autoignition sites due to the very low fuel concentration.20,25Hence,multiple independent replicates in statistics were employed to study the random characteristics of spray autoignition via repeating transient fuel jets at the same conditions into a flow reactor to produce independent autoignition events.13,20,26Furthermore, regarding the statistical variable to represent the randomness of spray autoignition, Johannessen et al.27drew the ignition frequency (Hz) to present the statistical likelihood of autoignition events of H2/N2jet injected continuously into hot coflow;and Markides and Mastorakos18developed Probability Density Functions (PDFs) of time interval between adjacent autoignition events of N2-diluted acetylene injected continuously into coflow. However,the ignition frequency (Hz) and time interval of autoignition discard the statistical information about the random ignition kernels formation processes, and the values of those are also influenced by the appearance of ‘‘secondary autoignition”,which come very close after the primary autoignition. Hence,in the present study, the ignition delay time is regarded as the statistical variable to represent the kernel formation time scale. Thus the ignition delay time is defined based on experiments as the time interval between the injection of kerosene jet into the flow reactor and the appearance of the ignition kernel.
The objectives of the present study were to provide new reliable statistical information of the ignition delay for kerosene spray formed by liquid transversal injection into crossflow with variable conditions and to provide an account of the interaction between the unsteady jet evolution and chemical kinetics on the subsequent random autoignition events. For this purpose, the kerosene spray was injected instantaneously and recurrently for multiple autoignition realizations at typical gas turbine operating conditions into a flow reactor.The sample data of the ignition delay time at various temperatures,pressures, and momentum flux ratios were collected based on CH* chemiluminescence. In addition, empirical correlations covered by the operating conditions were developed to characterize the statistical distributions of random spray autoignition.
2. Experimental apparatus and methods
The experiments were carried out using a flow reactor with optical accesses based on the multiple independent replicates of autoignition in statistics. Thus, multiple independent autoignition events were realized via pulsed fuel injection under the same condition of air temperature (Ta), pressure(Pa) and jet-to-crossflow momentum flux ratio (J). The experimental apparatus and methods are described in the following sections.
2.1. Experimental apparatus
The experimental apparatus consists of, a flow reactor with optical access to determine the time point of injections and autoignition events, an air supply system to supply nonvitiated air for flow reactor at variable temperatures and pressures,a fuel injection system with quick response and high precision injector to realize transient liquid kerosene injection.
The flow reactor is a double-walled structure with an inner test channel and an optical chamber, as shown in Fig. 1. The test channel, a rectangular test channel with 25 mm×60 mm and a total length of 610 mm, is inserted into an optically accessible chamber. The chamber is pressurized by still air at approximately the same pressure as that of the test channel.The quartz windows in the diameter of 20 mm, are installed on both sides of the flow reactor, providing optical accesses for detecting the fuel injection. Ignition kernel detection windows are mounted at the end of the test channel and pressurized chamber in the same size as the cross-section of the test channel. The light emission from the ignition kernels at any location within the test channel could be detected through the optical access along the flow reactor.In addition,the temperature on the outer surface of the test channel is monitored using several K-type thermocouples arranged along the flowing direction,which ensures that the test channel achieves thermal balance before each test. The location of fuel injection is defined as the origin of coordinates for the test channel, the air streamwise direction is defined as x-direction,and the direction of fuel injection is y-direction. The gas mixture flows vertically downward into the exhaust section and expanded to atmospheric pressure through a sonic throttle, and subsequently is cooled by water injection.
The non-vitiated air is supplied by a pressure vessel with a volume of 44 m3and pressure of 9 MPa.The mass flow rate of air is controlled by a pressure-regulating valve.The air stream is heated by heat-storage type heater(a maximum heating temperature up to 1000 K)without extra contamination.The temperature and pressure of air stream into the flow reactor are measured for closed-loop control by a K-type Thermocouple(K-TC)probe and a pitot tube connecting pressure transducers(CYB-20S)at a rate of 10 Hz,respectively.The accuracy of air pressure and temperature measurements is both less than 0.5%of full scales. The turbulent flow entering the flow reactor is reorganized by a steel honeycomb (with an aspect ratio of 10 and regular hexagonal orifices of 2 mm) and a screen (with blockage ratio of 53.3%), they are installed 280 mm upstream of the fuel injector.
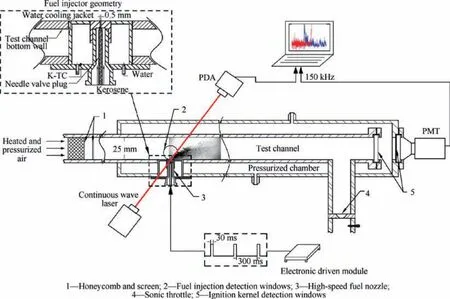
Fig. 1 Schematic of flow-reactor.
The kerosene is supplied by a nitrogen-pressurized vessel,and the fuel flow rate is regulated by varying the pressure in the fuel vessel (Pj), in order to avoid the influence of pressure loss of the fuel pipeline, the test location of Pjis placed at the injector inlet. Jet velocity at injector exit is evaluated from the pressure drop(Pj-Pa)and the discharge coefficient of the injector (17.514 kg/(h•MPa0.5)). As shown in Fig. 1, a singleorifice plain-nozzle injector is mounted at the bottom side of the test channel with the nozzle exit being flush with the bottom wall, the detailed geometry was also sketched in the previous literature.15The orifice of the nozzle, a recessed hole(dj)of 0.5 mm and a length/diameter ratio of 7,is controlled by a needle valve plug drove by a high-speed solenoid valve,which is activated by cyclic square-waves discharged from an electronic-driven module. As a result, the injector is capable to realize a precise cycle process of the duration and interval of fuel injection with time-accuracy of 0.1 ms. Moreover, the blocking section of the nozzle passage is so small and close to the exit that the quality and duration of each injection remain constant. Considering that there exists heat transfer from the hot flow reactor to the injector,it may lead to thermal decomposition or changes in physical properties, thus a water cooling jacket is designed for the injector to hold the room temperature of the kerosene before injection.
2.2. Experimental methods
2.2.1. Determination of ignition delay time
In the present study,the ignition delay time(τIDT)is defined as a time interval between the fuel injection into the flow reactor and the radical emission from the ignition kernel. Liquid kerosene is injected in a pulsed manner into the flow reactor to realize a series of independent autoignition events. The fuel injection duration determines whether the jet has reached a steady-state jet behavior,and thus,it determines whether there is extra interference to influence the subsequent autoignition appearance. In the current study, the fuel injection duration is 30 ms, which is more than sufficient for the establishment of a steady-state jet behavior (~1.5 ms, estimated by dividing the breakup height (Hb) of liquid transversal jet28by the jet velocity), but short enough to minimize any influence of reactor heating. Besides, the fuel injection is terminated to allow the gas mixture exhaust from the flow reactor completely.The interval of fuel injection also allows the flow reactor to settle back to pre-ignition conditions before the next injection.This procedure is repeated at a rate of 3 Hz.
The moment of fuel injection into the flow reactor and autoignition occurrence are determined by methods as the following description. A continuous laser, in the diameter of 1.3 mm, power of 2.71 mW, and wavelength of 655±10 nm, passes through the liquid column jet at the location less than 2 mm above the exit of the fuel nozzle, as seen in Fig. 1. A Photodetector with a transimpedance Amplifier(PDA) installed on the other side of the test channel is employed to detect the rapid attenuation of the laser intensity caused by the optical reflection and refraction of column liquid jet. Then the time point when fuel jet enters the flow reactor can be determined. The time point of ignition kernel appearance is determined based on CH* chemiluminescence inside the entire flow field. The chemiluminescence is collected by a Photomultiplier Tube (PMT, with spectral radiant sensitivity of 3.4 V/nW at 340 nm) in conjunction with a band-pass filter(430±5 nm, >65% transmission) through ignition kernel detection windows as shown in Fig. 1. Both signals of laser intensity and CH* chemiluminescence are acquired by a computer at 150 kHz.
As shown in Fig. 2, the blue and red curves represent the PDA voltage and the PMT origin voltage signal, respectively.The moment of fuel injection is determined based on a threshold voltage of 4.5 V, which approximately corresponds to the 20% reduction (large than systematic noise) of the original laser power;and the time of autoignition was identified by criterion of 5 V corresponding to 0.06 mW spectral radiance of 430 nm from the ignition kernels.
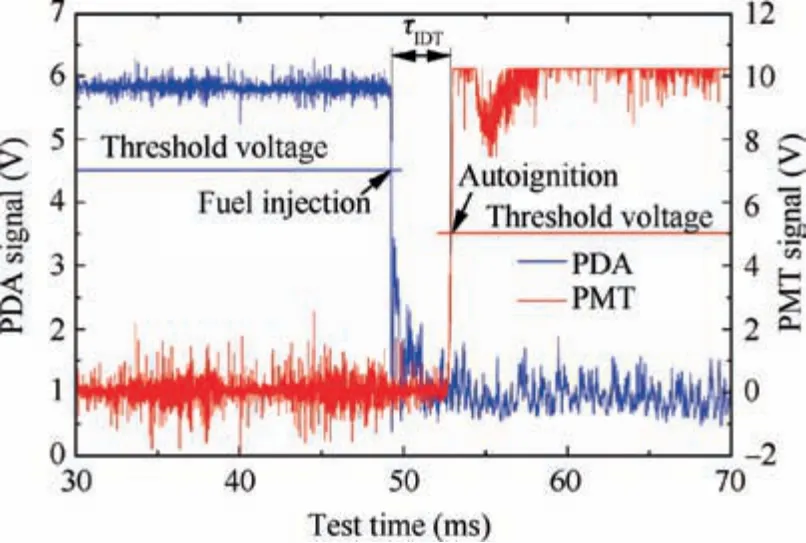
Fig.2 Determination of moments of fuel injection and autoignition according to PDA and PMT signal.
2.2.2. Probability density of ignition delay time
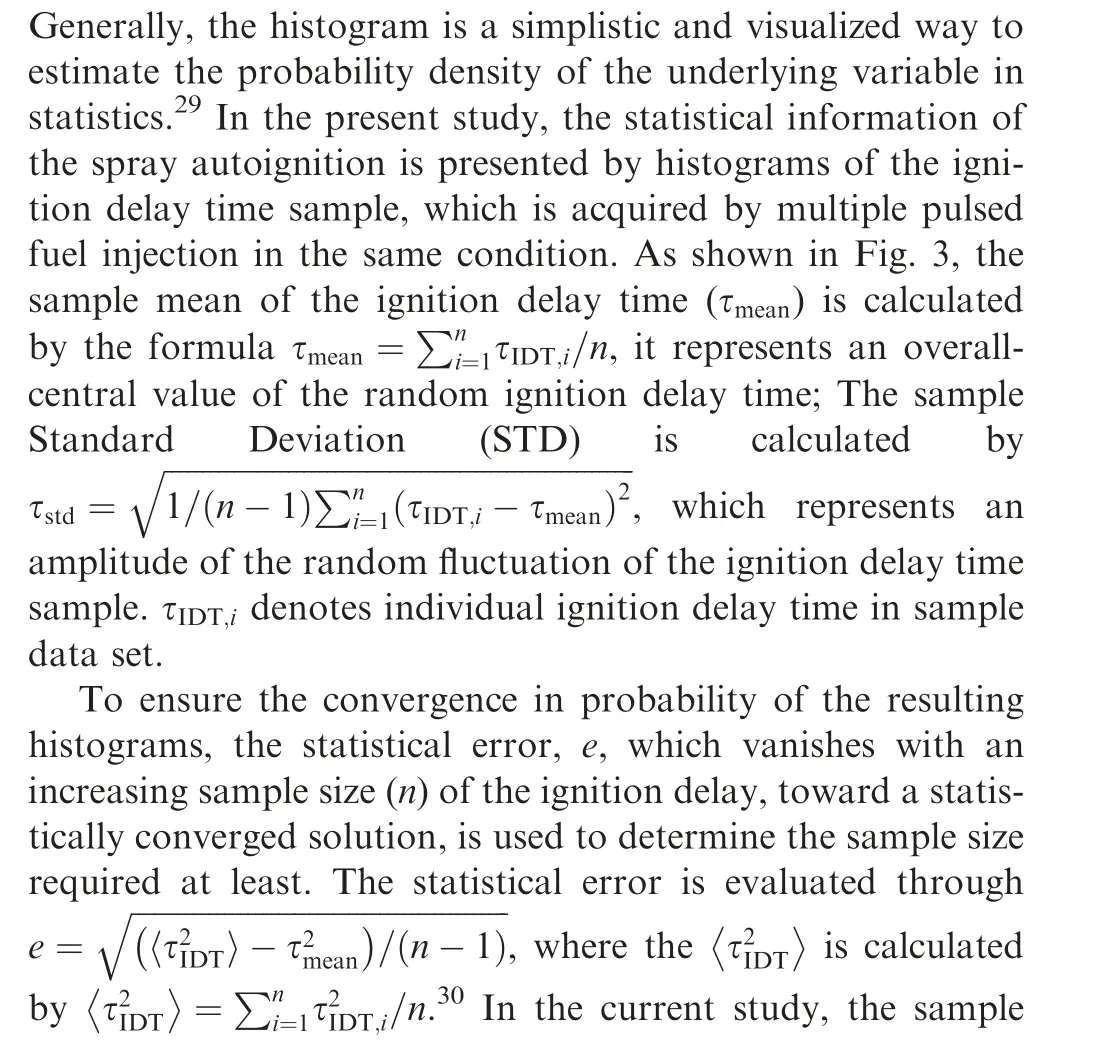
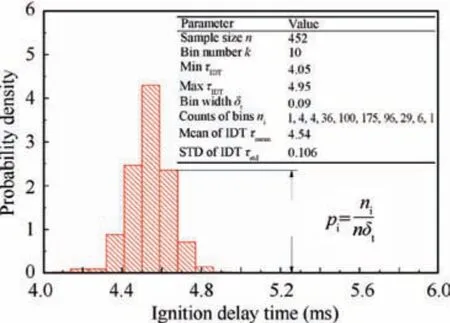
Fig. 3 Drawing method of a histogram.

The histograms are constructed based on the resulting sample of the ignition delay time as shown in Fig.3.In more detail,the plots are calculated by dividing the time axis into bins and counting the frequency of ignition delay times (ni) in the respective bins. Thus the probability density was determined by dividing the fraction of the number of ignition delay times within the bin niand the total sample number n by bin width δt.

As a result, the total area of a histogram in the current paper is always 1.
Generally, the slight change of the bin width or bin origin always induces a relative difference of the histogram.29In the limit of δt→0, the histograms converge theoretically toward continuous probability density functions. However, the bin width cannot be reduced extremely because of the limited number of sample data and the limited accuracy of the data in the actual measurements.31A smaller bin width makes density estimation more sensitive to PDF trends, but it also makes random errors have a greater impact on density estimation.Histograms with larger bin width converge faster and become smoother,but lead to lower sensitivity to the trend of probability density. The small change of bin origin leads to some data move over a bin.31As a consequence, it is unlikely to determine a ‘‘best” bin width and bin origin over others.
2.2.3. Inlet air turbulent flow boundary determination
The inlet turbulent flows of the flow reactor,as boundary conditions,were assessed without fuel injection,and at room temperature based on Reynolds number similarity mechanism with the autoignition conditions. The measurements were carried out using a hot-wire anemometer with a 5 μm diameter,1.2 mm long single-normal probe, run at 0.8 times overheat ratio.The locations of measurement were 462 regularly spatial points (42 points along height direction and 11 points along width direction) over the fuel injection cross-section downstream of the flow conditioners. The measurement uncertainty of the anemometer is 2.5% under the 90% confidence level.The self-similarity inlet turbulent flow boundary was assessed by examining the variations of various flow parameters such as local time-averaged flow velocity (umean), turbulence intensity (Tu) calculated with streamwise root-mean-square turbulence fluctuation velocity (urms).
2.3. Operating conditions
The autoignition measurement runs were performed in the current study over a range of conditions summarized in Table 1.The non-dimensional parameters in the table are used to correlate the features of the flow field with the jet breakup and mixing properties. They are the air Reynolds number,Rea=ρaUaD/μa, air Weber number, Wea=ρaU2aD/σ, jet Reynolds number, Rej=ρjUjdj/μj, and jet-to-crossflow momentum flux ratio, J=ρjU2j/ρaU2a. The above parameters ρ, U, μ, σ, d are density, velocity, dynamic viscosity, surface tension, and fuel nozzle diameter, respectively. Subscript ‘‘a”denotes air crossflow, subscript ‘‘j” denotes fuel jet. Air reference velocity Uais acquired based on the mean of air mass flux rate. Characteristic length scale D is the hydraulic diameter of hexagonal orifices of flow conditioner (honeycomb), 3.5 mm.
The temperature Tais in the range 830 -947 K, the reactor pressure Pa=1.4, 1.7 MPa, the jet-to-crossflow momentum flux ratio J=20, 50, 80, the air Reynolds number Rea=21100 -26800 and the bulk air reference velocity is maintained at the range of 44.4 -47.4 m/s.
Three groups of autoignition experiments were conducted.In the first group, various air temperatures (Cases 1, 2, 3,and 4) were performed for a given Pa=1.4 MPa and J=50 to investigate the effect of chemical kinetics and spray evaporation on the distribution of ignition delays. In addition, the effects were also studied at other pressure Pa=1.7 MPa(Cases 7, 8, and 9) or other jet-to-crossflow momentum flux ratio J=80 (Cases 10 and 11). In the second group, the two different pressures (Cases 3 and 8; Cases 6 and 10) were compared to examine the distribution of ignition delays influenced by pressure. In the third group, three various momentum flux ratios (Cases 5, 4 and 6) cases were undertaken specifically to explore the effect of jet turbulence intensity (unsteady jet evolution) on the distribution of ignition delays.
2.4. Uncertainty analysis
In order to study the statistical information of random ignition delays of spray in the flow reactor, the measurement uncertainty of every individual ignition delay time is quantified.Theignitiondelaytimeisdeterminedby τIDT=τautoignition-τinjectionin the present study, the formula represents the interval between the time of fuel injection(τinjection)and the time of the autoignition(τautoignition)as shown in Fig.2.Thus the uncertainty of the individual ignition delay time arises from the measurement of the time points of the fuel injection and autoignition. The uncertainty of each ignition delay time is evaluated by the formula:

The measurement error of τinjectionmainly arises from (A)the acquisition frequency for PDA voltage signal (150 kHz),(B)the speed of the PDA voltage decline once the fuel jet pass through the laser(46.7±25.3 V/ms,the range is evaluated by the PDA voltage data for all conditions),(C)random noise ofPDA signal (~±0.5 V) as shown in Fig. 2. As a result, the measurement error of the fuel injection time (Δτinjection) is 0.03 ms.

Table 1 Summary of overall conditions in present study.
The measurement error of τautoignitionis caused by (A) the acquisition frequency for PMT voltage signal (150 kHz), (B)the speed of the PMT voltage rise once the autoignition occurs(40.2±10.5 V/ms,calculated by the PMT voltage data for all conditions),(C)random noise of PMT signal(~±1.2 V).As a result, the measurement error of the autoignition time(Δτautoignition) is 0.05 ms.
Thus, the total uncertainty of the ignition delay time(ΔτIDT) is 0.06 ms, which is less than 2.0% of the τmeanfor all operating conditions. Moreover, the total uncertainty of the ignition delay time is far less than the observed random fluctuations of the ignition delay, as discussed in the Section 3.5.
3. Results and discussion
3.1. Inlet turbulence boundary
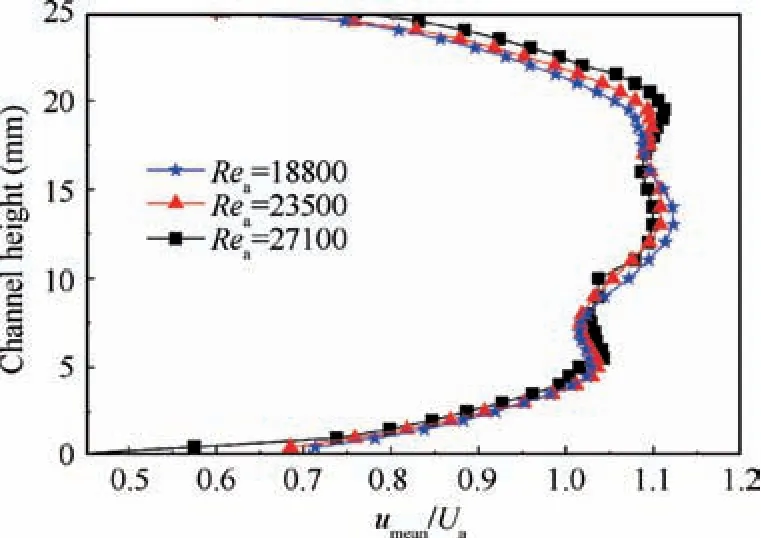
Fig. 4 Profiles of dimensionless local time-averaged velocity along centerline of injection cross-section at different Rea.
In order to study the interaction between the unsteady jet evolution and chemical kinetics on the subsequent random autoignition events, a statistical-stable state of the turbulent flow under each operating condition is needed to isolate the contribution of the turbulent flow. Therefore, the inlet turbulent flow boundary at the axial location of the injector was examined at room temperature based on the Reynolds number similarity mechanism with the autoignition conditions. Figs. 4 and 5 show the profiles of dimensionless local time-averaged velocity (umean/Ua) and turbulence intensity (Tu=urms/Ua)along the central line of the test channel at the fuel injector.The plots show that the profiles of dimensionless flow parameters are almost constant in the Rearange of 18,800 to 27100,which covers the Rearange of the autoignition test (21100 to 26800).This indicates that the inlet turbulence flows achieving the self-similarity region34in the Rearange of our autoignition test. Note that the profiles of the dimensionless local timeaveraged velocity and turbulence intensity are malformed at the central region of the lines, it is possibly attributed to the disturbance of the upstream thermocouple inserted in the test channel.
The flow parameters were measured in more detail at the air Reynolds number Rea=18800 to represent all test cases.Figs. 6 and 7 plot the contours of umean/Uaand urms/Uaover the fuel injection cross-section, respectively. It is found that in the proximity of the central region of the cross-section(height ≈3 -23 mm, width ≈5 -55 mm), the variation in umeanis less than±10% of the corresponding Ua, as shown in Fig. 6. The Fig. 7 indicates that the turbulence intensity of the inlet flow is within 5% in the central region of height ≈3 -23 mm and width ≈5 -55 mm. The results indicate that the inlet flow has formed a relatively uniform streamwise flow at injection cross-section.
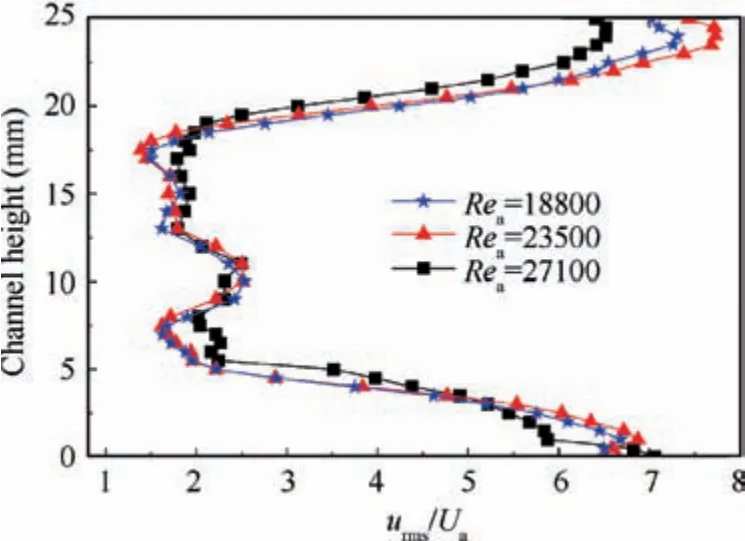
Fig. 5 Profiles of turbulence intensity along centerline of injection cross-section at different Rea.
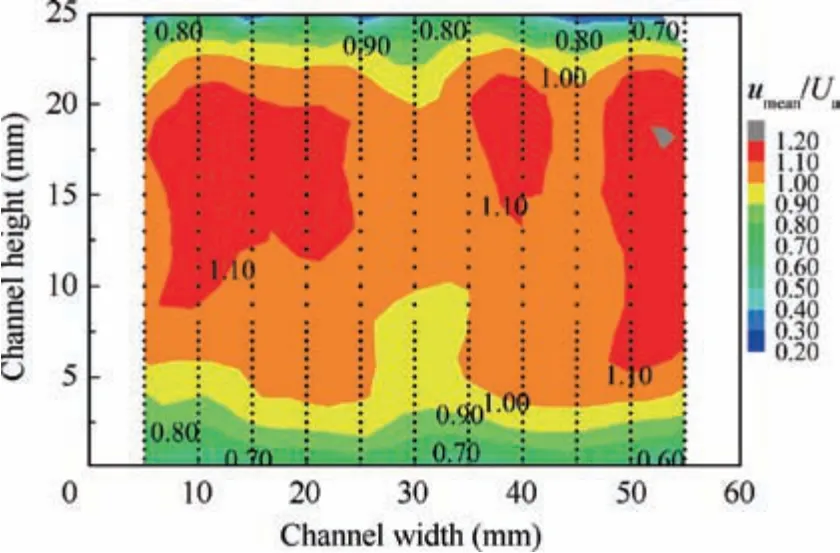
Fig. 6 Contours of dimensionless time-averaged velocity over injection cross-section at Rea=18800 (black solid points present measuring positions).
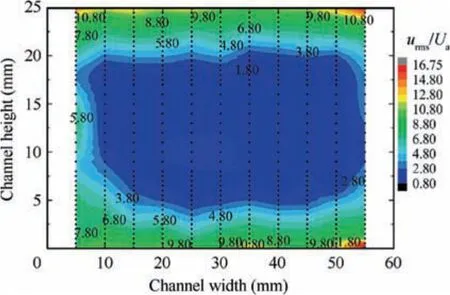
Fig. 7 Contours of streamwise turbulence intensity over injection cross-section at Rea=18800 (black solid points present measuring positions).
3.2. Effect of air temperature
In this section, the ignition delay time sensitivities to air temperature at various reactor pressures and jet-to-crossflow momentum flux ratios were studied.Fig.8 illustrates the experimental histograms at temperature Tavaried from 830 K to 922 K, while the pressure and momentum flux ratio are kept at Pa=1.4 MPa and J=50.
It is found that the τstdof ignition delay sample decreases by 48.9% from 0.317 when the temperature Taincreases from Case 1 (Ta=830±4 K) to Case 4 (Ta=921±1 K), as shown in Fig. 8. The distributions of the histograms become‘‘thinner”with increasing air temperature.The result is consistent with previous studies, MacFarlane et al.35reported that the higher coflow temperature results in ignition kernels forming in narrower spatial range, and results in higher peak formation frequency within coflow field. Markides and Mastorakos18also found that the average time interval of autoignition kernel formation in the flow field decreases with increasing ambient temperature. The above different expressions suggest that the random fluctuation in ignition delay time is becoming weaker at the higher temperature, corresponding to the decreasing of sample standard deviation of ignition delay presented in the present paper. Note that both the jet Reynolds number Rejand air Weber number Weaare maintained at 7670 and 250 for the operating conditions in Fig. 8(the effect of temperature on the surface tension coefficient of jet surface is neglected here), thus it can be concluded that the breakup and atomization of transversal column jet maintain a stable behavior.36,37In this case,the decrease of the standard deviation of ignition delay at high temperature may mainly be associated with the growing number of most reactive mixture fraction spatial sites in the flow field because of the faster evaporation rate of spray,38as a result, the probability of ignition kernels appearance is higher after the spray formation.20
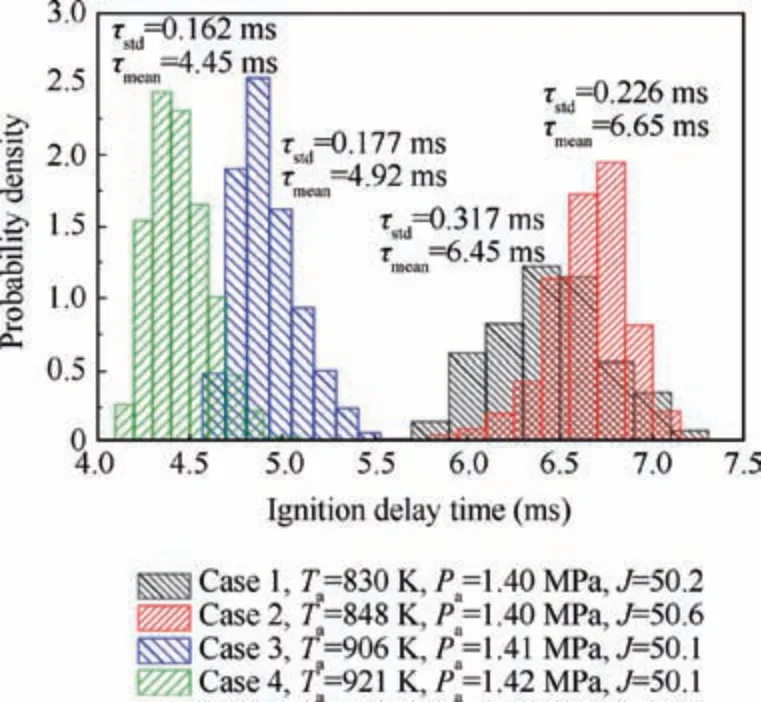
Fig. 8 Effect of air temperature on distributions of IDT at Pa=1.4 MPa, J=50.
The previous studies have measured the ignition delay time of gas-phase kerosene/air mixtures using Shock Tube (ST) or Rapid Compression Machine(RCM),39-44the IDT is the interval between the time of the reflected wave arriving at the endwall(or the end of the compression stroke)and the intercept of the maximum slope of the pressure/OH*/CH* profile back to the baseline.39,41,42,45,46Moreover, it has been demonstrated that there is not distinct difference of ignition times between pressure profile and CH*(or OH*)emission profile.39,41,43,45,46Therefore, whether IDT is measured in ST/RCM or the present flow reactor, they represent the time scale of the ignition kernel formation, while the difference is the underlying physical processes in the IDT. IDT in ST/RCM can be used for evaluating the magnitude of ‘‘pure-chemical ignition delay,τcIDT” based on the fact that autoignition is determined only by chemical kinetics, while the IDT in the present study contains the additional simultaneous coupled processes of the jet breakup, evaporation, mixing. Therefore, comparing the IDT data of premixed gas fuel/air and those of liquid jet fuel/air is aimed at studying preliminarily the effect of the underlying physical processes on the IDT of the liquid fuel/air mixture.
As shown in Fig.9,the IDTs of RP-3 spray at the pressure of 1.4 MPa,momentum flux ratio of 50 are compared with the IDTs of premixed gas-phase RP-3 mixture at 1.5 MPa. The error bars in Fig. 9 indicate ranges of three times of standard deviation away from the mean IDT(τmean±3τstd)based on the present experimental data. These bars imply the actual range of possible value for random ignition delay on the basis of‘‘3-sigma” rule of Gaussian distribution.
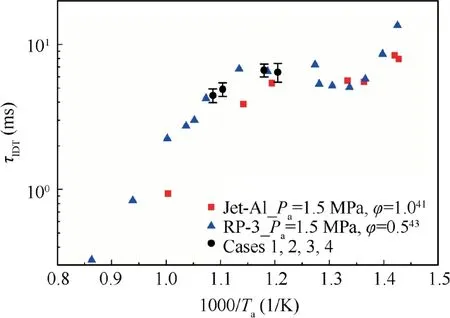
Fig.9 Comparison of ignition delay times of current liquid jet at Pa=1.4 MPa, J=50 with ignition delay times of gas-phase kerosene from previous studies.41,43
The Fig. 9 shows that the τmeanof the liquid jet at 1.4 MPa and momentum flux ratio of 50 in the present study is very close to τcIDTat pressure of 1.5 MPa and equivalence ratio of 1.0. Fig. 9 also shows that the sample mean of IDT, τmean,increases by 0.2 ms (3.1%) when the ambient temperature increases from Case 1 (Ta=830±4 K) to Case 2(Ta=848±5 K), while the τmeandecreases by 2.2 ms(33.1%) when the ambient temperature increases from Case 2 (Ta=848±5 K) to Case 4 (Ta=921±1 K). The variation tendency of τmeanin the present study is in agreement with the results of Ref. 43, especially the Negative Temperature Coefficient (NTC) behavior from Case 1 to Case 2. As a conclusion,although there exists the additional physical processes in the IDT of the liquid fuel jet, the trend of the τmeanhas no distinct difference with the pure-chemical ignition delay time.
As shown in Fig. 10, the effect of air temperature on the shape of the probability density of the ignition delay time for the current kerosene jet is also studied at Pa=1.7 MPa,J=50 and J=80, respectively. Similar to the results in Fig. 8, even at a relatively higher Paor J, increasing ambient temperature causes a decrease in the mean and the standard deviation of the IDT sample.An increase in temperature from Case 7(Ta=890±5 K)to Case 9(Ta=947±2 K)causes a decrease in the mean IDT by 1.0 ms(25.4%),and a decrease in standard deviation of IDT sample by 0.046 ms (51%) at Pa=1.7 MPa and J=50 (Rej≈8500 and Wea≈300). Moreover,the mean IDT decreases by 0.5 ms(15.6%)and standard deviation by 0.038 ms (33.9%) due to the temperature rise from Case 10 (Ta=921±2 K) to Case 11 (Ta=945±4 K)at Pa=1.7 MPa,J=80(Rej≈10600 and Wea≈300).
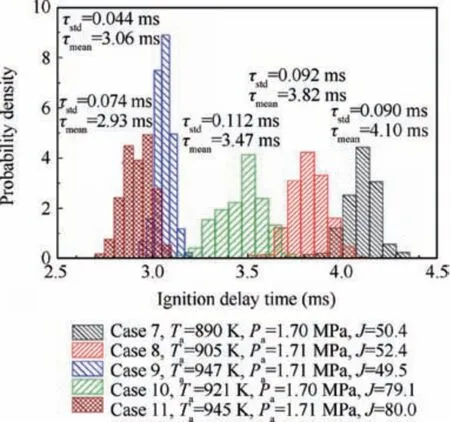
Fig. 10 Effect of air temperature on distributions of IDT at Pa=1.7 MPa, J=50, 80.
3.3. Effect of air pressure
The effect of air pressure (Pa) on the statistical distribution of the ignition delay time for kerosene spray is studied by comparing the distributions at Pa=1.4 MPa and Pa=1.7 MPa.As shown in Fig. 11, the distributions of the IDT at Ta~905 K and J ~50(Case 3 and Case 8),and at Ta~923 K and J ~80 (Case 6 and Case 10), are compared, respectively.
Comparing Case 3 and Case 8 shown in Fig.11.The results indicate that the higher reactor pressure induces a 22.4%decrease from 4.92 ms in τmeanand a 48.3% decrease from 0.177 ms in standard deviation(τstd)of the IDT sample.Herein the increase of reactor pressure causes Weaand Rejrise from 250 and 7600 to 301 and 8600 simultaneously. The effect of reactor pressure Paon the distributions of the IDT can be explained primarily by two mechanisms. (A) the earlier ligaments and drops stripping from the jet surface and smaller Sauter Mean Diameter (SMD) of the spray of the transversal jet. The liquid jet turbulence increases at higher Rej, which enhances the stripping of ligaments and drops from the jet surface and then accelerates the onset of the jet breakup.47,48Furthermore, the drop size distribution becomes more uniform and the drop size at the peak of the distribution becomes smaller as Weaincreases.49As a result, it is more possible for the most reactive mixture sites to establish faster and in larger quantities. (B) the more intense chemical reaction caused by high pressure.Higher pressure induces a more intense chemical reaction resulting from a higher reactant concentration and higher molecular collision probability.As a result,the distributions of the IDT for kerosene spray exhibit a smaller central tendency and a narrower fluctuation extension as the pressure increases.
Compared with Case 6 (Pa=1.41 MPa) and Case 10(Pa=1.70 MPa), it also shows that higher pressure results in a decrease of 16.6% from 4.16 ms, but the standard deviation of IDT samples increases slightly by 0.015 ms (15.5%).The anomalous behavior of standard deviation may be associated with the significant decrease of the maintained air temperature from Case 6 to Case 10 in the experiment.
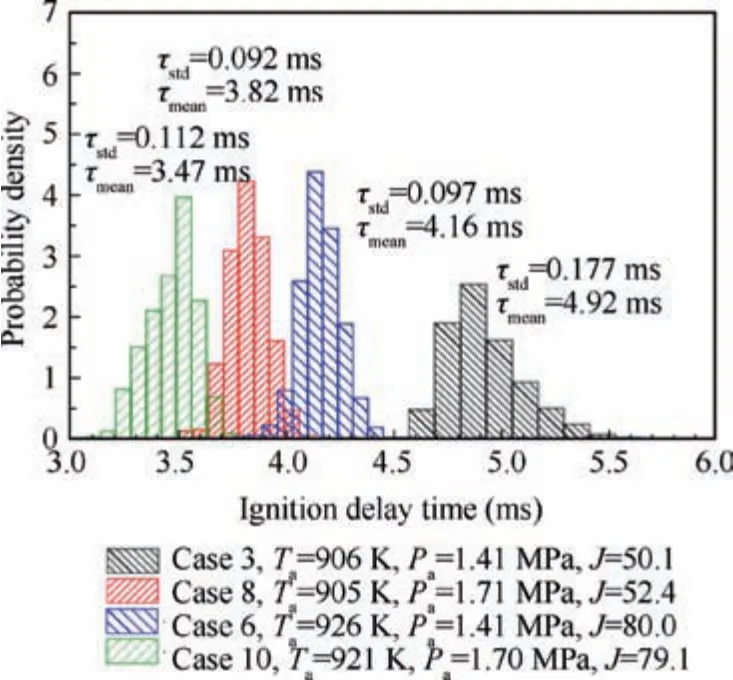
Fig. 11 Effect of air pressure on distributions of IDT for kerosene spray at Ta=905, 925 K, J=50, 80.
3.4. Effect of jet-to-crossflow momentum flux ratio
The influence of jet-to-crossflow momentum flux ratio (J) on the distribution of the ignition delay is studied at pressures of around Pa=1.4 MPa, and temperature of around Ta=925 K.
The resulting histograms in Fig.12 show that increasing jetto-crossflow momentum flux ratio (from 20 to 80) causes an 18.6% decrease from 5.11 ms in the mean IDT at Ta=925 K, Pa=1.4 MPa. Data presented by Pei et al.50shows a similar reduction in ignition delays of n-dodecane spray with increasing injection pressure, which can also be described as the increase in the momentum flux ratio. In addition,the results shown in Fig.12 also suggest that the standard deviation of the IDT decreases by 54.0% from 0.211 ms with increasing the momentum flux ratio (J).
The chemical kinetics produces a fixed chemical timescale for a given reactor pressure and temperature, however, the air Weber number Weais maintained at 250 and the jet Reynolds number Rejincreases from 5100 to 9700 corresponding to the increase in momentum flux ratio.It is noting that,when the air temperature and pressure in the flow reactor are maintained for Case 4,5,and 6,the air flow velocity and air density remain constant, the increasing jet-to-crossflow momentum flux ratio and the jet Reynolds number is mainly caused by the increasing fuel pressure drop (Pj-Pa). Thus, the change of the parameter space of distribution of the IDT is associated with the effect of the jet turbulence and mixture formation.On the one hand, the mixed breakup regime (column and surface breakup) of transversal liquid jet is translated to surface breakup with increasing Rej22,37,51the droplets start to be stripped along the trajectory of the liquid jet, furthermore,the surface stripping occurs closer to the orifice exit with increasing Rej36;On the other hand,surface breakup intensifies with increasing Rej, which in turn results in smaller SMD of droplets,52,53as presented in Song’s study,49it is found that the increase in jet-to-crossflow momentum flux ratio causes the smaller droplet size at the peak of the distribution for a given air Weber number Weaand reactor pressure Pa. Those factors allow the liquid jet to break up faster and to form spray with smaller SMD, which results in a mixture with most reactive mixture fraction at more spatial sites. Thus, the ignition delays have smaller overall-central value and weaker random fluctuation after a collection of enough transient injection events.
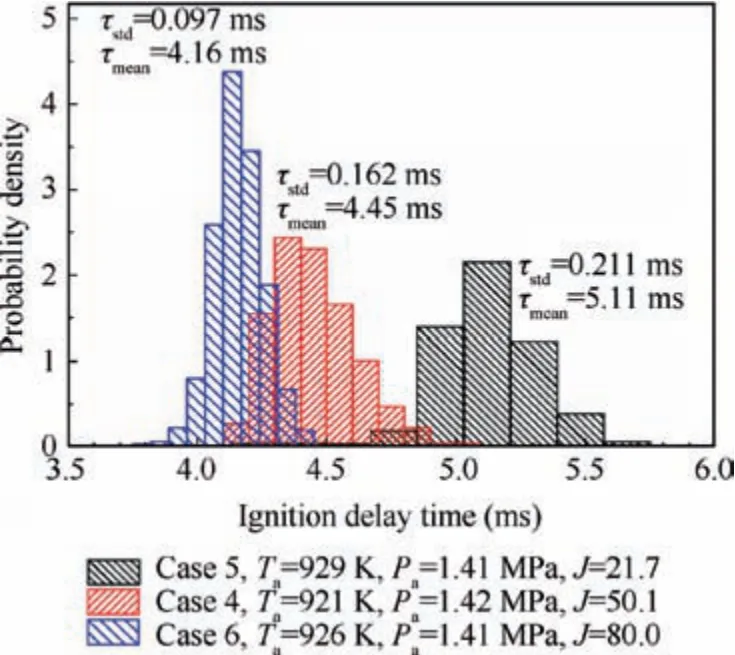
Fig. 12 Effect of jet-to-crossflow momentum flux ratio on distributions of IDT at Ta=925 K, Pa=1.4 MPa.
As mentioned earlier, the IDT is influenced by the jet breakup, vaporization, and mixing of liquid fuel. The initial atomization characteristics of the fuel injector will also affect the IDT. Therefore, the future research work need more emphasis on the initial spray characteristics at different momentum flux ratios (J) and the connection with the observed fluctuations in IDT.
3.5. Ignition delay correlation
The experimental distributions of the ignition delay time for kerosene spray are the most reliable database for validating modes of the spray autoignition. Thus the distributions in the present paper are characterized through a series of correlations that embody the effects of the breakup, vaporization,mixing and chemical reaction. Considering that the initial atomization characteristics of the injector are mainly affected by Reynolds number (Rej), air Weber number (Wea), jet-tocrossflow momentum flux ratio (J), density ratio (ρj/ρa), and viscosity ratio(μj/μa)37,51,thus the correlations are established by using the parameters as shown in Eqs. (3) and (4). Herein the correlations to represent the sample mean (τmean) and the sample standard deviation(τstd)of the IDT are deduced based on the present experimental data expect the NTC region(Case 1).Assuming the correlation of τmeanoutside the NTC region is power-law dependence on Pa,J,Wea, and Rea/Rej, Arrhenius type dependence on air temperature Ta; the correlation of τstdis power-law dependence on Pa, Wea, and Rea/Rej, and Arrhenius-like type dependence on J and Tabased on the trends of sample data. In these correlations, IDT, Pa, and Taare in units of ms, MPa, and K, respectively. The correlations estimated through multiple linear regression analysis can be described as follows:
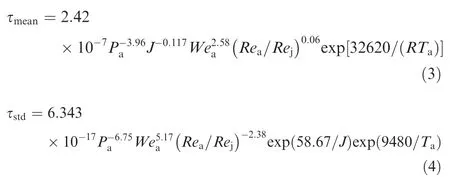
where R=8.314 J/(mol•K) is the universal gas constant, the resulting correlation coefficients R2of the above correlations are 99.4% and 81.6%, respectively. The application scope of the correlations is Pa=1.4 -1.7 MPa, Ta=848 -947 K,J=20 -80, Wea=247 -302, and Rea/Rej=2.2 -4.2.
Fig.13 illustrates the Arrhenius type correlations of IDT in the present study, all the correlations and data points in the Fig. 13 are scaled to a condition of Pa,0=1.4 MPa, J0=50,Wea,0=250, Rea/Rej=3.0. The solid black line represents the correlation of τmean, two black dash lines represent the upper and lower bounds calculated from τmean±3τstd. The range between two boundaries approximately represent the fluctuation amplitude of the random ignition delays in the present study, the range is far greater than the random error of every individual ignition delay measurement (less than±2.0% calculated in Section 2.4). It suggests that the current experiment system is able to capture the random information of the ignition delay time.
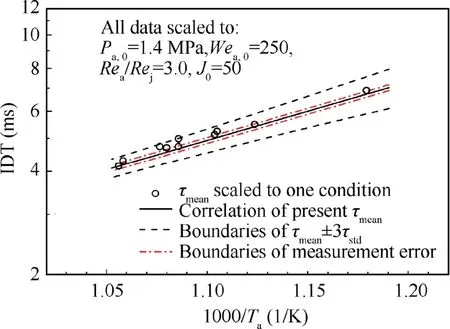
Fig. 13 Correlations of current results (the bars represent range of τmean±3τstd based on experimental data).
The obtained τmeancorrelation provides insights into the relative sensitivity of the ignition delays to various parameters.Note that the correlation of τmeanshows a pressure exponent of -3.96, its absolute value is larger than that of -0.71 for RP-3 observed by Mao et al. in ST measurement,43and that of -0.89 for Jet-A1 observed by De Toni et al. in shock tube as well.42It suggests that there is greater significance pressure dependence of non-premixed spray autoignition than that of the gas-phase mixtures. Comparing the parameter exponents in the correlation of τmean,it can be concluded that the sample mean τmeanof IDT of non-premixed fuel/air has greater significance dependence on pressure Paand air Weber number Wea,and lower sensitivities of τmeanto momentum flux ratio(J)and Rea/Rej.
Generally, the value of the global activation energy of premixed gas mixtures, which is determined by the slope of IDT correlation in Arrhenius plot, represents the sensitivity of the IDT to the air temperature.The value derived from the present τmeancorrelation is 32.62 kJ/mol, which is much less than 92.19 kJ/mol of RP-3 reported by Mao et al.43, less than 91.7 kJ/mol derived from Zhang et al.39, and also much less than values for other jet fuels at high temperatures(Ta>1000 K) reported by previous literatures.42,54,55It suggests that the sensitivity of τmeanto air temperature for nonpremixed fuel spray/air is weaker than that for premixed gas fuel/air.The result is in agreement with the autoignition of single droplets in air concluded by numerical simulations,56which shows that compared with a homogeneous gas mixture, the slope of the Arrhenius plot is diminished due to the interaction between physical and chemical processes.Moreover,note that the interval of the lines of τmean±3τstdin Fig.13 decreases with increasing air temperature, it agrees with the trends of the amplitude of the random fluctuation of the ignition delay time with air temperature.
4. Conclusions
In the present paper, the statistical characteristics of random ignition delay time for aviation kerosene spray formed by transversal injection into crossflow are studied using flow reactor with optical accesses at various conditions spanning a temperature Tarange from 830 to 950 K, pressure Paof 1.4 MPa and 1.7 MPa, and jet-to-crossflow momentum flux ratio J of 20, 50 and 80. The conclusions are as follows:
(1) An increase in temperature decreases the sample mean of ignition delay time outside the NTC region and also decreases the sample standard deviation, which characterizes the fluctuation amplitude of ignition delay samples. Similarly, an increase in jet-to-crossflow momentum flux ratio, which also means an increase in jet Reynolds number, causes a lower sample mean and standard deviation of the ignition delay time.
(2) There is a stronger pressure dependence and weaker temperature dependence of non-premixed spray autoignition than those of the premixed gas kerosene/air.
(3) The sample mean of the ignition delay time (τmean) of non-premixed kerosene/air has a greater significance dependence on pressure Paand air Weber number Wea, and a lower sensitivities to momentum flux ratio(J) and Rea/Rej.
Declaration of Competing Interest
The authors declare that they have no known competing financial interests or personal relationships that could have appeared to influence the work reported in this paper.
Acknowledgements
This study was supported by the National Natural Science Foundation of China (Nos. 91641109 and 61827802).
 CHINESE JOURNAL OF AERONAUTICS2021年12期
- CHINESE JOURNAL OF AERONAUTICS的其它文章
- Entropy based inverse design of aircraft mission success space in system-of-systems confrontation
- Nonlinear resonance characteristics of a dual-rotor system with a local defect on the inner ring of the inter-shaft bearing
- Failure mechanisms of bolted flanges in aero-engine casings subjected to impact loading
- Synchronized perturbation elimination and DOA estimation via signal selection mechanism and parallel deep capsule networks in multipath environment
- Improving seeking precision by utilizing ghost imaging in a semi-active quadrant detection seeker
- A high dynamics algorithm based on steepest ascent method for GNSS receiver
