Microstructural characterization and mechanical behavior analysis of 7075-T6 aluminum subjected to simulated lightning strikes
Luis Henrique SANTOS, Weslei Patrick Teodo´sio SOUSA,Sara Silva Ferreira DE DAFE´ , Pedro Ame´rico Magalha˜es JUNIOR
Department of Mechanical Engineering, Pontifı´cia Universidade Cato´lica de Minas Gerais, Belo Horizonte 30535-901, Brazil
KEYWORDS Aircraft structure;Characterization techniques;Lightning strikes;Precipitates;Microcracks
Abstract Aircrafts damages caused by lightning strikes have been known since the early days of aviation. However, the physical effects on the aircraft structure are still being investigated. This work seeks to evaluate the lightning strike effects in the aluminum alloy 7075-T6.Samples were submitted to lightning strike simulation in laboratory and the damages evaluated through characterization techniques. Ultrasound and profilometry tests have shown material loss to 0.272 mm depth in the damaged region. In addition, it was detected the material accumulation occurrence in the damage vicinity of the region.Below the damage,it was found a region where metallurgical changes were identified.The tensile and microhardness tests results have shown reduction in the percentage elongation and hardness increasing in the material affected by lightning. These results are corroborated by the X-Ray Diffraction(XRD)and Rietveld Method(red line)that indicated an increasing in dislocation density and micro-deformation in the material matrix. Optical microscopy results have shown the presence of microcracks on the normal and cross-section surface of the samples damaged.The Energy Dispersive X-Ray Spectroscopy(EDXS)and Electron Backscattered Diffraction Test (EBSD) found coarse intermetallic phases and precipitates compounds with dimensions greater than 1 μm in length.They were responsible for nucleation of the microcracks that propagate along the material grain boundaries.
1. Introduction
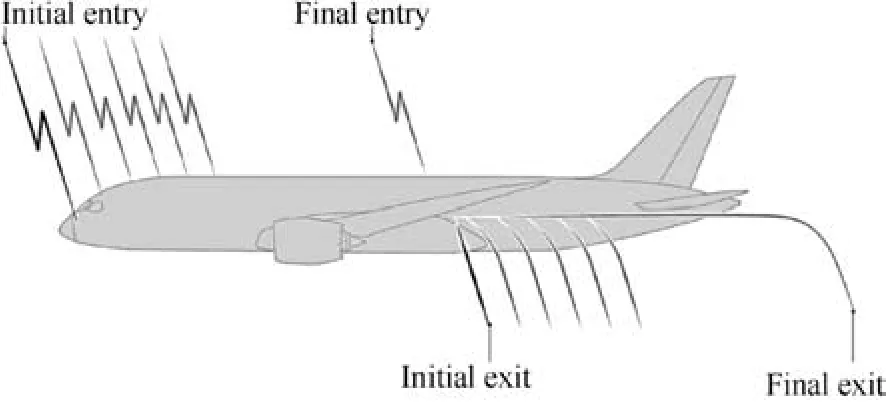
Fig. 1 Swept effect at aircraft structure.
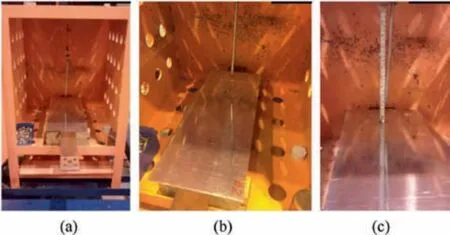
Fig. 5 Test cage assembly.
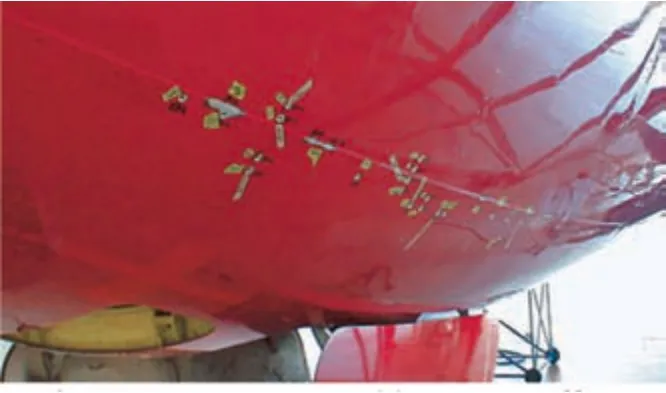
Fig. 2 Damages caused by swept effect.
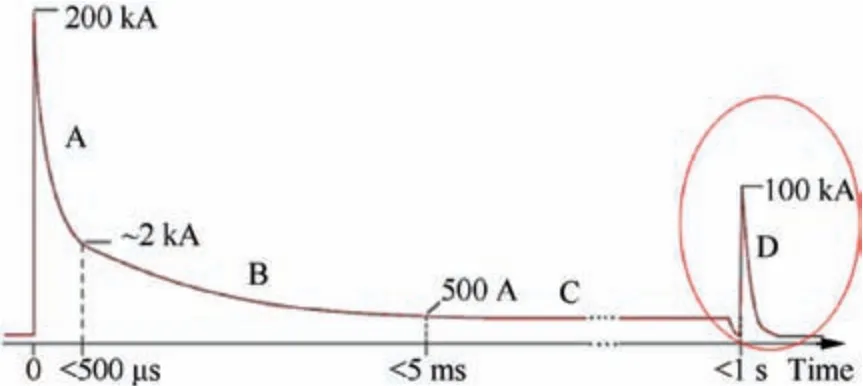
Fig. 3 Waveforms used in aircraft lightning tests.
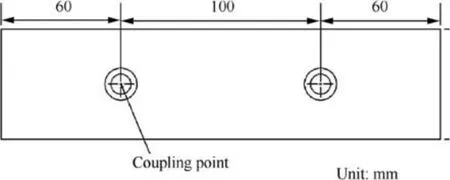
Fig. 4 Distance between coupling points in millimeters.
Aircraft damages made by lightning strikes have been known since the early days of aviation. However, the physical effects on the aircraft structure are still being investigated. Statistical data indicate that every 3000 flight hours,it had been seen that a commercial aircraft is struck by lightning.1It is a not long range considering the number of aircrafts in operation in the world. Lightning strike damages are characterized by small burned regions on the metallic and non-metallic aircraft structural surfaces and material loss may occurs. Material loss depends on the electric current intensity and the duration of the phenomenon.This type of damage can affect the structural parts and components of the aircraft, such as fuselage aluminum sheets, stringers and structural beans through the loss of material by sublimation due to the high temperature in the areas damaged by lightning.2,3Among the effects caused by interaction between lightning and aircraft, the ‘‘swept effect” is considered one of most destructive phenomena.4It occurs when a lightning coupling point changes its position due the relative movement of the aircraft during flight, as shown in Fig.1.This movement also changes the region where the lightning leaves the aircraft structure to the atmosphere.The results are multiple damages spread over a large region of the aircraft structure.2,3,5
Wings and stabilizes tips have a great incidence of lightening coupling effect because these regions are most ionized during flight.2,6So,they have a greater incidence of the lightening coupling. However,the greatest damage, such as hot spot and loss of material, occurs when lightening get off the aircraft fuselage structure to the atmosphere.4,5,6Fig. 2 shows several damages,caused by the swept effect,on the fuselage of a Boeing model 737. There are several small damages spread by the fuselage.They are caused when electrical current leaves the aircraft structure.
Hot spots temperature depends on electric current density,the amount of electric charge transferred and the duration time of this phenomenon. Laboratory tests indicate temperatures around 34000°C.7The phenomena of energy balance follows8:
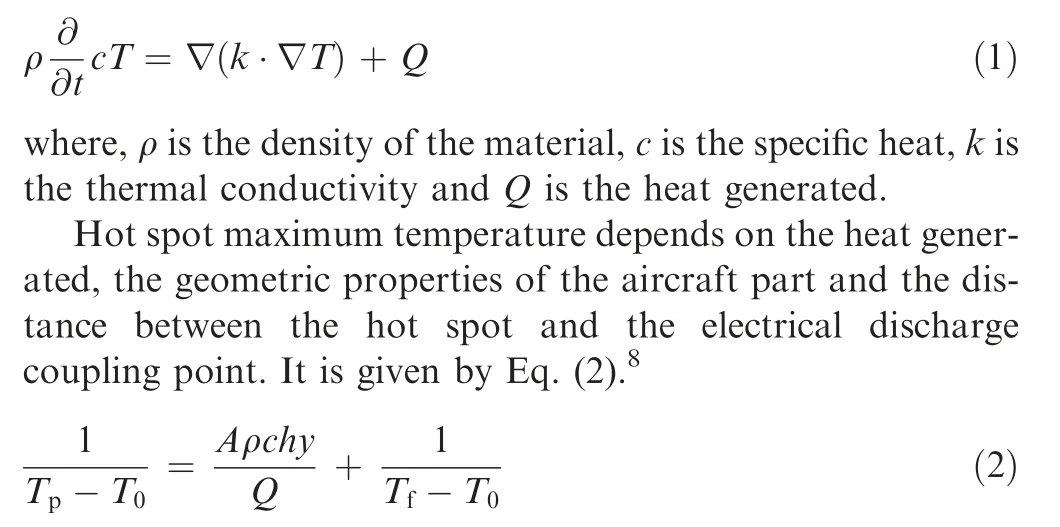
where, A is a dimensionless constant equal to 4.133, c is the specific heat of the material, h is the thickness of the part, y is the distance from the coupling point to the damage, Tfis the melting temperature of the material, T0is the initial temperature of the material, Tpis the maximum temperature at the hot spot.
Lightning strike damages at pressurized aircraft is dangerous because the differential pressure can reach 8 psi.9Structural repairs must follow the instructions of maintenance manuals and normally can be done in two levels: the first one is the ‘Belding Repair’ and the second is the ‘Flush Repair’. In the first level, the damage is removed by localized sanding followed by ultrasound measurement. In the second one, repair consists of removing the entire affected region of the aircraft skin, followed by installing new sections properly adjusted and riveted.10Both procedures are common practice in the aviation industry. So, technical information about the behavior of aluminum 2024 and 7075 under lightning strike damages is relevant to understand and improve the project and maintenance procedures and may allow reducing maintenance cost and increasing flight safety.
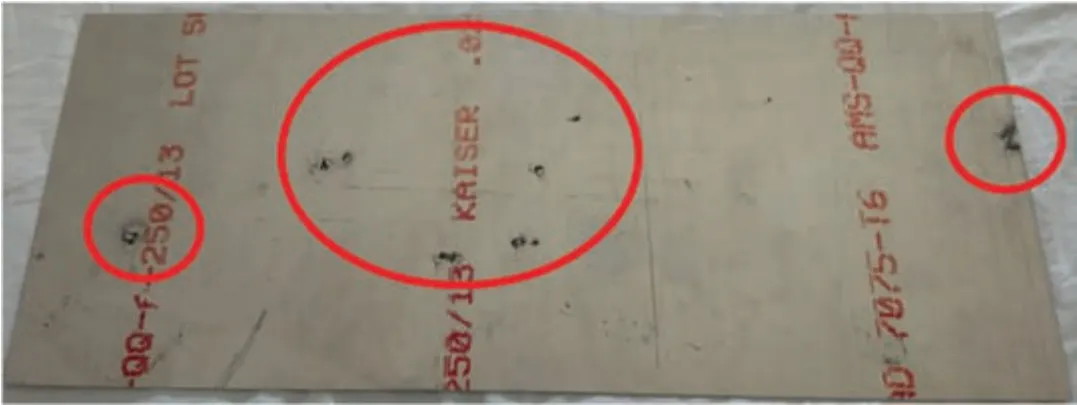
Fig. 6 Damages like swept effect found at electrical current output.
After several literature searches, it was not found many information about mechanical behavior of 7075 aluminum alloy under lightning strike. This research aims to understand what happens when this material is lightning hit using different characterization techniques in the laboratory. Analysis about lightning strike damages in samples was measured by ultrasound and profilometry.Changes in the mechanical characteristics such as strength stress, elongation, and microhardness,were evaluated through tensile test and microhardness test.
The XRD analysis was carried out to investigate microdeformation and dislocation density by Rietveld Method using Materials Analysis Using Diffraction(MAUD).Finally,it was looking for the presence of precipitates or new intermetallic phases by metallography techniques as Optical Microscope,Scanning Electron Microscopy (SEM), Energy-Dispersive Xray Spectroscopy(EDXS)and Electron Backscattered Diffraction (EBSD). The results shown that lightning strikes with electrical current intensity to 100 kA and D-waveform cause hot spots on 1 mm thick 7075-T6 aeronautical aluminum sheets. This phenomenon causes the formation of precipitates such as Al17Cu2Fe, Al13Fe4and Mg2Si greater than 1 μm that cause stress fields in the material crystal lattice. These stress fields generate nucleation of microcracks that propagate through the grain boundaries.
2. Materials and methods
2.1. Lightning test
The lightning tests were conducted in accordance with SAE 5412, SAE 5414, and SAE 5416 and performed in a high current generator triggered to electrical current shots to 100 kA for 0.8 seconds.The D current waveform was chosen as shown in Fig.3.Waveforms A and D were responsible for significant damages at the aircraft structure and D waveform allowed the best reproduction of the swept effect in laboratory.11
Five sheets, dimension 550 mm long, 250 mm wide and 1 mm thick.11were tested. The 7075 used in this research was purchased as laminated sheet, T6 heat-treated, manufactured by Kaiser Aluminum S/A.The lightning coupling points were defined as Fig. 4.
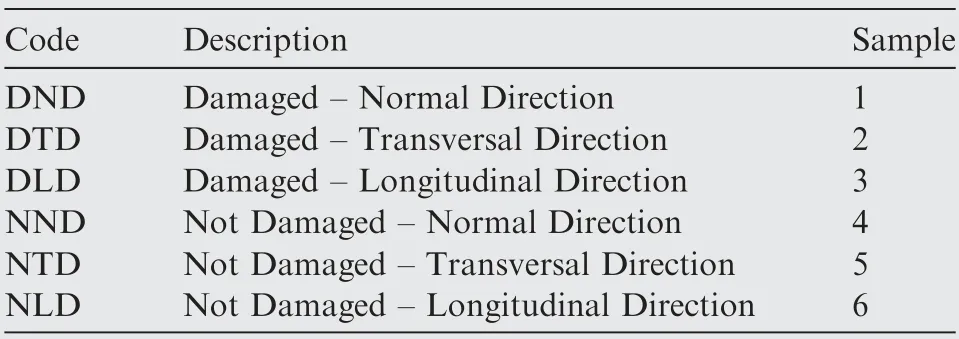
Table 1 Samples coding.

Table 2 EBSD Confidence Index (CI) and Image Quality(IQ).
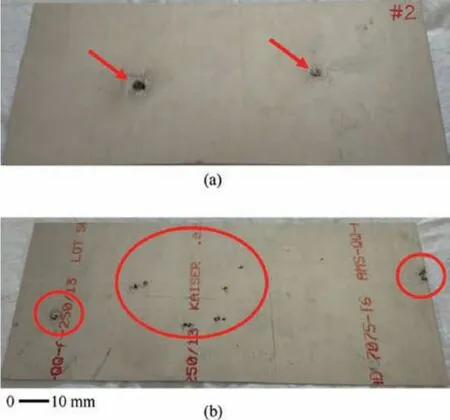
Fig. 7 Damages in sheet 2 after lightning test.
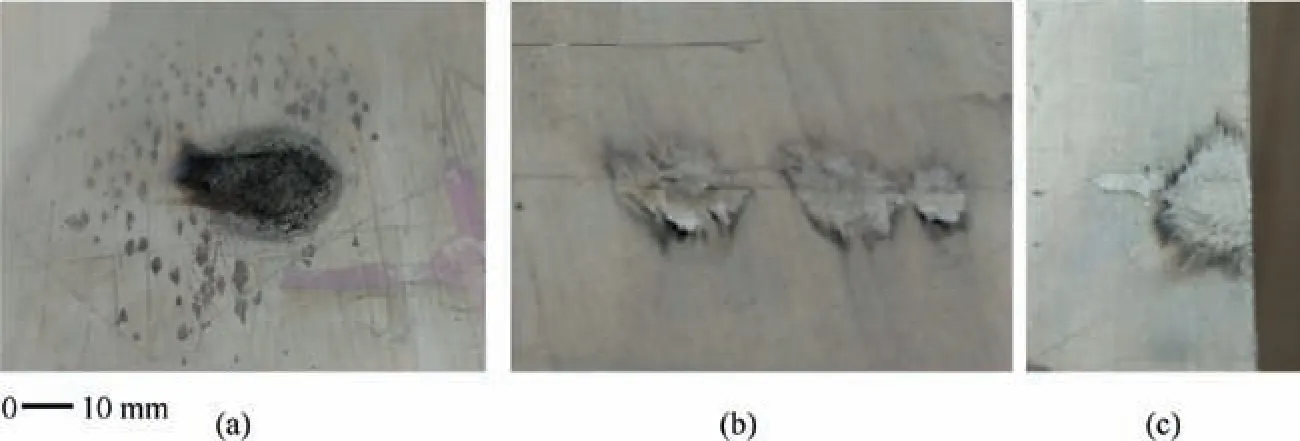
Fig. 8 Damages checked by ultrasound test.
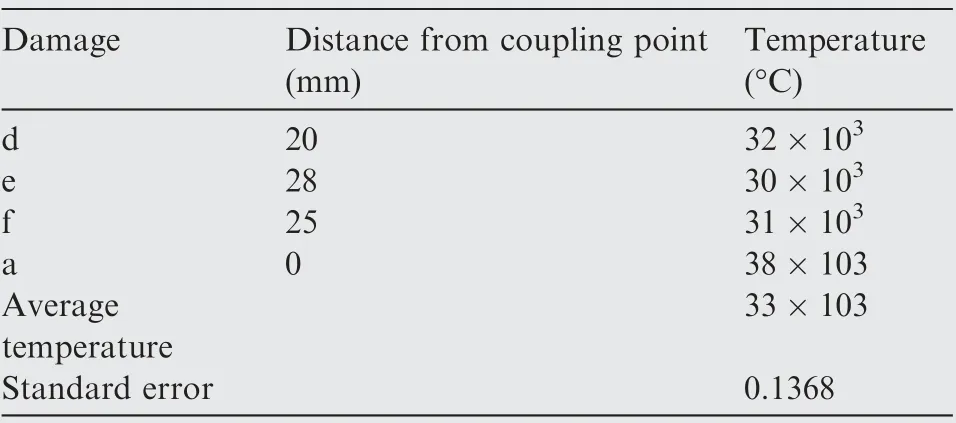
Table 3 Damage temperature estimated.
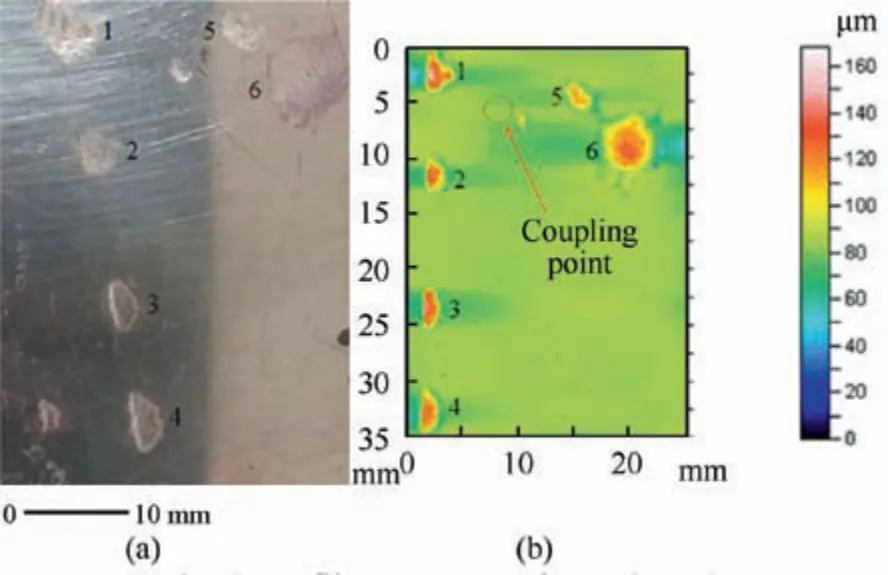
Fig. 9 Profilometry map from sheet 3.
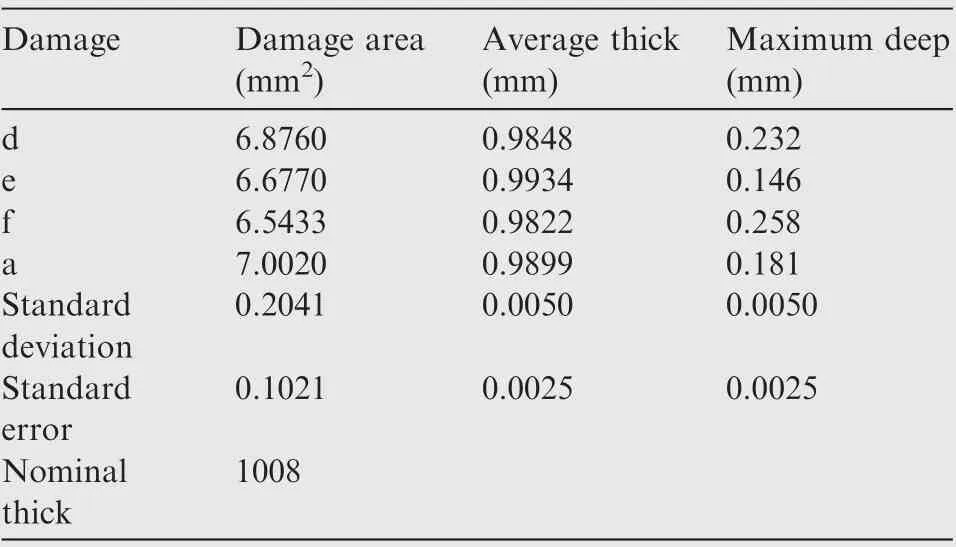
Table 4 Results from ultrasound test.
The temperature in the moment test was 26°C,atmospheric pressure of 1018 millibars(mb)and humidity at 52%.Samples were mounted on the inner base of the test cage to keep the same electrical potential. A stainless-steel electrode was fitted at 55 mm from each coupling point as shown in Fig. 5. This distance was established experimentally after several electrical current shots.The test cage was grounded through a cable connected to the laboratory main ground point.
After turning on the high current generator,the voltage was set to 126.1 kV.This caused a potential difference between the electrode and the specimen. Consequently, electrical current is triggered at 100 kA, as requested by SAE 5416. The electric current travels through the specimen and in doing so ionizes the air around it. At a certain moment, the electric current is transferred to the grounded base of the test cage through an electric arc created by the potential difference between the two surfaces. Damages like the swept effect was observed at the electrical current output as shown in Fig. 6.

Table 5 Maximum depths found in damage regions after profilometry tests.
2.2. Characterization techniques
Characterization techniques were used to check mechanical and metallurgical modifications in the 7075 samples subjected to lightning tests. Samples were removed from sheets tested in the lightning test and prepared as described in the American Society for Testing and Materials (ASTM) E311. A specific code was applied on each one. Table 1 presents samples coding.
2.2.1. Metallography (through optical and SEM) and EDXS(chemical analysis)
Grain size measurement was done by Metallography Technique. Ten microstructure images from sample 1 were compared to ten images from sample 4 following ASTM E112-96 procedures. Samples were conventionally prepared, and Keller’s solution was applied on the samples surface, from 10 to 20 s, for reveledthe grains boundaries.12The 100× magnification Axio®Scope A1 Optical Microscope and AXIO®Vision software version 4.8.2 were used to catch and identify images.It was measured 200 grains per sample. The SEM model JSM 6510LV was used for chemical analysis.

Fig. 10 Profile test for damages 1, 2 and 3 from sheet 3.
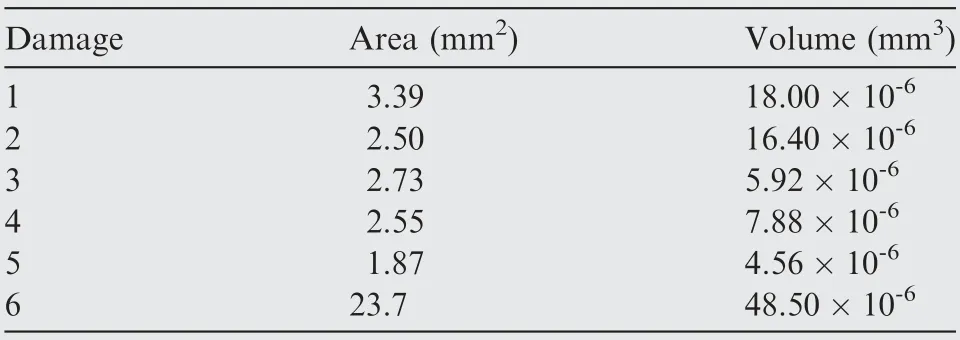
Table 6 Area and volume of material removed.
2.2.2. Ultrasound and profilometry
Damages at sample 3 were measured by ultrasound, as described in ASTM E797 and E797M - 15 standards. The sample 3 was cleaned and finished with 180 and 320 mesh sandpaper and polishing were performed before tests and alcohol was used to remove any dirt after each step.Sonatest III®ultrasound equipment and Gel B2 (glycerine base) manufactured by Olimpus®were used.The Profilometer T8000 model manufactured by Hommelwerk® and TKU 300® probe (stylus N° 231,289 5/90 tip angle 90° and radius 5 μm) were used to check damages profile. The scan patterns were adjusted through Turbo Wave®software version 2.0.The topographies map was generated by Hommelmap Expert version 6.2 software®.The lateral scanning step was adjusted for 10 μm,measuring point spacing value was 1 μm and the scanning speed of 0.50 mm/s.
2.2.3. Tensile testing and microhardness test
The tensile test was performed in six samples, three damaged and three not damaged. The test aimed to check changes in the tensile strength,yield strength and ductility of the material.The EMIC GR048® Traction and Compression Testing Machine and clip gage strain gauge sensors were used.The rate of the tests was kept in 12.5 mm/min. The microhardness test was performed by Shimadzu DUH - 211S® machine (Vickers penetrator). After each indentation, the hardness values were measured using the DUH-21 software®. Measurements were taken in two distinct lines: L1 and L2 in a straight line where indentations were made from top surface (coupling point region)to down.This test seeks to verify the variation of hardness along the cross-section of the sheet.
2.2.4.X-Ray Diffraction test(XRD)and simulation by Rietveld Method
The X-Ray Diffraction (XRD) allowed evaluating the existence of micro-stress and micro-deformation in the crystal lattice of the material. The diffractometer Shimadzu model XDR-77000® equipped with cooper filament was adjusted with 40 kV and 30 mA. The scanning angle was kept from 15° to 100° and scanning speed of 2°/min. This configuration was made before testing starts. The collected data were simulated by the Rietveld Method.13Simulations of X-ray spectra consisted of collect data adjusting to a standard considered as a reference.This task was done through mathematical methods and software made the job accurate and more dynamic.One of the software available for treatment of X-ray spectra was MAUD version 2.80.14,15The MAUD works by Rietveld Method for data refinement. Using this program, properties such as number of phases,planar defects and lattice parameter could be evaluated. Strain size analyses, crystalline size and micro-strain parameters were check by Popa Model.16
2.2.5. Electron Backscattered Diffraction test - EBSD
The EBSD analyses were done in the samples 1,2,4 and 5,as a result the phase map, misorientation and grain boundaries were obtained. The MEV FEI Quanta 400, equipped with EBSD E-Flash detector, manufactured by BRUCKER was used. The MEV was adjusted in two different forms, depending on the section direction to be analyzed.In normal direction(samples 1 and 4), the equipment was adjusted with step size:0.82 μm; working distance (wd): 13.1 mm; voltage:30 keV and magnification: 150×. For transversal direction(samples 2 and 5), the step size was: 0.70 μm, wd: 16.8 mm,voltage: 30 keV, magnification: 300×. The Confidence Index(CI) and Image Quality (IQ) are presented in Table 2.

Table 7 Tensile test results.
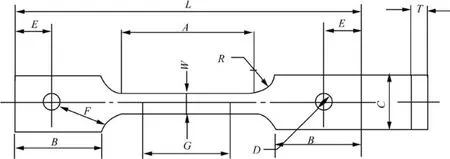
Fig. 11 Specimen shape for tensile test (ASTM E8).

Table 8 X-ray diffraction data.

Table 9 Grain size computing.
3. Results and discussions
3.1. Lightning tests results
After visual inspection,the swept effect was detected on the all five sheets. It was found circular damages, characterized by larger and well-defined points on the lightning coupling point regions. On the other face of the sheets, it was verified several small damages characterized for multiple points spread around coupling points. Those damages were made when electrical current leaved the sheet to atmosphere.Sheets’edges were also damaged. It was detected depressions indicating material loss in the all damaged regions. Fig. 7 presents damages at sheet number 2. Fig. 7 (a) presents damages on coupling point and Fig. 7 (b) damages on the other side.
Three damages from sheet 2 is shown in Fig. 8. Damage a(Fig. 8(b)) is on the coupling point. Damages b (Fig. 8(b))and c (Fig. 8(c)) are located on the electrical current output regions. It was also detected material displacement in the all damages.
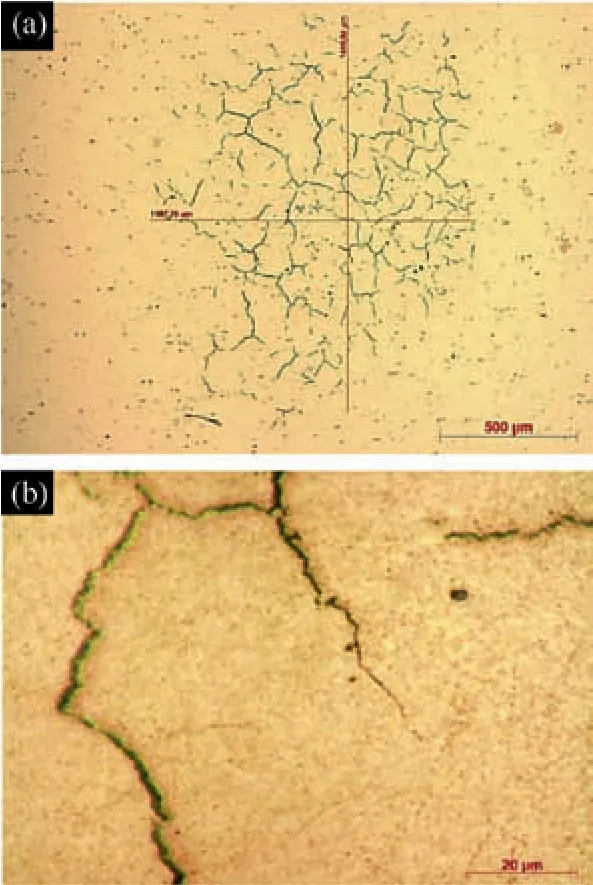
Fig. 12 Microcracks in damage area.
Temperatures at damages in the sheet 2 were estimated by Eq. (2) and presented in Table 3. The highest temperature was found at the coupling point, damage a. Damages d and f closest to the coupling point,reached the highest temperature than damage e, farthest from the coupling point.3,7,8
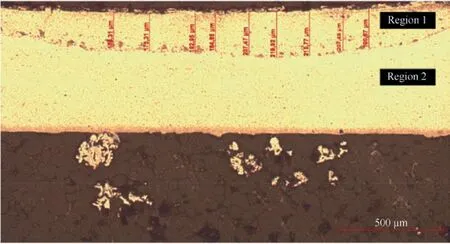
Fig. 13 Cross-section analysis from sample 2.

Fig. 14 EDXS results - precipitate formation (1000×).
Results from ultrasound measurements are shown in Table 4. It was possible to see the damage area (mm2), the average thick on the damage region (mm) and the maximum deep on the damage region (mm). The deepest damages were observed in d and f. In accordance with Table 3, those damages also reached the highest temperatures. They were closest to coupling points.7,8
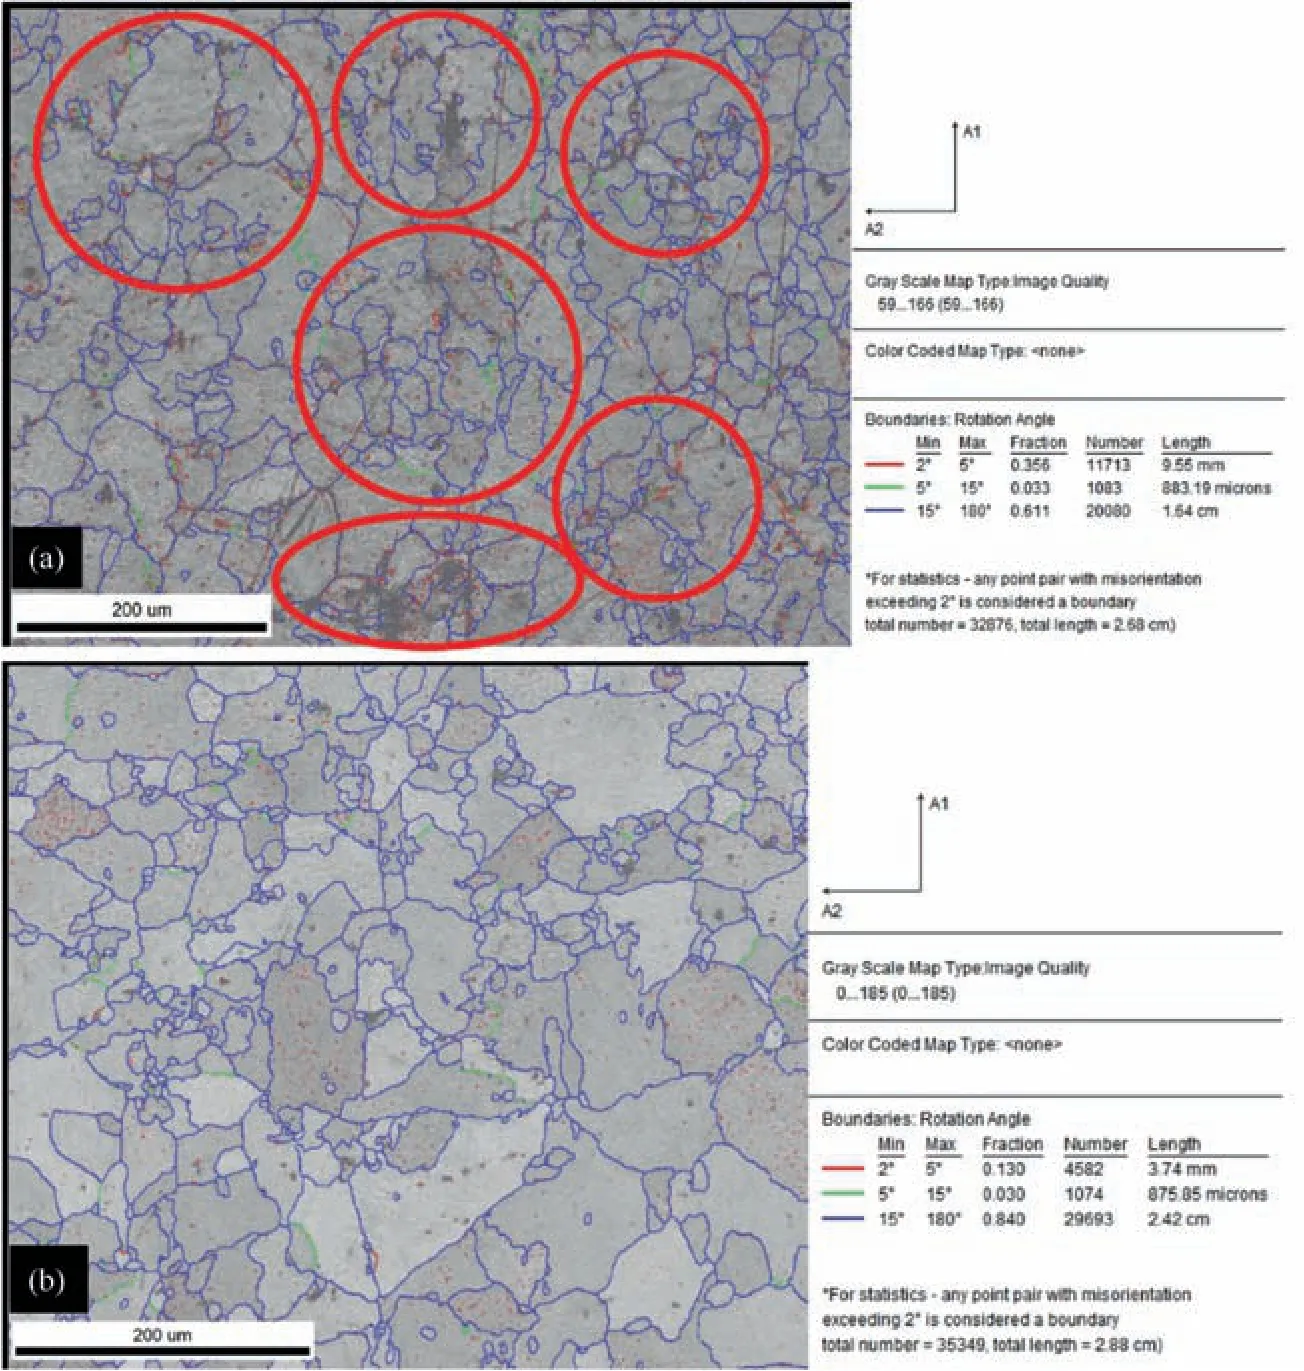
Fig.15 EBSD grain boundaries map in sample 1 (a) and 4 (b).
The profilometry was performed in a sample from sheet 3.Multiple damages were made by electrical current output,during the lightning test. According to SAE 5416, the grounding applied between the base of the test cage and the aluminum sheet provides the damages spread and consequently the simulation of the swept effect.The profilometry map is presented in Fig.9.The coupling point is located on the opposite side of the sheet. Damage were caused by the swept effect that expelled the material from the sheet with eventual deposition of the material at the edges of the damage.4-6
Table 5 shows the highest depths that could be found in damages 1,2 and 6.All of them were located near the coupling point. Damage 5 did not have high material loss by considering an extension of damage 6.
Damage Profile Test is shown in Fig.10.Images from damages 1, 2 and 3 were made under 5× magnification. Depressions are in blue and ledges in red. Damages 1 and 2 were closer to the coupling point and, therefore, reached a higher temperature. If compared to damage 3, they also presented more material accumulation in its surroundings. The material released,when electric current leaves the sheet,created protrusions around depressions.
Table 6 shows the area and volume of material removed from each damage.Damages 1,2 and 6 showed the largest volume reductions. This result reinforces the data shown in Table 5. Same damages were deeper.
3.2. Tensile tests results
The results for tensile test can be seen in Table 7. Six specimens were prepared according to the ASTM E8 standard.17Among them, three were damaged by electrical current and others did not. The damage generated by the electrical current was kept within the reduction zone (G), as shown in Fig. 11.
The temperature was kept at 25°C.EMIC®GR048 tensile and compression testing machine, maximum capacity of 200 kilos-Newton (kN) was used and the speed was adjusted to 12.5 mm/min. It was confirmed reduction in yield stress,strength limit and elongation in the specimens that were damaged by electric current. The mean yield stress decreased by 4.3% and the mean yield strength decreased by 6% compared to the undamaged samples. The most affected feature was the percentual elongation that decreased by 48.77%. It suggests a decrease in the ductility of the material.
Aluminum 7075 increases the strength limit, yield strength and hardness,after rapid cooling during heat treatments above 140°C. However, the percentage elongation decreases.18,19In this case, assisted diffusion mechanism contributes for intermetallic phases and precipitates formation.20,21In addition,coarse grains greater than 1 μm in length cause negative effects on aluminum mechanical properties as hardness and resilience.Changes in the hardness, resilience and strength limit can affect the behavior of the material when subjected to fatigue.22,23The increase in hardness due to the formation of coarse grains greater than 1 μm in length may cause stress fields in the crystal lattice of the material allowing the reduction of resilience, microcracks nucleation and consequent reduction of life in fatigue.23This statement suggests the appearance of coarse grains greater than 1 μm in the crystal lattice of the material damaged by swept effect.
3.3. Microhardness test and X-ray diffraction results
Microhardness test was performed on 2 and 5 cross-section samples, between 250 μm and 460 μm, below the damage region. After comparing data, it was found 17% hardness increasing in this region. Hardness increasing suggests microstructure alterations. In this case, precipitates and intermetallic phases formation in the aluminum could be seen.18,19Possible changes in the crystal lattice of the material will be checking by XRD technique.
The X-ray diffraction was performed on the sample 1 to evaluate possible changes in the dislocation density of the material,as well as the micro-deformation through the analysis of the crystallite size.As shown in Table 8,the results indicated discordance density,crystallite size and micro-deformation increasing at all crystalline directions.Increasing in the discordance density contributed to the results obtained in the tensile test. For instance, the reduction of the elongation indicated a decrease in the ductility of the samples damaged by lightning strike.24
3.4. Microstructure tests results
However, the results of grain size analysis have shown no changes in the material’s grain size.This fact can be evidenced in Table 9.No significant difference was observed between the grain size of both samples. An increase in the crystallite size has no implications for the increase in the grain size,measured by optical microscopy, once the crystal measured by x-ray is defined as ‘‘homogeneous domain that generates coherent diffraction”.25In addition, a possible fragmentation of the grains, later confirmed by EBSD test, may have influenced the grain size measured by optical microscopy.
Fig.12(a)shows,at 50×magnification,microcracks on the sample 1. Fig. 12 (b), at 500× magnification, indicates a damaged region that exceeds 20 μm. Intermetallic phases and precipitates larger than 1 μm cause the nucleation of microcracks around them.26The microcrack nucleation may happens from combination of mechanical loads, thermal changes, precipitates,or intermetallic phases formation.27,28These phenomena reduce the material ductility and increases the microcracks growth.29
Fig.13 presents the sample 2 cross-sectional view below the damage.For this investigation,the surface has not been chemically attacked but only polished.It was possible to see two distinct regions: Region 1 and Region 2. The Region 1 had a darker hue in the material’s microstructure. This region had an average depth of 206.32 μm and an average hardness of 210 HV, 24% higher than the average hardness of the aluminum sheet (160 HV) acquired for the tests.
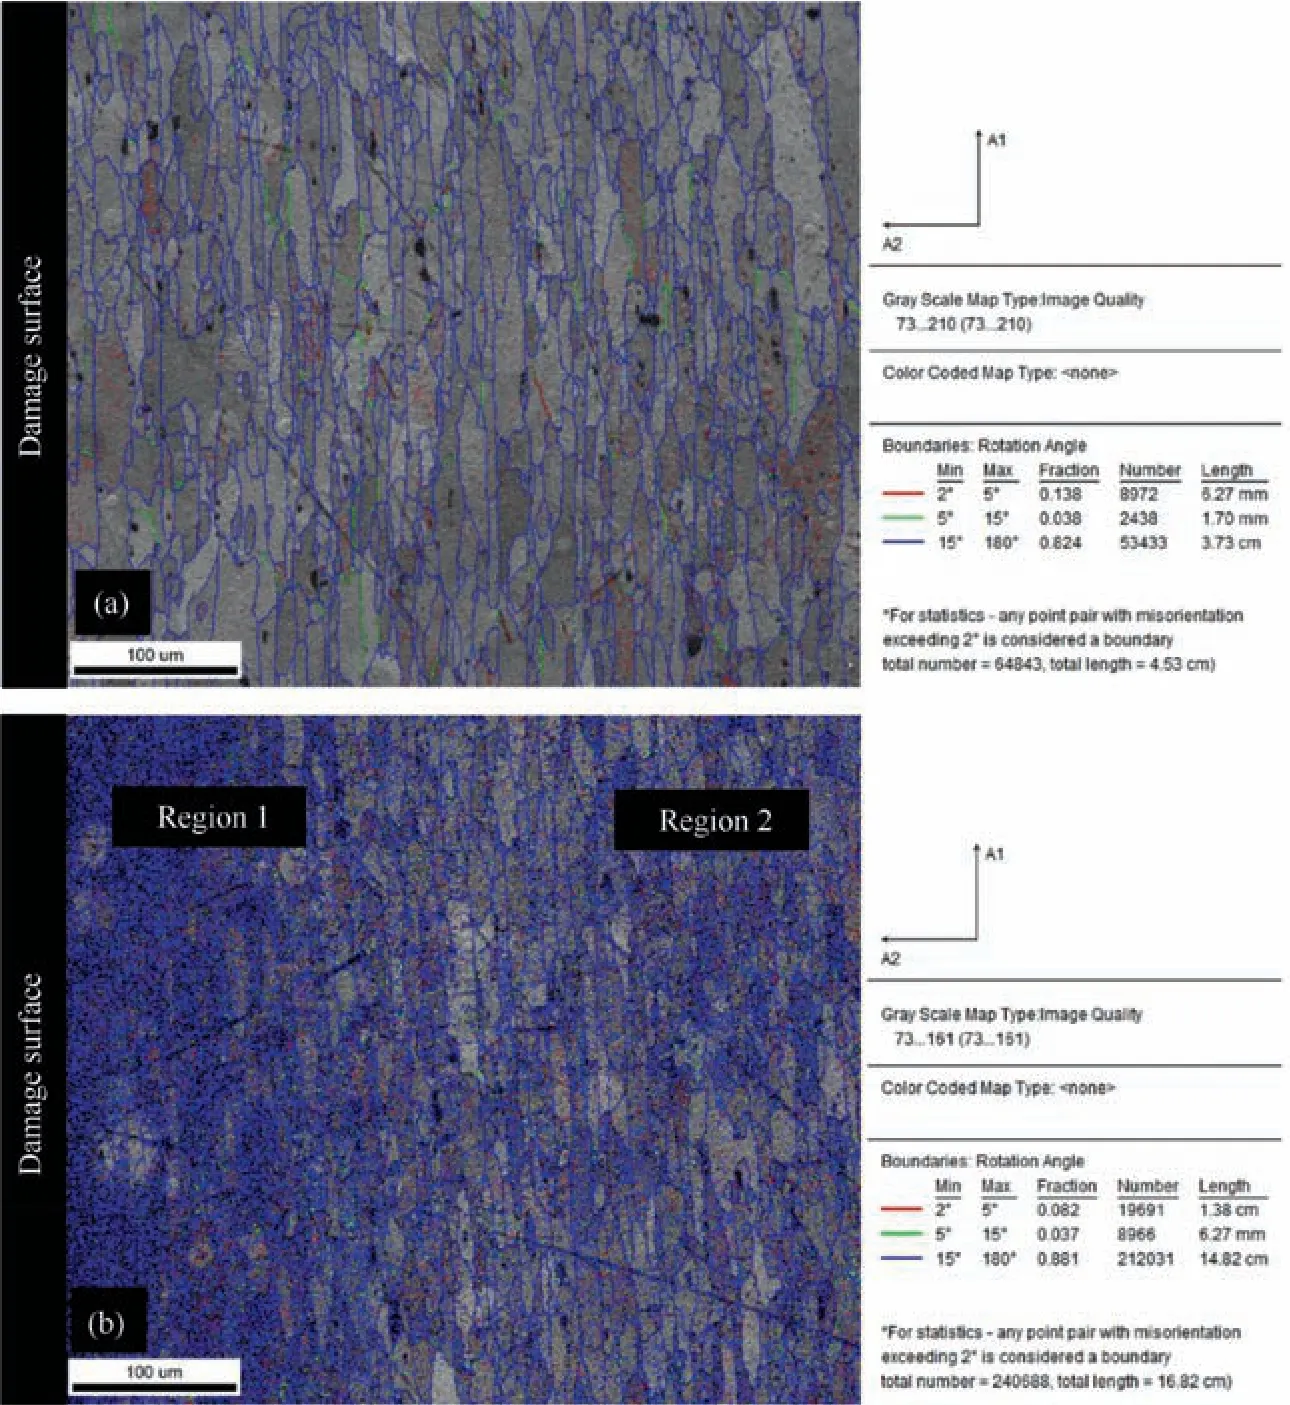
Fig. 16 Grain boundary map for sample 5 (a) and 2 (b).
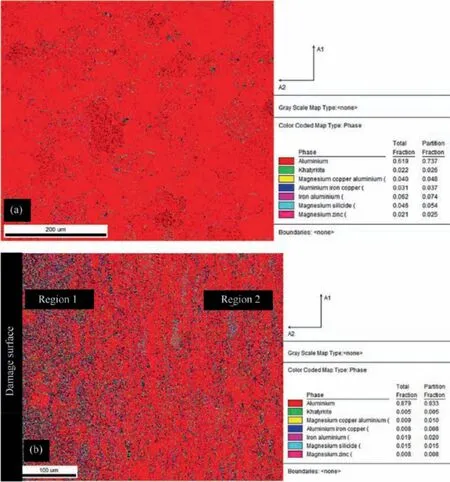
Fig. 17 EBSD phases map for sample 5 (a) and 2 (b).
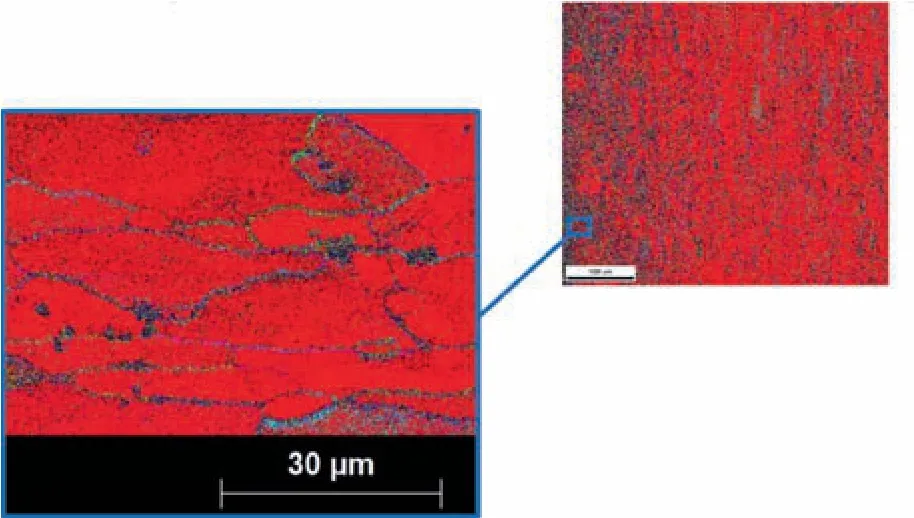
Fig. 18 EBSD phase map detail inspection for sample 2.
The EDXS technique was used to confirm the existence of intermetallic phases in the section between 100 μm and 450 μm below the damage;so,in both regions.The results indicated the nucleation of intermetallic phases of crystal structures larger than 1 μm. The solute redistribution during solidification leads to microsegregation and the formation of coarse intermetallic particles as Mg2Si,Al13Fe4and Al17Cu2Fe,which can significantly influence the properties and productivity of the 7000 series aluminum alloys.However,the coarse particles with size larger than 1 pm will deteriorate the properties, such as the toughness and fatigue performance.29Fig. 14 presents,under 1000× magnification, precipitate formation of Al17Cu2-Fe - Fig. 14(a); precipitate formation of Mg2Si - Fig. 14(b)and precipitate formation of Al13Fe4- Fig. 14(c). It is suggested that Region 1 and 2 also had a greater number of microcracks.30
Studies about nucleation of intermetallic phases during heat treatment in 7075 aluminum alloys have shown that after slow cooling during the annealing process, chemical elements such as Magnesium (Mg), Copper (Cu) and Iron (Fe) tend to take laminar forms along the microstructure of this material.However, if sudden cooling occurs, these elements clump together to form precipitates or ’coarse intermetallic phases’ can reach dimensions larger than 1 μm.29Precipitations with dimensions between ≥1 μm and ≤10 μm cause stress concentration zones around them and result in misorientation and grain boundaries breakdown. This phenomenon initiates nucleation of microcracks.The number of microcracks is proportional to the number of stress field corroborating to the material fatigue strength.30,31Fig. 15 (a) and (b) showed the grain contour maps of samples 1 and 4, obtained thought EBSD analysis.The blue color indicated the grain boundaries and regions where misorientation occurred.
The red circles in Fig.15(a)presents the microcracks along the surface of sample 1. There is possible to see microcrack growth in the regions highlighted. Fig. 15 (b) presents grain contour map for sample 4. Microcracks could not be found on the grain boundaries.
Fig. 16 shows the result of the grain boundary map in the cross-section of sample 5 (Fig. 16(a)) and sample 2 (Fig. 16(b)). After comparing the two pictures, it was possible to see higher amount of grain boundaries in the sample 2. However,many of the blue lines do not represent real grain boundaries because there are many grain fragments due to microcracks propagation.
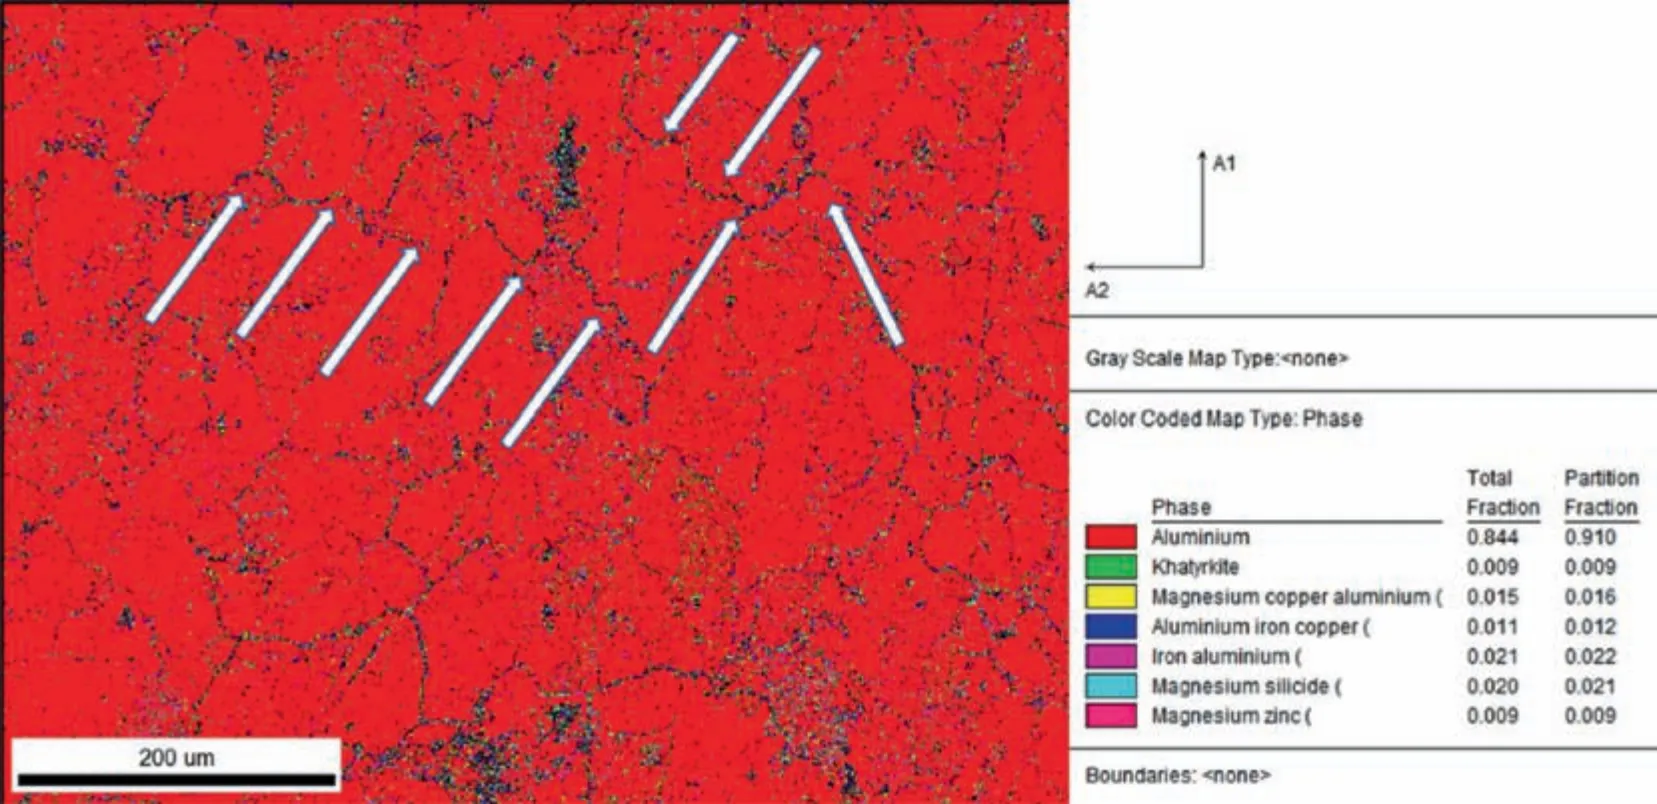
Fig. 19 Microcracks in grain boundaries.
As discussed before,the microhardness test in the Region 1 presented higher average hardness than Region 2,nevertheless,this fact suggests a greater number of intermetallic phases and precipitates as shown in Fig.17.Fig.17(a)presents the phase map for sample 5.It could be verified a homogeneous distribution of phases and precipitates in the material. Many of them formed during the T6 treatment.18However,Fig.17(b)shows the phase distribution in the sample 2.It was observed a highest concentration of intermetallic phases and precipitates, as well as, high dislocation density, microcracks and grain fragmentation in the Region 1.
Fig. 18 presents a detailed inspection made in Region 1 through EBSD technique. It was possible to identify precipitates along the grain boundaries. Precipitates nucleated at grain boundaries, because of their high energy regions.31
In the Fig.19,it is possible to see microcracks indicated by arrows propagating along the grain boundaries.30,31
4. Conclusions
Lightning strikes with electrical current intensity to 100 kA and D-waveform cause hot spots on 1 mm thick 7075-T6 aeronautical aluminum sheets.
(1) In these regions, the temperature may reach 38,345.28°C followed by rapid cooling. This phenomenon causes the formation of precipitates such as Al17Cu2Fe,Al13Fe4and Mg2Si greater than 1 μm that cause stress fields in the material crystal lattice.
(2) These stress fields generate nucleation of microcracks that propagate through the grain boundaries. The damage extends to 206 μm deep, from the surface damaged and causes changes in the mechanical behavior of the material, such as reducing the percentage elongation at 48, 77% and increasing the local hardness at 17%, as can be seen by the tensile and microhardness tests.
Declaration of Competing Interest
The authors declare that they have no known competing financial interests or personal relationships that could have appeared to influence the work reported in this paper.
AcknowledgementsThe authors would like to acknowledge the Center of Microscopy at the Universidade Federal de Minas Gerais (http://www.microscopia.ufmg.br) for providing the equipment and technical support for experiments involving electron microscopy.
The authors would like to acknowledge the Department of Metallurgical and Materials Engineering at the at the Universidade Federal de Minas Gerais, especially Professor Dagoberto Branda˜o Santos, for the treatment of EBSD data.
The authors would like to acknowledge to Department of Mechanical Engineering at the Universidade Federal de Minas Gerais, especially Professor Marcelo Arau´jo Caˆmara for his great help in the execution of the profilometry test.
The authors would like to acknowledge the Materials Engineering Department at the Centro Federal de Educac¸a˜o Tecnolo´gica de Minas Gerais, especially Professors Carlos Eduardo dos Santos and Elaine Carballo Siqueira Correˆa,for the great help in the execution of the X-Ray Diffraction Test and Microhardness Test.
 CHINESE JOURNAL OF AERONAUTICS2021年12期
- CHINESE JOURNAL OF AERONAUTICS的其它文章
- Entropy based inverse design of aircraft mission success space in system-of-systems confrontation
- Nonlinear resonance characteristics of a dual-rotor system with a local defect on the inner ring of the inter-shaft bearing
- Failure mechanisms of bolted flanges in aero-engine casings subjected to impact loading
- Synchronized perturbation elimination and DOA estimation via signal selection mechanism and parallel deep capsule networks in multipath environment
- Improving seeking precision by utilizing ghost imaging in a semi-active quadrant detection seeker
- A high dynamics algorithm based on steepest ascent method for GNSS receiver
