Morphology and kinetics evolution of γ′ and γ phases in Ni-xAl-(20-x)Cr at% alloys
Jing Chen ,Yongsheng Li,* ,Shengshun Jin ,Zhengwei Yan ,Shujing Shi
a School of Materials Science and Engineering,Nanjing University of Science and Technology,Nanjing,210094,China
b MIIT Key Laboratory of Advanced Metallic and Intermetallic Materials Technology,Nanjing,210094,China
Keywords:Ni-Al-Cr alloys Morphology evolution Kinetics Phase-field
ABSTRACT The morphology and kinetics evolution of γ′ and γ phases in Ni-xAl-(20-x)Cr at% (x=7.5-13.7) alloys aged at 700 °C were studied by utilizing the phase-field simulation.The separated γ′ phases from γ matrix in low Al content(x <13)alloys transferred to the interconnected morphology with separated γ phases in high Al content(x >13)alloys,and long-time aging produced near cubic γ′ phase.The coarsening rate of γ′ phase declined firstly when the Al content x=7.5-9.0,then increased sharply as x ranges from 9 to 12,while the coarsening rate of γ phase declined directly.Additionally,the average edge-to-edge distance of neighboring γ′ phases showed a threestage variation when Al content x <9,it decreased to minimum value and increased slowly then decreased again with aging time.In contrast,when 9 ≤x <13,the average particle distance of γ′ phase decreased to a nearly constant value.With the coarsening of γ phase,their average particle distance increased.The kinetics evolution was clarified with the combined variations of the particle number density,average particle radius and volume fractions in the continuous composition Ni-xAl-(20-x)Cr at% alloys.
1.Introduction
Ni-based superalloys are critical in aerospace fields due to their creep resistance and mechanical properties at high temperatures [1-3].The Ni-Al-Cr are basic components of the multi-component Ni-based superalloys,and their good properties are derived from the strengthening of aluminum-enriched L12-γ′phases in a chromium-enriched fcc matrix.Therefore,the contents of chromium and aluminum are related to the mechanical properties of Ni-Al-Cr alloys[4,5].
Morphology and kinetics evolution of γ′phase in Ni-Al-Cr alloys were investigated by experiment and simulation methods.Sudbrack et al.[6] utilized atom probe tomography (APT) to study the composition and kinetics evolution of γ′phase in Ni-5.2Al-14.2Cr at%alloys,and found that the average particle radius and the aging time have the relationship〈r(t)〉~t0.29±0.05,which is in agreement with the temporal power law 〈r(t)〉3∝ktof Kuehmann and Voorhees (KV) model [7] for ternary alloys,where 〈r(t)〉 is the time-dependent average particle radius,kis the coarsening rate constant andtis the aging time.The temporal power law was firstly demonstrated by Lifshitz and Slyozov[8]in binary alloys with spherical precipitates,then the law was verified in isothermal coarsening of ternary alloys by KV model[7].Except for the〈r(t)〉3∝ktrelationship,KV model also reveals thatNv,the particle number density in three-dimensional space,is proportional tot-1at coarsening stage.However,the KV model is valid when the volume fraction of coarsening phase is very small and the off-diagonal terms in diffusion matrix are neglected.As a result,the deviations from the predictions of KV model are detected in experiment and simulation results.Booth-Morrison et al.[9]pointed out that the difference of solute concentrations between Ni-7.5Al-8.5Cr at% and Ni-5.2Al-14.2Cr at%alloys results in the different chemical free energy,thereby,coarsening kinetics and partitioning ratios differ significantly in the two alloys.Also,the particle number density of the two alloys decrease in the temporal dependence oft-0.42±0.03andt-0.67±0.01,which significantly differ from thet-1of the KV model.The difference is a result of non-stationary coarsening state after aging for 1024 h.These experimental results show the temporal evolution of average particle radius and particle number density of γ′phase in alloys with low Al content,and the coarsening kinetics in alloys with higher Al content remains unclear.
In spite of the experimental studies for the precipitation kinetics in the Ni-based superalloys,the simulations were performed by using phase-field model.Cao et al.[10] utilized two-dimensional (2D)phase-field simulation to study the effect of crystal orientations on microstructure evolution in single-crystal Ni-based superalloy.3D phase-field simulation was performed by Poulsen et al.[11] in Ni-5.2Al-14.2Cr at%alloys aged at 600°C,they found that the average particle radius and particle number density change ast0.349andt-0.992at the early coarsening stage,which is in approximate agreement with the KV model.However,significant differences of microstructural evolution from the experimental results were detected,such as,the steady state coarsening begins at 22 h 37 min in this simulation,which is much earlier than the 256 h of experiment result.They demonstrated that due to the limited length scale of phase-field simulation,some atomistic phenomena are not taken into account,such as vacancy-mediated diffusion in coherent phases.In spite of this,the phase-field simulation can give reasonable morphology and kinetics evolutions.
As for the temporal power law 〈r(t)〉3∝kt,the coarsening rate constant,k,is considered in close relation to the volume fraction of γ′phase.Due to the coagulation of γ′phase,thekis supposed to increase with increasing γ′phase volume fraction.However,in binary Ni-X (X=Al,Ga,Ge,Si,Ti)alloys,khas a decrease as the volume fraction of γ′phase increases especially when the volume fraction is smaller than 0.04[12-16].Ardell [17] developed trans-interface diffusion-controlled (TIDC)theory to explain the abnormal phenomenon,in which the temporal power law〈r(t)〉2.4∝ktwas presented.Additionally,Ardell[18]verified the 〈r(t)〉2.4∝ktrelationship in Ni-Al-Cr alloys by fitting experimental data.However,the TIDC theory does not illuminate the decrease ofkwith small γ′phase volume fraction.Therefore,the coarsening rate constant of Ni-xAl-(20-x)Cr at% (x=7.5-13.7) alloys with different γ′or γ phase volume fraction is an interesting question to study.
Except for the particle number density and average particle radius,the spatial correlation and coarsening of the precipitates are characterized by the average particle distance.The coalescence coarsening occurs when the distance between γ′phases is within a critical distanceL*[6].Sudbrack et al.[6]estimated theL*to be 1.5 nm for 4 h aging in Ni-5.2Al-14.2Cr at% alloy,and they raised an equation 〈λe-e〉=to calculate the average edge-to-edge distance of neighboring γ′phases,〈λe-e〉.It was found that,with increasing aging time,the 〈λe-e〉initially decreases,then increases and finally decreases again.Also,the minimum and maximum value of 〈λe-e〉 are corresponding to the maximum and minimum value of the fraction of necking γ′precipitates,respectively.And a similar phenomenon was detected in Ni-7.5Al-8.5Cr at% and Ni-5.2Al-14.2Cr at% alloys by Booth-Morrison et al.[9].Nevertheless,the variations of 〈λe-e〉 in high Al content alloys need a continuous study.
When the volume fraction of γ′phase is large enough,the γ′phase will connect into the matrix,then the γ phase can be regarded as precipitates.Boisse et al.[19]utilized 2D phase-field model to simulate the evolution of coarsening kinetics of γ phase with the volume fractions of 0.2 and 0.3 in Ni-Al alloys.The results showed that the average radius of precipitates increases linearly with aging time,and the coarsening rate increases with increasing volume fraction of γ phase.Liu et al.[20]analyzed the effect of temperature on the coarsening kinetics of γ phase in Ni-Al alloys,and found that the coarsening rate constant increases as the temperature increases at the stable coarsening stage.As for Ni-Al-Cr alloys,there is rare result of large volume fraction of γ′phase coarsening,which motivates us to study the evolution of high volume fraction γ′phase in the high Al content(x >13)Ni-Al-Cr alloys.
According to the prior studies of Ni-Al-Cr alloys with different compositions and aging temperatures listed in Table 1,most attentions have been focused on the coarsening kinetics for low Al content Ni-Al-Cr alloys,while the coarsening kinetics of high Al content alloys remains uncertain due to the massive coalescence of γ′phase.Therefore,the coarsening kinetics in Ni-xAl-(20-x)Cr at% alloys from low Al content (x=7.5,8,9,10,11,11.5,12) to high Al content (x=13,13.5,13.7)alloys aged at 700°C were systematically studied using 2D phase-field simulation.The effect of solute concentrations on the coarsening kinetics of γ′phase was investigated,the morphology and kinetics evolution of γ phase were studied in the alloys with high γ′volume fraction,and the relationship between particle number density,average particle radius and average edge-to-edge distance of neighboring particles is illustrated.
Table 1 Volume fraction of γ′ phase,,in Ni-Al-Cr alloys with different compositions and aging temperatures.
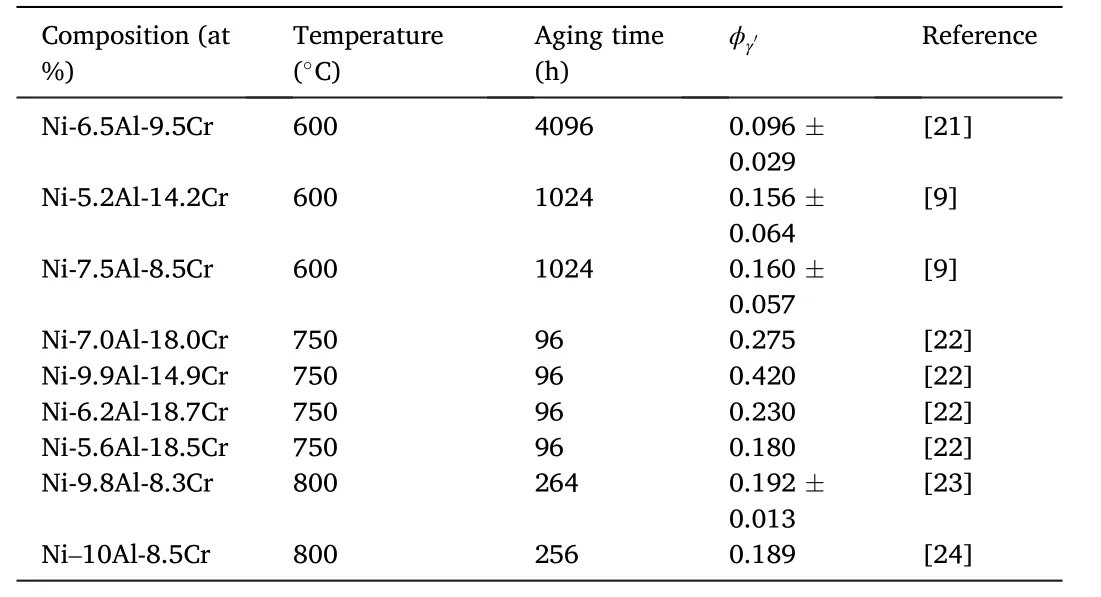
Table 1 Volume fraction of γ′ phase,,in Ni-Al-Cr alloys with different compositions and aging temperatures.
2.Model and methods
2.1.Phase-field model
Phase-field model has been employed to study the morphology evolution and precipitation kinetics of γ′phase in Ni-and Co-based alloys[25-27].In Ni-Al-Cr alloys,the morphology evolution of the γ′phase can be described by the composition fieldscAl(r,t),cCr(r,t),and the long-range ordering parameter fields(p=1,2,3),whereris the two-dimensional space vector andtis the time.Compositions and ordering parameters of Ni and Al can be obtained by solving the nonlinear Cahn-Hilliard diffusion equations and Ginzburg-Landau equations[28-30],
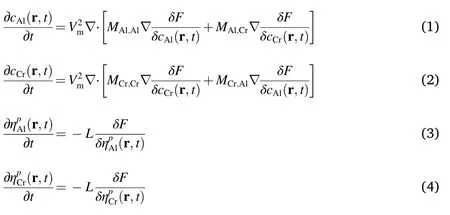
wherecAlandcCrare the mole fraction of the Al and Cr,Vmis the molar volume of the Ni-Al-Cr alloy,Fis the total free energy of the system,Lis the structural relaxation constant,and the value is 1.67×10⁻⁸m3J-1s-1at 700°C.Mi,j(i,j=Al,Cr) is the chemical mobility that can be expressed bycicj[cNiMNi-(1-ci)Mi-(1-cj)Mj] [31],in whichMi(i=Ni,Al,Cr) is the atomic mobility of pure element,/RT)[32],Ris the gas constant,is the diffusion activation energy which consists of diffusion activation energy of disordered phaseΔQdisiand diffusion activation energy of ordered phaseThecan be referred from Engstr¨om and Ågren’s work[33],


where the indexi,jandkrepresents the element Ni,Al and Cr in the ternary system,andis the site fraction of elemention the sublattice positionα.All the parameters used in Equation (5) can be referred in literatures [32,33].
2.2.Free energy
The total free energyFconsists of the chemical free energyFchand the elastic strain energyFel.In Ni-Al-Cr ternary alloys,there is no significant lattice mismatch between γ′phase and γ matrix[34].Also,the elastic strain energy of Ni-6.5Al-9.5Cr at% alloy aged at 600°C was calculated by Booth-Morrison et al.[21],the value is 2.67×10⁶Jm-3,which is only 4.27%of chemical free energy.The chemical free energy for the Ni-Al-Cr alloy can be expressed as [35,36],

whereVis the volume of the system,κi,jandκηare the gradient energy coefficients that determine the interface width and interfacial energy[35].f(cAl,cCr,is the chemical free energy density,f(cAl,cCr,The Gibbs free energy [25],

In the Gibbs free energy,the disordered part is given by Ref.[18,37].
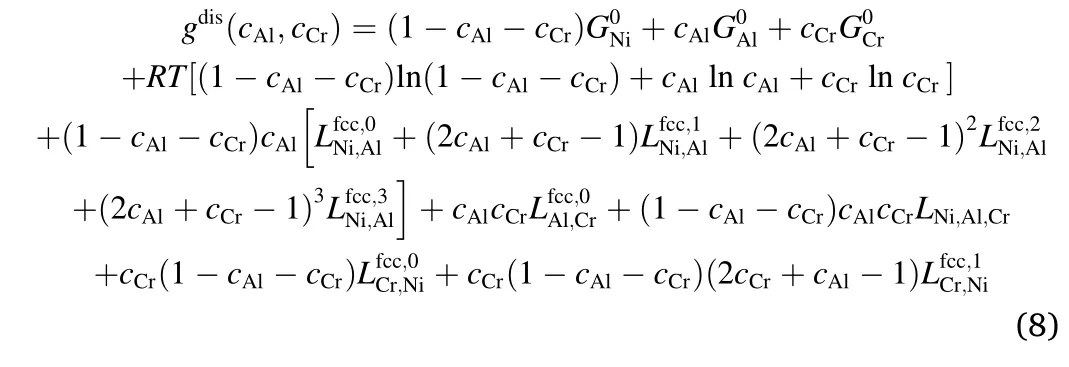
In order to describe the Gibbs free energy of L12ordered phase,the sublattice model was firstly utilized by Ansara et al.[39]in Ni-Al alloys.Jia et al.[40] and Dupin et al.[41] applied the model in Ni-Al-Cr ternary alloys.The molar Gibbs free energy of the ordered phase is written as[41],

The elastic strain energy for the Ni-Al-Cr alloy can be written as[25],

whereCijklis the elastic constant tensor,
εijis the average value of strain tensor,(p,q=Al,Cr) is the eigenstrain tensor and expressed asis the concentration coefficient of the crystal lattice parameter,δijis the Kronecker function,Δcp=cp-whichis the nominal solute composition,∫′indicates thatn=0 is excluded from the integration,nis the unit vector in reciprocal space withn=Bpq(n)is the two-body interaction potential,{Δcp}gis the Fourier transform ofΔcpandis the complex conjugate of{Δcp}g.For the Ni-xAl-(20-x)Cr at% alloys,no elastic constants are available,so the values of a similar alloy Ni-12.69Al at% at 700°C [42] are adopted in this work,and calculated to be102GPa,=207GPa,=146GPa,=96GPa.The lattice parameters of the three elements at 700°C areaAl=0.405nm,aNi=0.352nm,aCr=0.288nm,respectively [34].
2.3.Numerical method
Equations (1)-(4) were normalization for the numerical solution.The semi-implicit Fourier spectral method[43,44]was used to solve the partial differential equations.By substituting time and displacement with dimensionless parameterst*=LΔftandr*=r/l,Equations(1)-(4)can be rewritten as,
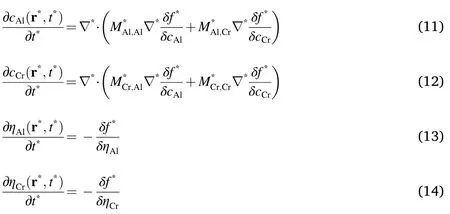
Among them,f*=f/Δf,=∇·l.In this work,the numerical calculation was performed in a cell with 512×512 grids,the grid length isl=2.5×10⁻⁹m,the molar volume of the alloy isVm=6.52×10⁻⁶m3,the time stepΔt*=0.005 andΔf=3×10⁷Jm-3.The γ’/γ interfacial free energy used in this work is 2.5×10⁻²Jm-2according to the Dupin et al.database[41].
3.Results and discussion
3.1.Morphology evolution of γ′ phase
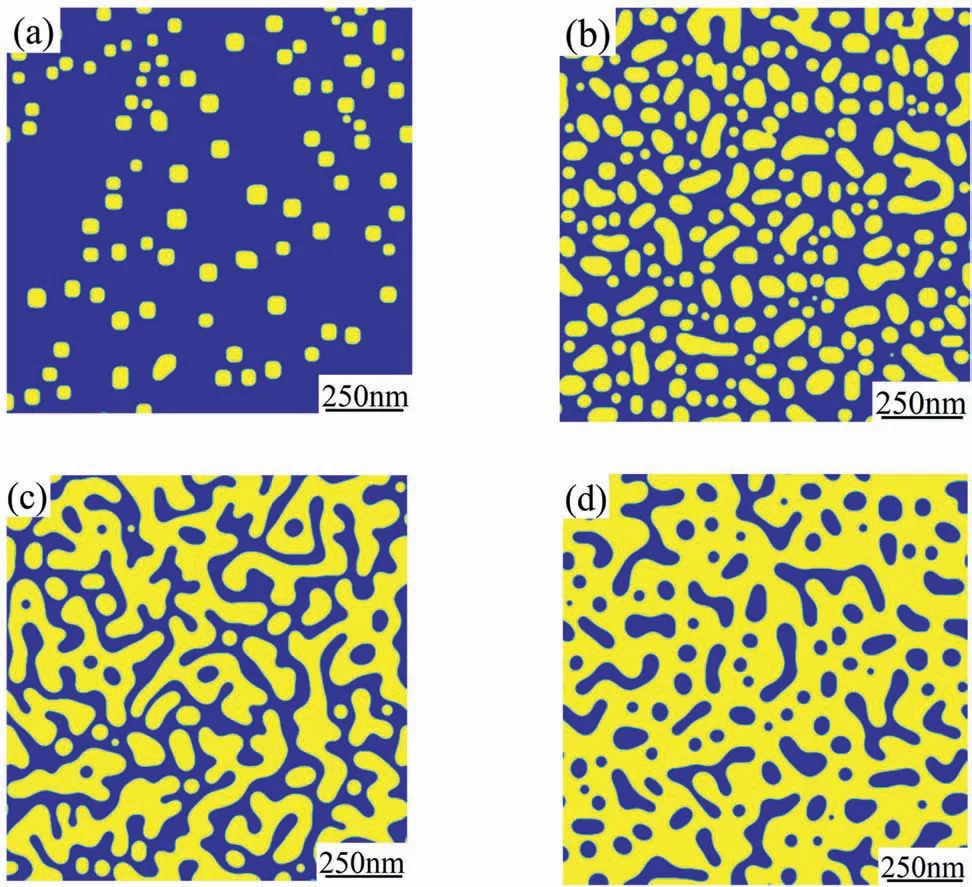
Fig.1.Morphology of γ′ phase in Ni-xAl-(20-x)Cr at%alloys aged at 700 °C for t*=1000,(a)Ni-7.5Al-12.5Cr at%,(b)Ni-10Al-10Cr at%,(c)Ni-12Al-8Cr at%,(d)Ni-13.7Al-6.3Cr at%.
Morphological evolution of γ′phase in Ni-xAl-(20-x)Cr at%(x=7.5,10,12,13.7)alloys aged at 700°C fort*=1000,56 h in real time scale is shown in Fig.1.The yellow regions represent γ′phase and the blue regions represents γ phase.Due to the small lattice mismatch between γ and γ′phase,such as 0.00284 in Ni-6.5Al-9.5Cr at%alloy aged at 600°C[21],the γ′phases showed a near circular shape and were distributed randomly in γ matrix as shown in Fig.1(a)and(b),which are similar to the TEM morphology graphs of Ni-7.0Al-18.0Cr at% and Ni-9.9Al-14.9Cr at% alloys aged at 750°C for 96 h [22],in which,the lattice misfit of these alloys is about 0.0001[45].But,according to the work of Sudbrack et al.[23],spheroid-to-cuboid transition was found in Ni-9.8Al-8.3Cr at%alloy aged at 800°C for 264 h,which is induced by a competition between the elastic strain energy and interfacial energy[46].As γ′phase grows,the elastic strain energy increases as 〈r(t)〉3,whereas the interfacial energy increases as 〈r(t)〉2.Hence,with the growing of γ′phase,the elastic strain energy becomes dominant in influencing the γ′phase morphology [23].However,when the alloy aged for less than 64 h,the elastic strain energy showed a slight influence and there were near circular phases without obvious alignment.In consideration of the 56 h aging time in this work,a good agreement in morphology with previous results was shown.With the increase of Al content,the γ′phase changed from dispersed random-shaped particles to the interconnected morphology,then became into the matrix that was embedded with the separated γ phase,as shown in Fig.1(d).It is worth noting,in Fig.1(c),some γ′phases interconnected with a large volume fraction,only a few small particles were isolated.In this work,when counting the particle number and calculating average particle radius of precipitates,the phases interconnected with necks as shown in Fig.1(c)were counted as one particle.
To confirm the effects of elastic strain on the morphology of γ′phase,the Ni-9Al-11Cr at%alloy aged at 750°C fort*=15000,840 h in real time scale was simulated,as shown in Fig.2.It is obvious that aged fort*=1000 in Fig.2 (a),the γ′phases were almost circular and uniformly distributed throughout the matrix,which is close to the morphology shown in Fig.1(b).In Fig.2(b),the aging time wast*=15000,and the cube-like γ′phase with flatten faces aligned along the elastic soft directions [01]and [10].
The Ni-xAl-(20-x)Cr at% alloys with different compositions are displayed in the phase diagram shown by Fig.3 (a),in which the equilibrium phase boundaries are given by using the data of Dupin et al.[41].As the Al contentxincreases,the volume fraction of γ′phase in Ni-xAl-(20-x)Cr at%alloys ranges from 0.10 of Ni-7.5Al-12.5Cr at%to 0.65 of Ni-13.7Al-6.3Cr at%after aged fort*=1000 at 700°C,as shown in Fig.3(b).The ultra-high volume fractions of γ′phase in Ni-13Al-7Cr at%,Ni-13.5Al-6.5Cr at% and Ni-13.7Al-6.3Cr at% alloys made the γ′phase connected together,and the γ′phase became the matrix with the γ phase embedded inside.Therefore,the kinetics evolution of γ phase was investigated in the three alloys.The volume fractions of γ phase in Ni-13Al-7Cr at%,Ni-13.5Al-6.5Cr at% and Ni-13.7Al-6.3Cr at% alloys at the steady-state coarsening stage are 0.39,0.36 and 0.35,respectively.The results indicate that the increased Al content and decreased Cr content in the Ni-xAl-(20-x)Cr at% (x >13) alloys result in a small volume fraction of γ phase.
3.2.Kinetics evolution in Ni-xAl-(20-x)Cr at% alloys
The evolution of particle number densityNsof γ′phase in Ni-xAl-(20-x)Cr at%(x=7.5-12)alloys as a function of time aged at 700°C is plotted in Fig.4 (a).Firstly,theNsincreases,until the maximum valueNsmaxis achieved,and theNsmaxis larger for the higher Al composition in Ni-xAl-(20-x)Cr at% alloys.
The time to achieveNsmax,was about 7 for Ni-xAl-(20-x)Cr at%(x=7.5-10)alloys,and about 5.0,4.5,4.0 forx=11-12,respectively.As the aging time increased,whent*>the volume fraction of γ′phase increased,and the coarsening of γ′phases led to a decrease ofNs.According to the KV model,the 3D particle number density can be expressed asNv(t)=whereφeqis the equilibrium volume fraction of coarsening phase.Obviously,the particle number density in 3D space is proportional to (kt)-1,whereas the 2D particle number densityNswill deviate from the time exponent -1.
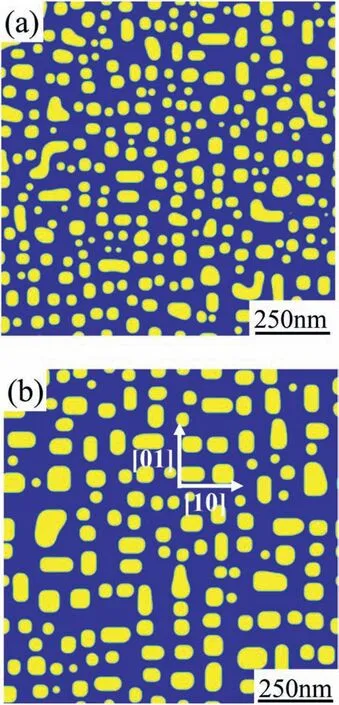
Fig.2.Morphology of γ′ phase in Ni-9Al-11Cr at%alloy aged at 750 °C for:(a)t*=1000,(b) t*=15000.
Based on the change rates of particle number density listed in Table 2,the precipitation process of γ′phase can be divided into four stages:nucleation I(1<t*<),growth and early coarsening IIt*<50),quasi-stationary state coarsening III (50<t*<300),steadystate coarsening IV(300<t*<1000),and the change rates of particle number density of each stage are denoted byk1,k2,k3 andk4,respectively.It is worth noting that the equilibrium value of γ′phase volume fraction for low Al content (x=7.5,8) alloys did not achieved after aged fort*=1000,as shown in Fig.3 (b).Actually,for lowconcentration alloys,such as Ni-7.5Al-8.5Cr at% and Ni-5.2Al-14.2Cr at%,the time required to reach steady-state coarsening is beyond 1024 h and predicted to be(8±5)×106h,(2±1)×106h respectively according to the work of Booth-Morrison et al.[9].Thus,whent*>300,the Ni-xAl-(20-x)Cr at% (x=7.5,8) alloys were still in the quasi-stationary state coarsening.However,the difference in change rates,k3=-0.39 andk4=-0.27 for Ni-7.5Al-12.5Cr at%,k3=-0.61 andk4=-0.45 for Ni-8Al-12Cr at% are shown in Table 2 during coarsening stage III and IV.Therefore,it is reasonable to separate the coarsening stage 300<t*<1000 from 50<t*<300 for these two alloys.For Ni-13Al-7Cr at%,Ni-13.5Al-6.5Cr at%and Ni-13.7Al-6.3Cr at% alloys,the γ′phases connected into one phase aftert*=10.The values ofNsof γ′phases fort*=1-10 and γ phase fort*=300-1000 are shown in Fig.4(b).Also,k1 of γ′phases andk4 of γ phase are listed in Table 2.
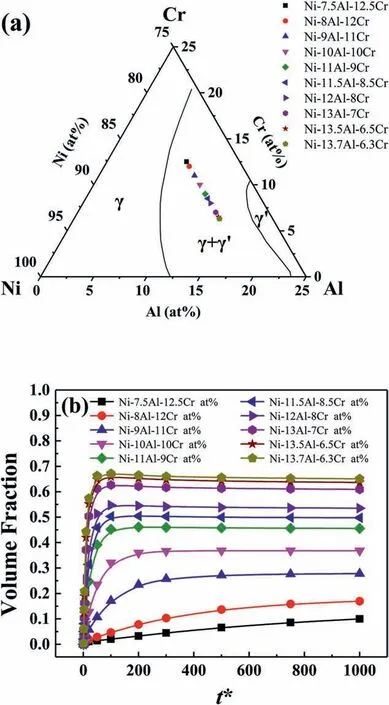
Fig.3.(a) Alloy compositions in ternary Ni-Al-Cr alloy at 700 °C,the lines were determined by using the data of Dupin et al.[41],(b)Volume fraction of γ′phase in Ni-xAl-(20-x)Cr at% alloys as a function of time aged at 700 °C.
It can be seen from Table 2 that the change ratesk1 ofNsincreased as Al content increased due to the high nucleation rate in the alloys with high Al content.Unlike the monotonic change ofk1 andk2,asxincreased the maximum change rates ofk3 andk4 achieved whenx=10.The reason is that for the alloys with Al contentx=7.5-9 the volume fraction of γ′phase still increased with aging time,as shown in Fig.3(b),which indicates that the steady-state coarsening had not been achieved,and the decline rate ofNswas low.Similar phenomenon was detected by Booth-Morrison et al.[9].For the alloys withx >10,the volume fraction of γ′phase exceeded 0.4,and there were amounts of interconnected γ′phases,therefore,theNsof Ni-xAl-(20-x)Cr at%(x=10-12)alloys was smaller than 5.5×10¹⁵m-2at quasi-stationary state coarsening and steady-state coarsening stage,and less γ′phases coarsened as Al content increased,which made the decline rate ofNsto decrease.As shown in Fig.4 (b),in Ni-xAl-(20-x)Cr at% (x=13-13.7) alloys,theNsof γ′phases increased firstly and then decreased with time whent*=1-10,and theNsof γ phase decreased with aging time at steady-state coarsening stage.
Based on theNschange with time in Fig.4 and the change rates ofNslisted in Table 2,the nucleation rate increased with increased Al contentx,which may be due to the growing chemical free energy,and this was fully discussed in Refs.[21] by adopting classical nucleation theory(CNT).For coarsening stages,although the change rates were calculated instead of time exponent,slow decreasing rate ofNswas shown in low Al content (x=7.5,8) alloys because of the non-equilibrium state.And owing to coagulation of γ′phase with large volume fraction,the ofNsof high Al content(x=10-12)alloys decreased sharply at early coarsening stage,thus,these alloys showed relatively slow decreasing rate ofNsat late coarsening stage.
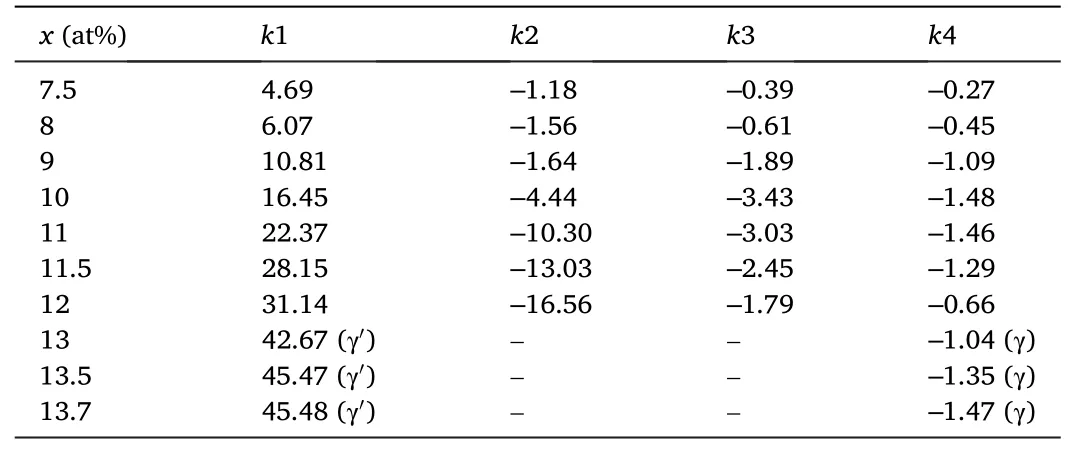
Table 2 Change rates of γ′ or γ particle number density with increased Al content x.
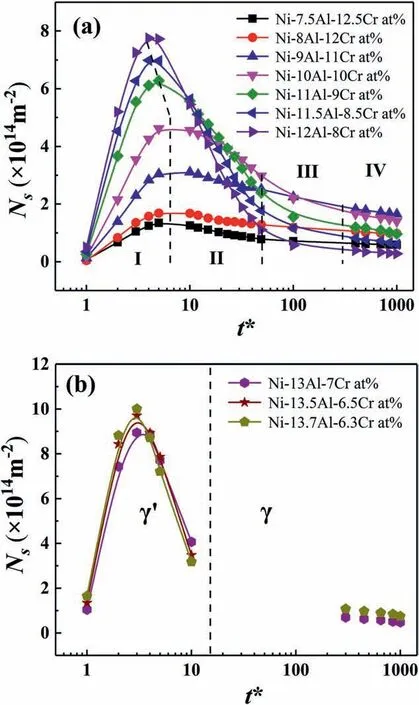
Fig.4.Evolution of the particle number density Ns of (a) γ′ phases in Ni-xAl-(20-x)Cr at% (x=7.5-12) alloys,(b) γ′ phases when t*=1-10 and γ phase when t*=300-1000 in Ni-xAl-(20-x)Cr at%(x=13-13.7)alloys as a function of time aged at 700 °C.
For Ni-xAl-(20-x)Cr at%(x=13-13.7)alloys,it is interesting to find that theNsof γ phase decreases at steady-state coarsening stage,and the smaller value ofk4 is achieved asxincreases,which are in consistent with the coarsening of γ′phase.In addition,the volume fraction of γ′phase at steady-state coarsening stage remained constant according to Fig.3(b),which means that the γ phase was also in the stage of steadystate coarsening.Therefore,it can be predicted that the average particle radius of γ phase increased by following the relationship of〈r(t)〉3∝ktat steady-state coarsening stage in Ni-xAl-(20-x)Cr at% (x=13-13.7)alloys.
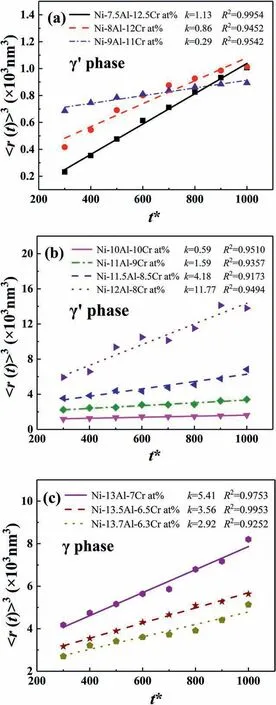
Fig.5.Change of average particle radius of γ′ phase(a)and(b)x=7.5-12,and γ phase (c) x=13-13.7,at steady-state coarsening stage.
The average particle radius of precipitates was calculated by equal area method,〈r(t)〉=whereSis the total area of γ′or γ phase,Nis the total number of particles.Fig.5 (a),(b) and (c) show that the change of average particle radius with time followed the relationship of〈r(t)〉3∝kt.For γ phase in Ni-xAl-(20-x)Cr at% (x=13-13.7) alloys,especially,the average particle radius followed the temporal power law as predicted above.As a result,it is reasonable to conclude that the coarsening of KV model is also suitable for γ phase in high Al content alloys.Furthermore,not only for Ni-based superalloys,but also for the Co-based superalloys,the 〈r(t)〉3∝ktwas verified at steady-state coarsening stage by using phase-field simulation[47].It is worth noting that the correlation coefficient,R2is 0.99 for Ni-7.5Al-12.5Cr at%and 0.92 for Ni-11.5Al-8.5Cr at%.Basically,R2becomes smaller when the volume fraction of precipitates is larger.The difference can be considered as that the equal area method used in calculating the average particle radius in this work is suitable for near circular precipitates.However,with the increasing volume fraction of γ′phase,less precipitates remained to be circular,as shown in Fig.1 (c),and this is one of the reasons that KV model is adopted in the cases with extremely small volume fraction.As a result,the deviation from the relationship of 〈r(t)〉3∝ktcan be found when the volume fraction of γ′phase is large.
The coarsening rate constants of γ′phase(x=7.5-12)and γ phase(x=13-13.7)are plotted in Fig.6.In Ni-xAl-(20-x)Cr at%alloys,as the Al content increased,the coarsening rate constantkof γ′phase decreased first and then increased rapidly.The minimum value ofkwas achieved whenx=9,and the low coarsening rate made the average particle radius 〈r(t)〉 of Ni-9Al-11Cr at% alloy smaller than that of Ni-7.5Al-12.5Cr at% and Ni-8Al-12Cr at% alloys aftert*=850,as shown in Fig.5 (a).The abnormal decrease of coarsening rate was found by Liu et al.[48] in binary Ni-Al alloys with increasing γ′phase volume fraction when the volume fraction was less than 0.2,the coarsening rate constant decreased with increased volume fraction.And when the volume fractions was greater than 0.35,the coarsening rate constant increased with the volume fraction.The γ′phase volume fraction of Ni-9Al-11Cr at% alloy was 0.27 at the steady-state coarsening stage,which was close to the volume fraction when the minimum coarsening rate constant was achieved in Ni-Al alloys.According to the results of Maheshwari et al.[12],in Ni-Al alloys the coarsening rate constant decreased as the γ′phases volume fraction increased from 0.02 to 0.03,and therefore they speculated that the increase in elastic interactions between neighboring precipitates is responsible for the abnormal decrease of coarsening rate.In alloys withx=9-12,it is clear that the value ofkwas greater owing to the large volume fraction of γ′phase.Whenx=13-13.7,the coarsening rate constant of γ phase decreased as the volume fraction of γ phase decreased since smaller volume fraction of γ phase achieved asxranges from 13 to 13.7,and a similar relationship between coarsening rate constant and volume fraction of γ′phase was detected as mentioned above.
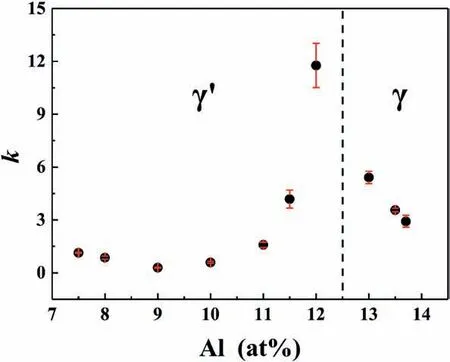
Fig.6.Coarsening rate constant of the γ′ phase(x=7.5-12)and the γ phase(x=13-13.7) in Ni-xAl-(20-x)Cr at% alloys at steady-state coarsening stage.
The relationship 〈r(t)〉3∝ktwas verified in Ni-xAl-(20-x)Cr at%alloys at steady-state coarsening stage.Due to the near circular γ′phases with small volume fraction of Ni-7.5Al-12.5Cr at% alloy,a good agreement with the 〈r(t)〉3∝ktrelationship is shown.Except for the normal coarsening of γ′phase when Al contentx=9-12 and γ phase whenx=13-13.7,abnormal decrease of coarsening rate was found whenx=7-9.The minimum coarsening rate achieved atx=9,and the volume fraction of γ′phase in Ni-9Al-11Cr at% alloy was close to the volume fraction with minimum coarsening rate according to previous study [48].
3.3.Evolution of precipitates distance in Ni-xAl-(20-x)Cr at% alloys
It is known that precipitates will coagulate when their distance is small enough.At the beginning,the connection of neighboring precipitates happens as a result of the adjacent overlapped non-equilibrium diffusion fields,and then the neighboring precipitates with a neck grow into one large particle.Similarly,the small interlamellar spacing in NiAl-Cr(Mo)eutectic lamellar structure can be reached to promote the transfer of atoms as the diffusion distance of atoms between two phases is short[49-51],and then the thermal stability of the lamellar structure becomes poorer.
The average edge-to-edge distance of neighboring γ′phases,〈λe-e〉in Ni-Al-Cr alloys was calculated by Karnesky et al.[52],and the method was adopted in this work.〈λe-e〉can be expressed as

in whichω2depends on the particle size distribution (PSD).
As can be seen from Fig.7(a),the value of〈λe-e〉was smaller in NixAl-(20-x)Cr at% alloys with higher Al content because of the larger volume fraction of γ′phase.In the case oft*=1,the initial value of 〈λe-e〉is fairly large,which is due to the small γ′phase volume fraction.Also,a large initial 〈λe-e〉 value over 100 nm was calculated by monovacancy mediated lattice-kinetic Monte Carlo(LKMC1)simulation in the work of Plotnikov et al.[53].Whenx=7.5 and 8,the〈λe-e〉decreased to a minimum value and increased slowly,then decreased again,which is in accordance with the calculated results of Booth-Morrison et al.[9].It is demonstrated that the minimum value of〈λe-e〉achieved when the fraction of connected γ′phases reached a maximum value.However,increasing stage after minimum value was not found in the〈λe-e〉for the alloys withx=9-12.As shown in Fig.7 (b),the 〈λe-e〉 of γ′phases decreased duringt*=1-10 whenx=13-13.7,which is similar to that whenx=9-12 shown in Fig.7(a).At the steady-state coarsening stage,the value of 〈λe-e〉 of γ phase increased with aging time.And a higher value of〈λe-e〉achieved as Al contentxincreased,which is acceptable in consideration of decreasing γ phase volume fraction asxincreased.According to the work of Ardell [54],it is reasonable to conclude that the distance between two particles,λ,is wider than the interfacial width,δ,which is 1.647 nm in Ni-6.5Al-9.5Cr at% alloy aged at 600°C for 4096 h.As a result,when the value of 〈λe-e〉 is smaller than δ,the γ′phases have already connected into one phase,which means that the value of〈λe-e〉is 0.Whent*=10,the calculated〈λe-e〉of Ni-xAl-(20-x)Cr at% (x=13-13.7) alloys were 2.7 nm,2.2 nm and 1.8 nm,respectively,which are quite close to δ,so the 〈λe-e〉 of γ′phases fort*=10-100 were omitted.
It is well-known that the decline of particle number density results in an increased average particle distance,whereas the increasing average particle radius makes the average particle distance decrease.Thereby,in order to illustrate the different variation of 〈λe-e〉 with time,the competitive mechanism between particle number density and average particle radius was discussed,and the variation ofNs,〈r(t)〉 and 〈λe-e〉for Ni-7.5Al-12.5Cr at%and Ni-9Al-11Cr at%alloys are shown in Fig.8.The variations were discussed in nucleation I(1<t*<),growth and early coarsening II<t*<50),quasi-stationary state coarsening III(50<t*<300),and steady-state coarsening IV (300<t*<1000),respectively.
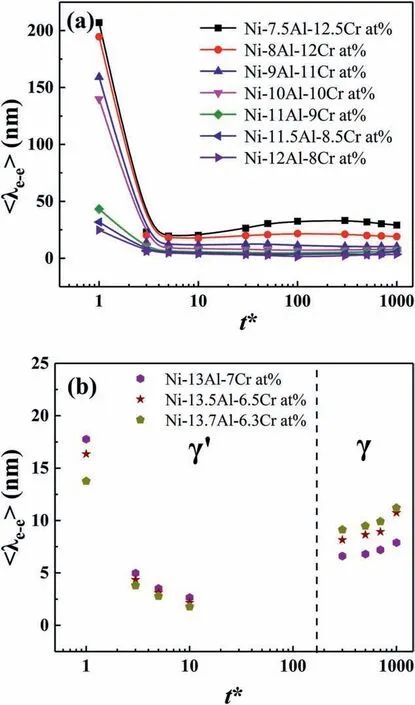
Fig.7.Average edge-to-edge distance of (a) neighboring γ′ phases in Ni-xAl-(20-x)Cr at% (x=7.5-12) alloys,(b) neighboring γ′ phases when t*=1-10 and neighboring γ phase when t*=300-1000 in Ni-xAl-(20-x)Cr at% (x=13-13.7) alloys as a function of time.
At the nucleation stage,theNsof both alloys increased rapidly,while the 〈r(t)〉 remained nearly constant,so the 〈λe-e〉decreased sharply.At the growth and early coarsening stage,the decline rates ofNs,k2 was-1.18 for Ni-7.5Al-12.5Cr at%and-1.64 for Ni-9Al-11Cr at%,but the slopes of〈r(t)〉3~tcurve on logarithmic time coordinate,klogwere 0.23 for Ni-7.5Al-12.5Cr at%and 1.02 for Ni-9Al-11Cr at%,which indicates that the relatively slow radius increasing rate of Ni-7.5Al-12.5Cr at%alloy is not enough to compensate the increase of 〈λe-e〉 caused by decreasingNs.In contrast,for Ni-9Al-11Cr at%alloy,the increasing of〈r(t)〉and decreasing ofNsproduced a near stable value of〈λe-e〉,so the〈λe-e〉 remained nearly unchanged.Similarly,at quasi-stationary state coarsening stage,theklogof Ni-9Al-11Cr at%was 5.9 compared to 1.6 of Ni-7.5Al-12.5Cr at%,and the value of 〈λe-e〉of Ni-7.5Al-12.5Cr at%increased continuously.In a similar way,for γ phase in Ni-xAl-(20-x)Cr at% (x=13-13.7) alloys whent*=300-1000,the contribution ofNsdecreased to 〈λe-e〉which is greater than that of 〈r(t)〉 increase,so the values of 〈λe-e〉 got larger.Additionally,at the steady-state coarsening stage,thek4 of Ni-7.5Al-12.5Cr at%was-0.27,which is close to that at quasi-stationary state coarsening stage,-0.39.But theklogof Ni-7.5Al-12.5Cr at% at steady-state coarsening stage was 11.4,which is much greater than that at quasi-stationary state coarsening stage,as a result,the 〈λe-e〉 of Ni-7.5Al-12.5Cr at% decreased again.It is noticed that compared to the change rates ofNs,a more notable difference for increasing rate of〈r(t)〉was observed between 300<t*<1000 and 50<t*<300 of Ni-7.5Al-12.5Cr at%alloy,as shown in Fig.8.Consequently,it is necessary to divide the quasi-stationary state into two stages for Ni-7.5Al-12.5Cr at% and Ni-8Al-12Cr at% alloys as mentioned above.According to the average edge-to-edge distance of neighboring γ′phases[6],the competitive relationship of the particle number density and average particle radius was taken into account,which indicates that Equation (14) adopted in this work can describe the〈λe-e〉 variation satisfactorily.
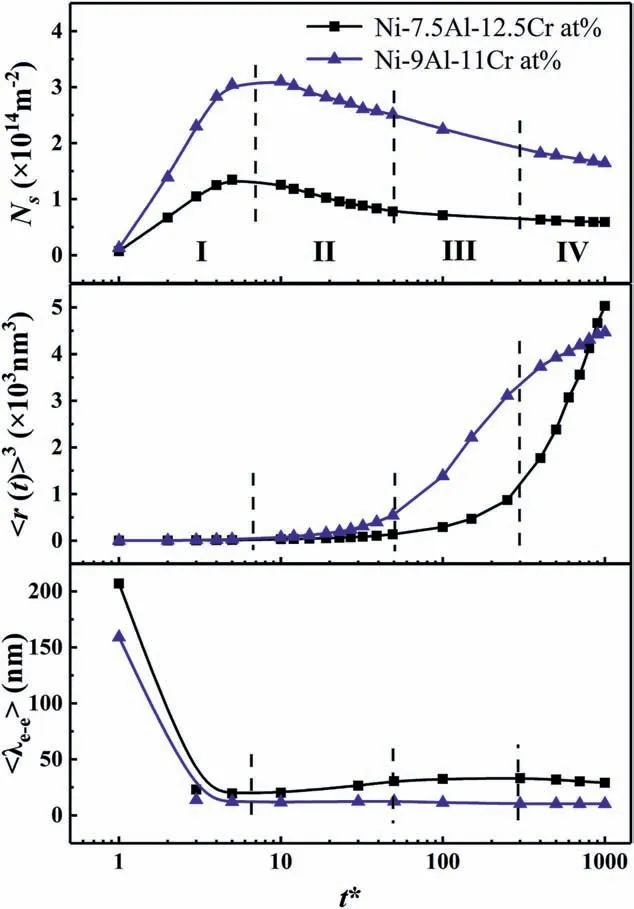
Fig.8.Particle number density,average particle radius and average edge-toedge distance of neighboring γ′ phases as a function of time in Ni-7.5Al-12.5Cr at% and Ni-9 Al-11 Cr at% alloys.
4.Conclusions
The coarsening kinetics of γ and γ′phase in Ni-xAl-(20-x)Cr at%alloys have been studied using phase-field simulation.The coarsening kinetics of γ phase and the relationship between the particle number density,the average particle radius,the average edge-to-edge distance of neighboring particles are proposed.
(1) As the Al content changes from 7.5 to 13.7 in Ni-xAl-(20-x)Cr at% alloys,the γ′phase changes from dispersed near rounded particles to interconnected ones,then to matrix embedded with separated γ phase particles.A long-time aging produces the near cubic γ′phase in the Ni-Al-Cr alloys.
(2) At the steady-state coarsening stage,the particle number density of γ phase in Ni-xAl-(20-x)Cr at%(x=13-13.7)alloys decreases,and the average particle radius of γ phase increases as the temporal power law 〈r(t)〉3∝kt,which is in consistent with the coarsening kinetics of γ′phase.And the KV model is applicable in the coarsening of γ phase of alloys with small lattice mismatch.
(3) With increased Al content,the coarsening rate constant changes from 1.13 for 7.5 Al at%to 0.29 for 9Al at%,and then increases rapidly to 11.77 for 12Al at%.The rapid increase of coarsening rate constant is attributed to the increased γ′phase volume fraction.For γ phase,as Al content increases,the γ phase volume fraction decreases,so the coarsening rate constant of γ phase changes from 5.41 to 2.92,which is in accordance with the increase of γ′phase coarsening rate constant.
(4) The average edge-to-edge distance of neighboring γ′phases in alloys with low Al (7.5-8 at%) content decreases from the maximum value to minimum value and increases slowly,and then decreases again.Whereas this regularity is not found in alloys with high Al(9-12 at%)content.The difference is attributed to the combined effect of the particle number density and average particle radius.The average edge-to-edge distance of neighboring γ phase increases with increasing Al content at steady-state coarsening stage.
Declaration of competing interest
The authors declare that they have no known competing financial interests or personal relationships that could have appeared to influence the work reported in this paper.
Acknowledgments
This work was supported by the National Natural Science Foundation of China [grant number 51571122] and the Fundamental Research Funds for the Central Universities[grant number 30916015107].
Appendix A.Supplementary data
Supplementary data to this article can be found online at https://doi.org/10.1016/j.pnsc.2020.10.010.
 Progress in Natural Science:Materials International2021年1期
- Progress in Natural Science:Materials International的其它文章
- Surface study of the reconstructed anatase TiO2 (001) surface
- Effect of Na+ in situ doping on LiFePO4/C cathode material for lithium-ion batteries
- Rational construction of NiCo2O4@Fe2O3 core-shell nanowire arrays for high-performance supercapacitors
- Electric transmission behavior of self-assembled Cu-W nano multilayers
- A hybrid hydrogel/textile composite as flame-resistant dress
- Improvement on hydrogen generation properties of Zr(BH4)4·8NH3
