Experimental investigations of a full model with adaptive elasto-flexible membrane wings
Jonathan PFLU¨ GER, Christian BREITSAMTER
Chair of Aerodynamics and Fluid Mechanics, Technical University of Munich, Garching 85748, Germany
KEYWORDS Experimental aerodynamics;Flexible wing surface;Force and moment measurements;Morphing wing;Particle image velocimetry
Abstract The morphing wing concept aims to constantly adapt the aerodynamics to different flight stages. The wing is able to adapt to different flight conditions by an adjustable Aspect Ratio(AR)and sweep.A high AR configuration provides high aerodynamic efficiency,while a low AR configuration, with highly swept wings offers a good maneuverability. Additionally, the flexible membrane allows the wing surface to stretch and contract in-plane as well as the airfoil to adapt to different aerodynamic loads. In the context of this work, the aerodynamic characteristics of a full model with form-adaptive elasto-flexible membrane wings are investigated experimentally. The focus is on the high-lift regime and on the analysis of the aerodynamic coefficients as well as their sensitivities. Especially, the lateral aerodynamic derivatives at asymmetric wing positions are of interest.
1. Introduction
A main issue of aircraft design focuses on the generation of an aircraft geometry satisfying the flight performance requirements to a certain optimum.Actually,common aircraft configurations are designed for a few specific flight conditions,where they reach optimal performance. Consequently, one approach to expand the flight envelope is the adaptation of the geometry to various flight conditions, which can be established with morphing wing configurations. The development of morphing wing structures goes back to the origins of aviation.1,2The benefits of morphing wings contrast with the complex technical realization concerning the structural design,actuators,materials and the flight controls. The challenge is that the aerodynamic improvements exceed the penalties by additional structures, the increased weight and the energy consumption.3,4The morphing methods are subdivided into active and passive means.
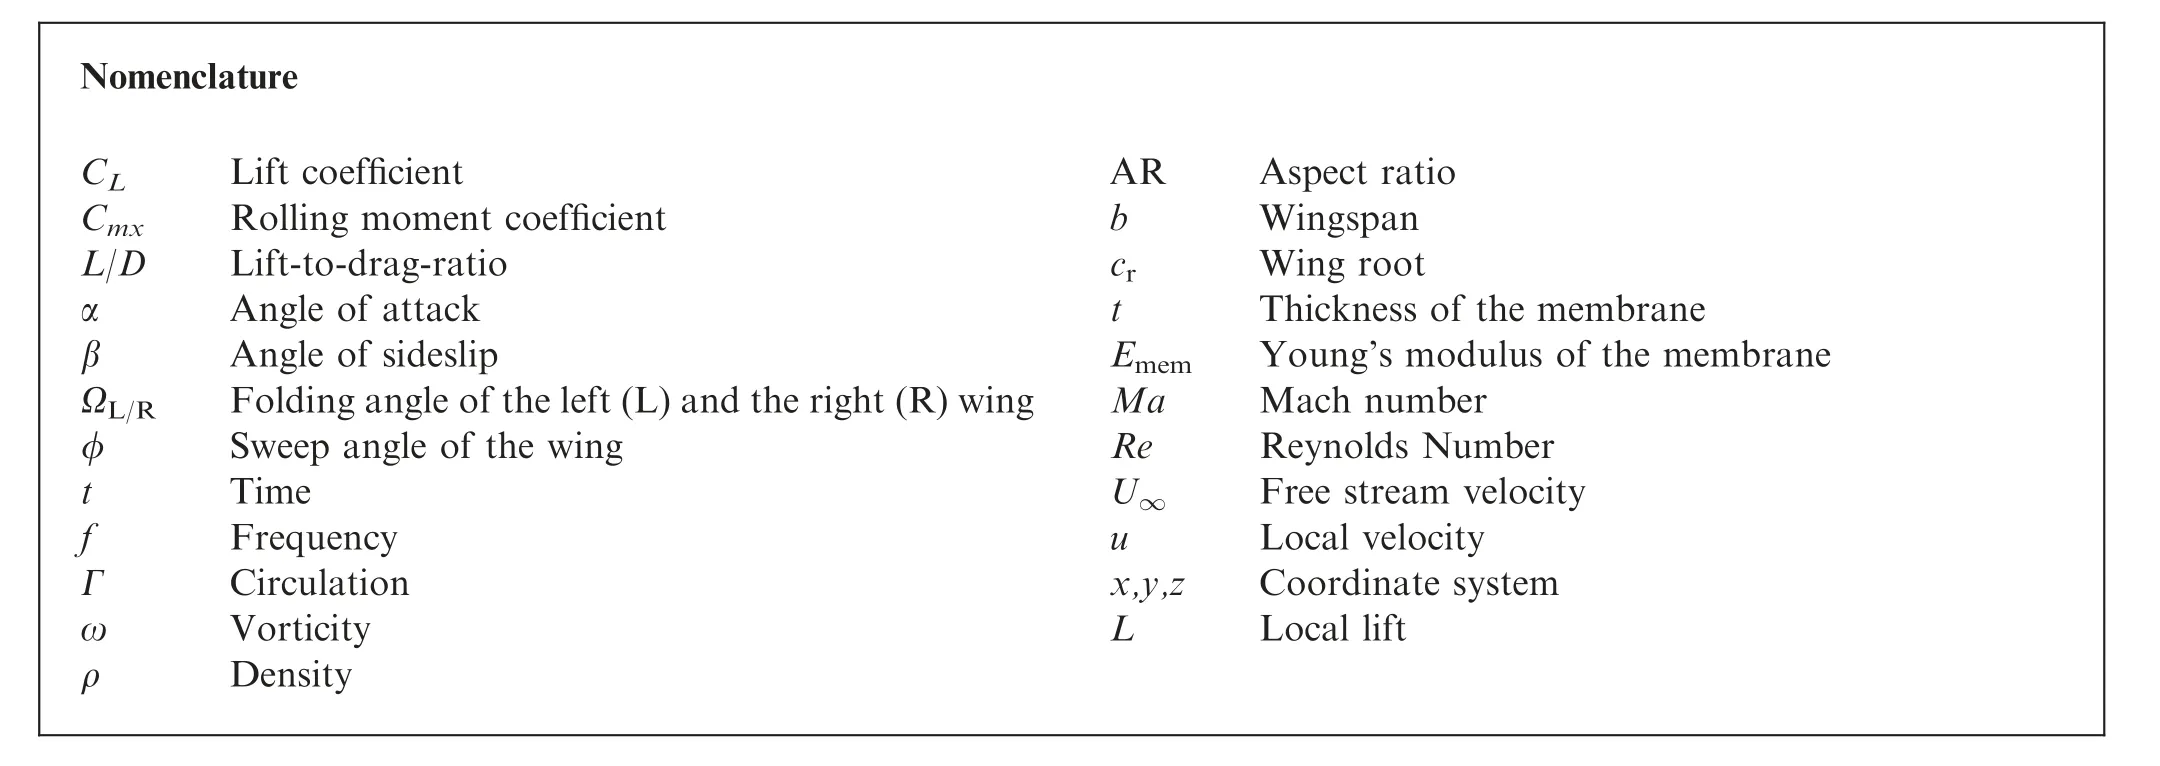
Nomenclature CLLift coefficient CmxRolling moment coefficient L/DLift-to-drag-ratio αAngle of attack βAngle of sideslip ΩL/RFolding angle of the left(L)and the right(R)wing φSweep angle of the wing tTime fFrequency ΓCirculation ωVorticity ρDensity?ARAspect ratio bWingspan crWing root tThickness of the membrane EmemYoung’s modulus of the membrane MaMach number ReReynolds Number U∞Free stream velocity uLocal velocity x,y,zCoordinate system LLocal lift
The most common examples for active morphing in current aircraft designs are high-lift devices and variable swept wings.Furthermore, the change of the wing planform, wing camber and new designs for control surfaces, especially Trailing-Edge(TE)devices,are investigated.For example in the‘‘Next-Gen Morphing Aircraft Structures” project, the benefits of massive shape morphing were analyzed with a Wind Tunnel(W/T)model.5,6The focus was set on the aerodynamic performance at loiter time and at dash speed.Within the EU collaborative research project ‘‘Active Aircraft Aeroelastic Structures”, aeroelastic models of different complexity were used for W/T tests, namely a typical airliner configuration, a three surfaces aircraft and an Unmanned Aerial Vehicle(UAV) with a large span wing and a drone configuration.Other examples for morphing technologies are the adaptive structure TE flap used for the ‘‘Mission Adaptive Compliant Wing”7or the wing with a morphing TE at the Laboratory of Applied Research in Active Controls, Avionics and AeroServoElasticity at the ETS in Montreal.8The morphing mechanism enables the change of the flap geometry with no seams or discontinuities. A team at the Beihang University combines the morphing TE technology with periodic deflections to delay stall.9
Passive morphing means that the flexible structure is deformed by the impact of aerodynamic forces, thus having an influence on the aerodynamic characteristics again. The contour deformation results from the equilibrium between the inner elastic forces of the membrane and the aerodynamic forces. The wing structure of many common aircraft can deform in a small range and therefore can adapt to incoming unsteady loads. Another drastic approach is the use of a flexible membrane, which is supported by an underlying rigid structure.
The combination of active and passive morphing is often used for Micro Air Vehicles (MAVs).10,11One unique difference for MAV design, compared to large aircraft, is the emphasis on agility vs.stability.12Their small inertias and light weight allow MAVs to operate in a wide range of speeds and flight regimes.Regarding more unsteady flight conditions,high agility is required, which can be achieved by morphing wing concepts.Possible benefits are the ability to perform aggressive maneuvers as well as the reduction of adverse effects of gusts and of unsteady aerodynamics.
The concept for the elasto-flexible morphing wing at the Technical University of Munich (TUM) was originally developed by Be´guin et al.13The semi-span wing model of Be´guin only allowed the investigation of longitudinal motions. The new morphing wing, that was developed recently, is part of a common research project with the Beihang University. Both project partners investigate morphing W/T models in their facilities. The size of the full models is limited by the dimensions of the W/T test sections.
2. Elasto-flexible morphing wing
2.1. Description of concept
The concept for the elasto-flexible morphing wing is biologically inspired, since there are already many natural flyers who can change their wing planform.The investigated concept is based on the wing design of bats and the Pterosaurs. Their wings consist of a rigid structure, which can be actuated, and an elastic skin, which serves as the aerodynamic wing surface.
Fig. 1 shows a sketch illustrating the basic structure of the investigated configuration within this paper. The position of the underlying structure actively defines the planform of the wing. Primarily, the aspect ratio and the sweep angle of the Leading-Edge(LE)are influenced.Both wings can rotate individually, which enables asymmetric configurations.
The elastic membrane forms the actual aerodynamic surface. With respect to the construction, the elasticity allows the wing surface to stretch and contract in-plane, without necessity of complex structures or mechanisms,which guarantee a smooth and continuous wing surface. In addition, the thin membrane reduces the weight.
The airfoil can passively adapt to aerodynamic loads. This mechanism changes the camber and the thickness of the airfoil.The membrane is mounted with a certain prestress. The influence of the prestress at different flow velocities and wing positions was investigated in detail by Be´guin and Breitsamter.14
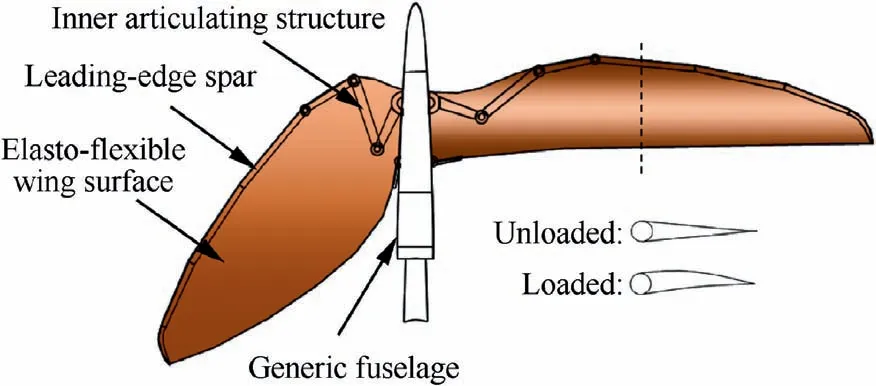
Fig. 1 Illustration of the morphing wing concept.
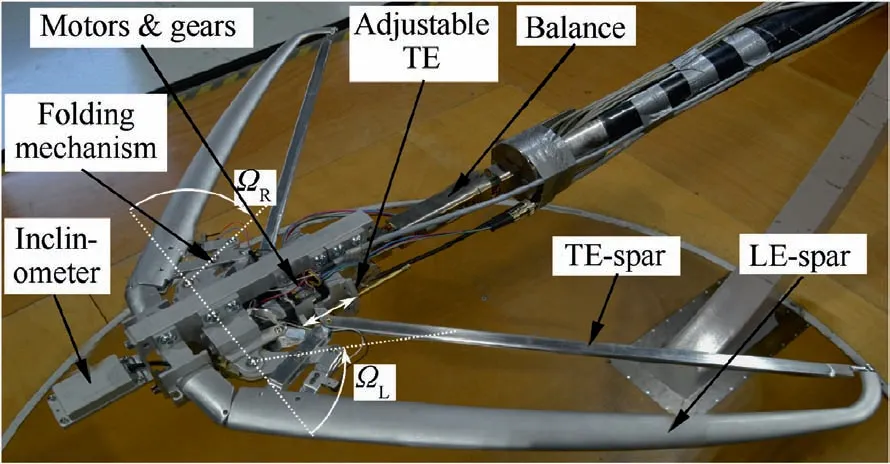
Fig. 2 Aluminum structure of the W/T model, the balance and the three-axis support.
2.2. Model design
Fig. 2 shows the underlying aluminum structure without the membrane and the fuselage cover.The W/T model is mounted via the six-component balance on a three-axis support. The wingspan can be varied in the range of 0.8m ≤b ≤1.2m.The actuation of the wings is realized by two stepper motors,which are mounted inside the fuselage.Two gearboxes provide the necessary torque and drive the folding mechanism of the wing structure.The wing positions are measured by the folding angle on the left ΩLand on the right ΩR.
Fig. 3 shows the cross section of the wing with its components and the spanned membrane in red. The main components of the wing structure are given by the actuated LE spar, which controls the planform of the wing, and the telescope TE spar, which ensures a certain prestress. The LE has an elliptical planform and tapers in spanwise direction. The TE spar is straight, because its length must adapt to the current wing position in order to provide a rigid closed frame to stretch the membrane.
The membrane material is an elasto-flexible commercial polyurethane (PU) foil provided by the PU-manufacture Pharetra (Pharetra Textile Kunststoffanwendung GmbH &Co. KG). The material has a thickness of t=6.5μm and an isotropic stiffness with a Young’s modulus of about Emem=1.03MPa. The high elasticity without plastic deformation features two advantages.First,it allows the intended planform morphing to be realized with a reasonable actuation force. Second, it produces a measurable surface deformation by the expected aerodynamic loads. The membrane is welded along the LE,pulled over the wing and fixed under the fuselage cover by a wire.
The prestress of the membrane is a critical factor influencing the deformation behavior. Regarding the current W/T model,the prestress increases significantly with a forward folding of the wing,which mainly affects the area close to the fuselage. In combination with future deformation measurements,the prestress of the selected wing positions will be determined.The prestress can be adjusted by shifting the attachment of the TE at the fuselage in axial direction. For the measurements within this paper the wing root is fixed to cr=0.14m.

Fig. 3 Cross section of the wing at the wing root.
The foldable wings provide an aspect ratio of 5 ≤AR ≤10 and a quarter-chord sweep angle of 5◦≤φ1/4≤45◦. Fig. 4 illustrates three possible wing positions with and without the membrane, the High Aspect ratio Configuration (HAC), the intermediate configuration(INC2),and the Highly Swept Configuration (HSC). Fig. 4(b)includes the black 3D printed fuselage, which has a diameter of 108 mm and a total length of 528 mm. The distance between the elliptical nose of the fuselage and the LE is 127 mm.
Table 1 specifies the respective geometrical parameters of the investigated configurations. The coloration correlates with the one used in the results part.
3. Experimental setup
The experiments are conducted in the Go¨ttingen-type closedloop low-speed W/T at TUM. The dimensions of the test section are 1.8 m×2.4 m×4.8 m (height×width×length).The model is mounted in the W/T test section using a rear sting of a three-axis support, see Fig. 5. The experiments are performed at low-speed W/T conditions with a varying Reynolds number,based on the wing root,of 0.13×10⁶≤Re∞≤0.32×10⁶and Mach numbers of 0.04 ≤Ma∞≤0.11. The measurements comprise angles of attack of-10◦≤α ≤30◦with an increment of Δα=1◦and yawing angles of-16◦≤β ≤16◦with an increment of Δβ=2◦. All measurements are conducted for five symmetric and three asymmetric wing positions.
The forces and moments are measured with an internal sixcomponent strain-gauge balance, which is mounted between the rear part of the model and the support. The sampling frequency for the measurements is set to fmeas,Force=800 Hz and the forces and moments are averaged over a total acquisition time of tmeas=5 s.
The aerodynamic coefficients are normalized by the current wing surface and the moment coefficients additionally by the wing root or span. The reference point for the moment coefficients is located on the longitudinal axis on a level with the intersection of LE and fuselage,see the sketch in Section 4.1.3.
The flow-field data in the wake region is obtained by the stereo particle image velocimetry (2D/Stereo-PIV) method.15For the comparison of the cross-flow section behind different wing positions,the PIV measurements are conducted on slices,perpendicular to the inflow, at a constant distance of 1.5crdownstream of the wing tip. The test setup is shown in Fig. 5. Seeding particles with a diameter of Δd ≈1 μm are inserted into the flow for the PIV measurements. At a Reynolds number of Re=0.264×10⁶, each camera records two raw pictures per measurement point with a time offset of Δt ≈10 μs. A time series of 400 shots with a sampling rate of fmeas,PIV=15 Hz is recorded for each measurement plane.The mean and root-mean-square values of the velocity components are determined from the velocity fields of the 400 image pairs.
The uncertainties of the single velocity components are calculated inside the post processing software DaVis by means of a method developed by Wieneke.16In the most critical area,which is given by the location of the wing tip vortex,uncertainties of less than one percent of the inflow velocity occur for the axial flow velocity component (uerr<0.01U∞).
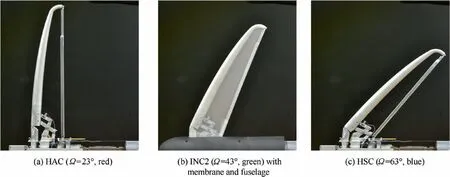
Fig. 4 Morphing wing model for the wind tunnel tests at different wing positions.

Table 1 Specifications of the symmetric configurations.
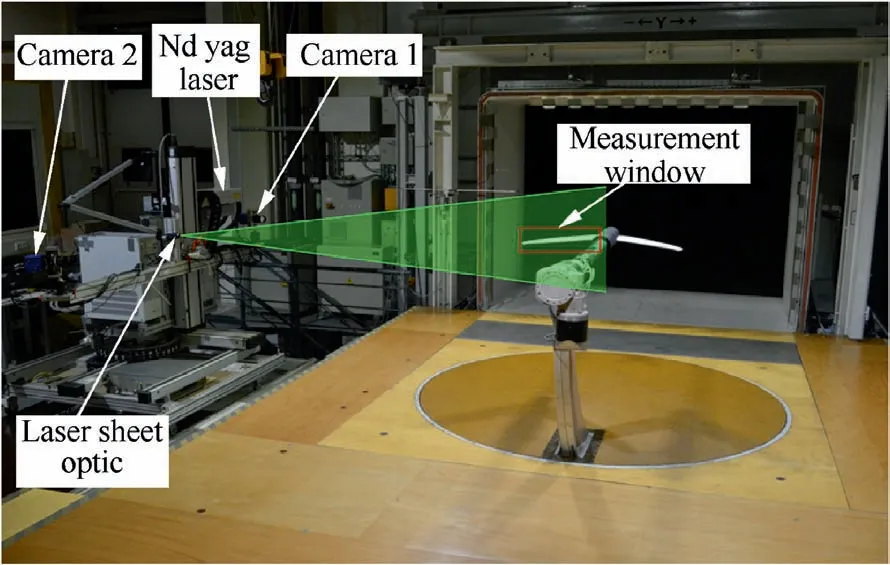
Fig. 5 Test section with mounted W/T model and Stereo-PIV system.
4. Results
The following chapter summarizes the experimental results of two W/T campaigns. The results are obtained by force and moment as well as Stereo-PIV measurements.
4.1. Aerodynamic characteristics
4.1.1. Aerodynamic efficiency
First,the results of the force and moment measurements of the symmetric configurations are discussed for different Reynolds numbers.
Fig. 6 compares the lift coefficient CLcurves of the three symmetric configurations at Re=0.264×10⁶. The lift curves show a classical trend with a linear behavior for moderate angles of attack and a flattened region for high angles of attack. It can be seen that the gradient of the linear region increases with higher aspect ratios.17All configurations show a smooth stall behavior, while the maximum CLis shifted to higher α for the highly swept wings. Concerning the HSC,the lift coefficient increases up to an angle of attack of α=24.
Fig. 7 and Fig. 8 illustrate the lift-to-drag ratio L/D both over the angle of attack (solid lines) and the lift coefficient(dashed lines) at two different Reynolds numbers. At Re=0.264×10⁶, the highest lift-to-drag ratio is achieved by
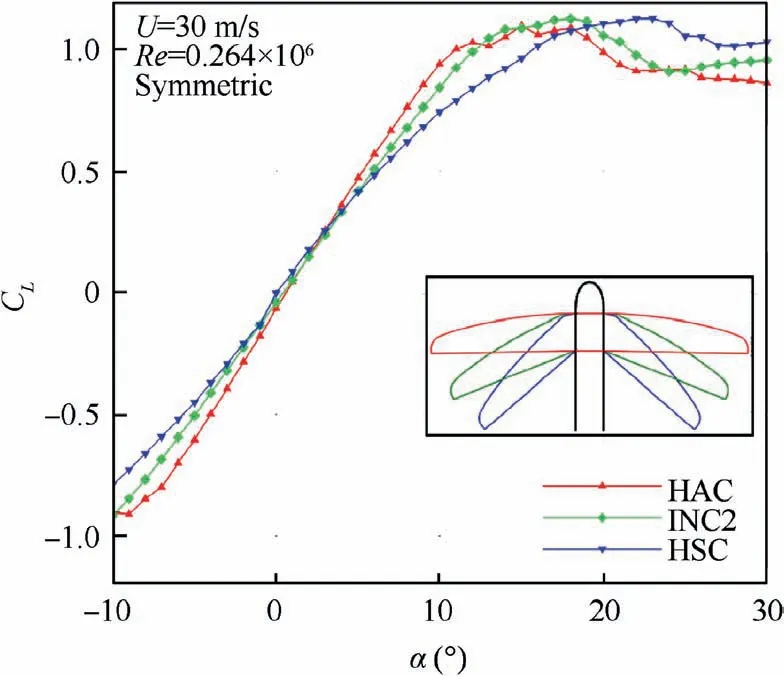
Fig. 6 Effects of different wing positions on the lift coefficient CL as a function of the angle of attack α at Re=0.264×10⁶.
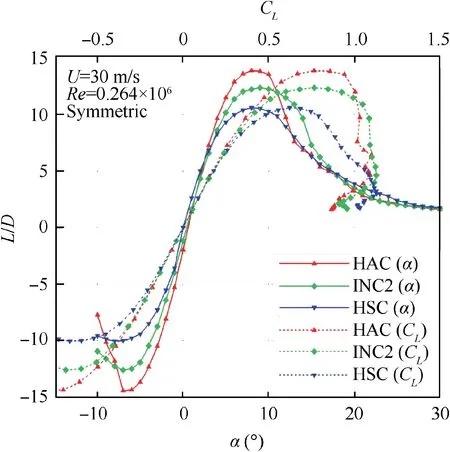
Fig. 7 Lift-to-drag ratio for different wing positions as a function of the angle of attack α (solid) and the lift coefficient CL (dashed) at Re=0.264×10⁶.
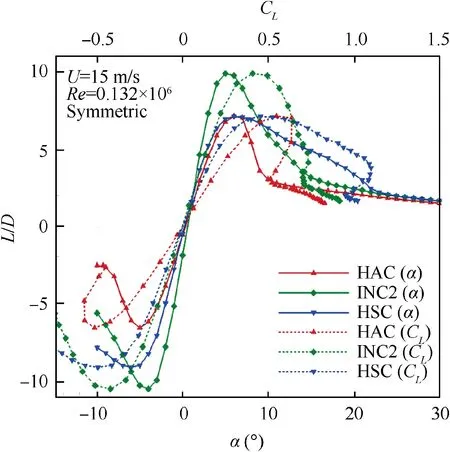
Fig. 8 Lift-to-drag ratio for different wing positions as a function of the angle of attack α (solid) and the lift coefficient CL (dashed) at Re=0.132×10⁶.
the HAC at α=8◦, see Fig. 7. Moreover, the optimal wing position can be adjusted for the required CLof the current flight condition. In combination with smaller Reynolds numbers, the adaptation of the wing planform for the best lift-todrag-ratio at a certain CLbecomes even more interesting, see Fig. 8. At Re=0.132×10⁶, the INC2 shows a better aerodynamic efficiency, which indicates a Reynolds dependency for the aerodynamic characteristics of the varies wing positions,for more details see the next chapter.
4.1.2. Reynolds number effects
The Reynolds number is varied by different inflow velocities,which also influence the dynamic pressure and thus the deformation behavior of the membrane. Consequently, the Reynolds number effects can only be investigated together with the changing deformation behavior.
The following section compares the HAC and the HSC for fourdifferentReynoldsnumbersof 0.13×10⁶≤Re∞≤0.32×10⁶. Fig. 9 includes the lift for the two extreme wing positions. The HSC reveals a Reynolds number dependency only in the high-lift regime by deviations of CL,max. The HAC, in contrast, exhibits a changing gradient in the linear region and significant variations concerning the stall behavior. At smaller Reynolds numbers, the lift curves form two local maxima for the lift coefficient. With a decreasing Reynolds number,the‘‘first”stall occurs at lower angles of attack of α=7◦, while a ‘‘second” stall not visible in the current plots is reached at about α=40◦. For the present test,lower Reynolds numbers are associated with lower dynamic pressures, which lead to smaller deformations of the constant-elastic membrane.Without the deformation,the flow follows a higher contour gradient and separates earlier from the wing surface. This mechanism is more critical at the HAC since a more forward folded wing increases the prestress of the membrane significantly.
4.1.3. Flight control potential
First,the longitudinal stability is investigated briefly.The folding of the wings affects the locations of the Aerodynamic Center(AC)and of the Center of Gravity(CG).With a backward folding from the HAC to the HSC, the AC moves further downstream than the CG, see Table 2. At the current weight distribution, small folding angles effect longitudinal unstable configurations.
Further results within this section deal with asymmetric configurations in order to determine the flight control potential of the morphing wing. There are many other mechanisms which influence the flight control, but here the focus is set on the lateral control. Two examples are given which show how the folding of the wing can potentially replace parts of common control surfaces.
Fig. 10 illustrates the first example. The left wing is folded backwards from the initial ΩL=23◦to ΩL=63◦. The rolling moment coefficient Cmxof three wing positions is compared along the linear lift region. The positive rolling moment coefficient of the HAC is probably caused by the highly spanned membrane,which generates a small twist of the wing surfaces.At an angle of attack of α=9◦, the center of pressure on the left wing is shifted towards the fuselage. The lever arm on the left side becomes smaller compared to the right side.Hence, a negative rolling moment is induced.
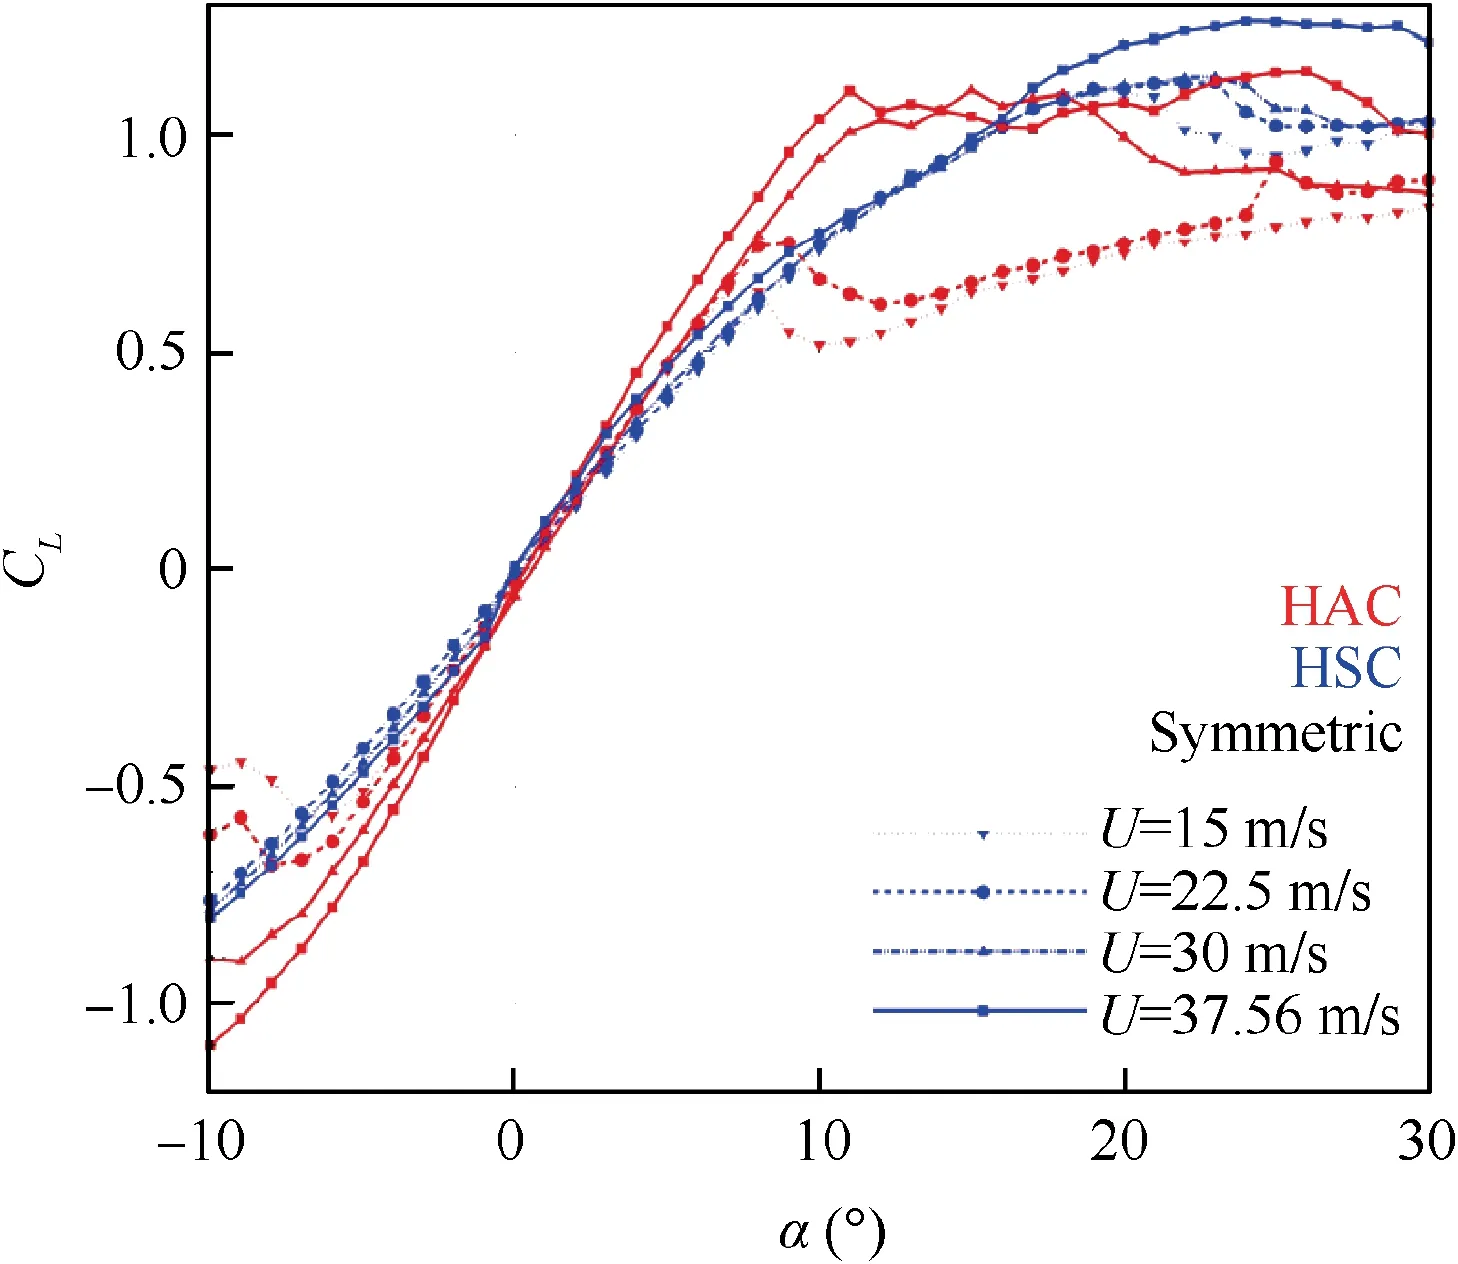
Fig.9 EffectsoftheReynoldsnumber(0.1×10⁶ ≤Re ≤0.3×10⁶) on different wing positions (HAC and HSC) analyzed by the lift coefficient CL over the angle of attack α.

Table 2 Axial position of AC and CG, and the distance Δx between AC and CG for different wing positions.
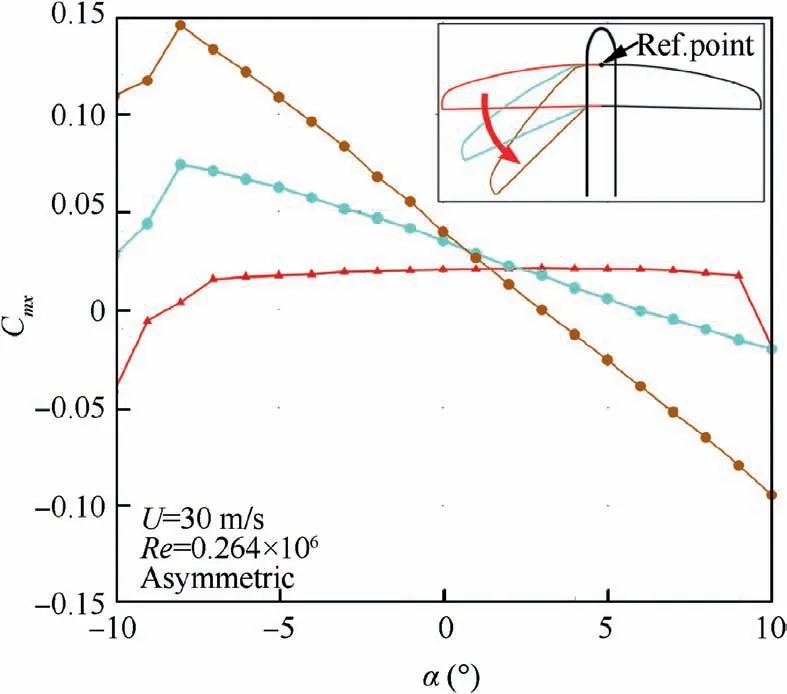
Fig. 10 The rolling moment coefficient Cmx as a function of the angle of attack when folding the left wing backward at α=9◦and Re=0.264×10⁶.
The second example illustrates the control of the rolling moment under sideslip flow conditions, see Fig. 11. The symmetric HSC shows a positive rolling moment under a negative sideslip angle, for example at β=-10◦. This moment can be equalized by folding the right wing forward.
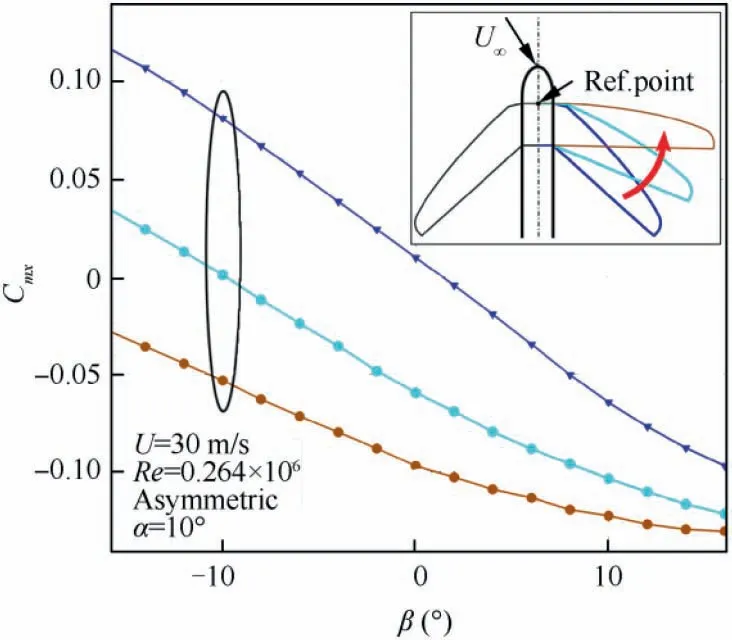
Fig. 11 The rolling moment coefficient Cmx as a function of the angle of sideslip when folding the right wing forward at α=9◦,β=-10◦and Re=0.264×10⁶.
For both examples,the yawing moment is almost not influenced by the folding of the wings.The exclusive generation of a rolling moment enables the folding mechanism as an instrument for active flight control. In the best case, the mechanism replaces common ailerons for the rolling moment control.For the realization during flight,a sufficient velocity of the folding is necessary.
4.2. Wake flow characteristics
The wake structure of the wing is investigated by Stereo-PIV.Fig. 12 shows the non-dimensional axial velocity distribution u/U∞at slices 1.5crdownstream of the wing tip for the three different configurations at α=10◦and Re=0.264×10⁶. The TE is visualized in black and the slice positions are displayed in red on the sketches on the upper right corner.Due to reflections of the fuselage in the background on the raw images the section close to the fuselage cannot be evaluated.
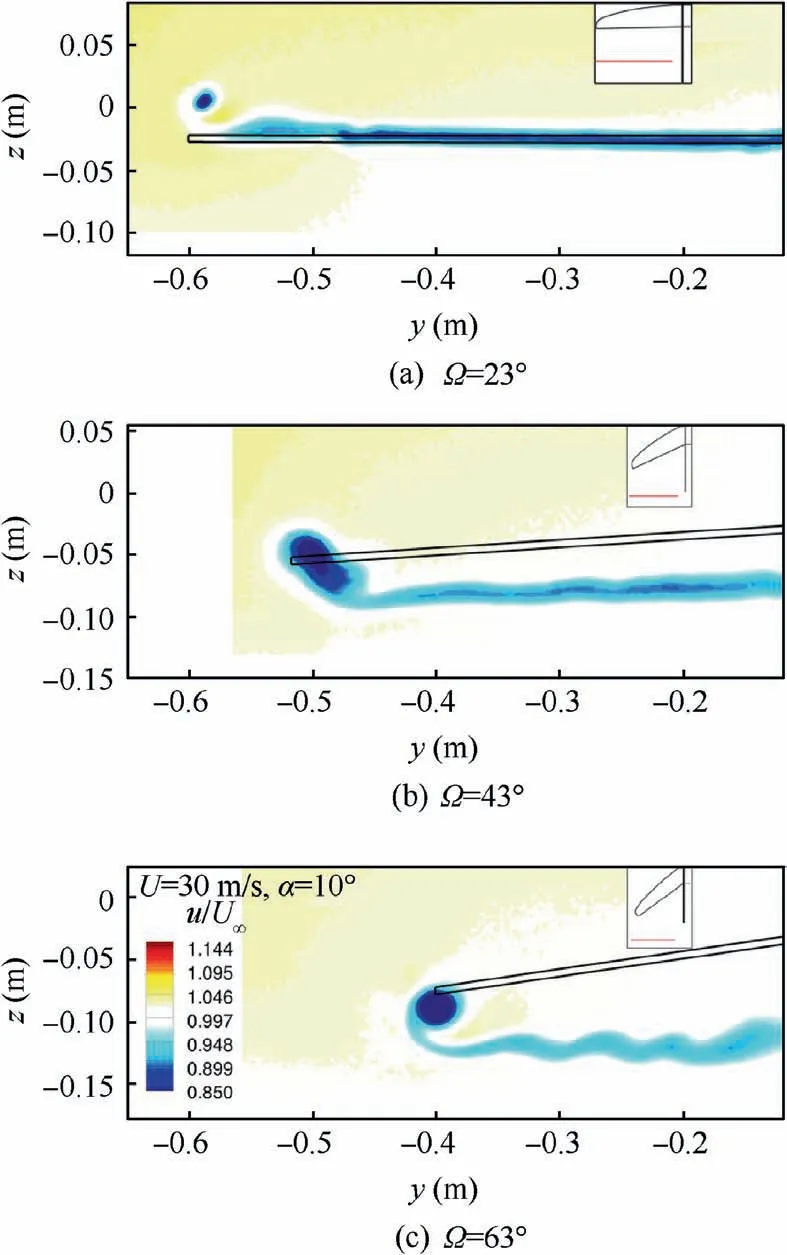
Fig. 12 The non-dimensional axial velocity field u/U∞at 1.5cr downstream of the wing tip for Ω=[23◦,43◦,63◦], α=10◦and Re=0.264×10⁶.
The flow structures with u/U∞≤1 (depicted in blue color)indicate a general reduction of the axial flow compared to the freestream.The vortex sheet and the wing tip vortex are clearly visible by the velocity deficit,which is caused by the boundarylayer flow leaving the TE and the reduced axial velocity in the vortex core.
The HAC forms a smooth and continuous shear layer,which indicates an attached flow along most of the wingspan.The TE has a small kink due to constructive reasons, which leads to small disturbances at a wingspan position of about y=-0.5m.Above the wing tip,the core of the wing tip vortex is visible.
By folding the wing, the wing tip vortex increases in size and strength and the vortex sheet becomes more and more disturbed. Hence, it has to be mentioned, that, due to the highly swept TE, especially at the HSC, the local distance between PIV slice and TE changes significantly. The oscillations of the shear layer at the HSC,see Fig.12(c),result from the membrane deformation or from rolling-up processes due to the increased distance to the TE.
With an increasing angle of attack of α=15◦the flow on the upper side of the wing starts to separate, see Fig. 13. The HAC shows large areas of separated flow, which can be seen by the reduced axial flow velocity. However, the flow at the more folded wings stays attached on a larger portion of the wing, which is probably caused by the higher LE sweep and the larger deformation of the membrane. The latter has to be clarified by future deformation measurements. Smaller areas with separated flow at the folded wings explain the higher lift coefficient at α=15◦, see Fig. 13(c).
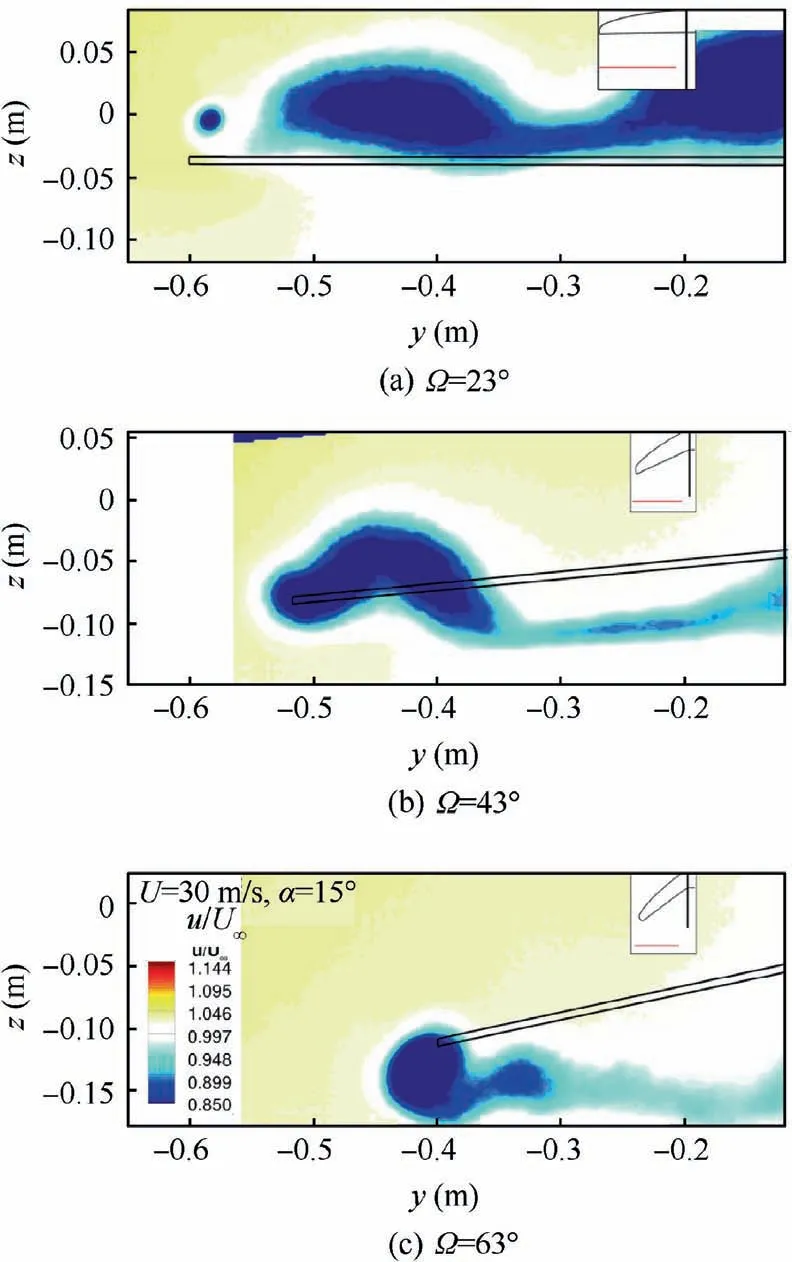
Fig. 13 The non-dimensional axial velocity field u/U∞at 1.5cr downstream of the wing tip for Ω=[23◦,43◦,63◦], α=15◦and Re=0.264×10⁶.
The spanwise lift distribution L(y) can be calculated by evaluating the velocity fields of the PIV measurements, as described in Hubel18and Breitsamter.19Therefore, the vorticity in x-direction ωxis calculated from the velocity field. The wake is divided in i segments with an area A. The circulation contribution Γiis calculated for each segment, by the surface integral in Eq. (1). The local circulation is obtained by the summation of Γifrom the wing tip to the wing root, see Eq.(2). The Kutta-Joukowsky theorem links the local lift L(y )to the local circulation, see Eq. (3). Finally, the lift distribution, CL(y )cr, is obtained according to Eq. (4).
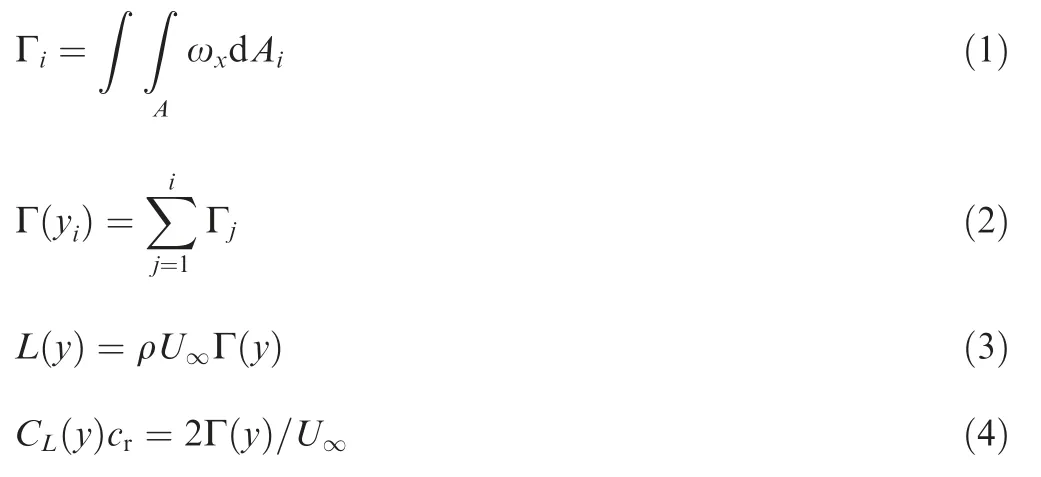
The PIV slices are located close to the TE to reduce the effect of dissipation on the vorticity calculation. The missing region close to the fuselage is extrapolated by the last available value, marked by the dashed lines in Fig. 14. The calculated global lift coefficient shows maximal deviations of up to 10% in comparison to force measurement values. This is caused by the dissipation effects of vorticity, the missing fuselage and the extrapolated area.
Fig. 14 illustrates the lift distribution in spanwise direction for the three different wing positions at an angle of attack of α=10◦and a Reynolds number of Re=0.264×10⁶. The HSC generates more lift in the wing tip region,which is caused by the stronger wing tip vortex.The lift distribution of the red HAC is more similar to the ideal elliptical one, which correlates with the higher aerodynamic efficiency.
The PIV measurements show the influence of the wing positions on the aerodynamics around the wing. At moderate angles of attack, the HAC generates a uniform shear layer and a small wing tip vortex, which indicates a high aerodynamic efficiency. With a more folded wing, the increasing sweep of the LE produces a larger and stronger wing tip vortex. At high angles of attack, this vortex dominates the flow field and is responsible for the late stall behavior of the HSC.
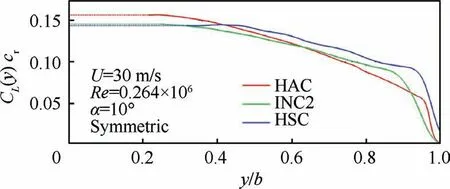
Fig.14 The lift distribution CL (y )cr in spanwise direction for the three wing positions at α=10◦and at Re=0.264×10⁶ at 1.5cr behind the wing tip.
5. Conclusions and outlook
This article summarizes first experimental results of a new elasto-flexible morphing wing wind tunnel model.
(1) The full model with elasto-flexible membrane wings is capable of changing the positions of both wings individually. Thereby, the wing planform can be changed actively by varying the aspect ratio and the wing sweep over a wide range. In addition, the model is equipped with an elastic membrane, which is capable of adapting to aerodynamic loads. This enables a passive change of the airfoil shape.
(2) Force and moment measurements are performed in the wind tunnel of TUM. The results show the expected improvement of the maximum lift-to-drag ratio with an increasing aspect ratio. Furthermore, the aerodynamic coefficients indicate a significant variation concerning the lift and the drag characteristics for different wing positions. The Reynolds number mainly influences the configurations with high aspect ratios.Asymmetric wing configurations deliver significant rolling moments,which can be used for an active control of the aircraft.
(3) The wake of the model is investigated by Stereo-PIV measurements. First of all, the High Aspect ratio Configuration(HAC)shows areas with separated flow,while the flow at the Highly Swept Configuration(HSC)stays attached at higher angles of attack. The lift distribution varies with the wing position. While the HSC generates more lift in the wing tip region, the HAC shows a more elliptical distribution.
The experimental measurements indicate the potential of the elasto-flexible morphing wing. Depending on the flight stage,various flight characteristics can be achieved by one single configuration. In addition, the airfoil passively adapts to the aerodynamic loads of the inflow.
In a future step, the deformation and the prestress of the membrane is measured via digital image correlation. Furthermore, measurements under unsteady inflow conditions are planned.
Acknowledgements
The research project is funded by the Deutsche Forschungsgemeinschaft (DFG, German Research Foundation) – BR 1511/12-1. Furthermore, the authors thank the team from the Xi’an Jiaotong University for the invitation and the organization of the Smart Aircraft 2019 Conference.
 CHINESE JOURNAL OF AERONAUTICS2021年7期
- CHINESE JOURNAL OF AERONAUTICS的其它文章
- Integrated batteries layout and structural topology optimization for a solar-powered drone
- Polynomial networks based adaptive attitude tracking control for NSVs with input constraints and stochastic noises
- Morphing wing flaps for large civil aircraft:Evolution of a smart technology across the Clean Sky program
- Review on bio-inspired flight systems and bionic aerodynamics
- SARISTU:Adaptive Trailing Edge Device(ATED)design process review
- Continuous morphing trailing-edge wing concept based on multi-stable nanomaterial
