Prediction of combined cycle fatigue life of TC11 alloy based on modified nonlinear cumulative damage model
Zhenhu ZHAO, Kinn LU, Lingfeng WANG, Lulu LIU, Wei CHEN,*
a State Key Laboratory of Mechanics and Control of Mechanical Structures, Nanjinj University of Aeronautics and Astronautics, Nanjing 210016, China
b Aero-engine Thermal Environment and Structure Key Laboratory of Ministry of Industry and Information Technology, College of Energy and Power Engineering, Nanjing University of Aeronautics and Astronautics, Nanjing 210016, China
KEYWORDS Combined cycle;Damage accumulation;High-cycle fatigue;Low-cycle fatigue;Prediction method
Abstract The nonlinear cumulative damage model is modified to have high prediction accuracy when the high-low cycle stress frequency ratio m is large (m ≥500). The low cycle fatigue (LCF)tests, high cycle fatigue (HCF) tests and combined high and low cycle fatigue (CCF) tests of TC11 titanium alloy were carried out, and the influencing factors of CCF life were analysed. The CCF life declines with the decrease of the ratio of high-low cycle stress frequency m. Both linear and nonlinear cumulative damage models are used to predict the CCF life.The CCF life prediction error of the linear cumulative damage model is great and the predictions tend to be overestimated,which is dangerous for engineering application. The accuracy is relatively high when the high-low cycle stress frequency ratio m ≤500.The accuracy of nonlinear cumulative damage model is higher than that of linear model when the high-low cycle stress frequency ratio m ≥500.Based on the relationship between high cycle average stress σmajor and material yield limit σp,0.2,a correction term is added to the nonlinear cumulative damage model and verified, which made the modified model more accurate when m ≥500.
1. Introduction
Fatigue which is a technical problem often encountered in the deveopment and service of gas turbine engines.Fatigue failure of engine components not only increases maintenance costs,but also has a significant adverse impact on safety, applicability and equipment integrity. The dangers and losses caused by fatigue failure are great. According to statistics from the United States, fatigue failures during 1982 to 1996 accounted for 49% of damage to all components of US aero-engines, and High Cycle Fatigue (HCF) accounted for almost half of all fatigue failures.1Based on the research of the Air Force National Turbine Engine High Cycle Fatigue program (HCF program), the factors that have great impact on the fatigue performance of gas turbine engines include the interaction of high-low cycle fatigue (of rotor blades, etc.), foreign object damage (on compressor and fan blades), fretting fatigue (of tenon grooves, flange edges, etc.), corrosion, thermal fatigue(of turbine blades and impellers), etc.2–6
The rotor blades suffer different kinds of loads during engine operation,including tensile stress generated by centrifugal load and thermal stress generated by thermal load (these two stresses manifests themselves as low cycle load with low frequency and large stress amplitude); as well as high cycle load with small stress amplitude caused by gas disturbance and blade vibration during flight cycles.7,8In the HCF program carried out by AFRL/ML of United States, a test was conducted to study the effect of prior Low Cycle Fatigue(LCF) loading on HCF limit. It was found that prior LCF pre-loading would not cause significant reduction in HCF limit, or even made the HCF limit increase slightly under certain conditions.9,10Lanning et al.11studied the effect of lowcycle fatigue loading on both small crack initiation and highcycle fatigue limit on Ti-6Al-4V specimens with small notch(Kt=2.7). The results showed that the subsequent HCF limit would be significantly reduced only when prior LCF loading reached a certain amount (around 25% of Nlcf, with some small cracks). It could be concluded from the above research that the effect of prior LCF loading on HCF performance is not obvious.
When low cycle and high cycle loads interact on the blade,it will cause Combined high and low Cycle Fatigue (CCF).Fuchs et al.12paid attention to this problem in 1977,and many scholars have carried out research in this field since then.Cortez13and Iyer14et al.investigated the effects of CCF loading on the fretting fatigue performance of titanium alloys.Stanzl-Tschegg et al.15carried out variable amplitude fatigue tests by superimposing high cycle loads on low cycle loads.The results showed that the fatigue life of variable amplitude loading is much lower than that of constant amplitude loading.Various models are proposed for CCF life prediction.16–19Walls’s research20found that it would be inaccurate to design the life of components subjected to CCF loadings using the equal life diagram, and it is recommended to use the method of fracture mechanics. Zheng et al.19established a CCF life prediction model based on the exponential decay law by characterizing the effects of high and low stress amplitude on CCF damage.Oakley and Nowell21proposed a method for predicting the CCF life of turbine blades subjected to foreign object damage through experimental research. Han et al.22,23studied the CCF life of turbine blade with aluminizing composite strengthening. Hu et al.4researched the influence of different parameters on the Fatigue Crack Growth (FCG) rate under CCF loading.They carried out FCG tests of GH2036 at different HCF stress ratios (RHCF), and the results showed that HCF amplitudes delayed the FCG rate for GH2036 at a higher RHCF.They also carried out FCG tests of GH2036 plate specimen at a large range of stress ratio,researched the influence of high-low cycle stress frequency m on FCG rates under CCF load, and established the crack closure model for GH2036.Based on the above research results, a CCF life prediction method considering the coupling effect of loading sequence effect and cracked structure vibration is developed and verified by experiments.24
In earlier studies, linear cumulative damage method was used to predict the CCF life.16This prediction method is still widely used nowadays,25–27but it does not consider the effect of the interaction between low and high cycles on the fatigue life, so it’s somewhat inaccurate.28Tpyфикoв and Кoвaльчyк29,30carried out research on CCF life estimation method based on nonlinear cumulative damage model,considering the effects of high-low cycle stress frequency ratio and stress amplitude. A CCF life estimation formula was developed according to the analysis of CCF test results of structural steel, nickel base alloy and aluminium alloy. Namjoshi and Mall31compared the effects of linear and nonlinear cumulative damage method on the prediction of fretting fatigue life, and their experiment results showed that the nonlinear cumulative damage prediction method are more accurate. In order to explain the HCF and LCF loads interaction,different methods have been put forward, such as introducing the influence of overload ratio32,33or crack closure concept.34,35
Considering from the perspective of blade fatigue life design, it is necessary to take the superimposed effect of LCF and HCF into account.Therefore the cumulative damage model under CCF loading should be researched to predict the CCF life. The nonlinear damage cumulative model proposed by Tpyфикoв is modified in this paper according to the relationship between the high cycle mean stress σmajorand the yield limit σp,0.2, building on previous research.18The prediction accuracy of modified model is improved when high-low cycle stress frequency ratio is large (m ≥500).
2. Experiment procedures
2.1. Specimen and device
2.1.1. Details of specimen
TC11 is a kind of α-β type high temperature strength titanium alloy with good comprehensive properties.It is mainly used in compressor disk, blade and other parts of aeroengine. Some aircraft structural parts are also made of TC11. The basic chemical composition and mechanical properties of TC11 can be seen in Table 1 and Table 2, with a density ρ=4.48 g/cm3, Young’s modulus E=123 GPa, Poisson’s ratio μ=0.33 at room temperature. Specimens are machined from bars.
σbis the tensile strength,σp0.2is the yield strength,δ5is the elongation, Ψ is the section shrinkage, HBS is the Brinell Hardness, akuis the impact toughness.
TC11 titanium alloy tensile fatigue test specimen is designed by reference to HB-528736(a Chinese standard test method for axial loading fatigue of metallic materials)as a smooth sample(Kt=1), with a diameter of 7 mm at the working section, as shown in Fig.1.The bimodal microstructure of TC11 is shown in Fig. 2.
2.1.2. Device details
The fatigue test of TC11 specimen was carried out by MTS809-25 T tensile torsional composite loading fatigue test system at room temperature. The device parameters are as follows:
Maximum dynamic tension: 250 kN
Torque: 2200 N·M
Diameter range of round bar specimen: 6.4 mm-26 mm,30 mm
Size range of flat plate specimen: thickness<12 mm,width<130 mm

Table 1 Basic chemical composition of TC11 titanium alloy(wt%).
2.2. Test method
2.2.1. LCF test
The LCF test was conducted on the smooth sample shown in Fig.1.The test methodology followed the recommendations in the ASTM E606 Standard37.Cyclic loading was applied with a frequency of 1 Hz.Wave form was sinusoidal.The stress ratio was 0 during all LCF tests. In order to study the law of LCF life of TC11 titanium alloy under the maximum stress, four groups of LCF tests with σmaxequals to 900, 950, 1000 and 1030 MPa respectively were carried out. For σmaxequals to 900 and 950 MPa, there were four specimens in each group,while for σmaxequals to 1000 and 1030 MPa, three specimens in each group.
2.2.2. HCF test
The HCF test was conducted on the smooth sample shown in Fig.1.Cyclic loading was applied with frequency equals to 12 or 16 Hz.Wave form was sinusoidal.In order to study the law of HCF life under different mean stress σm,six groups of HCF tests with σmequals to 800 MPa(stress ratio R of 0.5,0.55 and 0.6 respectively) and σmequals to 750 MPa (stress ratio R of 0.45,0.5 and 0.55 respectively)were carried out.For σmequals to 800 MPa (R=0.5 and 0.55) and 750 MPa (R=0.45 and 0.55), there were three specimens in each group, while for σmequals to 800 MPa,R=0.6 and 750 MPa,R=0.5,four specimens in each group.
2.2.3. CCF test
The CCF test was conducted on the smooth sample shown in Fig. 1. Cyclic loading was applied with frequency between 12 and 20 Hz.
The CCF load spectrum used in the test is shown in Fig.3.A cycle load block is consisting of several HCF cycles superimposed on the peak of LCF load. High-low cycle stress frequency ratio m is defined as the number of high cycles in a cycle load block, that is, m=nhcf/nccf.
The stress ratio in CCF include high cycle stress ratio Rminorand total stress ratio Rtotal,which are calculated by the following equation respectively:
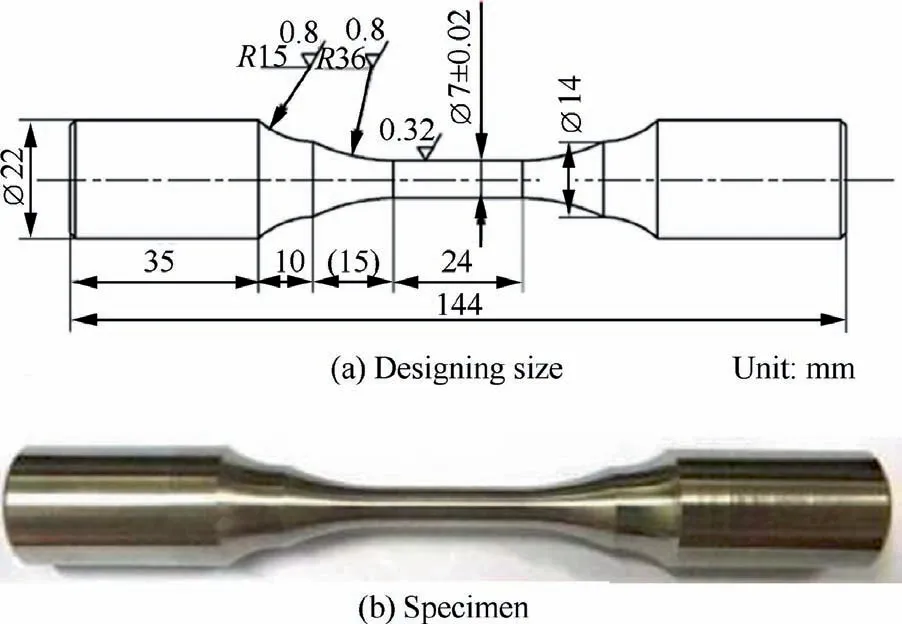
Fig. 1 Fatigue specimen.
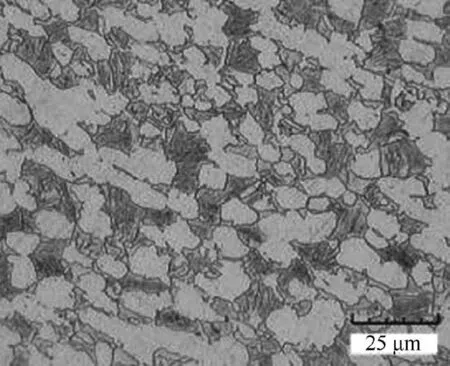
Fig. 2 Bimodal microstructure of TC11.

Fig. 3 CCF test load spectrum.

In this paper, σmin=0, so the stress ratio of low cycle trapezoidal wave Rlcf=0, and the amplitude of high cycle stress σa,hcf<σmajor, so Rtotal=0.
The CCF tests with the average stress σmajorof 800 MPa and 750 MPa respectively and the high-low cycle stress frequency ratio of 200,500 and 1000 were carried out.The experimental parameters are shown in Table 3.

Table 2 Basic mechanical properties of TC11 titanium alloy.
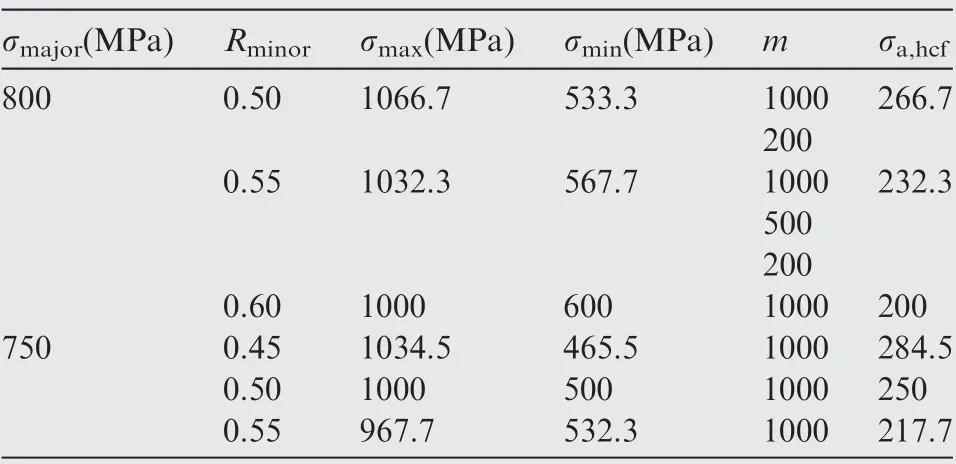
Table 3 Experimental parameters of CCF test.
3. Results and discussions
3.1. Test results and analysis
A total of 14 LCF tests, 20 HCF tests and 36 CCF tests were carried out.The test results are listed in Table 4,and the specific test data are shown in Appendix A Tables A1-A3
The life formula is analysed and fitted according to the LCF and HCF test results. The influence of experimental parameters on CCF life is analysed by researching the test results.

3.1.1. LCF life analysis

Take logarithm on both sides to get the double logarithmic linear equation:

The least square method is used to fit the test results, and the following double logarithmic linear equation is obtained,with the correlation coefficient r=-0.9659:

The data points of LCF tests and the life Eq.(7)are drawn in double logarithmic coordinate, as shown in Fig. 4.
3.1.2. HCF life analysis
According to the double logarithmic linear Eq. (5), the least square method is used to fit the average cycle number, N-hcfof the average stress σm=800 MPa is as follow with the correlation coefficient r=-0.9554:


Table 4 Experimental parameters and test results of fatigue tests.
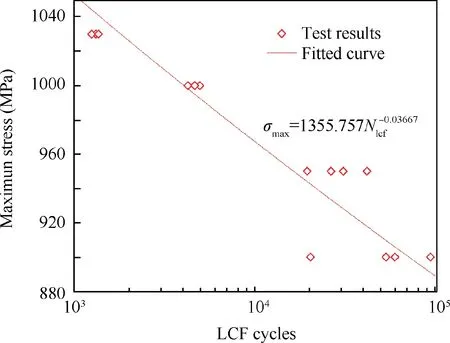
Fig. 4 LCF test results and fitted life curve.
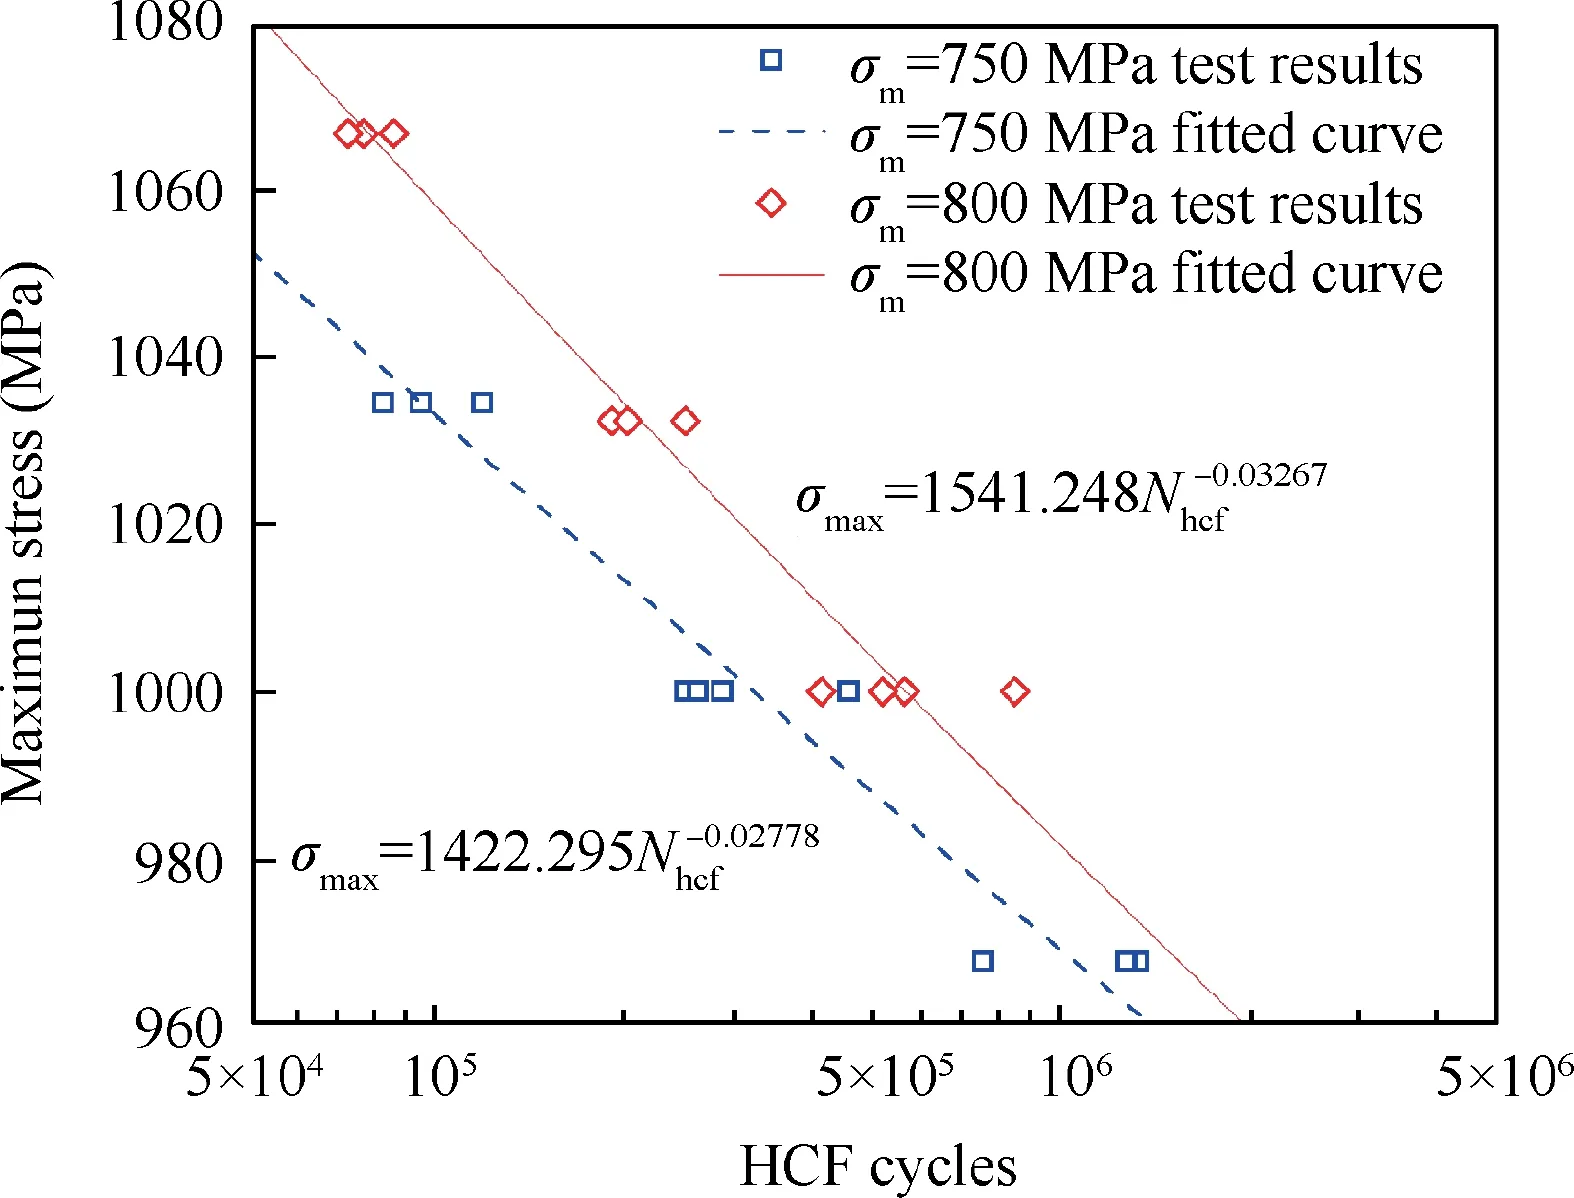
Fig. 5 HCF test results and fitted life curve.
The data points of HCF tests and the life Eq.(8),the average stress σm=800 MPa and Eq. (9), the average stress σm=750 MPa are drawn in double logarithmic coordinate respectively, as shown in Fig. 5.
3.2. The influence of mean stress on CCF life
The test results when σmajor=800 and 750 MPa with high-low cycle stress frequency ratio m=1000 were compared and analysed.
Power function expression describing the relationship between the test value of high cycle numberand the maximum stress σmaxwas fitted using the least square method.The function of σmajor=800 MPa is as below, with the correlation coefficient r=-0.9620.

The function of σmajor=750 MPa is as Eq. (11), with the correlation coefficient r=-0.9728.

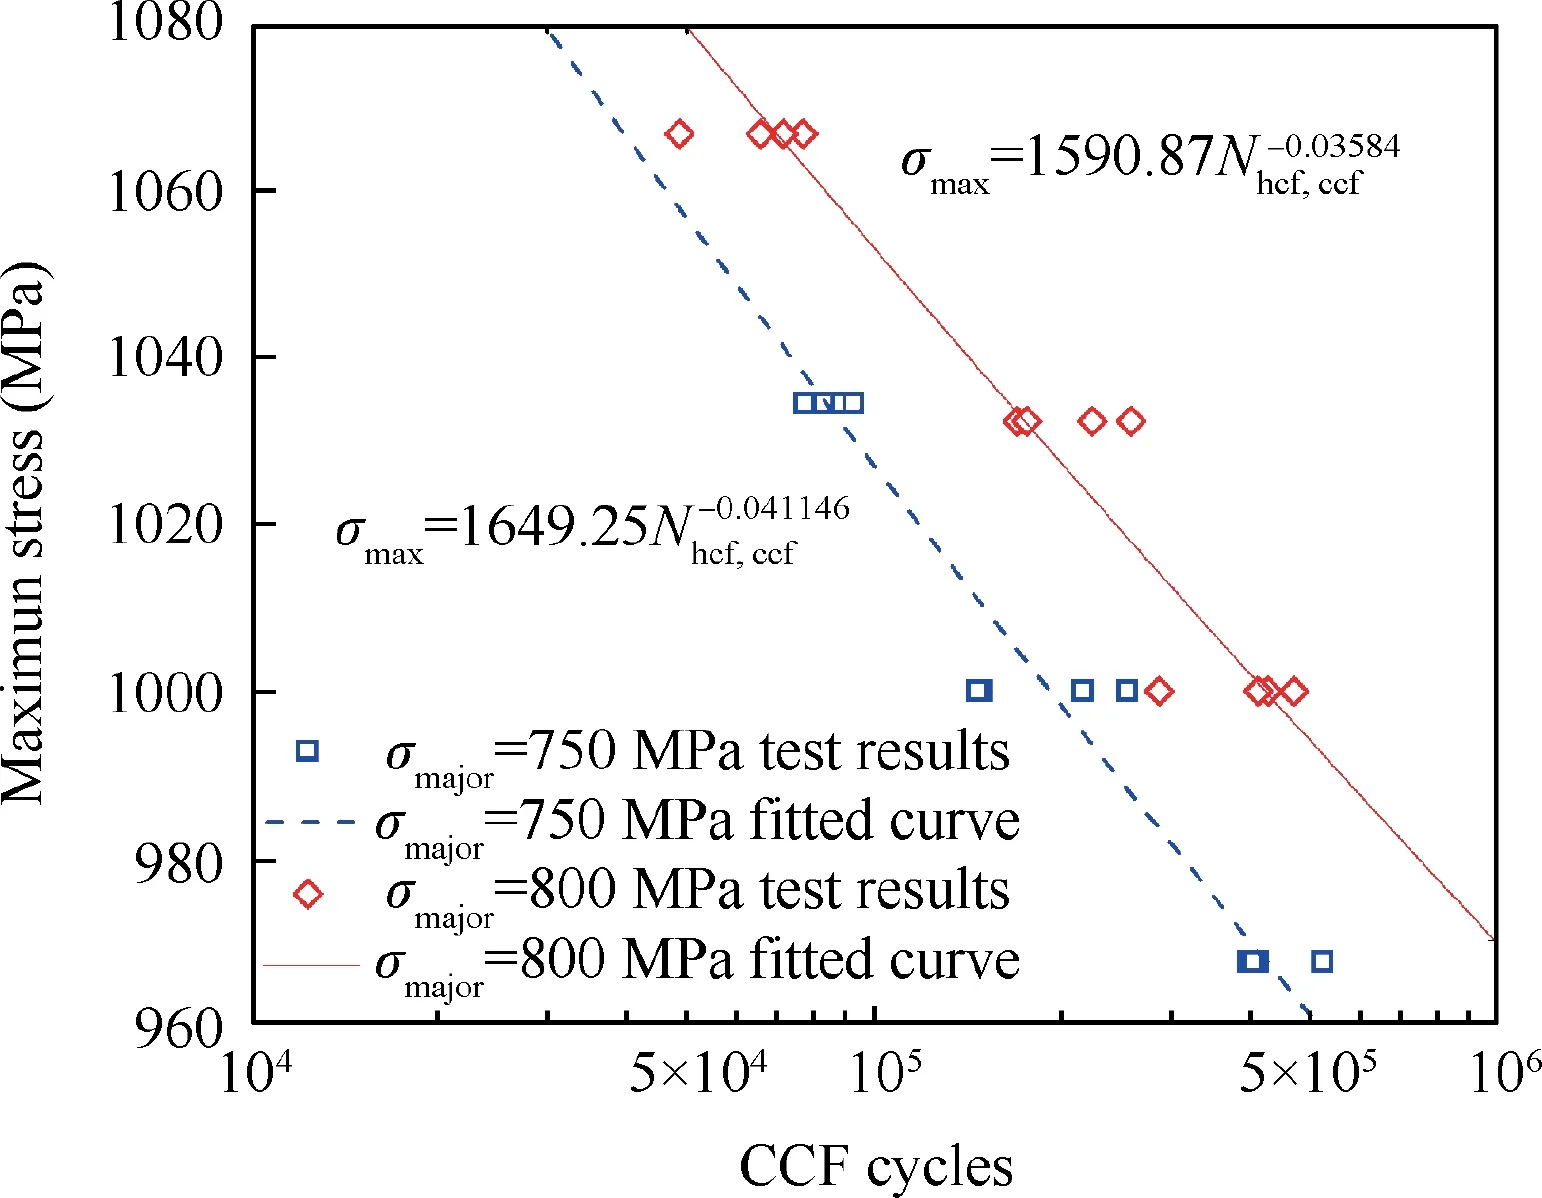
Fig. 6 CCF test results and fitted life curve with high-low cycle stress frequency ratio m=1000.
The CCF data points and fitting curves of the two average stresses(σmajor=750 and 800 MPa)are shown in Fig.6.It can be seen from this logarithmic coordinate diagram that the fitting curves of CCF life with average stress of 750 MPa and 800 MPa are basically parallel (the slopes are -0.04115 and-0.03584 respectively). Under the same maximum stress condition, the fatigue life at average stress 750 MPa is lower than that of 800 MPa. It is mainly because the amplitude of HCF cycle of average stress 750 MPa is larger, and consequently the damage caused by each high cycle is also larger than that of average stress 800 MPa.That is to say,the stress amplitude of high cycle load has a great influence on the fatigue life under the action of combined high and low cycle load.
The curve of the relative elongation ΔL (the difference between the maximum elongation of the specimen in a certain cycle block Nblockand the maximum elongation of the first cycle block) at σmajor=800 MPa and σmajor=750 MPa,and the numbers of cycle block are shown in Fig. 7. The growth rate of the specimen elongation slows down and the fatigue life increases gradually with the decrease of the amplitude of high cycle load(the increase of Rminor),since the damage decreases with the decrease of specimen elongation produced by each high cycle in the cycle block.
3.3. The influence of high-low cycle stress frequency ratio on CCF life
In order to analyse the influence of high-low cycle stress frequency ratio m on CCF life,the test results at high cycle average stress σmajor=800 MPa and high-low cycle stress frequency ratio m=1000,500 and 200 respectively were analysed, as shown in Fig. 8.
It can be seen from Fig. 8 that, under the conditions of σmajor=800 MPa and Rminor=0.5, the CCF life at m=200 is mainly concentrated below 65000 cycles, while at m=1000 the CCF life is mainly concentrated above 65000 cycles. Under the condition of σmajor=800 MPa and Rminor=0.55, the average CCF life at m=1000 is higher than that of m=500 or 200. The damage caused by the low cycle has an important effect on the CCF life. The relative numbers of low cycle increase with the decrease of high-low cycle stress frequency ratio m,leading to decrease of CCF life.
On the other hand, the difference between test results at m=500 and 200 is small while under the conditions of σmajor=800 MPa and Rminor=0.55, which shows that the CCF life is not only determined by the damage caused by low and high cycle load, but also related to the interaction between low and high cycle load. The cumulative damage of CCF is not a simple high and low cycle load linear sum.
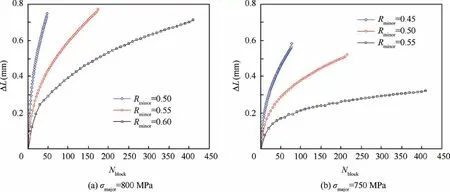
Fig. 7 Curve of relative elongation ΔL (m=1000).
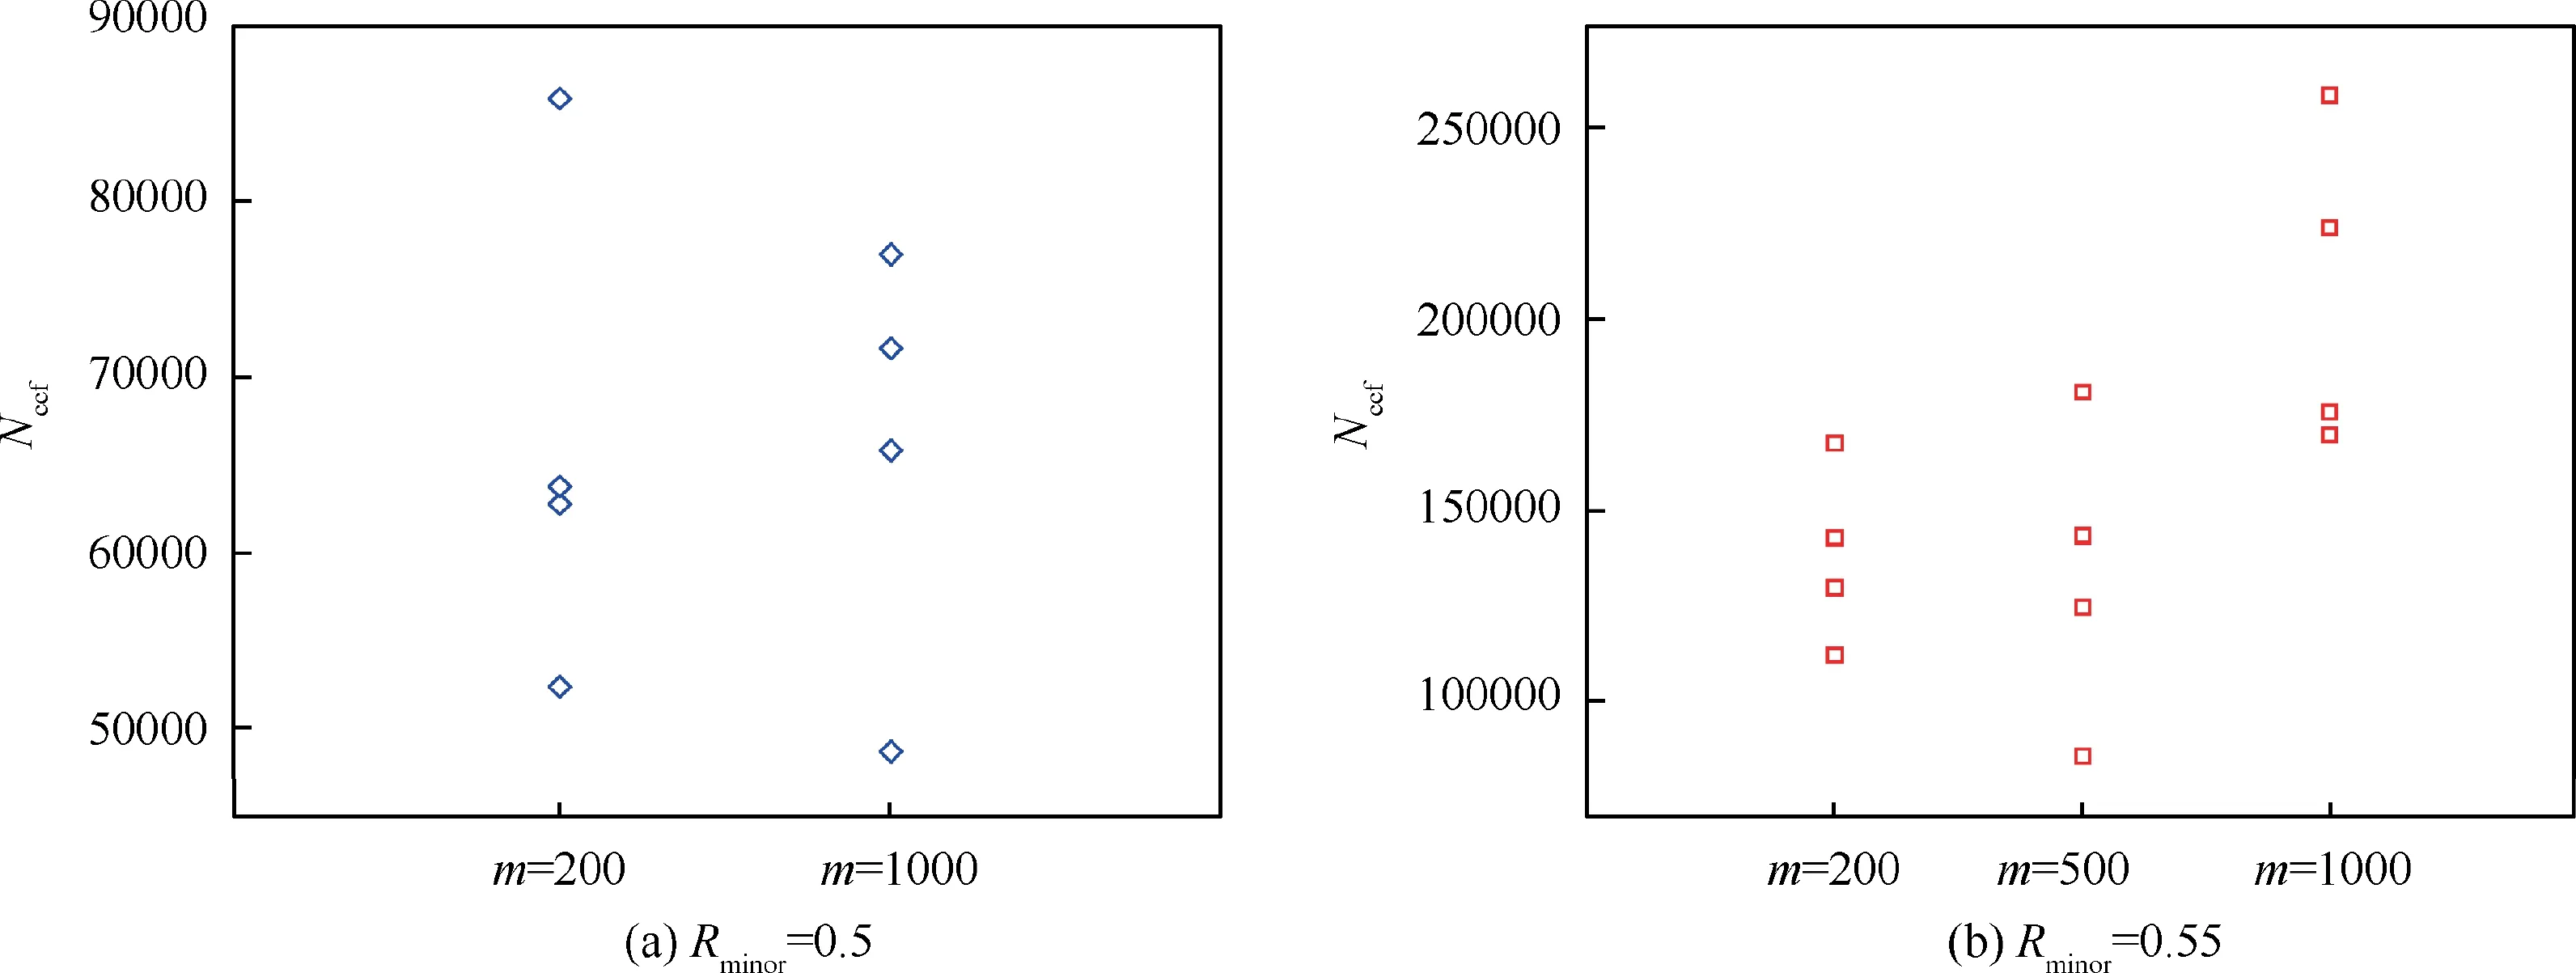
Fig. 8 CCF life with high-low cycle stress frequency ratio m.
The curves of the relative elongation ΔL with different high-low cycle stress frequency ratio m under the condition of σmajor=800 MPa are drawn in Fig. 9. The analysis shows that the sum of the damage caused by high cycle loads in each cycle block decreases with the decrease of high-low cycle stress frequency ratio m.
In conclusion, the high-low cycle stress frequency ratio m has a significant effect on the CCF life.The sum of the damage caused by high cycle loads in each cycle block decreases with the decrease of m. However, the increase of the number of low cycle loads caused by the decrease of m will have a negative influence on the CCF life. The CCF life under the combination of two factors shows a downward trend, but the cumulative damage of CCF is not a simple linear sum of high and low cycle loads.
4. Fatigue life prediction
4.1. Prediction results and analysis of linear cumulative damage model
For combined low and high cycle loads, the linear cumulative damage model38can be expressed as follows:

where Nbis the number of cycle blocks, Nfjis the number of cycles to failure, njis the number of loading cycles, D is the cumulative damage, mjis the number of loading cycles of HCF for the j-th level, Nhcf,jis the number of cycles to failure of HCF for the j-th level, and Nlcf,jis the number of cycles to failure of LCF at the given combined cycle block for the j-th level.
When the amplitude of CCF load spectrum is constant,the number of CCF load blocks is as below,
where m is the high and low cycle stress frequency ratio, Nhcfand Nlcfare the number of cycles to failure of HCF and LCF respectively, which can be obtained from test results and fitted life curves in Section 3.
CCF life is:

The linear cumulative damage model is used to predict CCF life,taking the numbers of cycle blocks as predicting target. The CCF life test results and predictions with error analysis are listed in Table A4,and the data scattering zone of CCF life is drawn in Fig. 10. It can be seen from Fig. 10 that, near all data points are predicted within the region of±2 life factors by the linear cumulative damage model. The overall predictions are larger than test results, which may be dangerous for engineering application.When the high-low cycle stress frequency ratio m ≤500, the prediction accuracy of the model is much higher, all predictions lie within the range of±1.35 life factors and the maximum error is 27.94%.
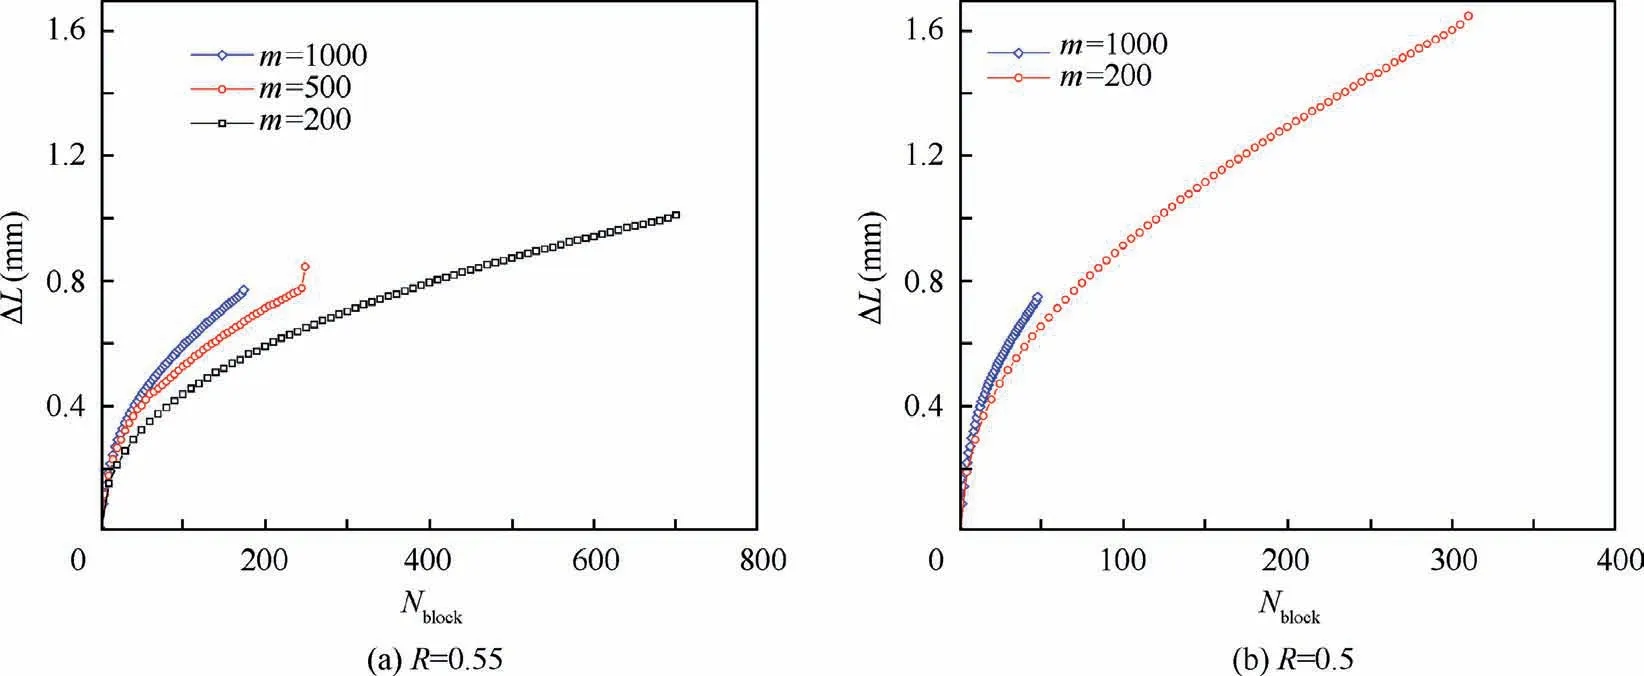
Fig. 9 Curve of relative elongation ΔL (σmajor=800 MPa).
4.2. Prediction results and analysis of nonlinear cumulative damage model
It can be seen from the analysis of Section 3 that the high-low cycle stress frequency ratio m and the strain amplitude have great influences on the CCF life. Based on the analysis of the CCF test results of structural steel, nickel base alloy and aluminium alloy, Tpyфикoв and Кoвaльчyк29–30developed the estimation equation of the CCF cycle block number Nb,ccfexpressed by the LCF life,which is called the nonlinear cumulative damage model,

where Nlcfis the number of cycles to failure of LCF, m is the high and low cycle stress frequency ratio,γ is material constant(γ=1.6 for TC11 in this paper29),σa,hcfis the high cycle stress amplitude, σccfis the combined cycle stress amplitude.
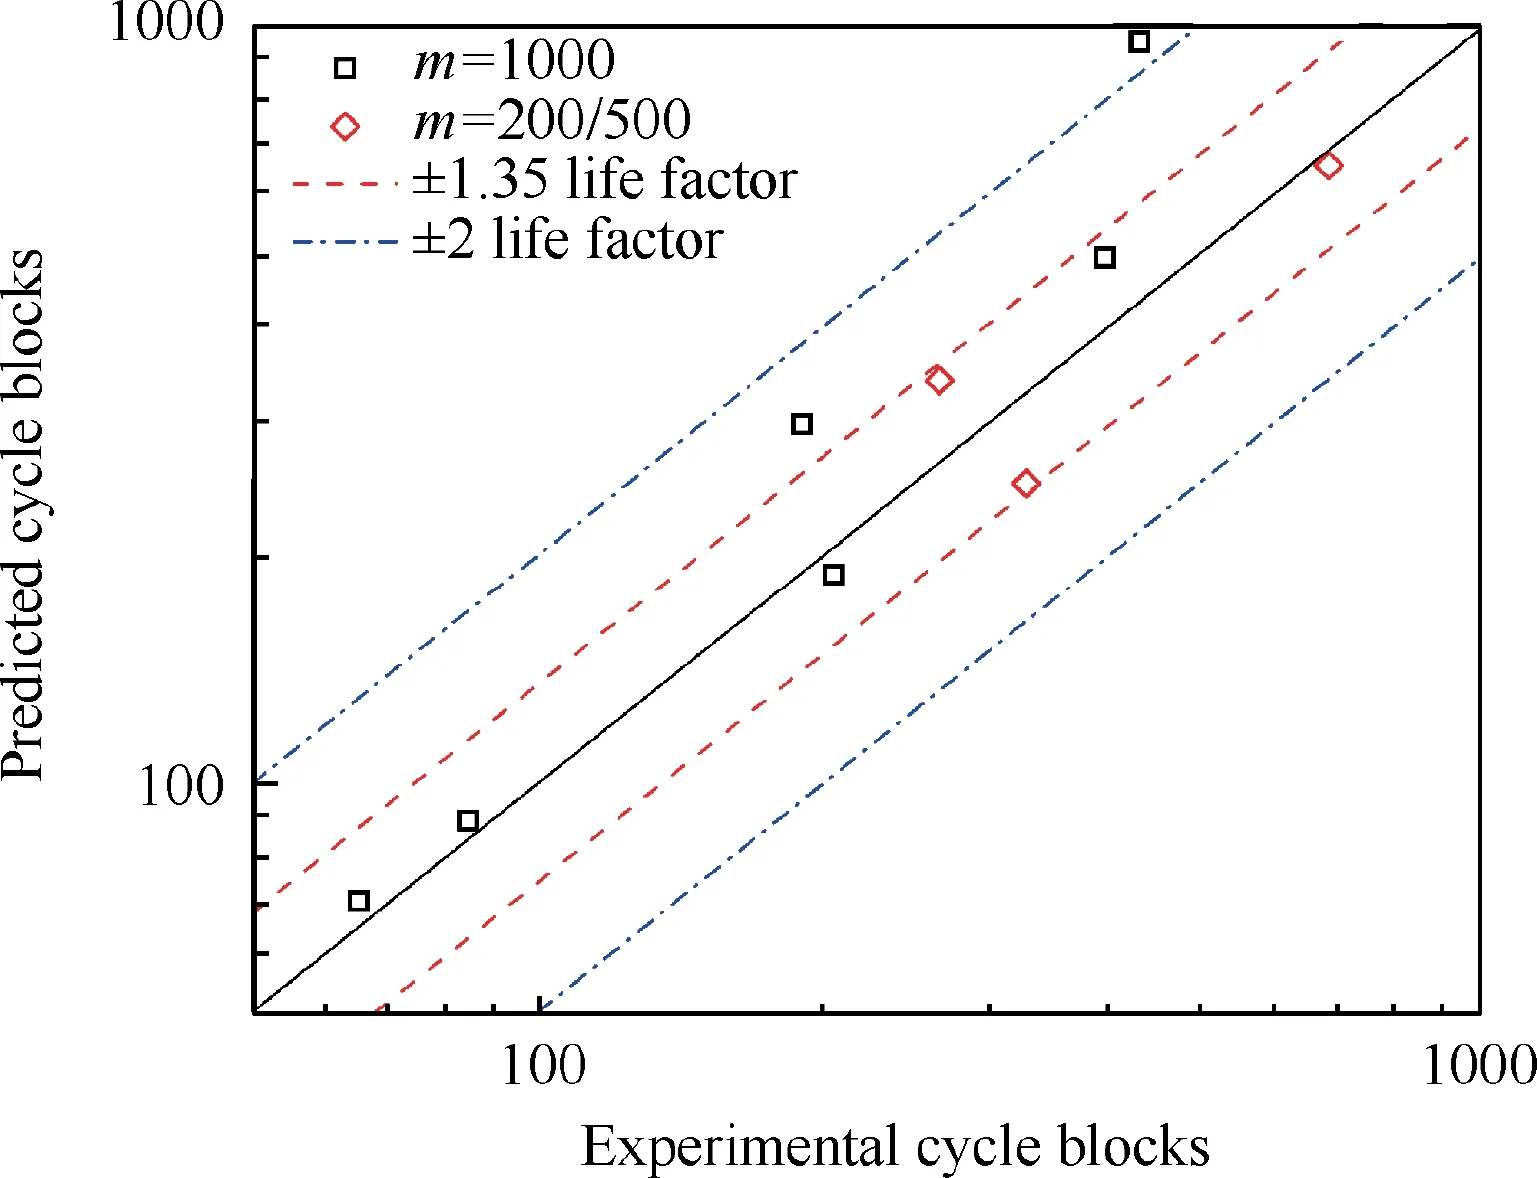
Fig.10 Data scattering zone of CCF life predicted by the linear cumulative damage model.
The CCF life test results and predictions by nonlinear cumulative damage model withe error analysis are listed in Table A5. The data scattering zone of CCF life is graphed,as shown in Fig.11.It can be seen from Fig.11 that most predicted values are lower than test values, so the predictions are safer in engineering application. Different from the linear cumulative damage model, the predicting accuracy of nonlinear cumulative damage model is much higher when the highlow cycle stress frequency ratio m ≥500, nearly all predicted points (except one) lie within the region of±1.5 life factors and the maximum error is 33.18%(except one 89.20%).However, when m=200, the predicting error is great (the minimum error is 63.31%) and the predicted values of CCF life are obviously lower than test values. Therefore, the nonlinear cumulative damage model can be used to predict the CCF life with large high-low cycle stress frequency ratio (m ≥500).
4.3. Predictions and analyses based on modified nonlinear cumulative damage model
In order to improve the prediction accuracy of nonlinear cumulative damage model, a correction term is added to Eq.(15)considering the ratio between the high cycle average stress σmajorand the material yield limit σp,0.2, and the following equation is obtained.
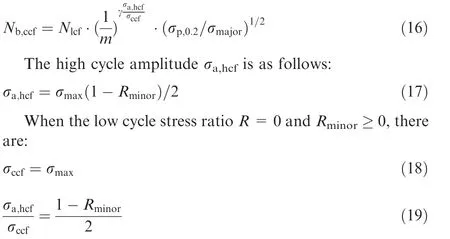
The analyses in Section 3 and 4.1 indicate that,the CCF life is related to the stress ratio Rminorand the average stress σmajorof the high cycle load in the combined cycle. Considering the relationships among the high cycle average stress σmajor, the yield limit σp,0.2and the strength limit σbof the material, the γ is fitted in Eq. (16) by reference to the equivalent life graph,

where α is a material coefficient which can be fitted according to experimental data.
Therefore, Eq. (16) can be expressed as:

Two groups of test results at σmajor=800 MPa and 750 MPa (Rminor=0.5) were used to fit α, achieving α=0.35 and 0.62 respectively. Taking the average value and simplify α as 0.5,then the modified CCF life prediction model is as follows,
where σp,0.2=998.53 MPa, σb=1083.04 MPa.
The values predicted by modified nonlinear cumulative damage model as well as their error analyses are listed in Table A6. The data scattering zone of CCF life is shown in Fig.12.It can be seen from the data scattering zone that most predicted values are lower than test values, which means safer in engineering application.Like the nonlinear cumulative damage model, the prediction accuracy of the modified model is high when the high-low cycle stress frequency ratio m ≥500(the maximum error is 32.91%), low when m=200 (the minimum error is 62.91%).
4.4. Comparison of prediction errors of three damage models
The fatigue life predictions’ error analyses of three models are shown in Table A7,and the data scattering zone is graphed in Fig.13.It can be seen that the prediction accuracy of the modified nonlinear cumulative damage model proposed in this paper has been obviously improved as compared with the other two models when the high-low cycle stress frequency ratio m is large (m ≥500). Moreover, most of the values predicted by the modified model are lower than the test values,which is safer in engineering application.
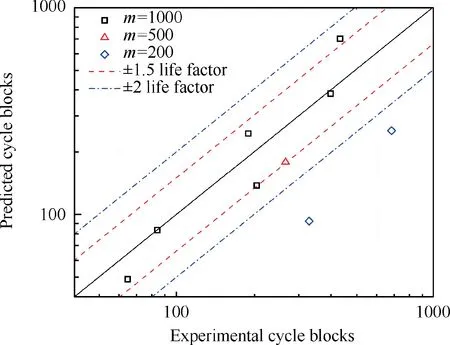
Fig. 12 Data scattering zone of CCF life predicted by modified nonlinear cumulative damage model.
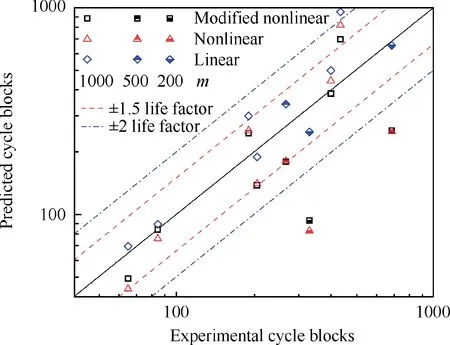
Fig. 13 Data scattering zone of CCF life predicted by three different models.

Fig. 14 Cumulative damage in a single CCF block.
However, when the high-low cycle stress frequency ratio m is small (m<500), the accuracy of modified nonlinear cumulative damage model is still lower than that of linear cumulative damage model. It is shown that when the high-low cycle stress frequency ratio m is small, the number of high cycles in a single CCF block is less, and the fatigue process of CCF is more accurately described by linear cumulative damage model; when the high-low cycle stress frequency ratio m is large,the number of high cycles in a single CCF block is more,and the fatigue process of CCF needs to be described by nonlinear cumulative damage model.

Table 5 Supplementary CCF test parameters and results.
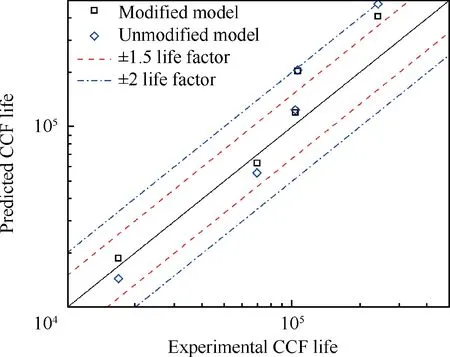
Fig. 15 Data scattering zone of supplementary CCF life predicted by modified and unmodified models.
According to Eqs. (14), (15) and (22), the relationship between the cumulative damage in a single CCF block and the high-low cycle stress frequency ratio m is plotted,as shown in Fig.14.It can be found that the cumulative damage caused by linear cumulative damage model in a single CCF block is smaller when m is small, and increases linearly; while the nonlinear cumulative damage model causes larger cumulative damage in a single CCF block when m is small,but with the further increase of m,the increment of cumulative damage in the block gradually decreases until it is smaller than that in the linear cumulative damage model (at about m=1750). The cumulative damage of the modified nonlinear cumulative damage model is slightly larger than that of the nonlinear model.
In order to further test the validity of the modified nonlinear cumulative damage model, supplemental CCF tests were carried out with m=1000, σmajor=660 MPa and 610 MPa respectively under different Rminorconditions.Test parameters and results are shown in Table 5.
The supplementary CCF life predicted by modified and unmodified nonlinear cumulative damage models discussed above are listed in Table A8, and the data scattering zone is graphed in Fig. 15. A similar conclusion can be obtained by analysing the data scattering zone graph that,the CCF life predicted by the modified model are more accurate than unmodified model and all data points are predicted within the region of±2 life factors when the high-low cycle stress frequency ratio is large (m=1000).
5. Conclusions
LCF, HCF and CCF tests have been carried out and the factors influencing CCF life discussed in this paper.The engineering application of both linear and nonlinear cumulative damage models on CCF life is analysed, and the nonlinear cumulative damage model is modified to improve its prediction accuracy. The conclusion can be drawn as follows.
(1) The amplitude of high cycle load and the high-low cycle stress frequency ratio m have a great influence on the CCF life. With the decrease of the amplitude (the increase of Rminor),the growth rate of the specimen elongation slows down, and the fatigue life increases gradually. With the decrease of m, the CCF life shows a downward trend, but the cumulative damage of CCF is not a simple linear sum of high and low cycle loads.
(2) The CCF life predicted by linear cumulative damage model tends to be overestimated, which is dangerous for engineering application; while the values predicted by nonlinear cumulative damage model tend to be underestimated, which is safe for engineering application.The prediction accuracy of linear cumulative damage model is higher when high-low cycle stress frequency ratio m ≤500, all cyclic lives lie within±1.35 scatter factor. In contrast, the prediction accuracy of nonlinear cumulative damage model is higher when high-low cycle stress frequency ratio m ≥500,all except one cyclic lives lie within±1.5 scatter factor. The CCF life predicted by modified nonlinear cumulative damage model are more accurate than those of the unmodified model,and the prediction accuracy is also higher when the high-low cycle stress frequency ratio is large (m ≥500),just like the unmodified model.
Declaration of Competing Interest
The authors declare that they have no known competing financial interests or personal relationships that could have appeared to influence the work reported in this paper.
Acknowledgement
This study was co-supported by the National Natural Science Foundation of China (No. 51301090).
Appendix A
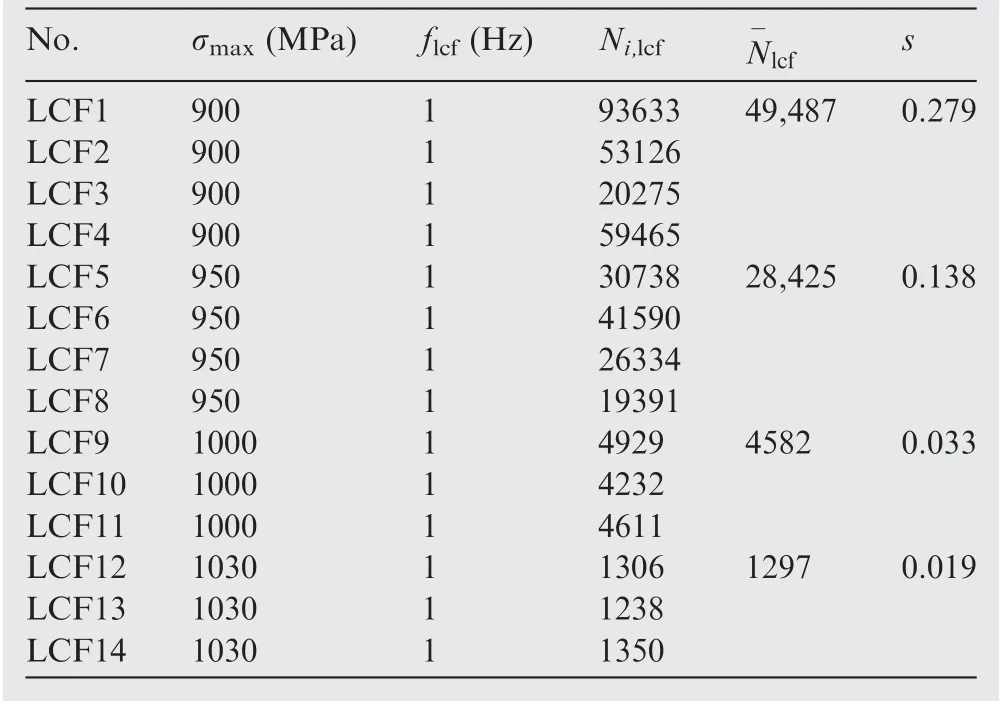
Table A1 LCF test parameters and results.
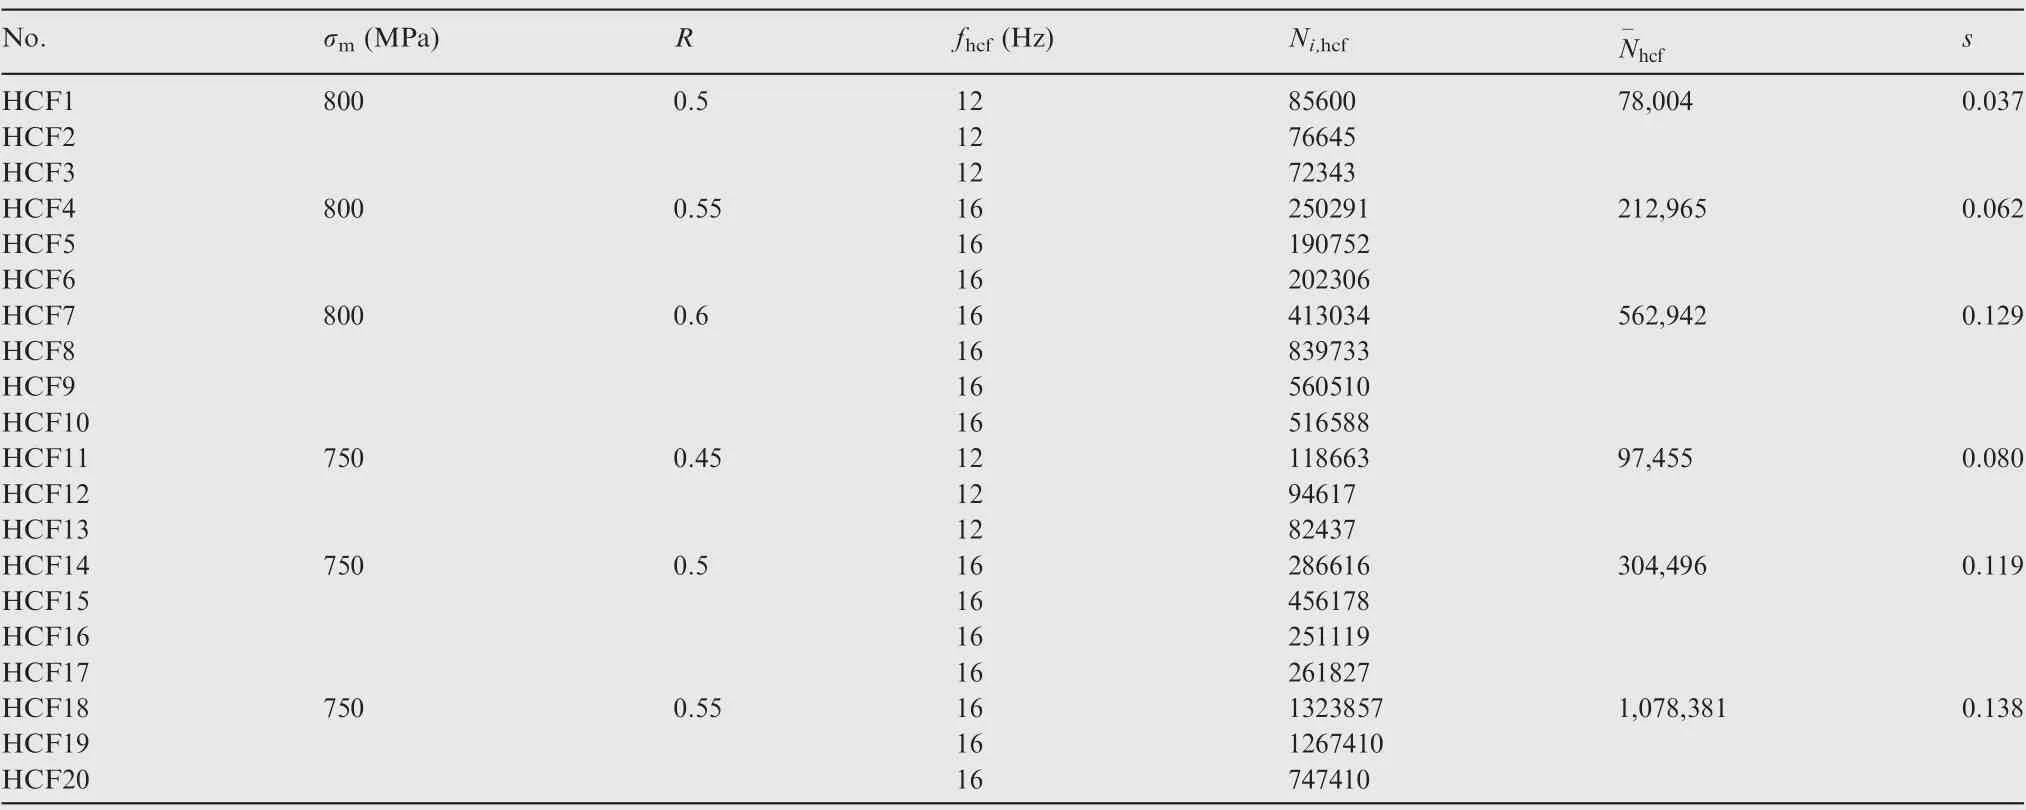
Table A2 HCF test parameters and results.
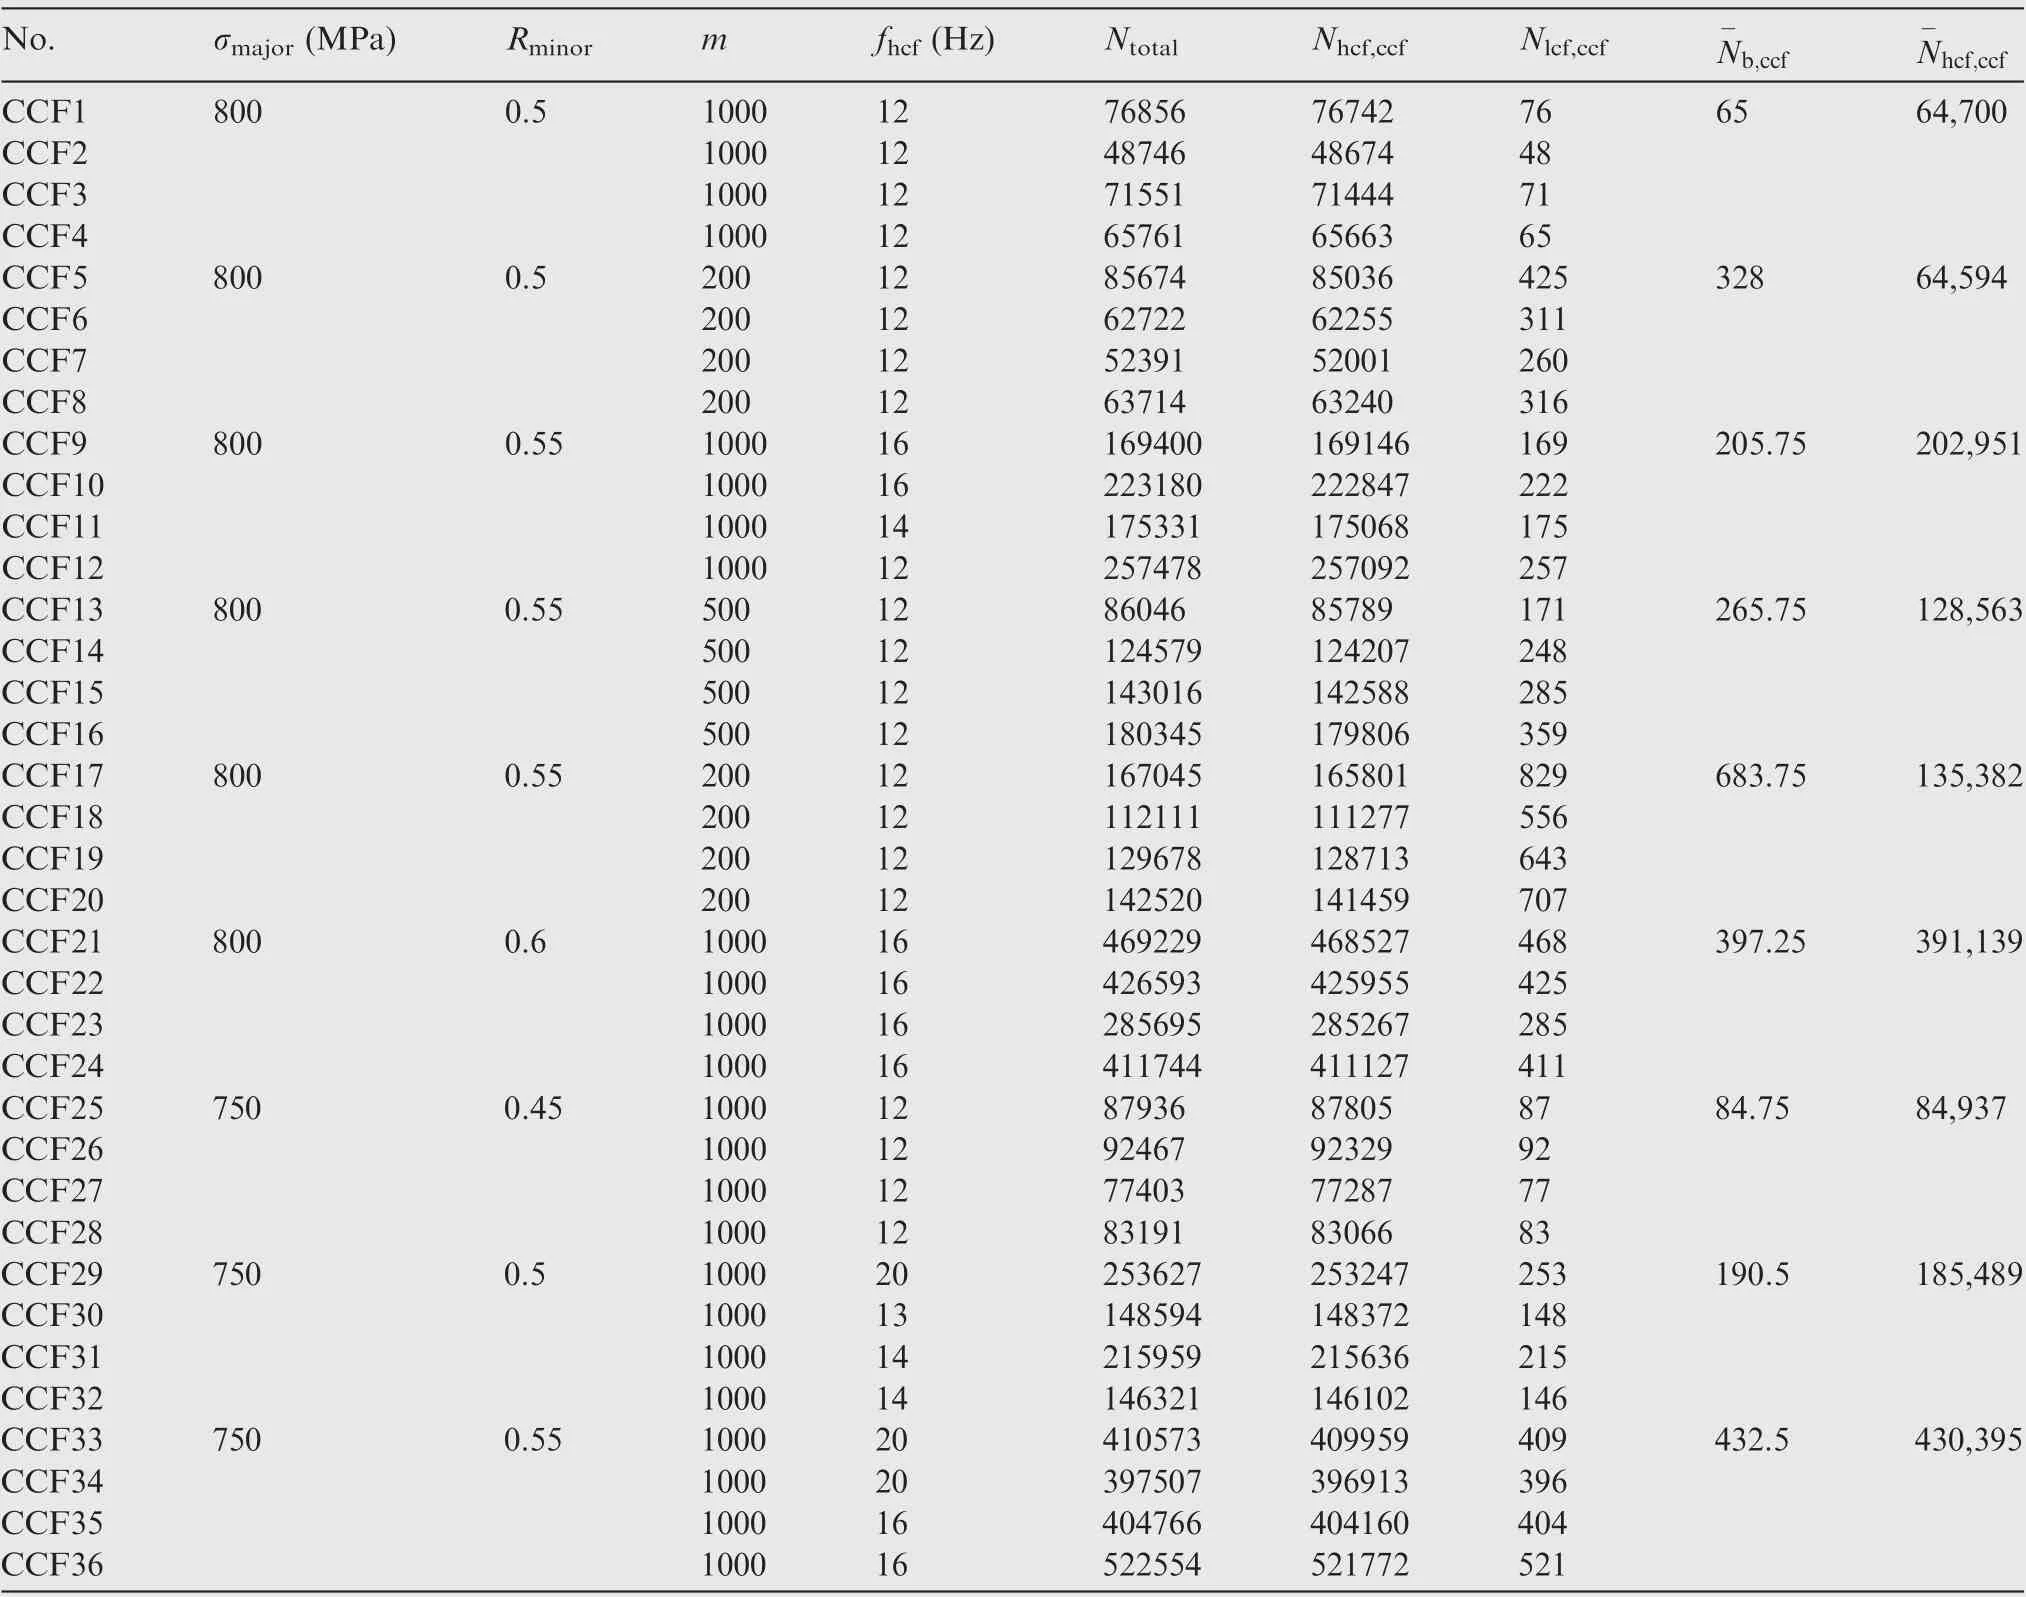
Table A3 CCF test parameters and results.

Table A4 CCF life predicted by linear cumulative damage model.

Table A5 CCF life predicted by nonlinear cumulative damage model.

Table A6 CCF life predicted by modified nonlinear cumulative damage model.

Table A7 CCF life predicted by three different models.

Table A8 Supplementary CCF life predicted by modified and unmodified models.
 CHINESE JOURNAL OF AERONAUTICS2021年7期
- CHINESE JOURNAL OF AERONAUTICS的其它文章
- Integrated batteries layout and structural topology optimization for a solar-powered drone
- Polynomial networks based adaptive attitude tracking control for NSVs with input constraints and stochastic noises
- Morphing wing flaps for large civil aircraft:Evolution of a smart technology across the Clean Sky program
- Review on bio-inspired flight systems and bionic aerodynamics
- SARISTU:Adaptive Trailing Edge Device(ATED)design process review
- Continuous morphing trailing-edge wing concept based on multi-stable nanomaterial
