Modeling bending behavior of shape memory alloy wire-reinforced composites: Semi-analytical model and finite element analysis
Nguyen Van VIET, Wael ZAKI
Department of Mechanical Engineering, Khalifa University of Science and Technology, Abu Dhabi, United Arab Emirates
KEYWORDS Bending;Finite element analysis;Modelling;Phase transformation;Shape memory alloy reinforced composite;Superelasticity
Abstract In this study,we propose a novel and simple exact semi-analytical model for superelastic Shape Memory Alloy (SMA) wire reinforced composites subjected to bending loads. In order to study the mechanical response of the composite during loading/unloading, a Representative Volume Element (RVE) is extracted to examine the bending response of the composite. Analytical moment–curvature, and shear force-shear strain relations are derived based on a 3-Dimensional(3D)thermomechanical SMA model and Timoshenko beam theory.The composite Simpson’s rule is adopted to numerically solve the exact analytical moment–curvature and shear force-shear strain relationships. Results including the moment–curvature response, axial stress distribution along the vertical and longitudinal directions,martensite volume fraction,and the tip deflection are reported and validated against 3D finite element simulations. The influence of temperature, martensite volume fraction distribution, and matrix stiffness on the mechanical performance of the composite is also investigated.In particular,the composite is found to behave superelastically under certain conditions of temperature, SMA volume fraction, and elastic stiffness of the matrix. Such behavior is advantageous in applications requiring large recoverable strains or high energy dissipation density.©2021 Chinese Society of Aeronautics and Astronautics.Production and hosting by Elsevier Ltd.This is an open access article under the CC BY-NC-ND license(http://creativecommons.org/licenses/by-nc-nd/4.0/).
1. Introduction
Shape Memory Alloys(SMAs)possess exceptional mechanical properties1,2including the superelastic behavior and the shape memory effect. Their superelasticity provides large deformation (up to 10%) and vibrational damping capability. The shape memory effect is an ability to change internal material properties based on thermal and mechanical loads.In addition to common properties of composites such as lightweight and low cost, embedding SMAs within a composite is inevitable in near future to bring novel properties and improve the performance of composites in practical applications. It has been reported that SMA wire reinforced composites were able to adapt and control shapes,1repair damage,3control the vibrational properties,4–7sense8and absorb impact energy through superelastic deformation during service.9Furthermore,NASA has recently been implementing a project to apply SMAs and SMA based composites in spacecraft applications.
Due to these outstanding properties, modelling of SMA wire embedded composites has attracted great attention from numerous scholars exploring their dynamic and static characteristics. Sun and Sun10developed a bending model of a composite beam with eccentrically embedded SMA wires based on the thermo-mechanical constitutive relation of a SMA with an assumption that the strain in SMA is independent with martensite volume fraction. Subsequently, the deflectiontemperature relation upon heating and cooling has been analyzed for the SMA-reinforced composite beam. Naghashian et al.11proposed a closed form analytical model to study the curvature achievable during actuation, in which, martensite fraction during transformation was fixed as a value closer to unity. The curvature-stress–temperature relation for actuator was presented for the SMA-reinforced composite beam.Zhang and Zhao12introduced a constitutive relation of the arbitrarily-embedded-SMA composite beam with an assumption of constant elastic modulus of SMA,which is independent on martensite volume fraction. Numerical methods were applied to investigate the behavior of SMA composite under static and dynamical load.In addition,the post-buckling analysis for the composite is also presented.Zhu et al.13developed a three-dimensional constitutive model of composites reinforced by SMA wires. A user subroutine VUMAT code was programmed,and then implemented into ABAQUS to investigate the self-healing effects in pre-cracked composites. Zhu et al.13reported that, the SMA reinforcements provide stronger shape recovery ability than other materials that are incapable of phase transformation. The softening property of the metal matrix and the pre-strain in SMA are also beneficial to help crack closure and healing. Pinto and Meo14experimentally investigated the SMA wire embedded composites under low-velocity impact to analyze their response in comparison with a traditional composite. Pinto and Meo14reported that,the SMA wires embedded in the laminate are able to absorb a large amount of energy, reducing the extension of the internal delamination. Fahimi et al.15proposed a novel and robust semi-analytical model to study the bending behavior of SMA composite beams based on Brinson’s model for a Euler-Bernoulli beam. The developed model is applicable for the design and optimization of structures consisting of SMA components under bending.Doeva et al.16presented an exact analytical model for SMA-reinforced composite beams under static bending based on Timoshenko theory. The Chebyshev collocation model was used to verify the soundness of the developed model. Viet et al.17developed a new analytical model to describe the response of laminated composite beams consisting of one SMA layer and one functionally graded material layer. The tension–compression asymmetric behavior in SMAs was taken into account in the model. The influences of the functionally graded material gradient index and temperature on the overall beam behavior were investigated. The results obtained using the model were in good agreement with three-dimensional finite element simulations of the same beam.Huang et al.18studied the vibration behavior of SMA reinforced composites. Kirchhoff’s theory and a constitutive SMA model were employed to derive the stress–strain formulation of single-layer composite plates. The work presented a method to prevent the resonance of structures in SMAreinforced composite laminates. The vibration of SMA wire reinforced composite is also a subject of numerous researches.19–21
Although, many contributions on studying SMA composites were made,there are some limitations of these models such as the assumption of constant stiffness during the loading/unloading process. Furthermore, the nonlinear relationship of axial stress with respect to martensite volume fraction and distance to neutral plane for SMA is also ignored during forward and reverse phase transformation. Bending model is based on Euler-Bernoulli theory. These limitations are addressed in the present work developing the analytical model for a superelastic SMA wire embedded composite cantilever beam subjected to a loading–unloading cycle. The analytical model is built based on Zaki-Moumni’s (ZM’s) 3-Dimensional (3D) model22for SMAs and Timoshenko theory considering a complete loading–unloading cycle. Wherein nonlinear stress with respect to distance and martensite volume fraction, and influence of martensite phase evolution on elastic modulus are considered.The well-known integral numerical solution as composite Simpson’s rule is used to fully resolve the analytically derived equations of moment and shear force.The accurate numerical results are validated against 3D Finite Element Analyses(FEA) simulations for the same boundary value problem.
2. Model development
2.1. Stress–strain relation
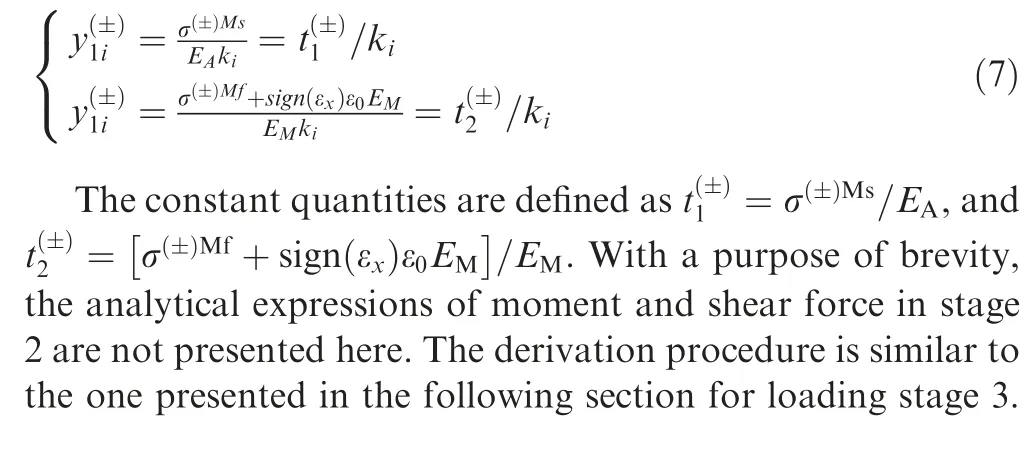
In this work, the Representative Volume Element (RVE) consists of a single wire-reinforced beam to simplify the analysis,which is already quite involved analytically. Shearing at the interface of two adjoining RVEs is disregarded to this effect,much like in the case of pure bending. An RVE is represented for entire composite as shown in Fig. 1(b). Considering that,the SMA circular wire has length L, radius r in a Cartesian coordinate system(x,y,η).Coordinates y and η are in vertical and transverse directions respectively,and x lies on the centerline axis of un-deformed square RVE(along its length).Coordinate origin point (0,0,0) is located at the center of the RVE,and belongs to clamped cross section as shown in Fig. 1(b).The RVE having a length L, a width hcand a height hcsubjected to a transverse tip load as shown in Fig.1 can be considered as 1-Dimensional (1D) problem.23In addition, this work considers an elastic regime of matrix material. The governing equations in this case are obtained by specializing those of the multiaxial ZM’s model22for SMAs to the uniaxial case.The derivation procedure, detailed in Ref.22, is based on the derivation of state equations from a Helmholtz free energy potential, and the proposition of thermodynamically consistent loading conditions and flow rules for the dissipative variables. By employing these considerations, and after some mathematic manipulations, the yielding function in 1D state associated with direct and reverse phase transition for 0< z<1 (z is martensite volume faction) derived from ZM’s thermomechanical model of SMAs22is given by
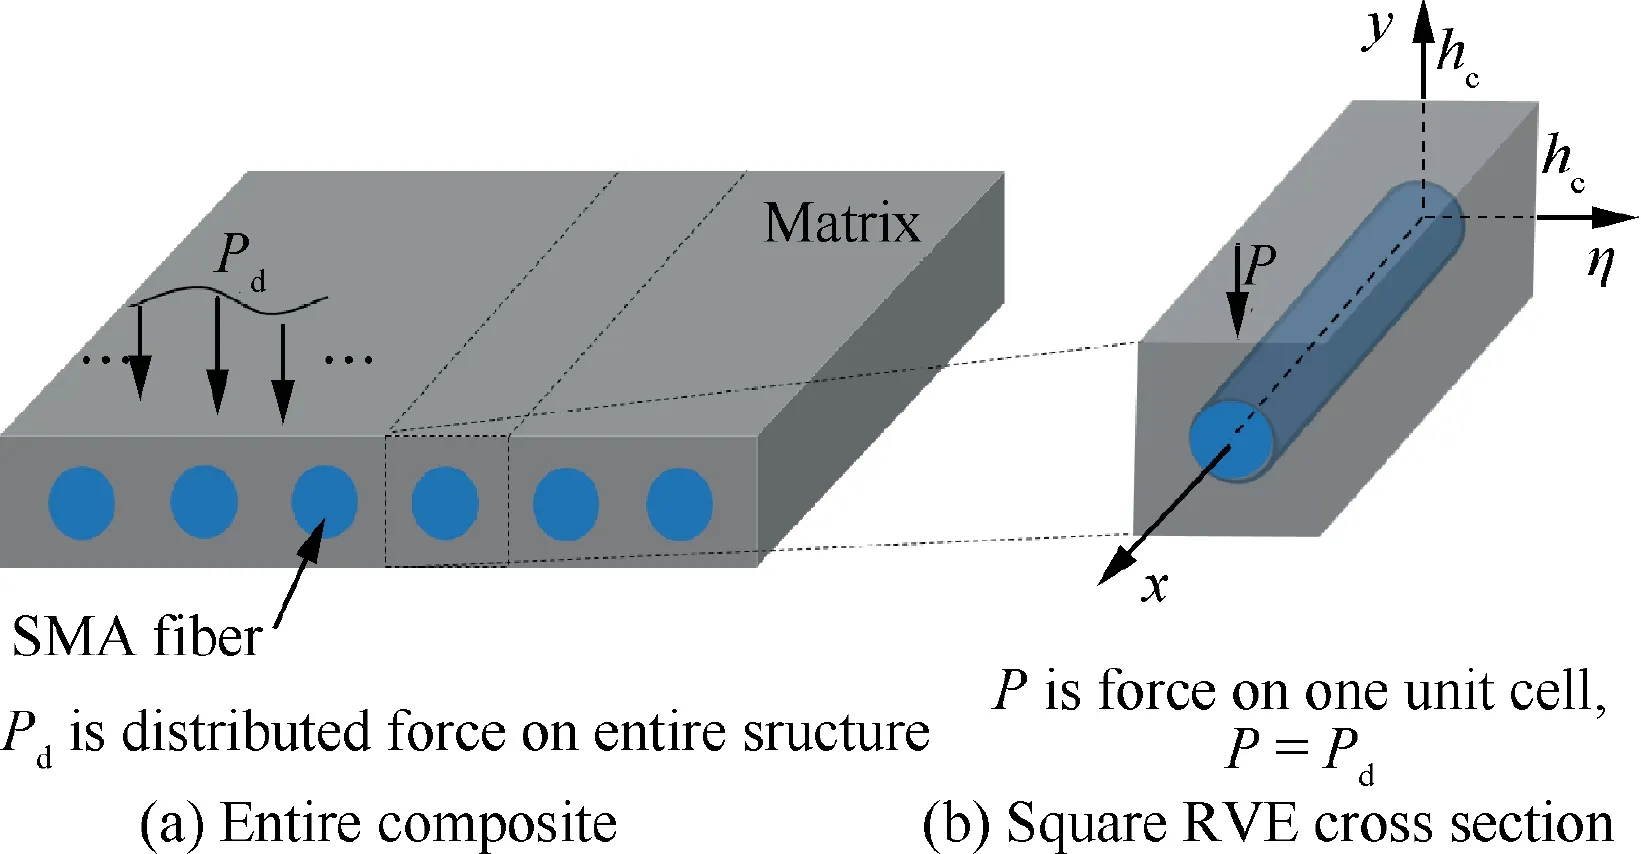
Fig. 1 Configuration of SMA reinforced composite.
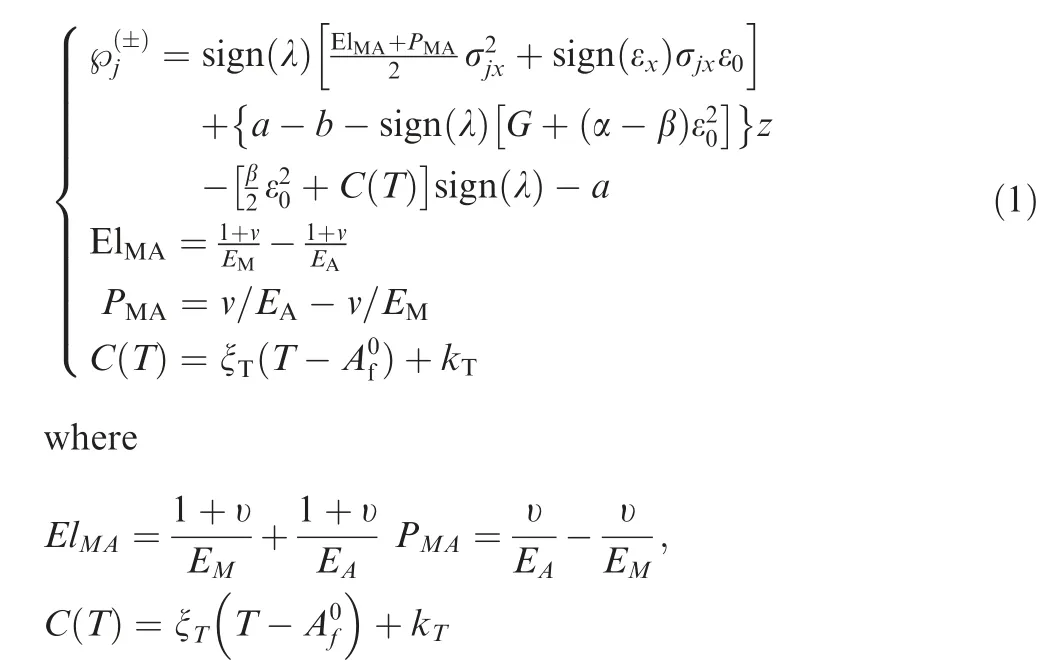
where sign(λ)=1 and sign(λ)=–1 are for loading and unloading, respectively; sign(εx)=1 and sign(εx)=–1 are for tension and compression, respectively; λ is time derivative of martensite volume fraction; εxis strain along x direction;σjxis stress along x direction,subscript j is either‘‘l”for loading or‘‘u”for unloading;ε0is maximum transformation strain;a,b,G,β,and α are material constants found by experiment;22C(T)is a heat density associated with phase change;EM,EA,v,T,ξT,Af0,and kTare martensite elastic modulus,austenite elastic modulus, Poisson’s ratio for both phases, ambient temperature,controller of phase change yield stress,the reverse phase change finish temperature under zero stress,and heat density C(T)at T=Af0,respectively.Note that the effective elastic modulus Eeffof the SMA is 1/Eeff=(1-z)/EA+ z/EM, because of the assumption of a model in series in deriving the original 3D ZM’s22model.The present work investigates the superelasticity of a Functionally Graded Materials (FGM)/SMA composite cantilever beam under bending at a temperature T >Af0. Recently, ZM’s model has been adopted and extended for advanced issues of SMAs,24–26including tensilecompressive asymmetry and plasticity, which are not considered here.In this work,the temperature is treated as a parameter, which is a common approach when the research focus is on the superelastic behavior of the SMA (see for example in Ref.27). Accounting for variable and possibly non-uniform temperature variations in the SMA component is possible using a model that considers thermomechanical coupling,28but this is outside the scope of the present paper. To obtain the stress as an explicit function of strain only, the martensite volume fraction is first determined in terms of stress and strain from stress-strain-martensite volume fraction relationship,then plugged into the loading condition in Eq. (1) following the derivation procedure in Ref.22.Finally,we obtain a general cubic equation of 1D axial stresses in terms of axial strain during loading/unloading as

where
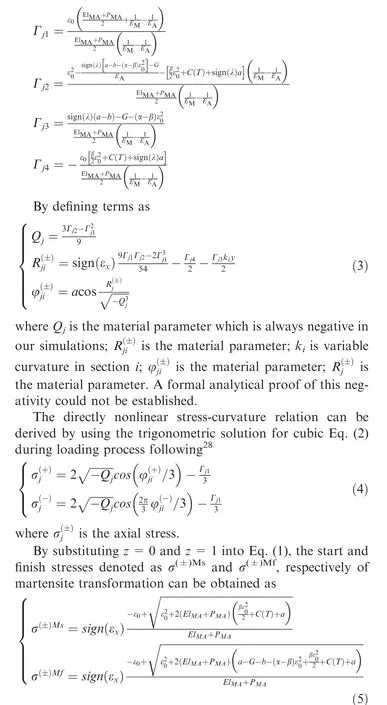
After yielding the nonlinear stress–strain relation, the closed form of moment and shear force will be derived in Section 2.2. It is noted that the stress function in Eq. (2) is independent from the martensite volume fraction z, which makes Eqs. (3)–(5) independent of z as well.
2.2. Closed moment–curvature and shear force-shear strain relations
2.2.1. Loading case
During loading, the SMA experiences three stages:28
Stage 1 There is no matensite formation in the SMA wire.
Stage 2 Martensite transformation occurs but not complete,that consists of austenite and a composite of austenite and martensite phases.
Stage 3 Complete martensite transformation is established resulting in three material phases in SMA element involving the austenite in slight blue, mixture phase in pink, and martensite in red.
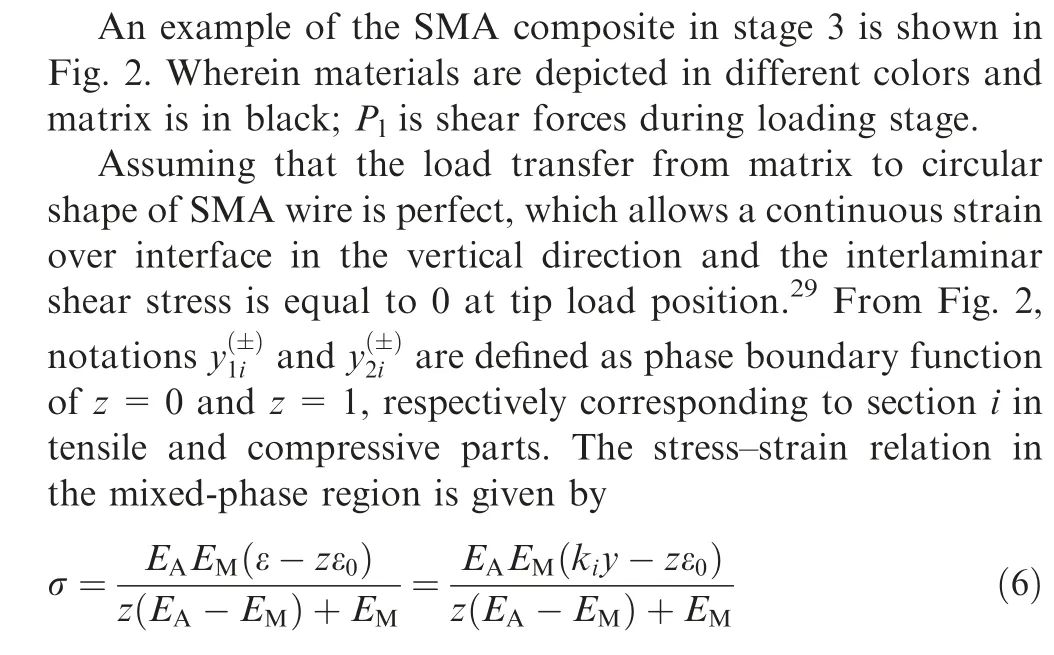
where σ is stress; ε is strain.
At the boundary between fully austenitic and mixed-phase regions, the volume fraction of martensite is 0 and the stress is equal to the known martensite start stress σ(±)Ms. Likewise,at the boundary between fully martensitic and mixed-phase regions, the martensite volume fraction is equal to 1 and the stress is equal to the known martensite finish stress σ(±)Ms.Plugging into Eq. (1),the expressions of the boundary coordinates are obtained:
Stage 3
By defining notations dAsand dAm(see Fig. 3(a)) as the infinitesimal areas occupying by SMA and matrix respectively,total infinitesimal area can be computed as dA=dAs+dAmbounded by red line indicated in Fig. 3(a).
It can be seen from Fig. 3(a) that the width and height of square RVE are hc=2(w1+r). Mathematically, dAsand dAmare

The RVE curvature is assumed to be unchanged along the width direction. In order to make the assumption workable,the ratio of extra matrix width to SMA wire radius is supposed to be w1/r<2. The sign convention is assumed that the positive moment is anticlockwise direction. The curvatures for onsets of stages 2 and 3 denoted as k1maxand k2maxrespectively are given as

To facilitate the derivation of the moment–curvature relationship, the cross section in Section 3 is divided into nine sub-regions (see Fig. 3(b)), the total moment is equal to sum of moment induced by resultant stresses on these subregions. By defining Mliand kias the moment and curvature variations, respectively, in section i, considering symmetric regions for r1and r2, the moment–curvature relationship of stage 3 can be expressed as
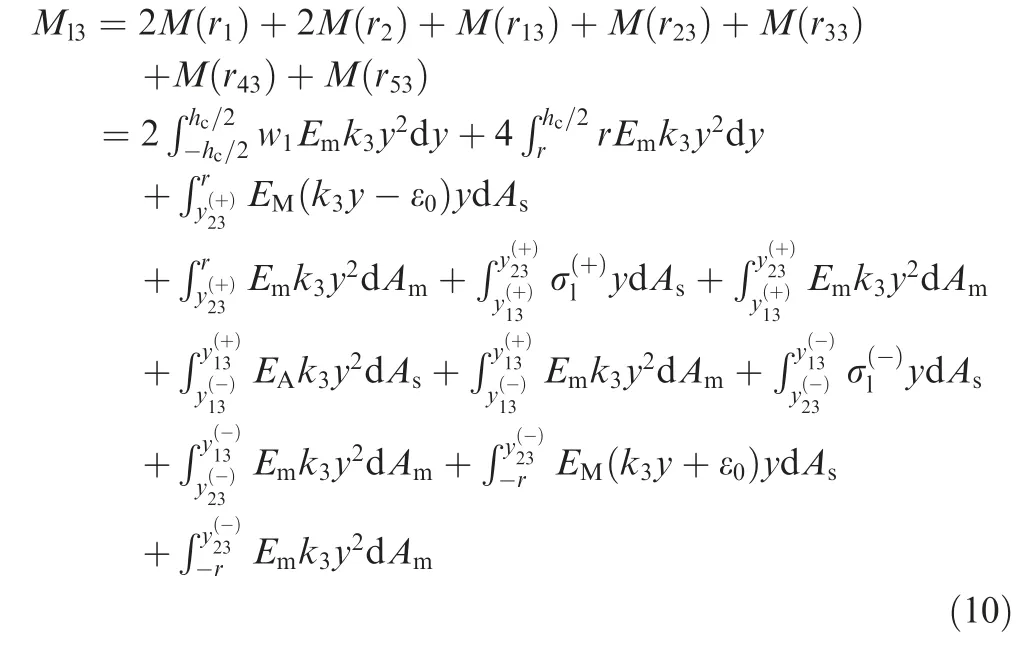
where M(⋅) is the moment function; Emis the elastic modulus of matrix.
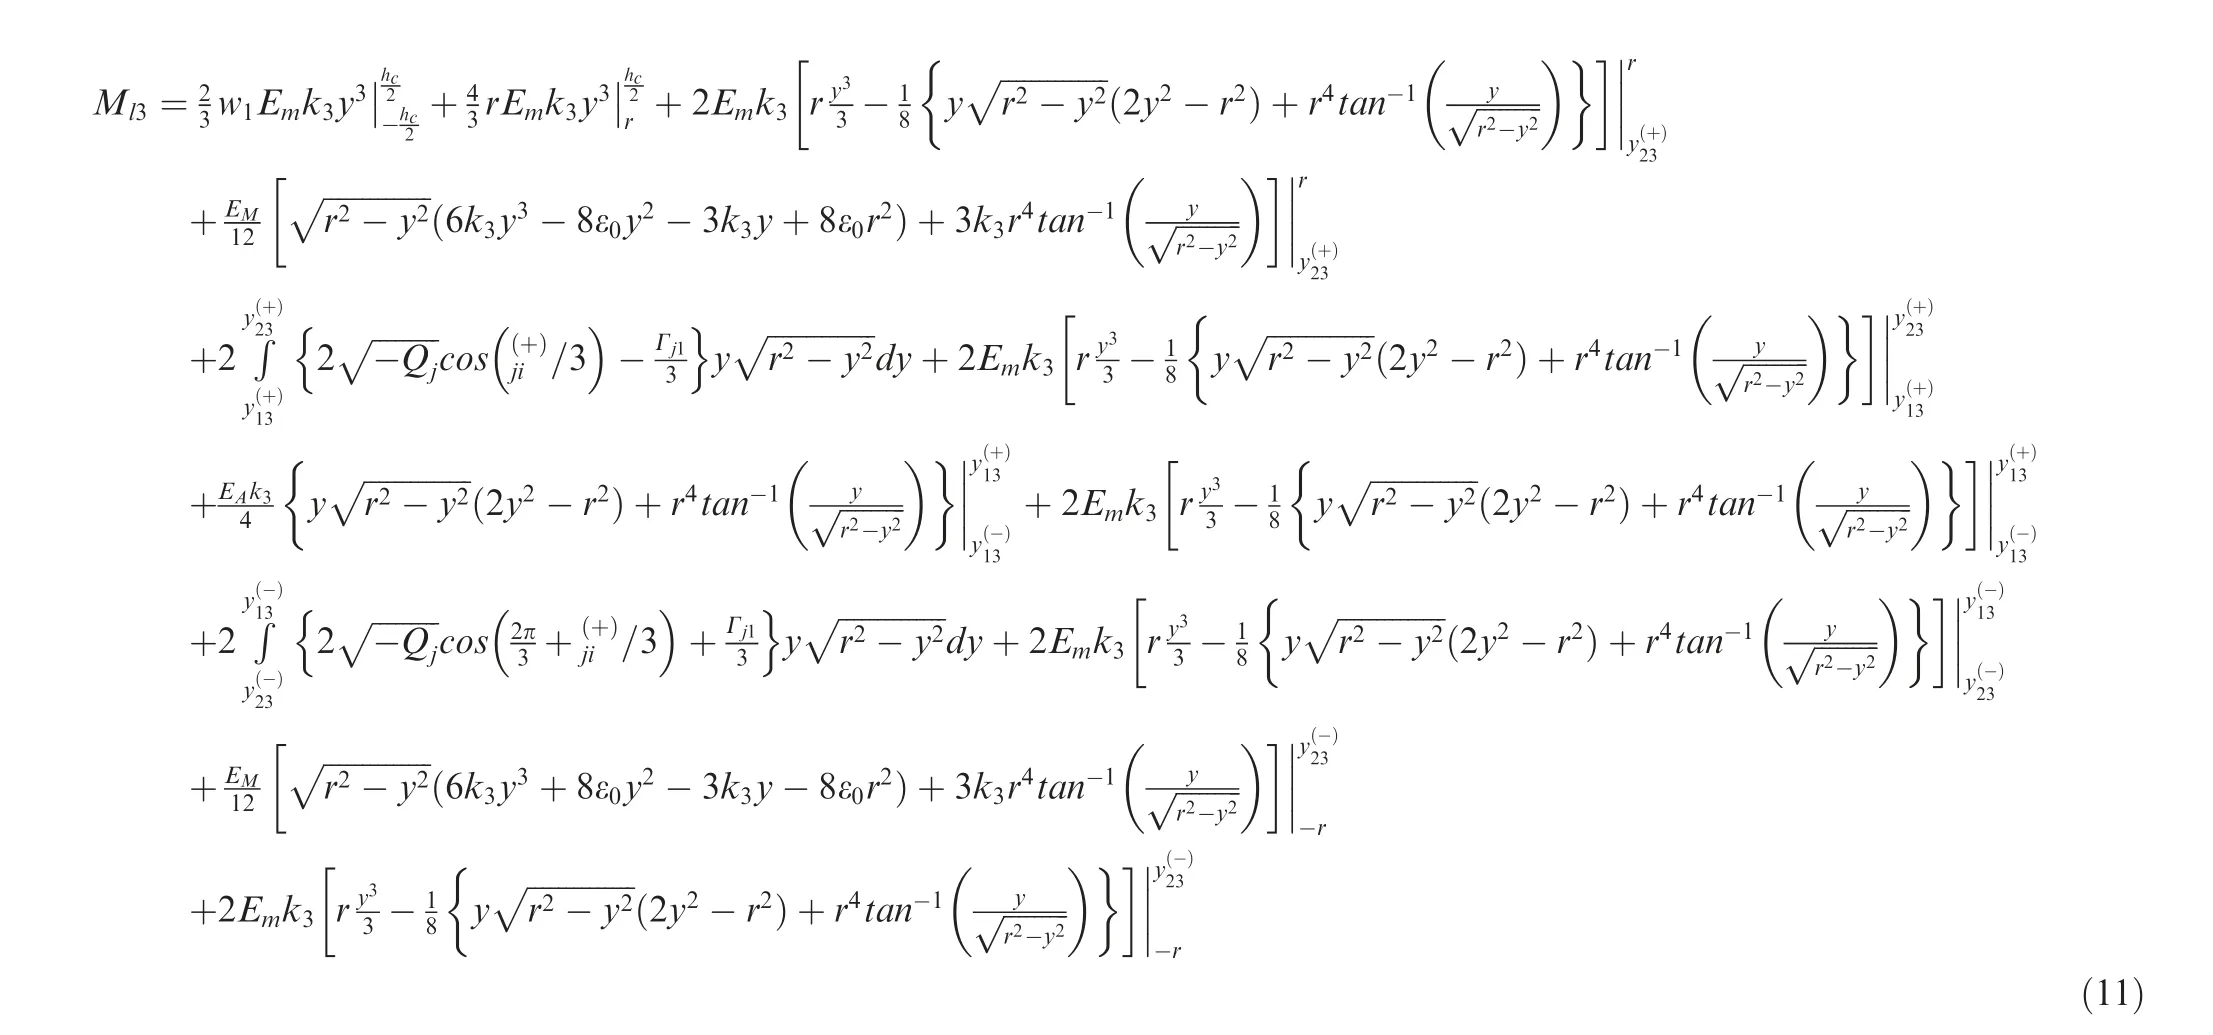
Substituting Eqs. (4) and (7) into Eq. (10) together with some simple mathematic manipulations, the expanded moment–curvature relationship is
In the study, the composite Simpson’s rule is used to find the accurate solution of Eq. (11) as follows:
Let us define two new functions of Section 3 following
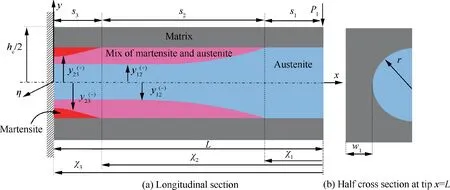
Fig. 2 Interior material structure of a half RVE at stage 3.
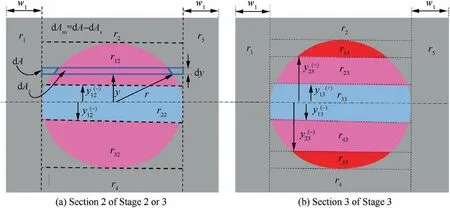
Fig. 3 Internal material response of RVE.


The approximation errors, and relative errors of moment–curvature relation solution of s3are30
Shear force acting on the cross section of s3is equal to total of shear forces acting on sub-regions as
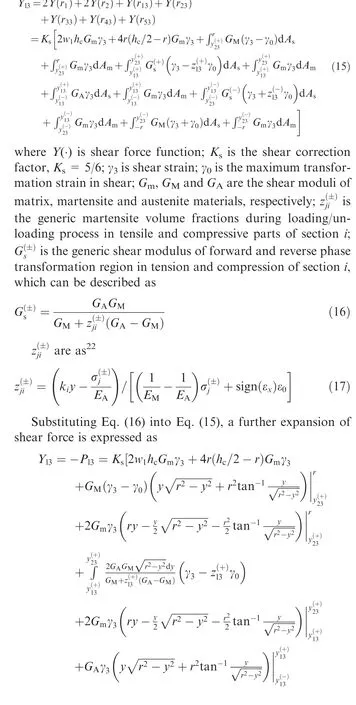
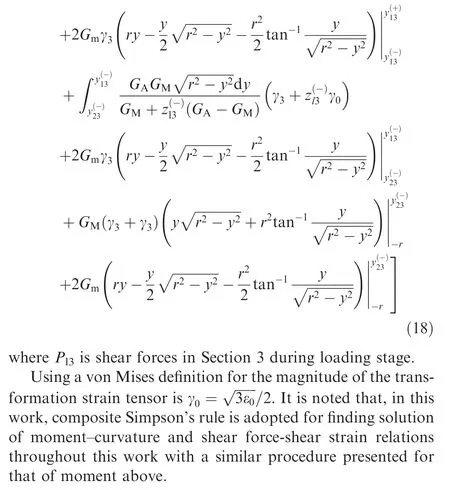
2.2.2. Unloading
Elastic unloading stage

*Section 3
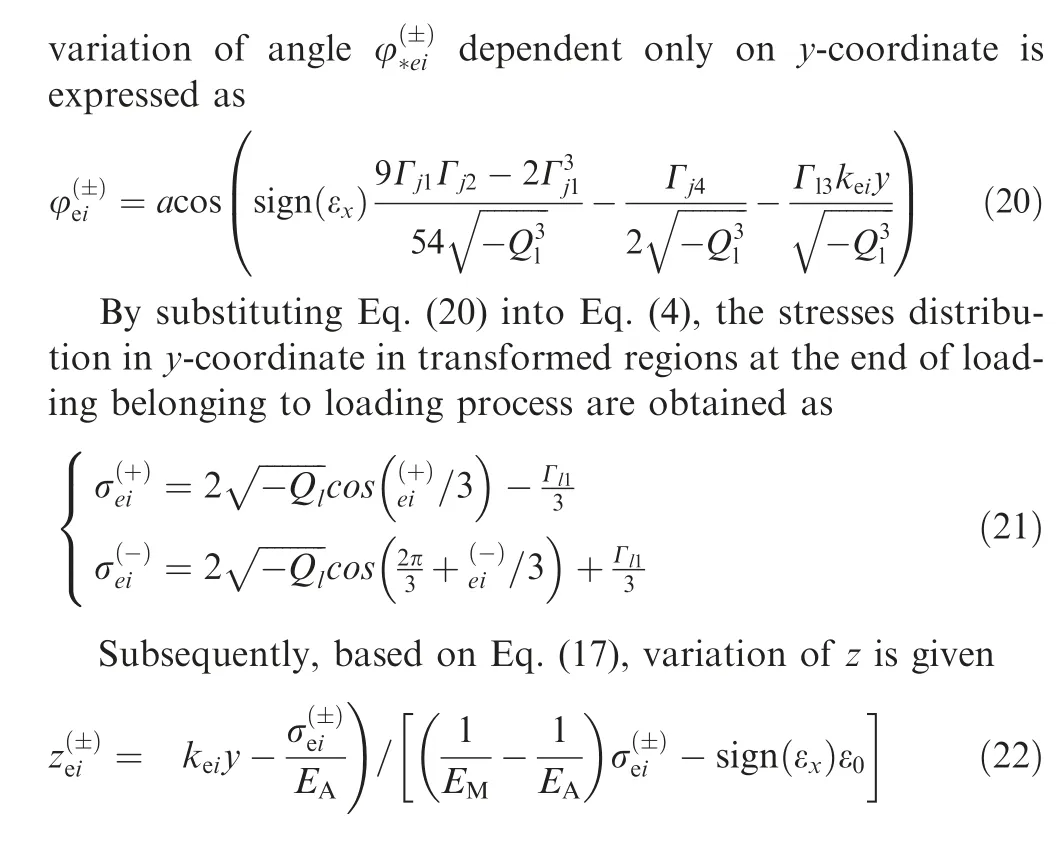
From Eq. (22) and stress–strain relationship,22the tensile and compressive stress distributions over a cross section of transformed region during elastic unloading are
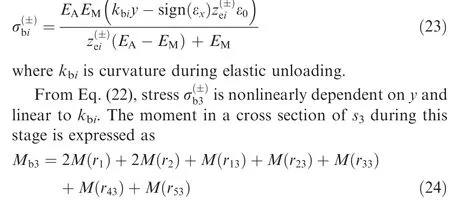
Thus, the moment–curvature relation is written as
From Eqs. (16) and (22), the shear force-shear strain relation of this stage is
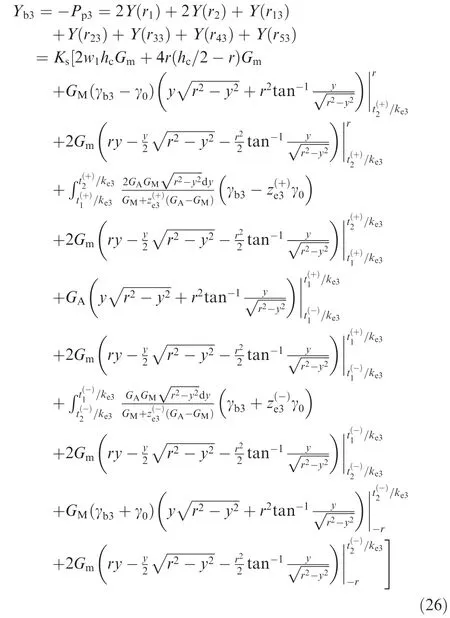
where Pp3is shear forces in Section 3 during elastic unloading stage.
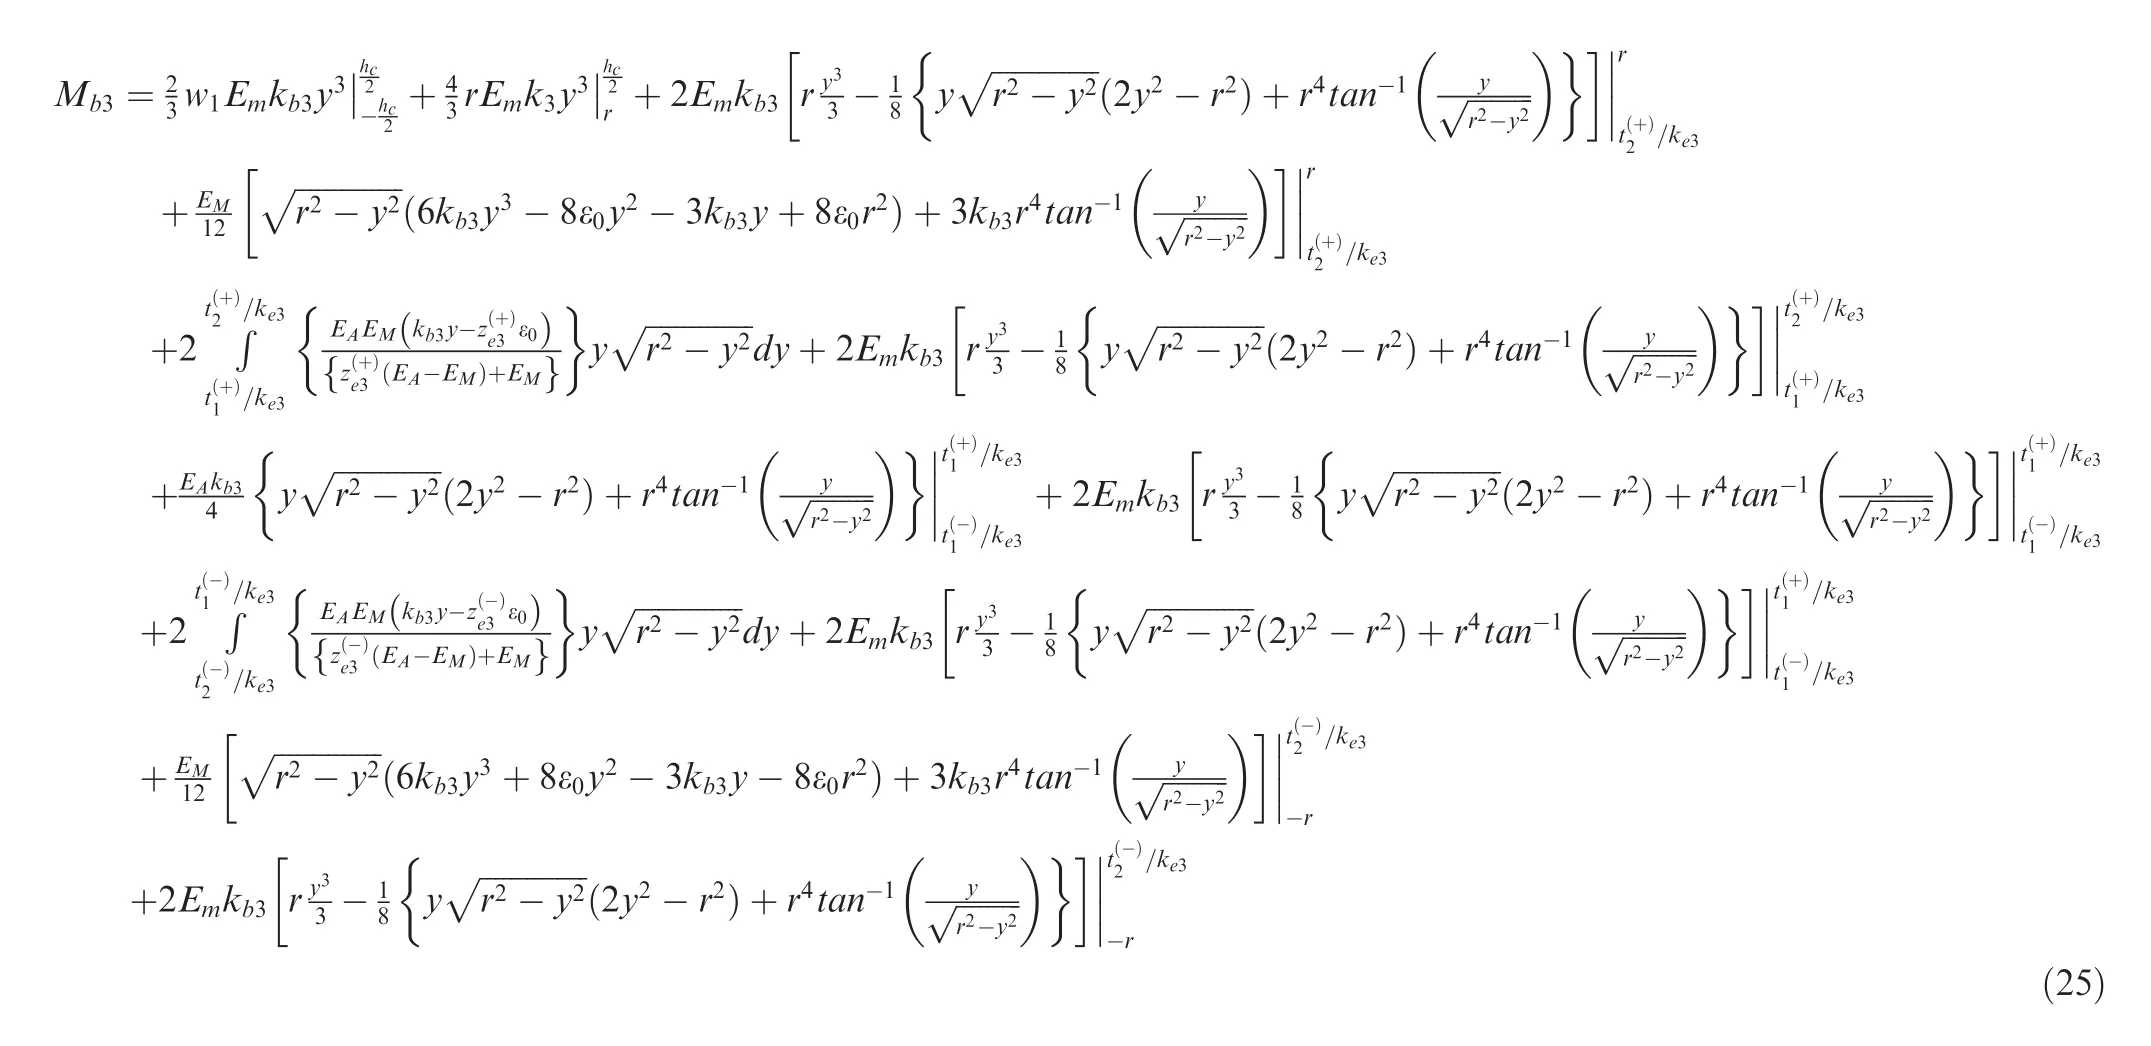
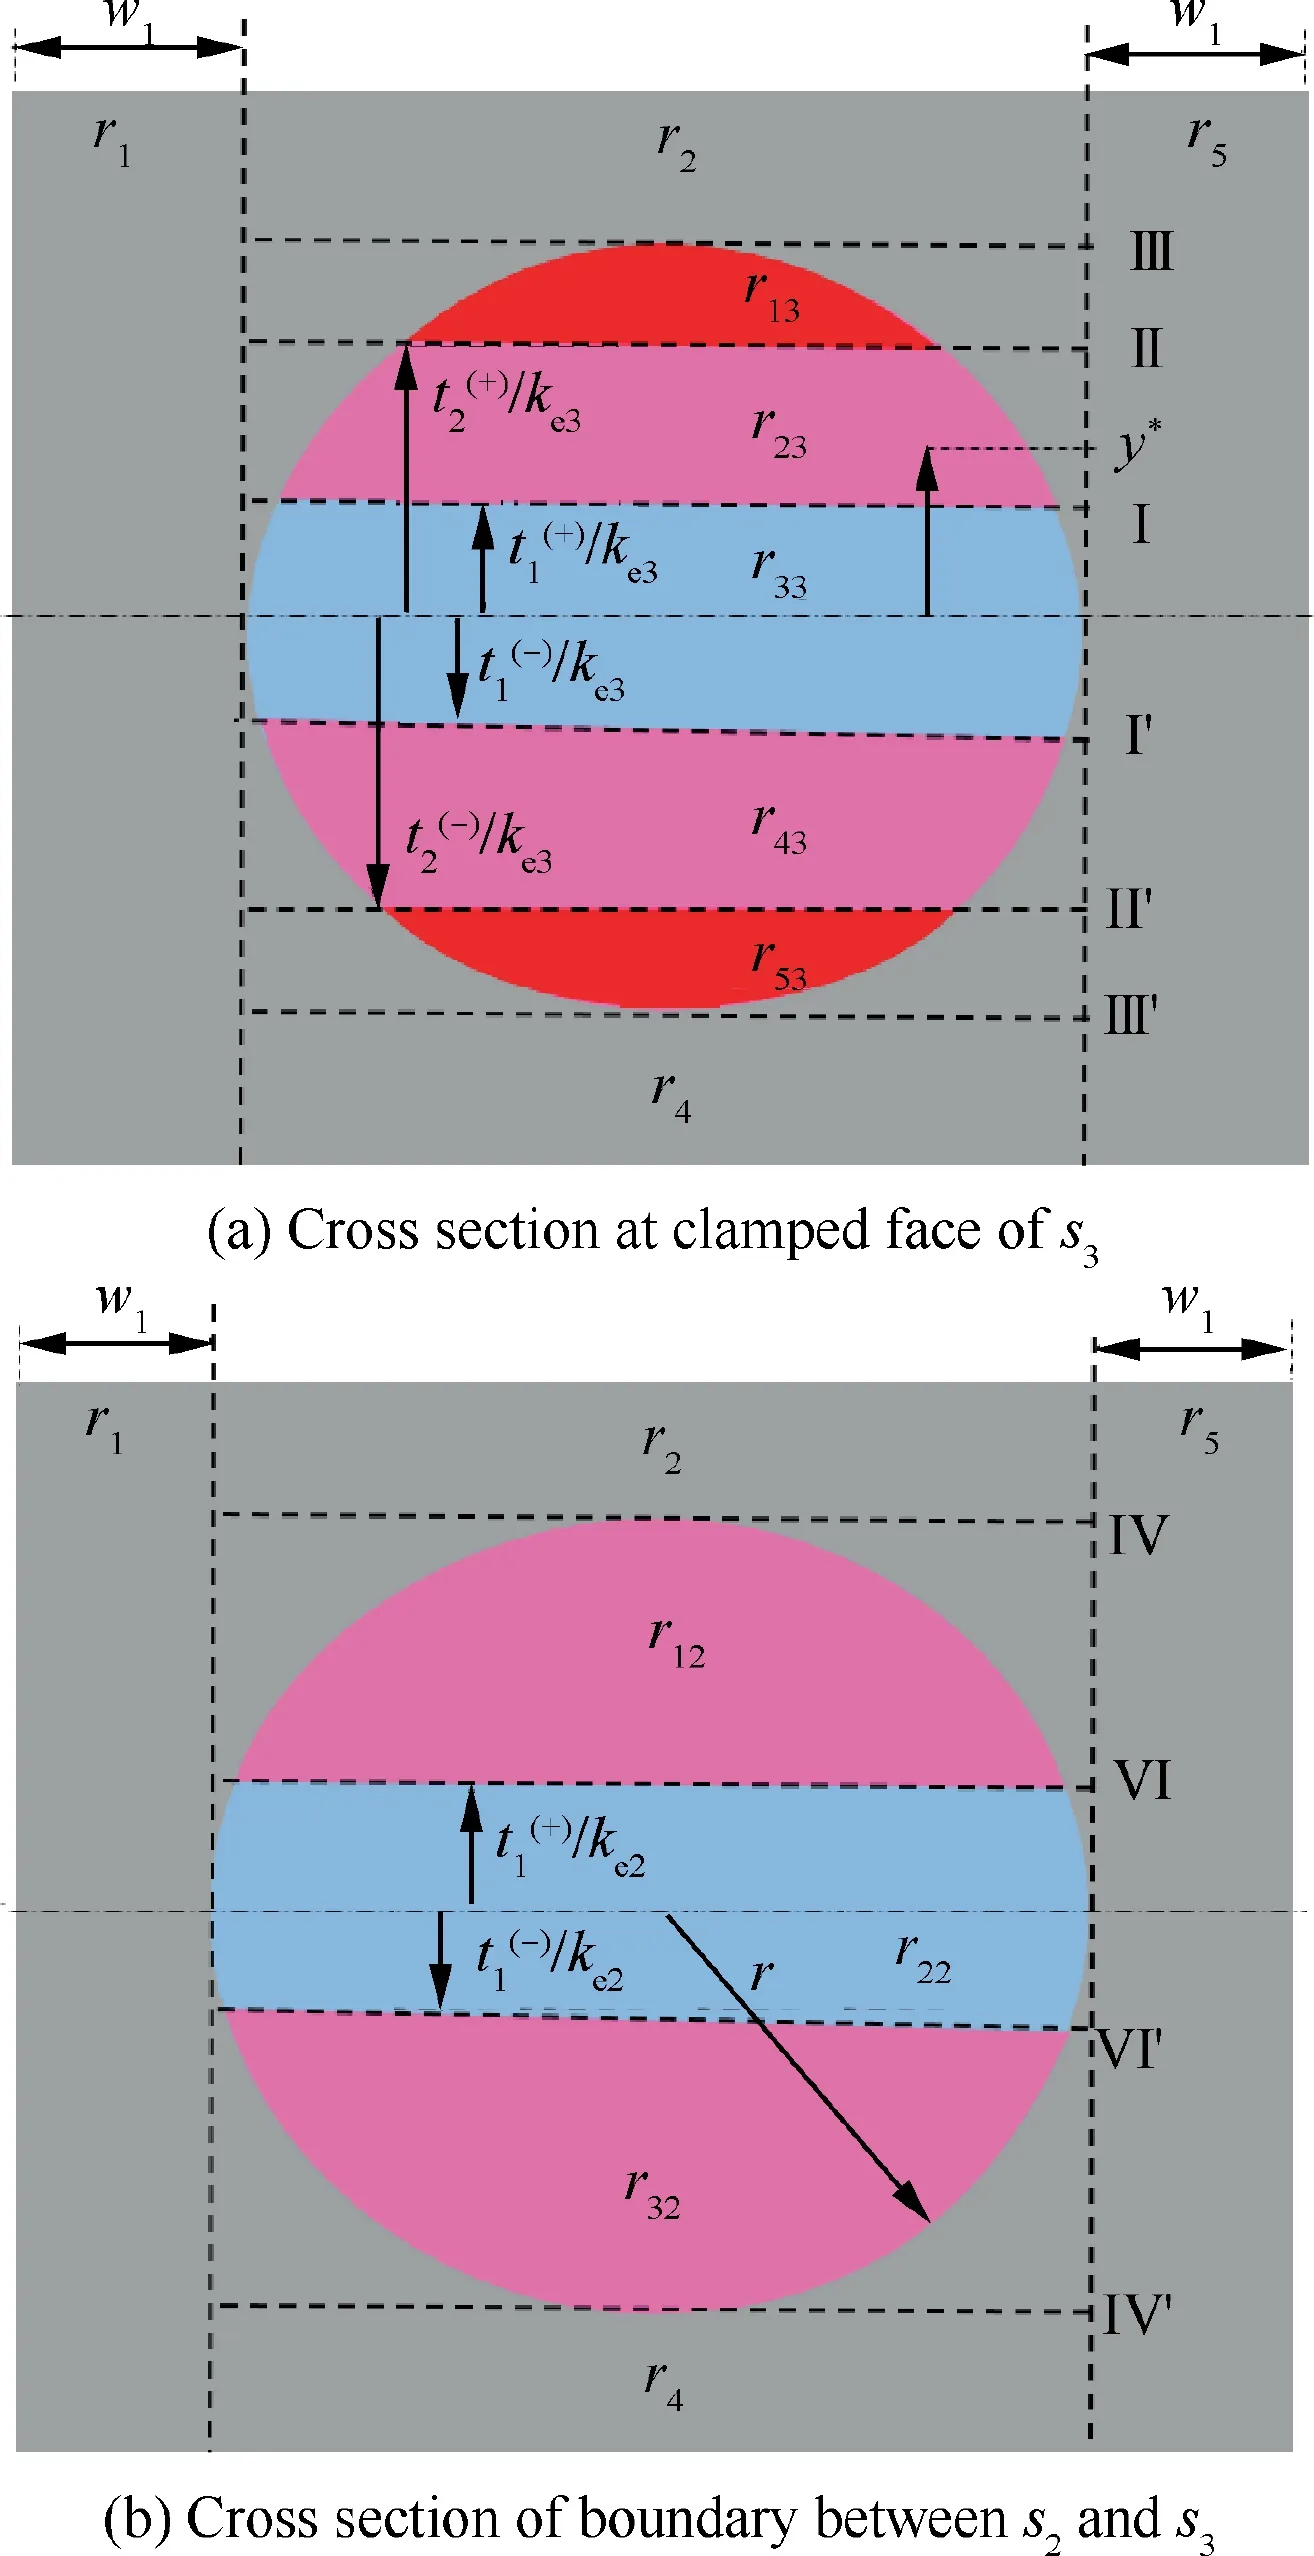
Fig. 4 Composite material response during elastic unloading stage.
It is noted that due to the space limitation,the moment and shear force formulas in Section 2 are not presented here, but their derivation procedures are similar to that of Section 3.
Partial reverse phase transformation stage
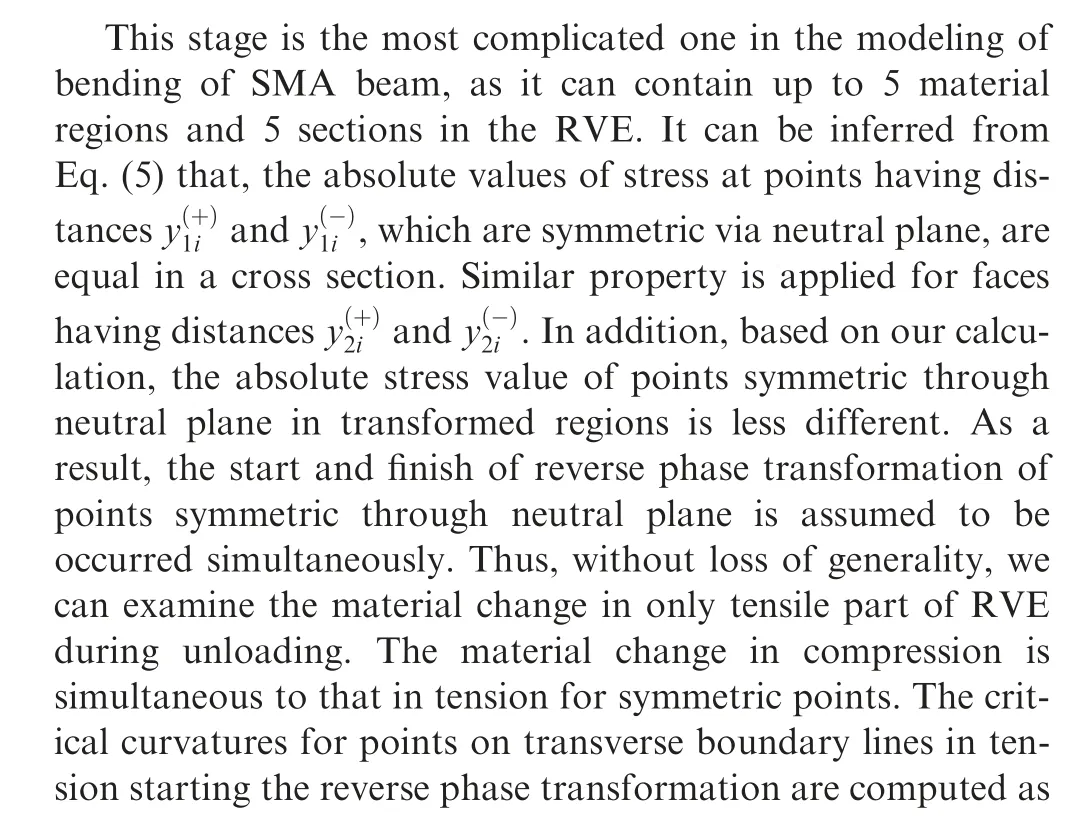
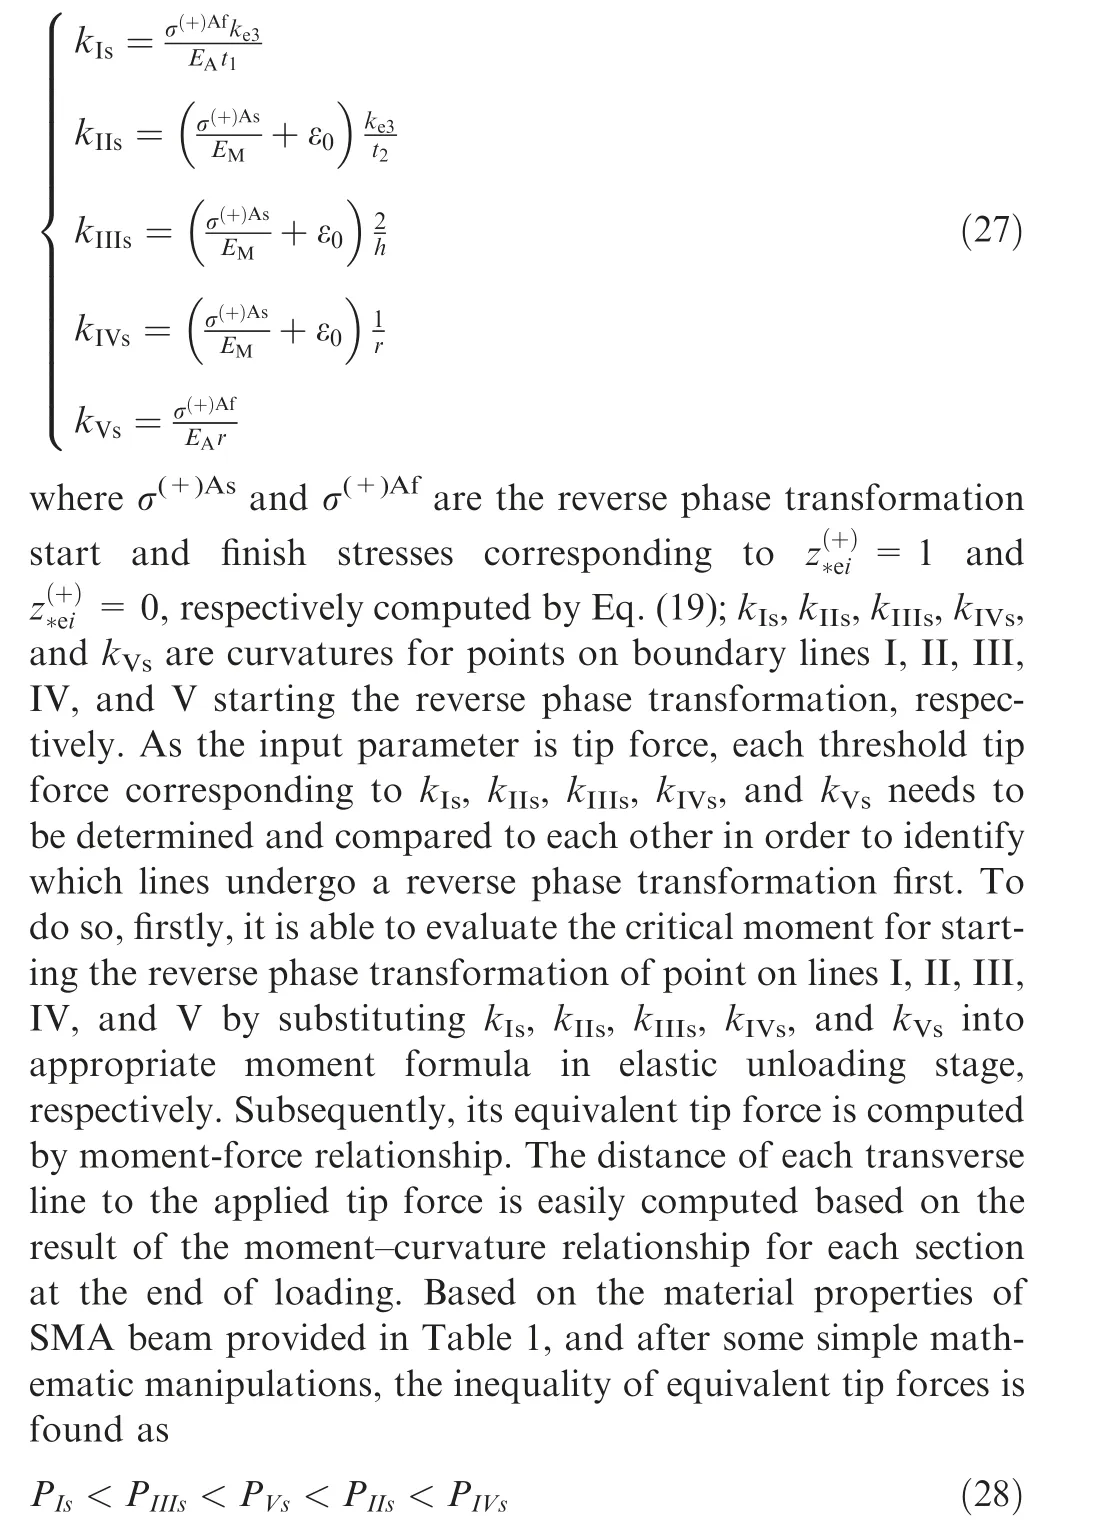
where PIs,PIIs,PIIIs,PIVs,and PVsare equivalent tip forces of critical curvatures kIs, kIIs, kIIIs, kIVs, and kVsrespectively.Inequality Eq.(28)implies that the boundary line has the onset of reverse phase transformation following an order from firstto-last as lines IV, II. By this order, first two consecutive substages 1 and 2 occur in this stage.
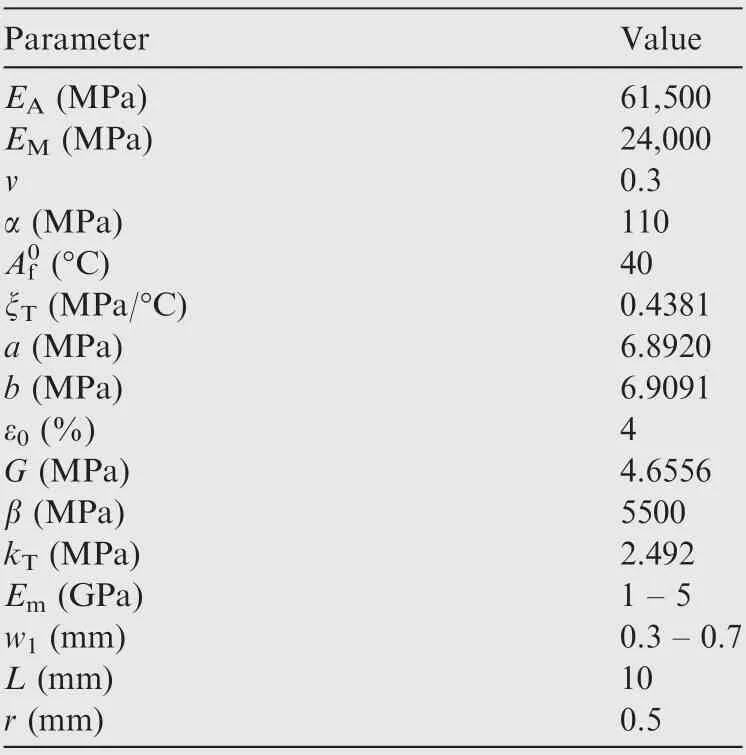
Table 1 Material properties31 and dimensions.
Firstsub-stage
In this stage, the reverse phase transformation only spreads to transverse lines IV1, IV2, and IV3(not reaching line II yet)from line IV shown as black dash arrow lines in Fig. 5(a) and the tip load of this stage satisfies condition as PIIs-≤ Pu< PIVs,where Puis the applied force during unloading. To achieve the moment–curvature formulation, the beam body shall be divided into sections with the different phase. Indeed, there are 5 sections including sp1, sp2, sp3, sp4, and sp5along the beam length in this stage as shown in Fig. 5(a). It can be seen from Fig. 5 that spiis bounded by two vertical lines when the beam is bent. Therefore, the value and evolution of spiare determined by the distances between the two boundary lines to the fixed end. To measure the distance, we first calculate the moment at cross sections containing these two lines using the moment–curvature relation for these sections. From the obtained moment and the given tip load, the distances can be computed. During the phase evolution, the value spiwill change and the computation of the distances needs to be updated. The most complicated section, sp4, consists of the following 5 material regions: austenite, elastically unloading material, martensite undergoing reverse transformation (in yellow, martensite, and matrix region).
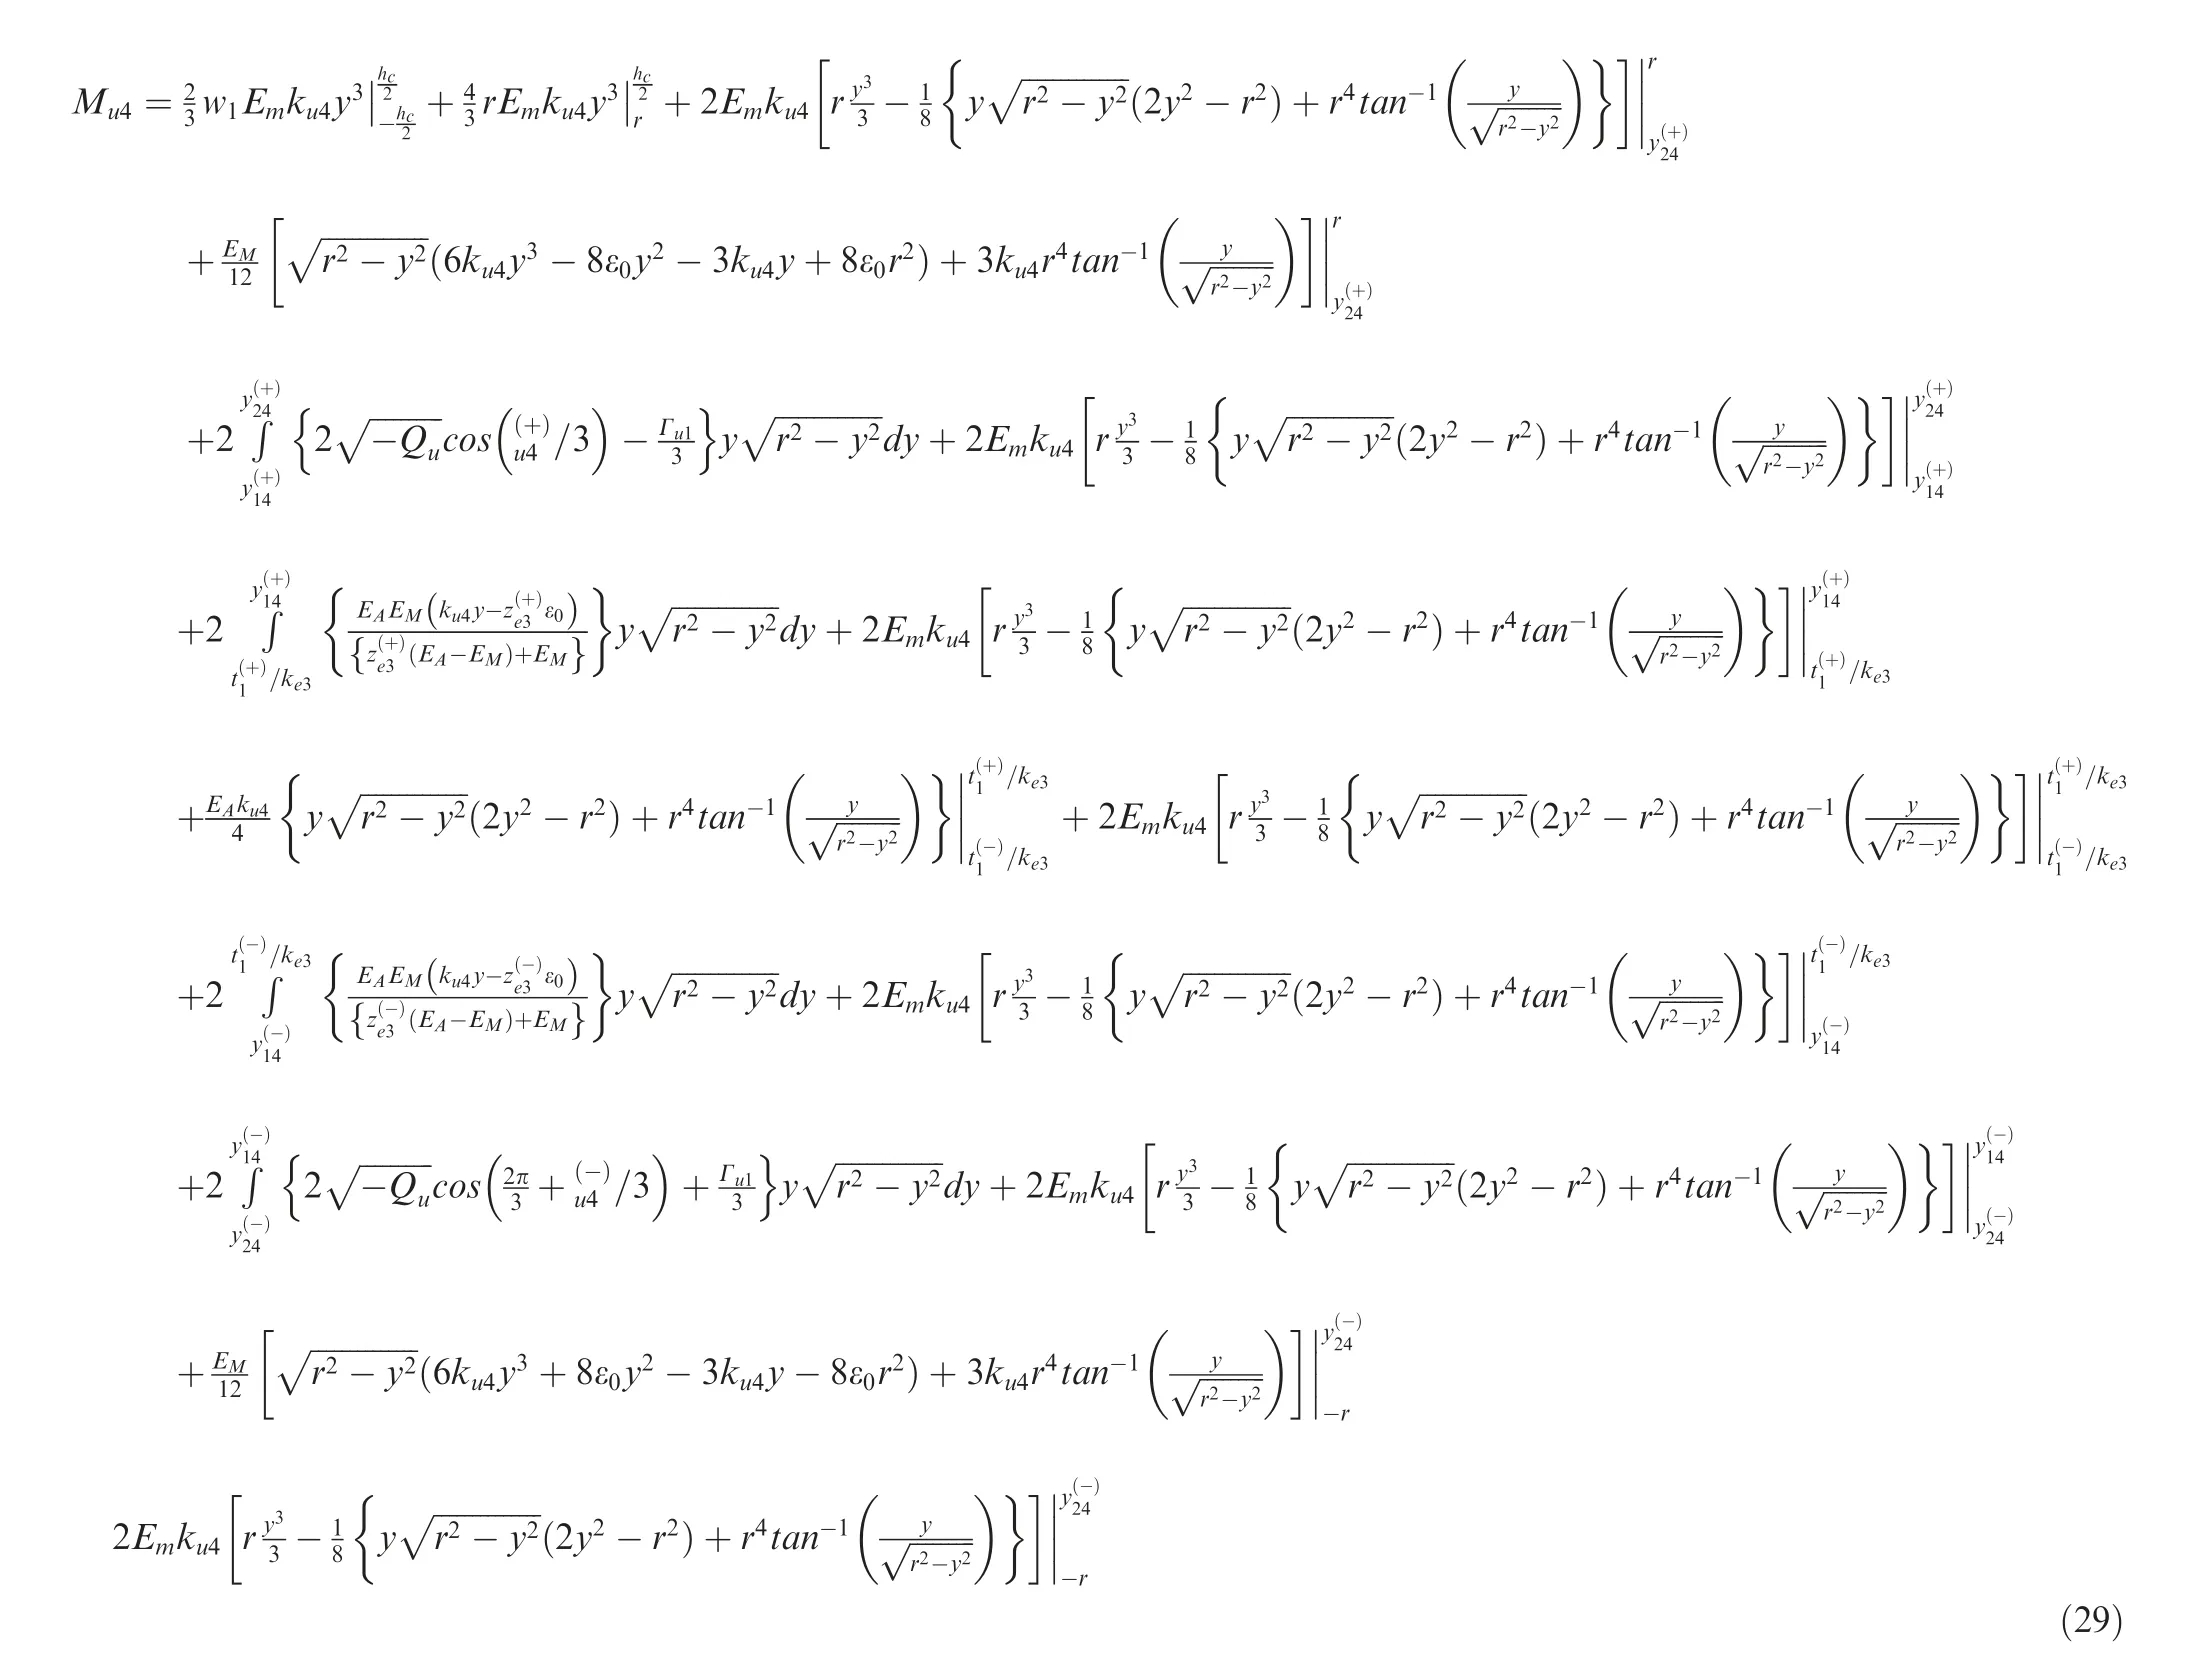
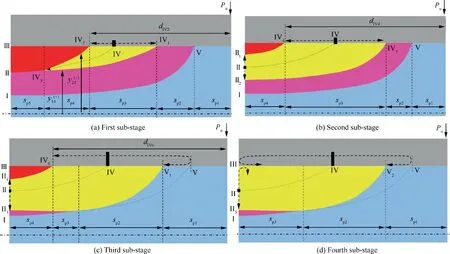
Fig. 5 Depiction of material structure belonging to the partially reverse phase transformation stage in tensile region.
where Mu4is moment in section sp4; ku4is is curvature of section sp4.
The shear force-shear strain relation of this stage is
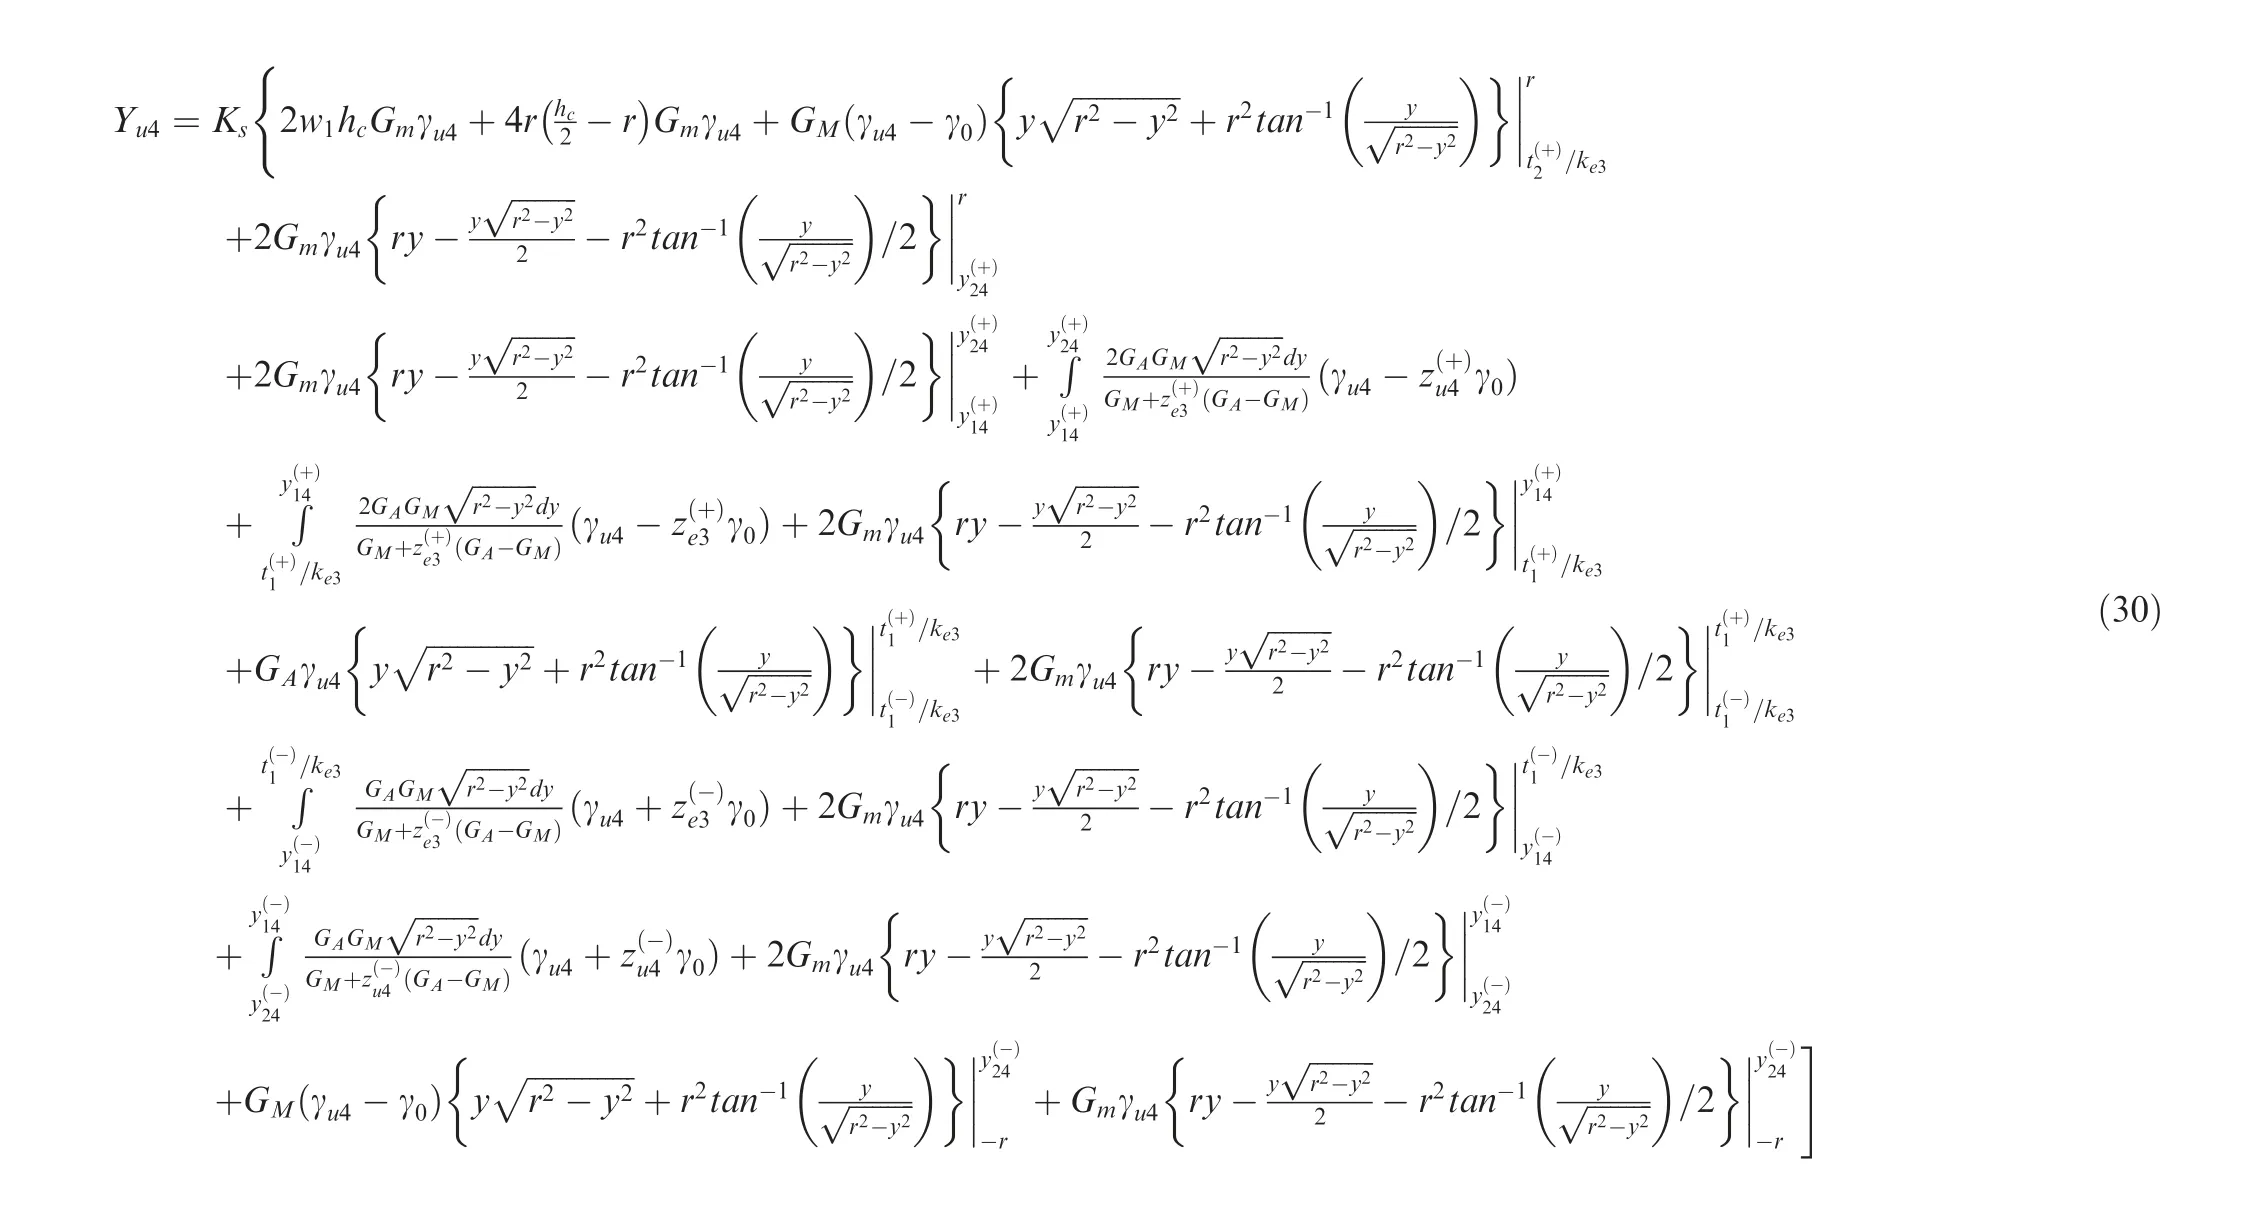
where Yu4is shear force of sp4; γu4is variable shear strain of
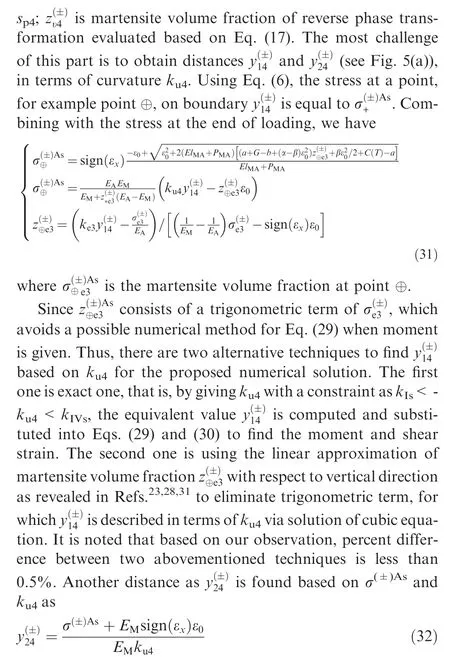
The first sub-stage is completed after points on boundary line II have the onset of reverse transformation. The moment threshold for this transition can be found by substituting kIIsinto Eq. (25).
2) Second sub-stage
In the stage, the austenite transformation starts to spread to transverse lines II1and II2from line II, and to transverse lines IV4and IV5from line IV indicated by dark dash arrows, as shown in Fig. 5(b). Tip load in the sub-stage satisfies Pu<-PIIs. From Fig. 5(b), there are 5 material regions depicted by different colors. There are 4 sections in the sub-stage including sp1, sp2, sp3, and sp4. The moment and shear force formulae of next sub-stages are not presented here due to the space limitation of the study, and can be inferred from first sub-stage.Instead, the internal material structure in the beam will be discussed in detail. By substituting kIsand kIIIsinto Eq. (29)together with force-moment relation, then comparing them with PVs, the inequality as PIs< PIIIs< PVsis obtained,which indicates that boundary line V will have onset of reverse phase transformation first and then III and I respectively.
3) Third sub-stage
During the sub-stage, point on transverse line V has a reverse phase transformation finish and spreads to lines V1and V2as dark dash arrows depicted in Fig. 5(c). Meanwhile,lines III and I have no austenite transformation yet.There are 5 material regions formed in the beam as shown in different colors. In addition, there are 4 sections, respectively denoted sp1, sp2, sp3, and sp4, along the beam length.
4) Fourth sub-stage
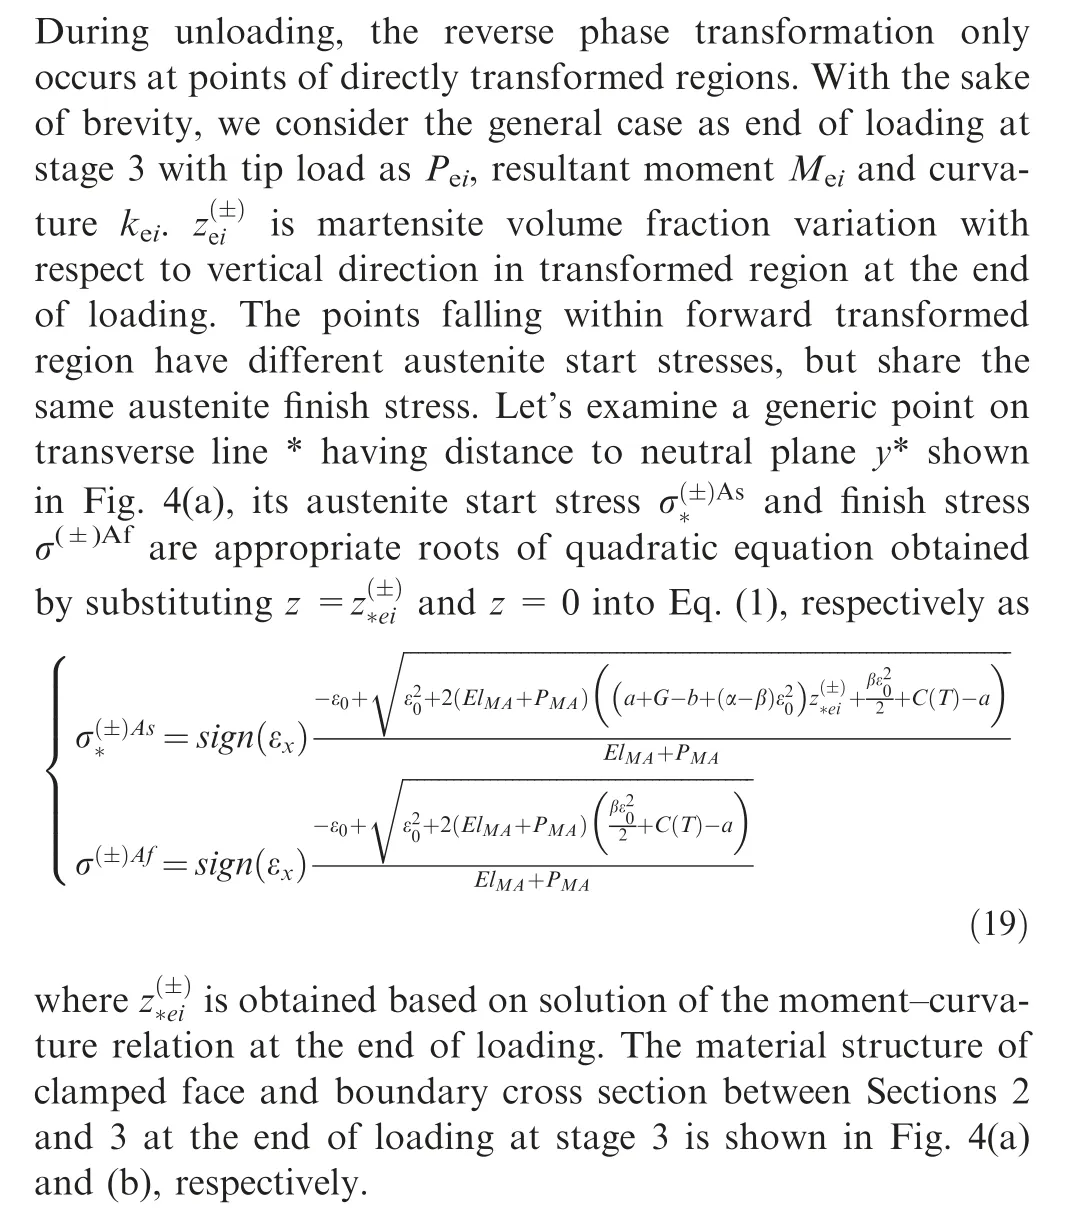
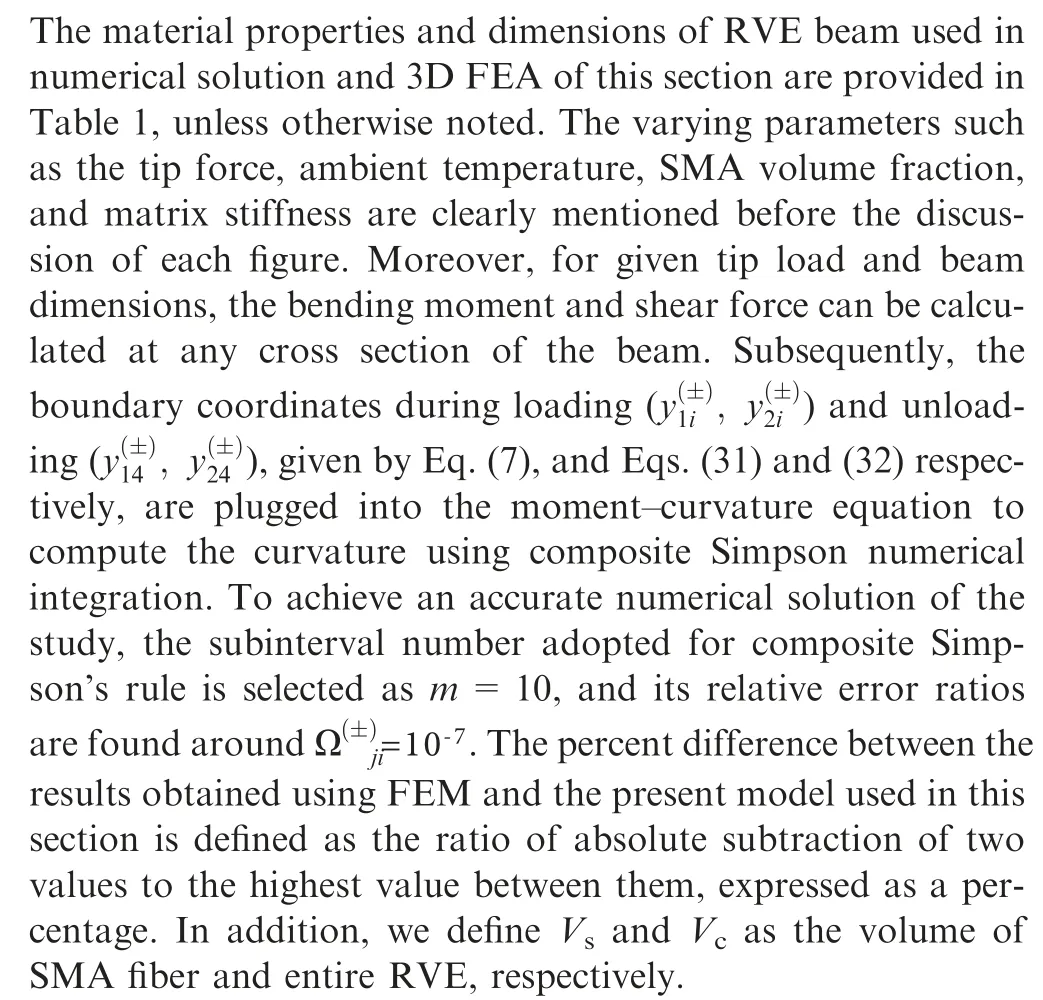
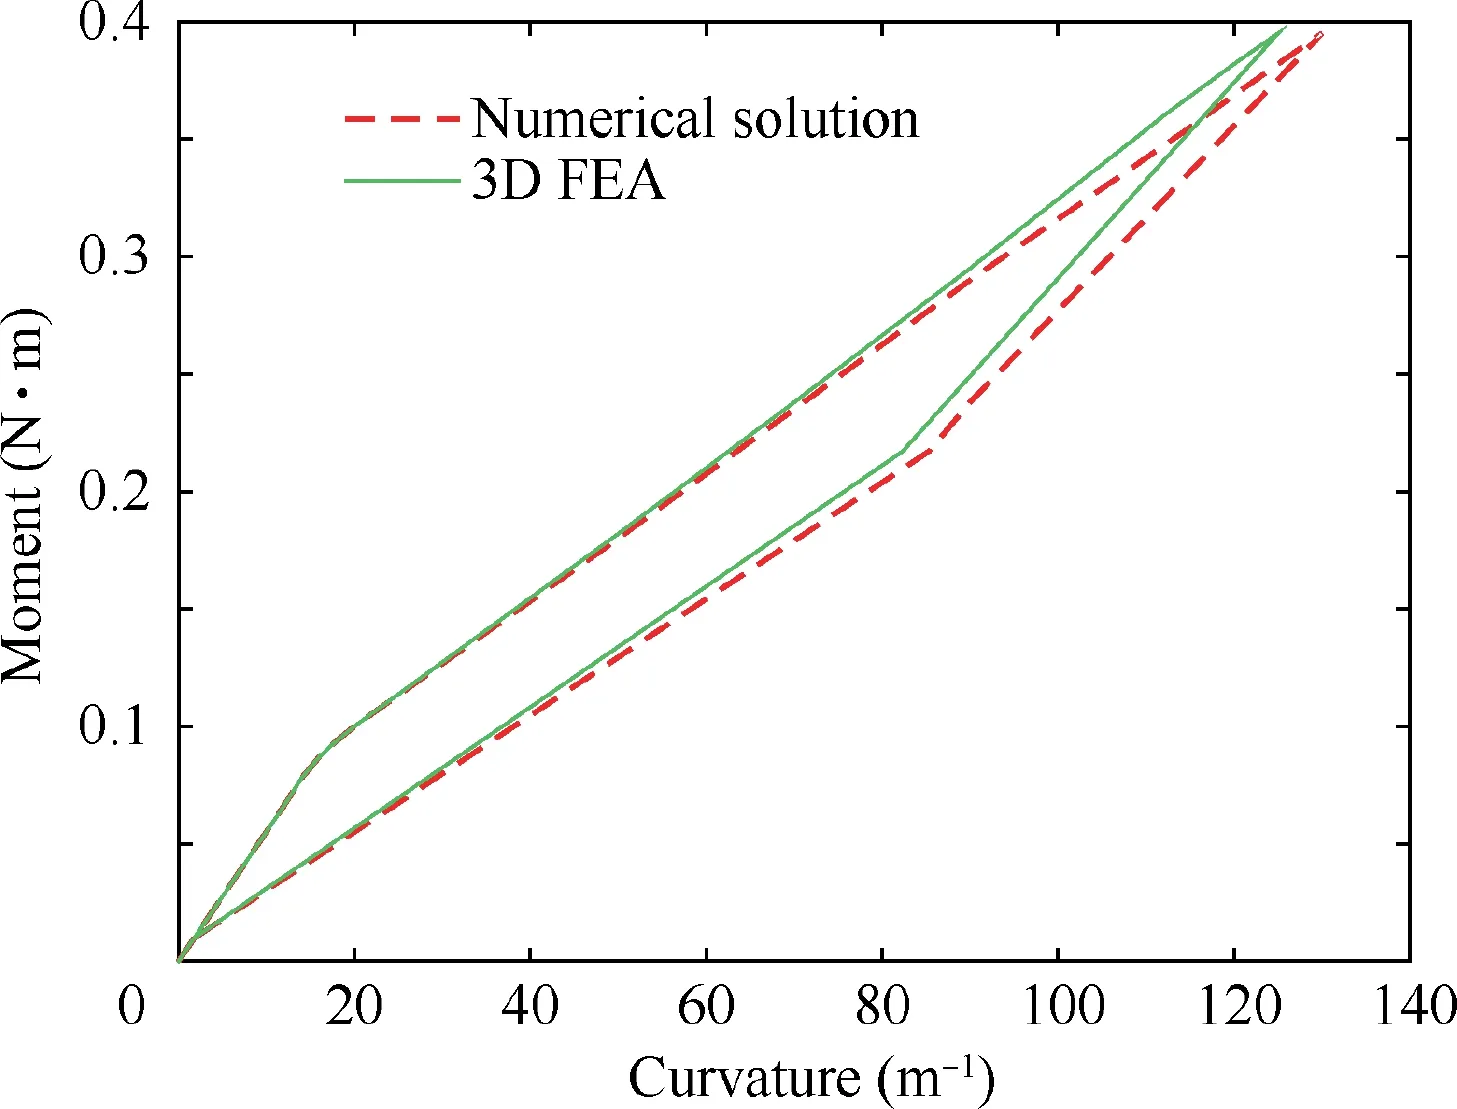
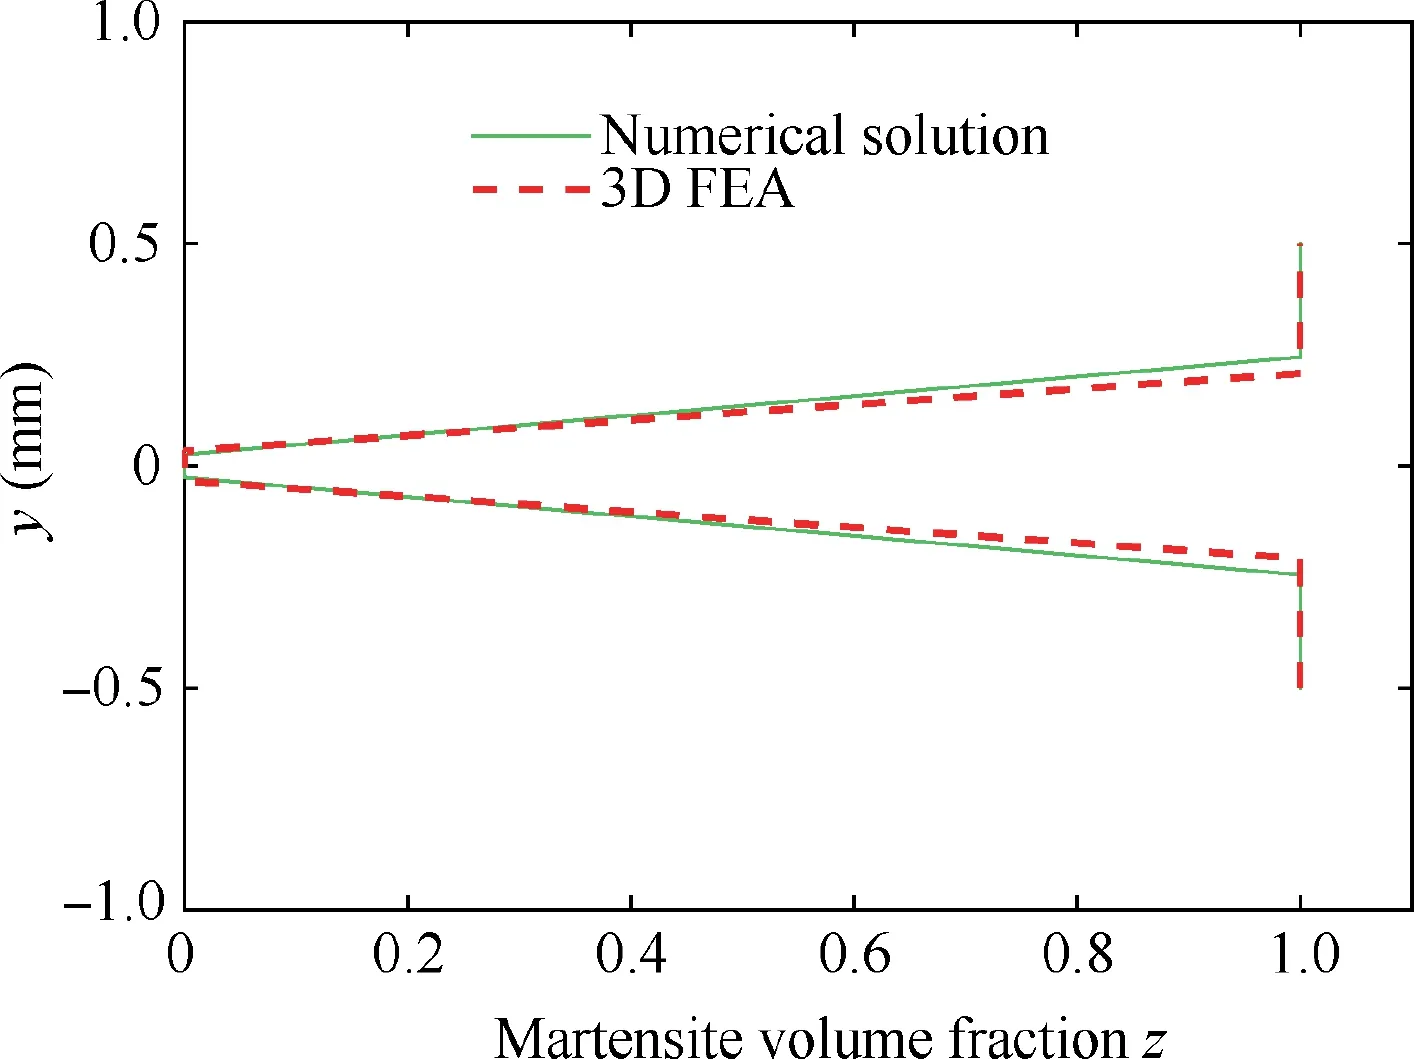
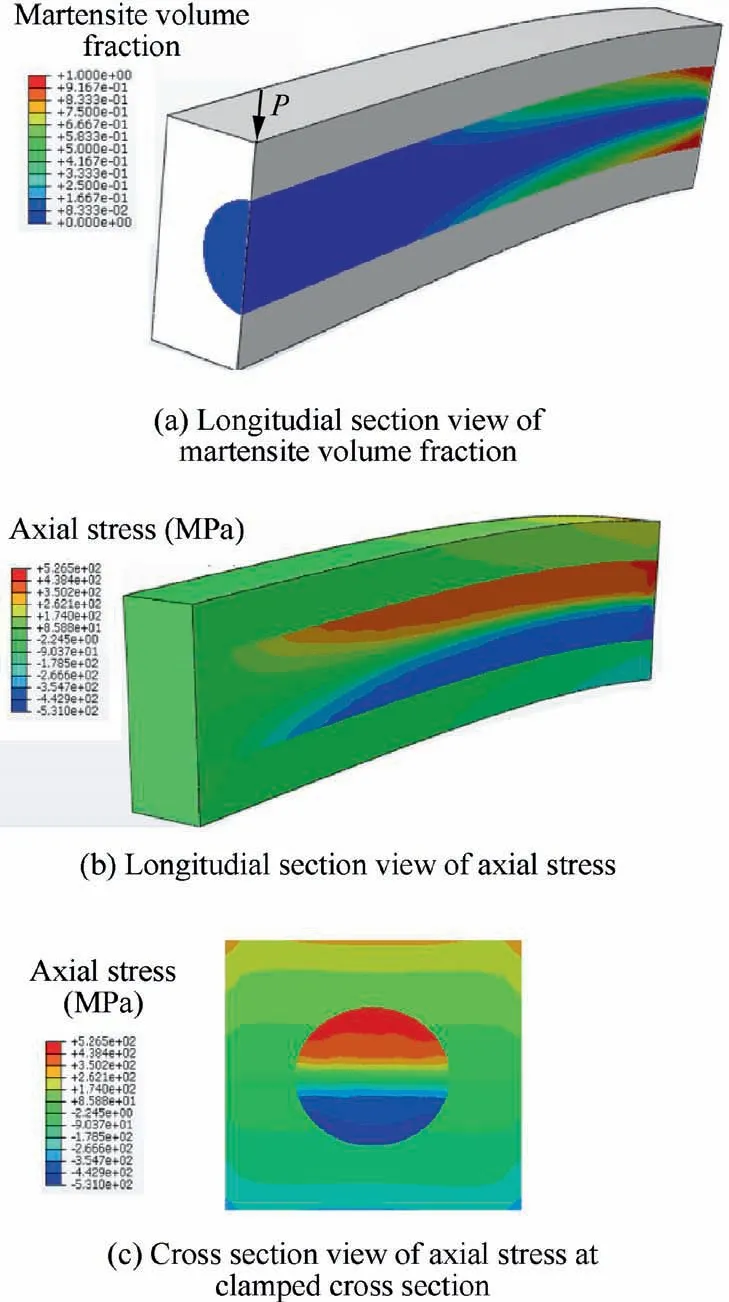
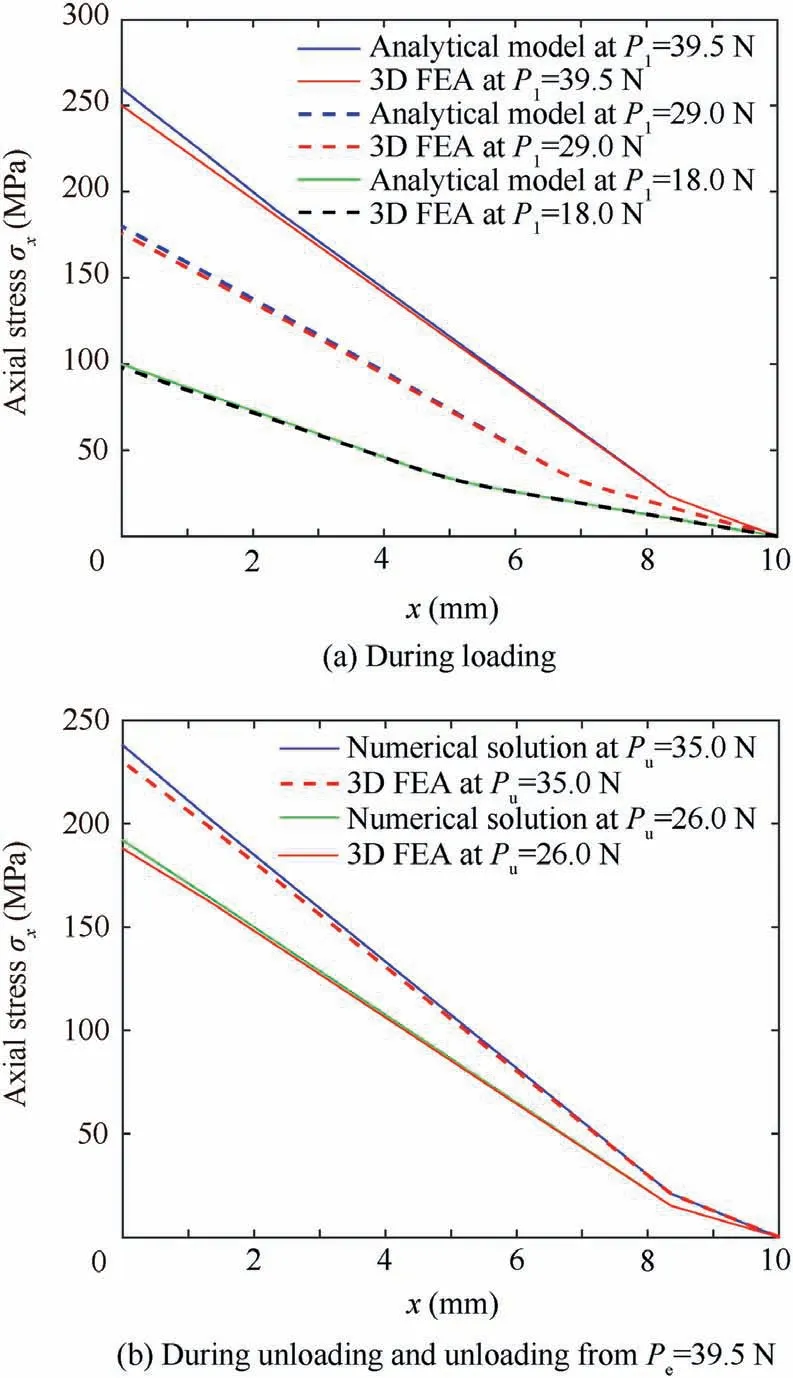
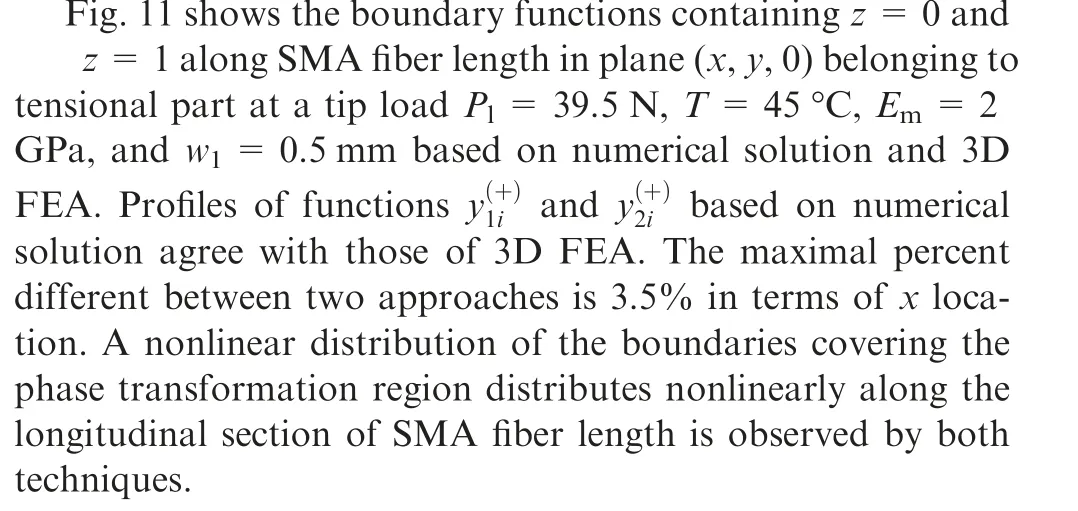
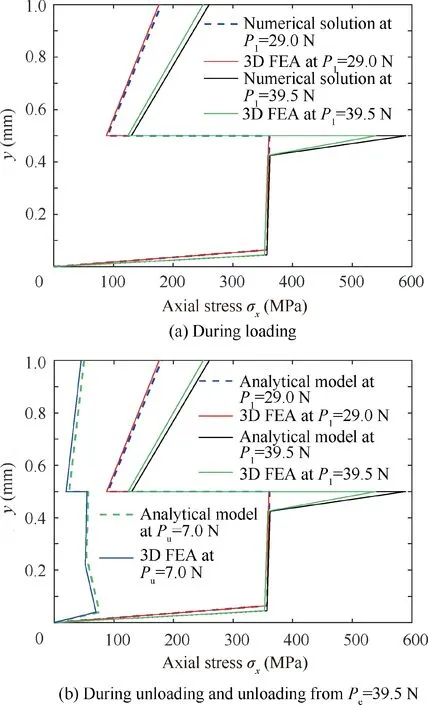
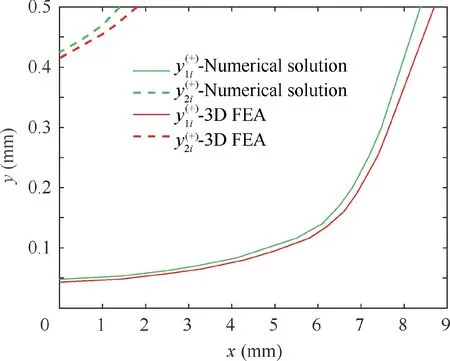
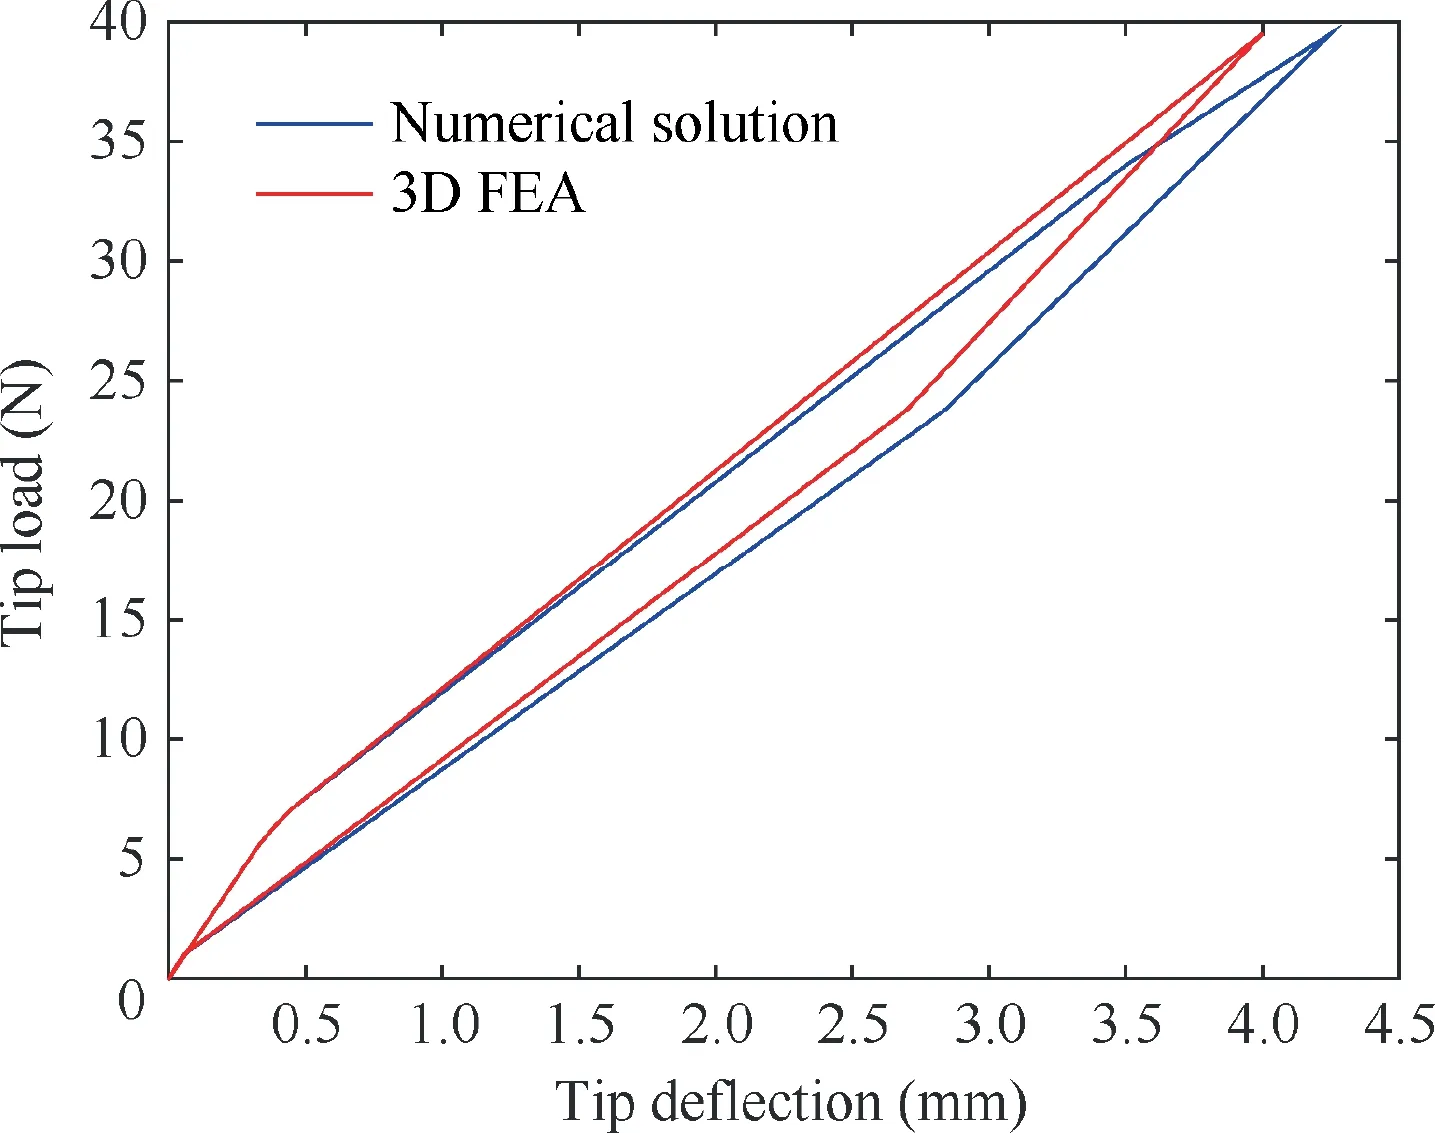
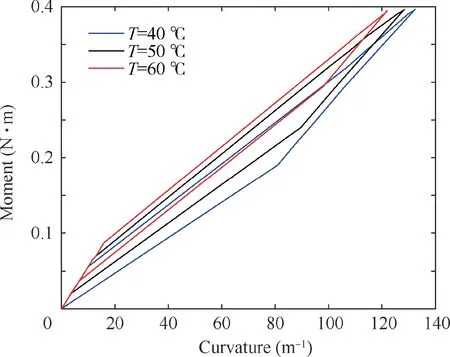
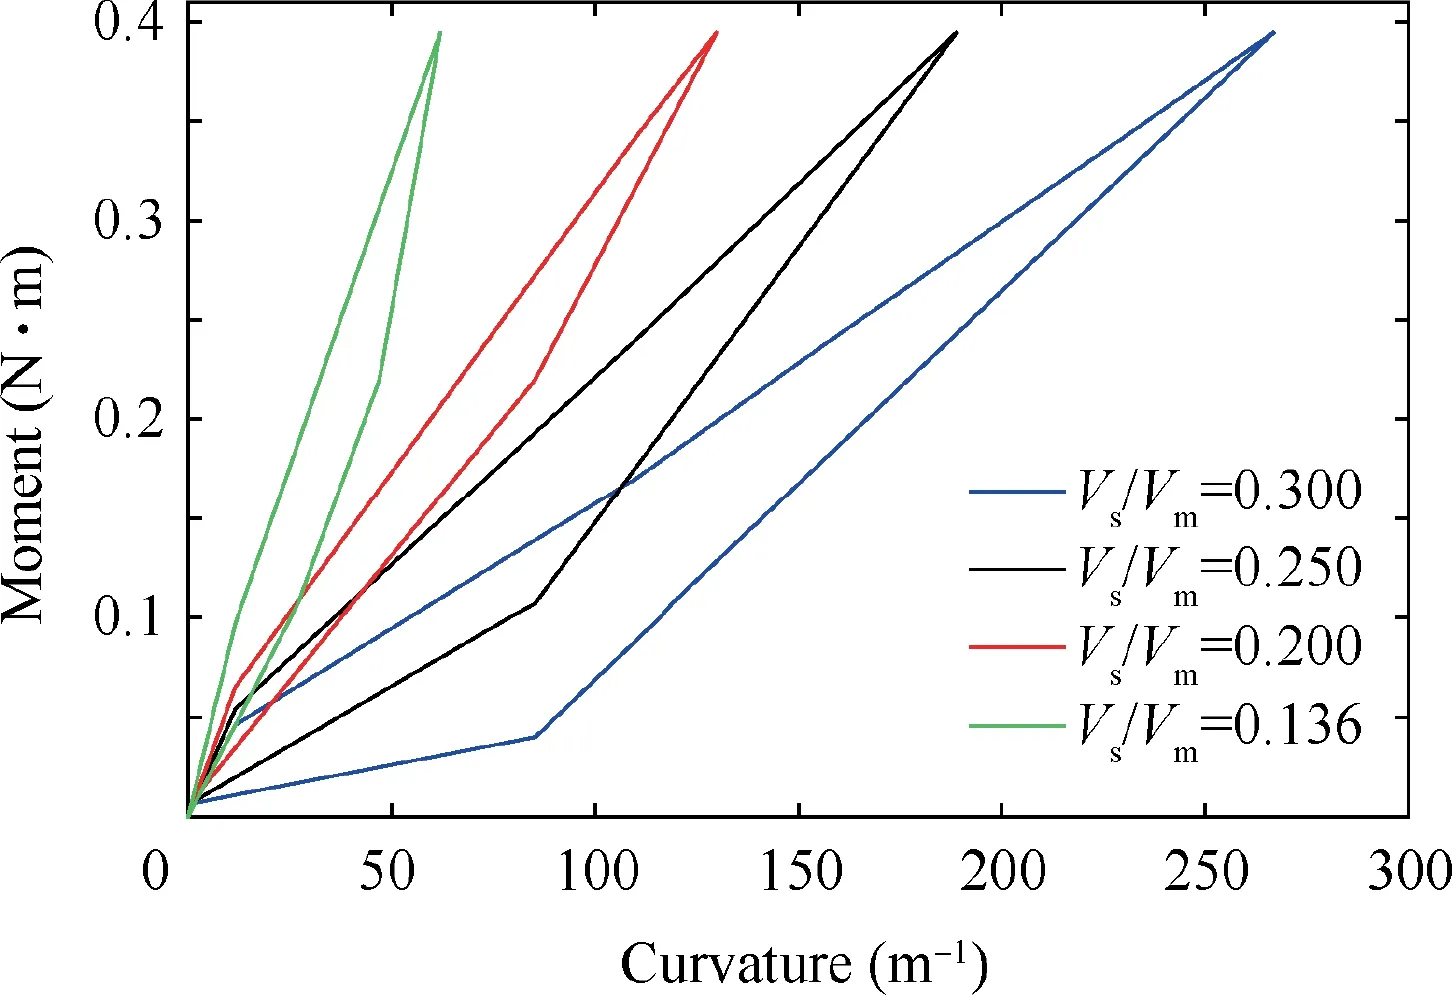
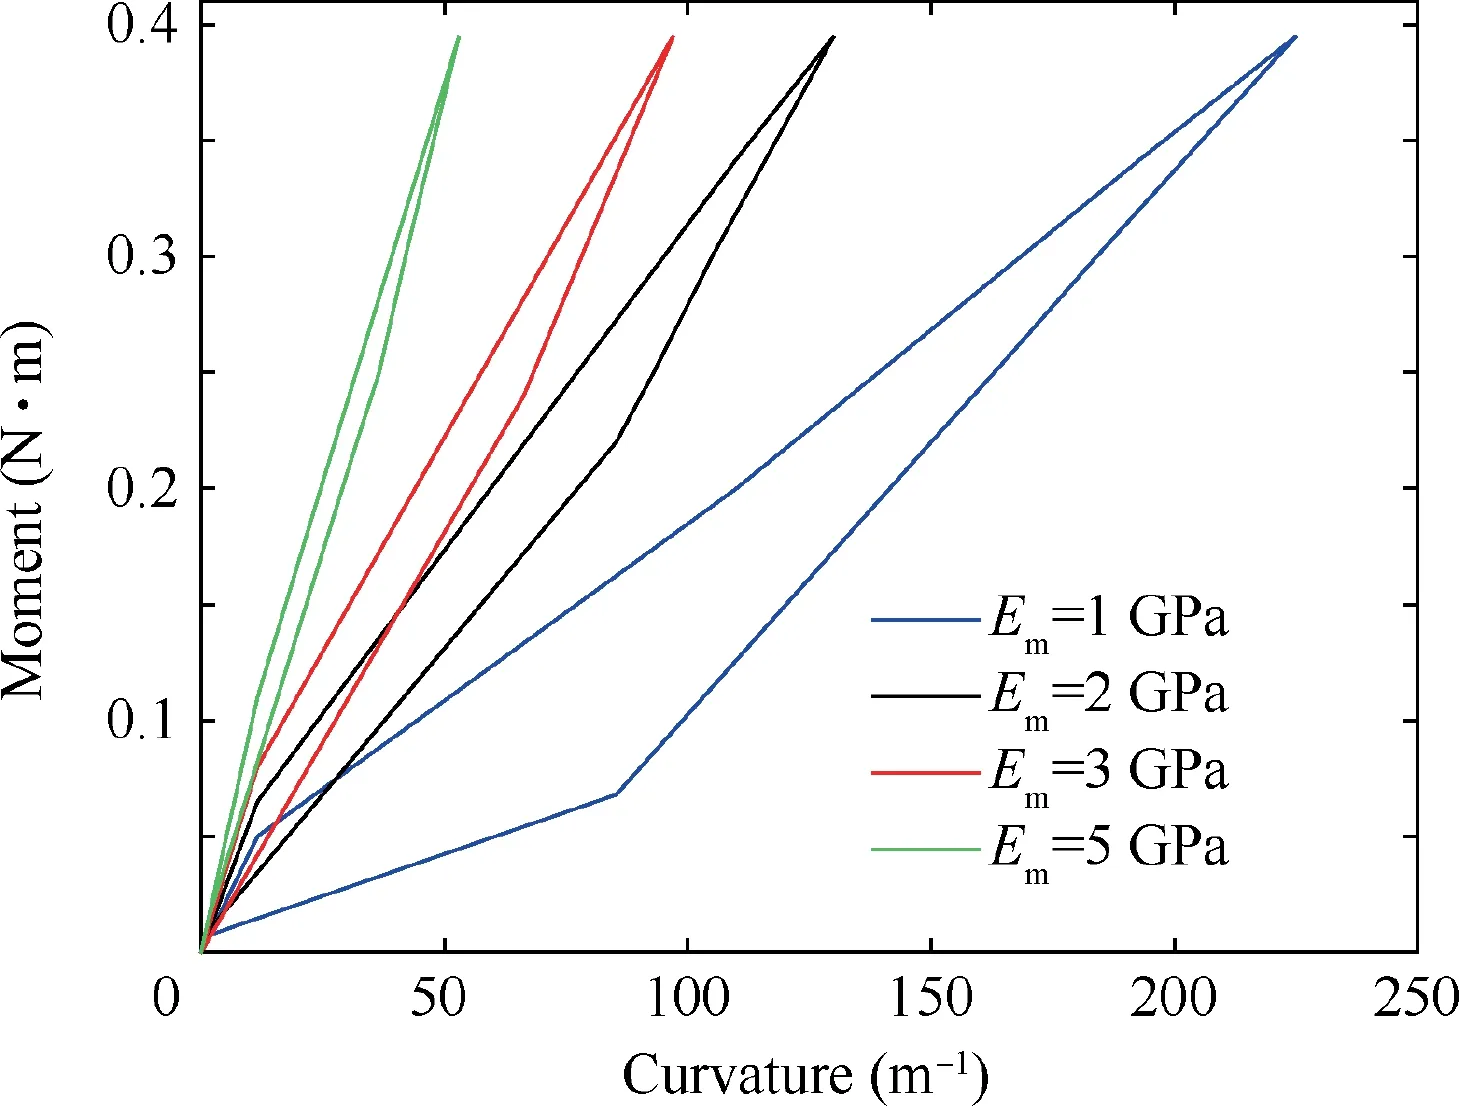
The last sub-stage in the partially reverse phase transformation stage is the fourth sub-stage.Applied tip force in the substage satisfies condition as Ps1 Full reverse phase transformation stage Reverse transformation is governed by the same loading function regardless of the amount of martensite presented in a given region. Moreover, the present work does not consider the possible presence of internal loops. The reverse phase transformation stage happens after the completion of the fourth sub-stage,and there are only 2 material regions involving reverse transformation and austenite region in SMA wire.This stage completes when points on line III has an austenite transformation finish equivalent to a curvature kfIIIas In the study, a well-known numerical integral function named as ‘cumtrapz’ in the commercial software MATLAB is adopted to generate the accurate deflection profile along the beam length from the obtained discrete numerical data of curvature and shear strain.The function is specialized for numerically enforcing the double integral of discrete data of curvature and shear strain to find the tip deflection. With a purpose of validating the semi-analytical results, 3D FEA based on ZM’s three-dimensional model for SMAs22is used by an appropriate user subroutine (UMAT) written by FORTRAN in commercially available finite element software ABAQUS with 3D elements. The ZM’s finite element model demonstrated an excellent agreement with the experiment.22Dimension and material properties inputting in 3D FEA simulation are analogous to those used in the numerical solution.In order to balance the accuracy and time cost in 3D FEA simulation, the element mesh size is chosen to be 0.08 mm. The mesh consists of approximately 90,000 3D quadratic mesh elements with reduced integration (element C3D8R in ABAQUS). A load is applied at one end of the beam, while the other end is fixed. To obtain high resolution of FEA results during loading/unloading, the increment of load is selected as small as 10–3N. Resultant values including stress, strain,and martensite volume fraction are extracted at integration points. The deflection in FEA is taken at nodes. Note that the curvature of a cross section is calculated using the value of the stress and the vertical coordinate of a material point. The formulation used is the one in Eq. (9). Fig. 6 shows the moment–curvature response at RVE’s clamped cross section during loading/unloading process based on numerical solution and 3D FEA at T =45 ° C, Em=2 GPa, and w1= 0.5 mm and other input parameters provided in Table 1. Result from both prediction techniques are in good agreement with percent difference of 4.0% in terms of curva-ture at Me3= 0.395 N⋅m. Fig. 6 reveals a nonlinear moment–curvature relationship of RVE during loading/unloading process, and demonstrates a superelastic behavior of the composite. The property provides two useful advantages in the composite applications such as large recoverable deformation and vibration damping as well as energy dissipation due to the hysteresis. The superelastic property of RVE is induced by SMA wire. It is worthwhile noted that with given inputs and Me3being from 0.342 N⋅m to 0.395 N⋅m, the stage 3 with martensite region is accomplished in the RVE. However, the moment–curvature response at the stage 3 is unchanged in comparison with stage 2 due to the fact that martensite region occupying in the RVE is very small. Based on Fig. 6, SMA wire strongly influences the composite properties. Fig. 6 Moment-curvature response at RVE’s clamped cross section during loading/unloading process at T=45°C, Em=2-GPa,and w1=0.5 mm based on numerical solution and 3D FEA. The variation of z along points on y-coordinate of a clamped cross section at tip load Pl=39.5 N, T =45°C,Em= 2 GPa, and w1= 0.5 mm based on numerical solution,and 3D FEA during loading is depicted in Fig. 7. Both results are in good agreement (maximal difference of 5.0% in terms of y position at z = 1), and exhibit a mostly linear profile of z with respect to y-coordinate in the transformation region,which well agrees with findings in Refs.23,32. In order to support the intuitive observation, a picture of contour image of martensite volume fraction variation inside the RVE in the 3D FEA environment is presented by Fig. 8(a). The axial stress distribution along RVE length on surface y = hc/2 belonging to matrix under different loads during loading/unloading process at T =45°C, Em= 2 GPa, and w1= 0.5 mm based on numerical solution and 3D FEA is plotted in Fig. 9. Fig. 9 shows good agreement between numerical technique and 3D FEA in terms of axial stress at points on surface along the RVE length, and the plot trend. For loading case, based on Fig. 9(a), the maximal percent difference is 5.7% at x =0, η = 0 and Pl= 39.5 N. Fig. 9 exhibits a nonlinear variation of axial stress along the RVE length using both methods. Furthermore, kinked points are at x = 5.6, 7.0, 8.4 mm for Pl= 18.0, 29.0, 35.9 N, respectively. The kinked point of the plot is where the onset of forward phase transfor-mation of SMA fiber happens and moves closer to tip force at x =0.001 m with an increase in tip load. It can be interpreted that an increase in tip load leads to a further expansion of for-ward transformation region in the RVE.28The stress variation inside the RVE in 3D FEA environment corresponding to case of shear force at the end of loading Pe= 39.5 N is depicted by Fig.8(b) and (c) to support the finding in Fig. 9(a). For unloading case, the result of stress obtained by both methods agrees well with each other and belongs to elastic unloading stage as shown in Fig. 9(b). When load is decreased, sections 2 and 3 share a same linear stress function with respect to y-co-ordinate and Section 1 has its own linear stress function, whose stress property is similar to that at the end of loading. Fig. 7 Martensite volume fraction distribution along points (0,y, 0) of a clamped cross section under tip load Pl=39.5 N,T=45°C, Em=2 GPa, and w1=0.5 mm based on numerical solution and 3D FEA. Fig. 8 Contour images taken from 3D FEA simulation at Pe3=39.5 N, T=45°C, Em=2 GPa, and w1=0.5 mm. Fig. 10 shows the axial stress distribution along ycoordinate of clamped cross section under different loads during loading process with T =45°C, Em= 2 GPa, and w1= 0.5 mm based on numerical solution and 3D FEA during loading/unloading process. It is noted that from y = 0 mm to y = 0.5 mm, the material belongs to SMA circular wire and from y = 0.5 mm to y = 1.0 mm is the matrix. Fig. 10(a)demonstrates good agreement between numerical and 3D FEA results in terms of the curve trend. For loading case, from Fig. 10(a), the axial stress varies nonlinearly with respect to ycoordinate for SMA wire, it is linear for matrix. It also indicates that under tip load Pl= 39.5 N, the phase transformation is completed when y = 0.42 - 0.50 mm for the clamped cross section leading a sharp rise of axial stress in the interval.Whereas, the forward transformation is unable to complete under Pl= 29.0 N, the axial transformation stress keeps its value between 357 MPa and 362 MPa from y = 0.04 mm to y= 0.50 mm. For observing a wider picture of axial stress response during loading, the contour plot of axial stress inside the clamped cross section x = 0 mm of the RVE in 3D FEA environment corresponding to case of Pl= 39.5 N is demonstrated in Fig. 8(c). For unloading case, Fig. 10(b) exhibits a good match between two prediction techniques in terms of axial stress-y-coordinate response profile. Fig. 10(b) shows a nonlinear variation of stress with respect to y-coordinate in SMA wire region and a linear of stress variation in matrix region. It is observed that when load decreases from 9.5 N to 29.0 N, the drop of stress at y = 0.500 mm is larger than that at y = 0.425 mm, which is also larger than that of y = 0.045 mm. It is due to the fact that, for given material properties and based on stress-curvature relation as Eq. (23)of this stage, the stress-y-coordinate relation slope is higher with a higher value of y-coordinate when considering the curvature as a variable. As a result, a same drop of curvature can lead to bigger drop of stress at higher y-position. It is also clear from Fig. 10(b) that during unloading to Pu= 7.0 N, the region experiencing reverse transformation is between y = 0.220 mm and y = 0.500 mm, and the region experiencing elastic unloading is between y = 0.045 mm and y = 0.220 mm.The region containing this stress distribution is denoted sp3in Fig. 5(a). Fig. 9 Axial stress distribution along RVE length on surface y=hc/2 with different loads at T=45°C, Em=2 GPa, and w1=0.5 mm based on numerical solution and 3D FEA. Fig. 10 Axial stress distribution along y-coordinate of clamped cross section under different loads with T=45°C, Em=2 GPa,and w1=0.5 mm based on numerical solution and 3D FEA. Fig. 11 Boundary function distribution along SMA fiber length in plane(x,y,0)belonging to tensional part of z=0 and z=1 at load Pl=39.5 N, T=45°C, Em=2 GPa, and w1=0.5 mm based on numerical solution and 3D FEA. Fig. 12 depicts the tip load-tip deflection response of the RVE during loading/unloading cycle with T=45°C,Em=2 GPa, and w1=0.5 mm based on numerical solution and 3D FEA. From Fig. 12, the maximal percent difference in terms of tip deflection between two methods are 4.6% at Pe=39.5 N. A nonlinear tip load-tip deflection relationship of the RVE is revealed by Fig. 12 during both loading and unloading processes.Furthermore,the RVE exhibits a superelastic property during loading–unloading cycle, which is influenced by the superelastic SMA fiber. The above-mentioned results demonstrate a good match between numerical solution and 3D FEA, thus the stand-alone numerical method is adopted to further investigate on effects on SMA property on its composite performance. Specifically, we carry out three more results as effect of temperature, SMA volume percentage,and stiffness on its composite behavior in Figs. 13–15. Fig. 12 Tip load-tip deflection response of the RVE during loading/unloading cycle with T=45°C, Em=2 GPa, and w1=0.5 mm based on numerical solution and 3D FEA. Fig.13 Effect of temperature on moment–curvature relationship at a typical cross section of the RVE with maximal moment Me=39.5 N⋅m, Em=2 GPa and w1=0.5 mm based on numerical solution. Fig. 14 Effect of SMA volume fraction on the moment–curvature relationship with maximal moment Me=39.5 N⋅m,Em=2 GPa, and T=45°C. Fig. 15 Effect of matrix’s elastic modulus on the numerical moment–curvature relationship with maximal moment Me=39.5 N⋅m, and T=45°C. Fig. 13 reveals the effect of temperature on the moment–curvature relation of a typical cross section of the RVE with maximal moment, moment at the end of loading Me= 39.5 N⋅m, Em= 2 GPa, and w1= 0.5 mm based on numerical solution. The simulation result in Fig. 13 shows that a loading/unloading cycle is performed at temperatures of 40, 50,60 °C. Fig. 13 shows a noticeable superelastic property of the RVE in given maximal moment and temperature ranges, however, it indicates a drop of curvature when temperature is increased. Specifically, under Me= 39.5 N⋅m, the curvature at T = 40, 60 °C are 132 m-1and 122 m-1, respectively. It can be explained that at higher temperature, the smaller forward transformation region occupies in the SMA fiber leading to a stiffer material property of the fiber under a same applied moment. As a result, the composite stiffness is improved with higher ambient temperature. It is noted that the change of SMA volume fraction Vs/Vcin a RVE is implemented by only changing the value of w1, but the dimensions of SMA fiber is kept unvaried. Fig. 14 demonstrates the effect of SMA volume fraction on the moment–curvature relationship with maximal moment Me= 39.5 N⋅m,Em= 2 GPa, and T =45 °C during loading/unloading cycles.Each cycle is performed at a ratio value Vs/Vcat 0.136, 0.200,0.250 and 0.300 as shown in Fig. 14. It is also observed from Fig. 14 that a linear moment–curvature relationship is obtained with the ratio Vs/Vcbeing 0.136. Whereas, under the same parameter inputs, the relationship becomes nonlinear at Vs/Vc= 0.300. Furthermore, the stiffer material response of RVE can be seen with lower SMA fiber content. Particularly,at Me= 39.5 N⋅m, the curvature at Vs/Vc= 0.136, 0.300 are 62 m-1and 267 m-1, respectively. It can be concluded from Fig. 14 that for given material properties and dimensions of composite, the RVE has an observable superelastic properties when SMA content Vs/Vc= 0.200. The effect of matrix’s elastic modulus on the moment–curvature relationship with maximal moment Me= 39.5 N⋅m,and T =45 °C during loading/unloading process is shown in Fig. 15. Like those in Figs. 12–14, a loading/unloading cycle is simulated corresponding to values of Emat 1, 2, 3, 5 GPa.It can be observed from Fig. 15 that, the superelastic effect from SMA inclusion is vanished with an increase of matrix stiffness. Fig. 15 inhibits clearly a nonlinear moment–curvature relationship at Em=1 GPa, but it is linear at higher stiffness as Em= 5 GPa. Moreover, the composite material response becomes stiffer with higher matrix elastic modulus.Indeed, Fig. 15 indicates that, curvature is 225 m-1and 53 m-1at Em= 1, 5 GPa, respectively. The Fig. 15 reveals an important fact that for the given material properties and dimension of SMA fiber, the superelastic effect from SMA becomes effective when Em< 2 GPa. A novel and elaborate semi-analytical model for superelastic SMA circular wire reinforced composite subjected to concentrated tip force was introduced. In order to study the material’s mechanical response under bending forces during loading/unloading process, an RVE was extracted to represent the entire composite. The matrix was considered within the elastic regime. The analytical bending model based on 3D ZM’s thermomechanical model and Timoshenko theory was developed for the composite, accounting for the evolution of phase transformation in the transverse and longitudinal directions of wire simultaneously during loading/unloading process. For that,the moment and shear force equations were derived in detail for each stage experienced by the RVE. The composite Simpson’s rule was adopted to numerically solve the obtained equations by the numeric solver function in commercial software MATLAB. It was found that the derivation procedure of the relationships during unloading was more challenging than that during loading, due to more complicated internal structure change of SMA material. Subsequently, the results including moment–curvature response, axial stress distribution along the vertical and longitudinal directions, martensite volume fraction, boundary function of z = 0 and z = 1 in the RVE,and tip load-tip deflection response were demonstrated. 3D FEA was carried out in parallel to validate the accuracy of the obtained results and two prediction techniques showed good agreement with each other. The study revealed a superelastic property of composite, which is based on the SMA wire.The observed superelastic property accompanies with two useful advantages of the composite involving large, recoverable deformation, and vibration damping, as well as energy dissipation due to the hysteresis loop. In addition, it was indicated that the maximal percent difference of two prediction was 4.0% in terms of curvature at Me= 0.395 N⋅m, T =45 °C,Gm= 2 GPa, and w1= 0.5 mm. Finally, in order to identify the optimal performance of the SMA reinforced composite,the effect of temperature, SMA volume fraction, and matrix stiffness on the moment–curvature response was examined by numerical solution. It was discovered that the superelastic property of the composite is enhanced with a decrement in temperature and matrix elastic modulus, and an increase in SMA volume fraction. Acknowledgement Dr. Wael Zaki would like to acknowledge the financial support of Khalifa University through research grant No. CIRA 2019-024.
2.3. Computation of deflection
3. Finite element method
4. Results and discussions
5. Conclusions
 CHINESE JOURNAL OF AERONAUTICS2021年8期
- CHINESE JOURNAL OF AERONAUTICS的其它文章
- A novel virtual material layer model for predicting natural frequencies of composite bolted joints
- Multi-layered plate finite element models with node-dependent kinematics for smart structures with piezoelectric components
- Sequential ensemble optimization based on general surrogate model prediction variance and its application on engine acceleration schedule design
- Transition prediction and sensitivity analysis for a natural laminar flow wing glove flight experiment
- Modeling on mechanical behavior and damage evolution of single-lap bolted composite interference-fit joints under thermal effects
- Experimental and numerical simulation of bird-strike performance of lattice-material-infilled curved plate
